Embed Size (px)
Citation preview
Special Session on Optical Properties of Atmospheric Aerosol ― Observation, Measurement Techniques and Model Analysis for Improving the Accuracy of Aerosol Light Absorption Determinations in Polluted Sites (I)
Aerosol and Air Quality Research, 20: 663–679, 2020 Copyright © Taiwan Association for Aerosol Research ISSN: 1680-8584 print / 2071-1409 online doi: 10.4209/aaqr.2019.06.0298 Comparison of Filter-based Absorption Measurements of Biomass Burning Aerosol and Background Aerosol at the Mt. Bachelor Observatory James R. Laing1, Daniel A. Jaffe1,2*, Arthur J. Sedlacek, III3
1University of Washington Bothell, Bothell, WA 98011, USA 2 University of Washington, Seattle, WA 98195, USA 3 Brookhaven National Laboratory, Upton, NY 11973, USA ABSTRACT
In this study we evaluate the recently upgraded aethalometer (AE33) and the newly released tricolor absorption photometer (TAP) with respect to their response to wildfire aerosol plumes during their deployment at the Mount Bachelor Observatory (MBO; 2763 m a.s.l.) in central Oregon, USA, during the summer of 2016. While both instruments use similar methodology (i.e., light extinction through an aerosol-laden filter), each has a unique set of correction schemes to address artifacts originating from filter loading, scattering from captured aerosol particles, and multiple scattering effects of the filter fibers. We also utilize a Single Particle Soot Photometer (SP2) to determine refractory black carbon (rBC) in these air masses. In addition to comparing the AE33 filter-loading correction methodology to previously published aethalometer correction schemes, we also compare the AE33 to the correction schemes used for the TAP and evaluate the degree to which the different correction factors influence the derived absorption Ångström exponents (AAE) and mass absorption cross sections (MACs). We find that while the different correction factors for either the AE33 or TAP do exert an influence on the derived MACs, AAEs exhibit the most sensitivity to the correction schemes. Our study finds that using the AE33 manufacturer’s recommended settings results in aerosol light absorption coefficients that are 3.4 to 4 times greater than the aerosol light absorption coefficients reported by the TAP. We calculated a correction factor (Cf) of 4.35 for the AE33 by normalizing the AE33 to match the TAP. The uncorrected AE33 also gives equivalent black carbon (eBC) values that are approximately 2 times the rBC measured by the SP2 instrument. We also find that biomass burning aerosols result in significant MAC enhancements, particularly at lower wavelengths, which is attributable to brown carbon (BrC).
Keywords: Aerosol scattering; Aerosol absorption; SP2; AE33; TAP; PSAP. INTRODUCTION
Aerosols play an important role in the Earth’s radiative
budget by directly scattering and absorbing solar radiation (Myhre et al., 2013). Light absorption by aerosols is dominated by carbon species emitted during the combustion of biomass or fossil fuels. While the most important light-absorbing aerosol remains black carbon (BC) (Bond et al., 2006, 2013) it is now recognized that brown carbon (BrC) is also important. These light-absorbing organic aerosols are emitted primarily in biomass burning (BB) and are distinguished by their preference to absorb at near-UV wavelengths (Kirchstetter et al., 2004; Andreae and Gelencser, 2006; Saleh et al., 2013). Given the increase in wildfire activity (Dennison et al., 2014; Abatzoglou and Williams, 2016) and the large aerosol mass that these events inject into the atmosphere, having accurate measurements of * Corresponding author. E-mail address: [email protected]
aerosol absorption by BB aerosols is crucial for improved quantification of the contribution to aerosol radiative forcing.
Measurement of light absorption using a filter-based instrument, which is the predominate method used in the field, derive the absorption coefficient, σabs, by measuring the change in light attenuation due to aerosol loading on a filter (Hansen et al., 1984; Bond et al., 1999). The raw attenuation (ATN) coefficient (σATN, Mm–1) can be thought of as the uncorrected absorption coefficient as it contains contributions from both light absorption and scattering from both the captured aerosol particles on the filter and the filter media itself. To derive the desired light absorption coefficients, σATN must be corrected for measurement artifacts unique to this class of instrumentation and include contributions from the filter itself and potential modification of aerosol optical properties due to the deposition of these particles onto the filter. These measurement corrections fall into three major classes: (1) filter-loading corrections, which correct for the accumulation of light-absorbing particles on the filter that reduce the optical path; (2) multiple light-scattering corrections, which correct incident light scattered by the filter fibers of
Laing et al., Aerosol and Air Quality Research, 20: 663–678, 2020 664
an unloaded filter; and (3) aerosol scattering corrections, which correct for the incident light scattered off of light-scattering particles loaded onto the filter (Bond et al., 1999). These artifacts limit the accuracy of these measurements to 20–30% (Springston and Sedlacek III, 2007; Bond et al., 2013). Another subtle, but important, consideration is that upon contact with the filter the aerosol particle morphology could be altered leading to further uncertainty, which is not captured by corrections currently used. Still further complications can be encountered when liquid-like organic aerosols (OA) coat the filter fibers (Subramanian et al., 2007) or interact with the probe light leading to enhanced absorption (Lack et al., 2008). Indeed, when the ratio of OA to BC is high, as is common for biomass burn events, filter-based absorption coefficients have been shown to be biased high by 50–80% (Cappa et al., 2008; Lack et al., 2008; Kondo et al., 2009). In-situ measurement of aerosol absorption instruments using photoacoustic spectroscopy (PAS) or photothermal interferometry (PTI) have less biases and lower uncertainties compared to filter-based instruments (Moosmuller et al., 2009; Bond et al., 2013), but these methods are more complex and require more care during operation.
The lower cost and minimal maintenance of filter-based instruments has made them preferred for long-term observations of aerosol light absorption. The National Oceanic and Atmospheric Administration (NOAA), the Global Atmosphere Watch (GAW) program, and the U.S. Department of Energy’s Atmospheric Radiation Measurement (ARM) program have used various filter-based instruments to measure aerosol light absorption at their long-term surface research sites since the 1990s and will continue to use these instruments into the future (Ogren et al., 2017; Andrews et al., 2019).
In this study we evaluate the response of two filter-based instruments with respect to wildfire plumes where filter-based bias in these measurements is expected to be highest: the tricolor absorption photometer (TAP, Brechtel Inc., Hayward, CA) and the recently updated aethalometer (model AE33, Magee Scientific, Berkeley, CA). The TAP measures absorption coefficients at 465, 520, and 640 nm, while the AE33 measures absorption coefficients at 370, 470, 520, 590, 660, 880, and 950 nm. Motivation for conducting absorption measurements at multiple wavelengths is that it allows for the quantification of the wavelength dependence, which can be used to distinguish between BC and BrC—the latter being light-absorbing organic aerosols. Given the likely continued and future use of the TAP and AE33, it is imperative to characterize these two instruments for a range of conditions so that absorption measurements derived from these instruments can be harmonized and compared.
Our goals for this study are: 1. Evaluate the efficacy of TAP and AE33 filter-loading
and scattering correction schemes for wildfire aerosols. 2. Examine if the derived absorption Ångström exponents
(AAEs) from the TAP and AE33 exhibit a dependence on correction methods and, if a dependence is found, evaluate the extent to which this dependence influences apportionment of BC and BrC absorption via AAE.
3. Derive and compare mass absorption cross sections
(MACs) for the TAP and AE33 using refractory black carbon (rBC) mass concentrations reported by a co-located Single Particle Soot Photometer (SP2).
METHODS Mt. Bachelor Observatory
The Mount Bachelor Observatory (MBO), located at the summit of Mt. Bachelor in central Oregon, USA (43.98°N, 121.69°W, 2764 m a.s.l.), is a mountaintop site that has been in operation since 2004 (Jaffe et al., 2005). A suite of measurements (including carbon monoxide (CO), ozone (O3), aerosol scattering coefficients, and metrological measurements) have been made continuously at the summit site since measurements began. This unique location has allowed the study of BB plumes in the free troposphere from regional and distant sources in the spring, summer, and fall (Weiss-Penzias et al., 2007; Wigder et al., 2013; Timonen et al., 2014; Baylon et al., 2015; Briggs et al., 2016; Collier et al., 2016; Zhou et al., 2017), and long-range transport of Asian pollution in the spring (Jaffe et al., 2005; Weiss-Penzias et al., 2006; Fischer et al., 2010a, b; Reidmiller et al., 2010; Ambrose et al., 2011; Timonen et al., 2013, 2014; Gratz et al., 2015; Zhang and Jaffe, 2017).
At MBO the instruments are located in a temperature-controlled room within the summit building, situated approximately 15 m below the aerosol inlet. The aerosol sample line is designed so that the last 2.5 m is located within a space that is temperature controlled at ~20°C. All measurements were downstream of a PM1 cut size impactor. When outside relative humidity (RH) is high (> 50%), the temperature difference between the outside and instrument room reduces the RH of the sample airstream. During the campaign the RH measured by the nephelometer was < 35%. The measurements discussed here range from July through September 2016.
Tricolor Absorption Photometer (TAP)
Aerosol light absorption coefficients (σabsTAP) were also measured with a 3-wavelength (λ) tricolor absorption photometer (TAP, Brechtel Inc., Hayward, CA) at wavelengths 465, 520, and 640 nm. We used quartz filters (Pallflex, E70-2075W) throughout the campaign. The TAP is the commercially available version of NOAA’s continuous light absorption photometer (CLAP) (Ogren et al., 2017). From a measurement methodology point of view, the CLAP and TAP are similar to the Particle Soot Absorption Photometer (PSAP), except for the feature of being able to sample sequentially through eight spots on a single filter thereby allowing these two instruments to operate 8x longer before requiring a technician to replace the filter media. A detailed description of the CLAP is provided in Ogren et al. (2017).
For this study, we set the transmittance threshold whereupon the TAP starts collecting sample on a new spot at 0.7 to minimize loading effects and complications arising from the departure from signal linearity—this translates to an ATN of 36. The reported TAP σabs were flow and spot size corrected. One distinguishing hardware attribute between the CLAP
Laing et al., Aerosol and Air Quality Research, 20: 663–678, 2020 665
and the TAP is that the latter uses O-rings to create a seal between the filter holder and the filter itself. Securing the filter this way leads to more ambiguous edges in the actual spot area and impacts the derived absorption cross section. Due to the ambiguity in the edge of the filter spot we used the manufacturer’s recommended value of (30.721 mm2) and estimate the uncertainty in spot area to be ~20%.
The two correction methods for the TAP used in this study come from (1) Ogren (2010), which updated the Bond et al. (1999) correction, (2) and Virkkula et al. (2005), which was updated by Virkkula (2010). Both correction algorithms were developed empirically and correct for aerosol loading and apparent absorption from light-scattering particles. The Bond et al. (1999) correction was developed for the 1 λ PSAP (567 nm) and updated for the 3 λ PSAP in Ogren (2010), whereas the Virkkula (2010) correction was developed for the 3λ. The details for these corrections are in Table S1. We did not evaluate the Müller correction method (Müller et al., 2014), which uses a two-stream radiative model, but is complicated to implement.
Aethalometer (AE33)
A newly upgraded 7-wavelength aethalometer model AE33 (Magee Scientific, Berkeley, CA) was used to measure light absorption coefficients (σabsAE) at wavelengths of 370, 470, 520, 590, 660, 880, and 950 nm (Drinovec et al., 2015). Like with the TAP, we set the criteria for using a new filter spot at a light ATN threshold of 120, which translates to a transmittance of 0.36. This threshold is very low and puts the optical measurement in the non-linear condition, so in post-processing we removed data with transmittance < 0.5. As mentioned above, the AE33 is an upgraded model of the aethalometer in that offers a real-time aerosol-loading compensation algorithm using DualSpot™ technology (Drinovec et al., 2015). Specifically, the AE33 uses two spot measurements with different flow rates and, thus, different aerosol-loading rates. By using these two measurements, a reduction in the bias on aerosol loading by filter loading can be realized. This allows for the calculation of real-time filter-loading correction. Henceforth, this dual-spot filter-loading correction, kD, is referred to as the Drinovec correction.
The AE33 outputs equivalent black carbon (eBC) mass concentrations. Black carbon is operationally defined and Petzold et al. (2013) suggested “BC” concentrations derived from absorption measurements should be called equivalent black carbon. Absorption coefficients (σabsAE33) were “back-calculated” from the reported eBC values using the AE33 mass absorption cross sections (MACAE33) used internally by the instrument. σabsAE33-Drinovec = eBC × MACAE33 (1) the MACAE33 values are 18.47, 14.54, 13.14, 11.58, 10.35, 7.77, and 7.19 m2 g–1 for 370, 470, 520, 590, 660, 880, and 950 nm, respectively (Drinovec et al., 2015). Attenuation coefficients (σATN) were obtained by removing the Drinovec filter-loading correction (1 – kD × ATN) and the multiple scattering correction, Cref (which were automatically applied to the aethalometer output).
σATN = σabsAE33-Drinovec × (1 – kD × ATN) × Cref (2) the σATN determined in Eq. (2) is used as the base to explore other filter-loading corrections.
Two differences between the AE33 and previous versions of the aethalometer (e.g., AE31) are the filter media and MAC values used internally to calculate eBC mass concentrations. The upgraded AE33 uses a tetrafluoroethylene (TFE)-coated glass fiber filter tape, whereas the older version aethalometers use a quartz fiber filter tape. The TFE-coated glass fiber filter tape is less sensitive to air sample relative humidity. The aethalometer MACs are empirically derived and the AE31 MAC values are more than twice as large as the AE33 MAC values. This means that although the AE31 and AE33 eBC mass concentrations show good correlation (slopes from 0.9 to 1.19) (Drinovec et al., 2015; Rajesh and Ramachandran, 2018), the derived σabs reported by the AE31 are expected to be much higher.
There are various post-processing correction schemes for aethalometers to address for filter-loading, scattering effects of loaded aerosol, and multiple scattering effects of the filter (Weingartner et al., 2003; Arnott et al., 2005; Schmid et al., 2006; Virkkula et al., 2007; Collaud Coen et al., 2010). Some studies have combined parts of different correction schemes together, making direct comparisons difficult (Yang et al., 2009; Segura et al., 2014; Ran et al., 2016; Segura et al., 2016; Wang et al., 2017).
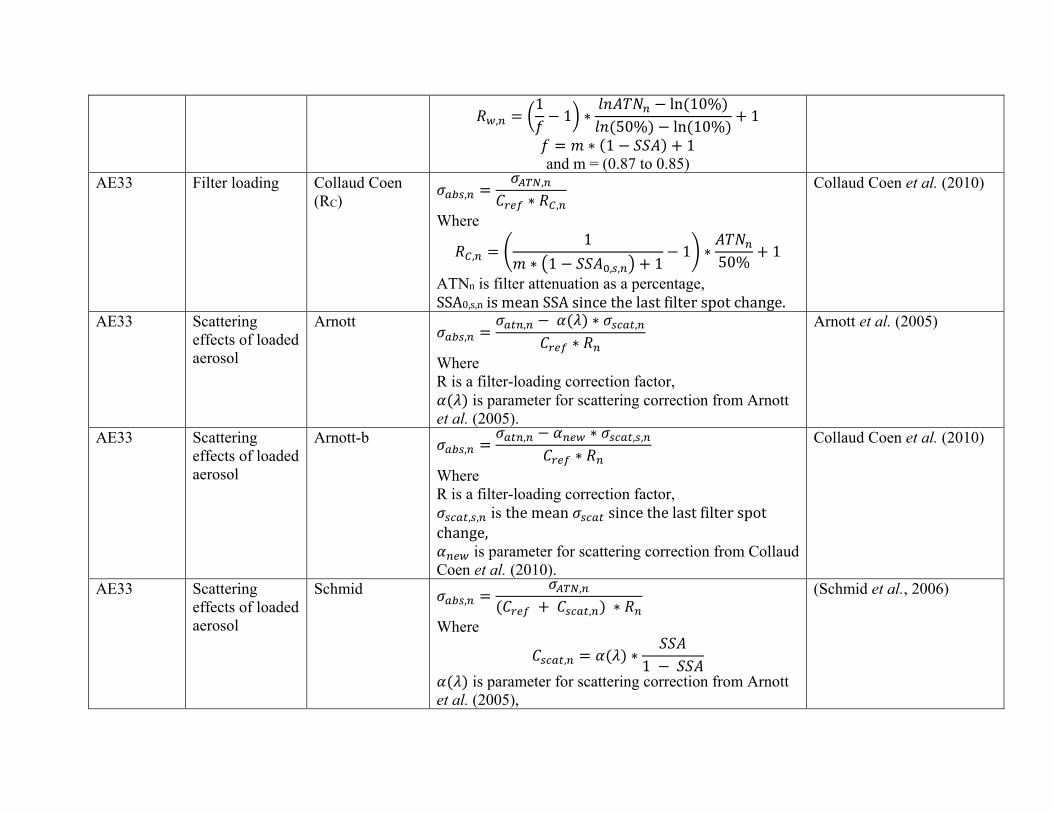
Collaud Coen et al. (2010) evaluated AE31 correction algorithms and proposed a new correction algorithm based on data collected from four European sites with several types of aerosols (free tropospheric, urban, maritime, and rural background). They included four filter-loading corrections (Arnott, Virkkula, Weingartner, and Collaud Coen) and two scattering corrections (Arnott and Schmid). They also presented a new scattering correction parameterization that essentially creates two new scattering corrections, using the same Arnott and Schmid equations but using different parameter values. Saturno et al. (2017) differentiates between these as the “Arnott” correction and the “Collaud Coen’s Arnott-like” correction. In our study we refer to the Arnott and Schmid scattering corrections using Collaud Coen’s nomenclature as Arnott-b and Schmid-b, respectively.
In this paper we will evaluate a subset of the filter-loading and scattering corrections detailed in Collaud Coen et al. (2010) in comparison with the dual-spot Drinovec correction for aerosols produced in biomass burning. We do not implement the Arnott filter-loading correction (Arnott et al., 2005) as it was deemed in Collaud Coen et al. (2010) to produce a significant number of outliers and exhibited the highest standard deviation when compared to Multiangle Absorption Photometer (MAAP) data. In summary, the filter-loading corrections evaluated are the Drinovec, Virkkula, Weingartner, and Collaud Coen correction algorithms. We also examine the scattering corrections to the Drinovec filter-loading correction so as to evaluate their effect. The scattering corrections evaluated are the Arnott, Schmid, Arnott-b, and Schmid-b scattering corrections. The details for the corrections are in Table S1.
Laing et al., Aerosol and Air Quality Research, 20: 663–678, 2020 666
Single Particle Soot Photometer (SP2) Refractory BC (rBC) mass concentration was measured
using a Single Particle Soot Photometer (SP2; Droplet Measurement Technologies, Longmont, CO). To differentiate from other BC concentrations, Petzold et al. (2013) suggested “BC” concentrations from laser-induced incandescence report their concentrations as refractory black carbon. Detailed SP2 operating principles and analysis procedures have been previously described and thus will only be highlighted here (Stephens et al., 2003; Schwarz et al., 2006; Moteki and Kondo, 2007; Schwarz et al., 2008b; Moteki and Kondo, 2010). In brief, the SP2 measures the time-dependent scattering and incandescence signals generated by individual BC-containing particles as they travel through a continuous-wave laser beam operating at 1064 nm. If the interrogated particle contains a BC component, some of the laser energy will be absorbed until the temperature of the BC component is raised to the point of incandescence. The individual particle incandescence signals are converted to particle mass (obtained via calibration) that can then be converted to an equivalent diameter to yield a BC-specific size/mass distribution. In keeping with the nomenclature advocated by the SP2 community, we henceforth refer to the incandescence BC component as refractory black carbon (rBC). During the deployment at MBO, the SP2 detected incandescence signals from particles with a mass equivalent diameter in the range of 60–400 nm. We calibrated the SP2 scattering channel using size-selected polystyrene latex spheres (PSL) and the incandescence channel using fullerene soot (Alfa Aesar; stock no. 40971; lot no. L18U002) prior to and after the campaign. Uncertainties in BC mass concentration are estimated to be ± 30%.
Additional Measurements and Calculations
Aerosol light-scattering coefficients (σscat) were measured using an integrating nephelometer (model 3563, TSI, Inc., Shoreview, MN) at wavelengths 450, 550, and 700 nm. The σscat values were corrected for drift and scattering truncation according to the scheme laid out by Anderson and Ogren (1998). Dry particle aerosol number size distribution was measured with a Scanning Mobility Particle Sizer (SMPS; model 3938, TSI, Inc., Shoreview, MN). Details regarding calibrations and corrections are available in Laing et al. (2016).
Comparison of the derived AAE values for the TAP and AE33 were calculated using σabs measured at wavelengths () 470 and 660 nm using Eq. (3). Single scattering albedo (SSA) values used throughout the study were calculated with Eq. (4) at 520 nm.
1 2
1 2
loglogabs absAAE
(3)
scatTAP
scat absTAP
SSA
(4)
The TAP measures aerosol light absorption at different
wavelengths than the AE33. Therefore, to facilitate direct comparison between the two instruments, the derived absorption coefficients from the TAP (σabsTAP) were interpolated from 465 nm to 470 nm, and from 640 nm to 660 nm, the wavelengths of the AE33, using the equation below. σabs (λ1) = σabs (λ2)[λ2 ⁄ λ1]AAE (5)
The TAP wavelength-adjusted σabs at 470 nm was derived
from the TAP σabs at its native wavelength of 465 nm using AAE values calculated for the 465–520 nm wavelength pair. Similarly, the TAP wavelength-adjusted σabs at 660 nm used the σabs at 640 nm and AAE values for the 520–640 nm pair. These AAE values are just used to interpolate the σabs, and not used throughout the rest of the manuscript.
All particle measurements were corrected to standard temperature and pressure (STP; T = 273.15, P = 101.325 kPa). RESULTS AND DISCUSSION
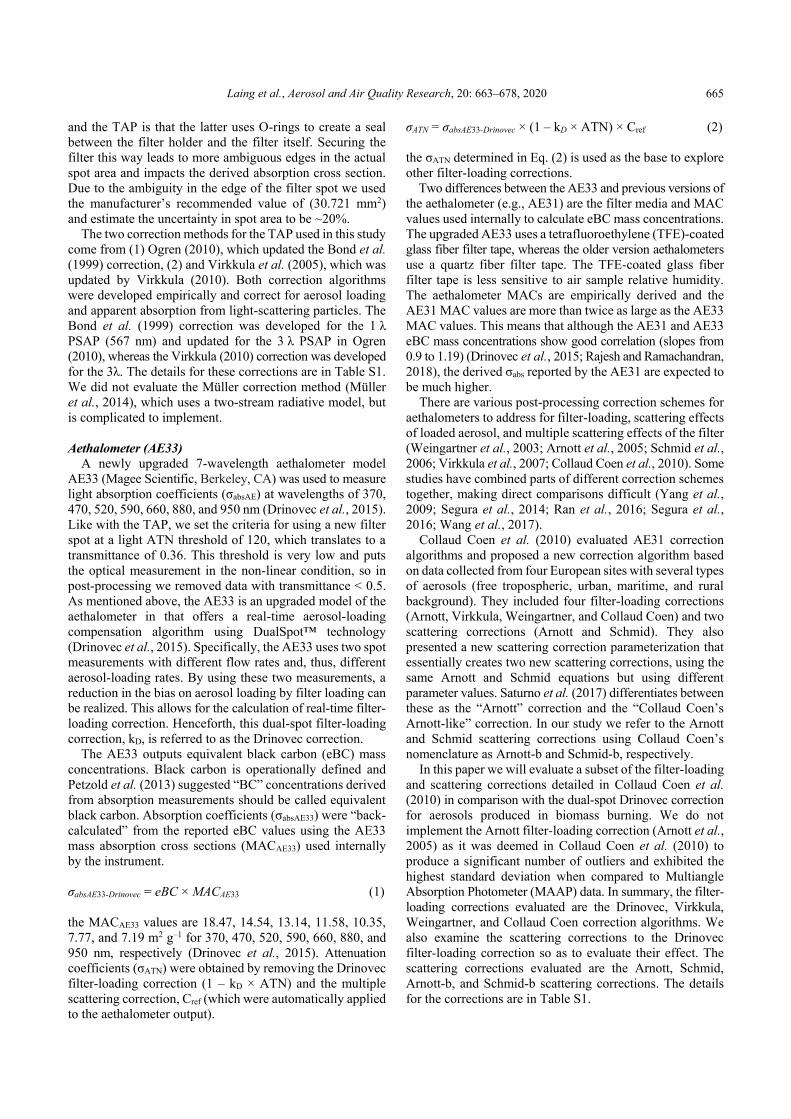
The campaign was separated into BB-influenced periods
and nonBB periods. During the campaign the MBO site was engulfed by three days of wildfire smoke (Fig. 1; 8/29/2016 to 9/1/2016) from the Gap Fire, in northern California. Transport time from the fire origin to MBO is estimated to range from 10 to 15 hours using HYSPLIT back-trajectories.
BB periods were defined as any 5-min average with aerosol scattering at (550 nm) > 15 Mm–1 during the Gap Fire. During the BB periods the Δσscat/ΔCO was 0.84 (R2 = 0.90), very consistent with previous BB events at MBO (Laing et al., 2016). All other periods are assumed to be nonBB periods and thus represent regional background air masses. Using monthly water vapor criterion developed by (Zhang and Jaffe, 2017) to distinguish between free troposphere (FT) and boundary layer–influenced (BLI) air masses, we find that 66% of the nonBB period were FT and 34% were BLI. Intra-comparison of Filter-based Absorption Correction Methods TAP Corrections
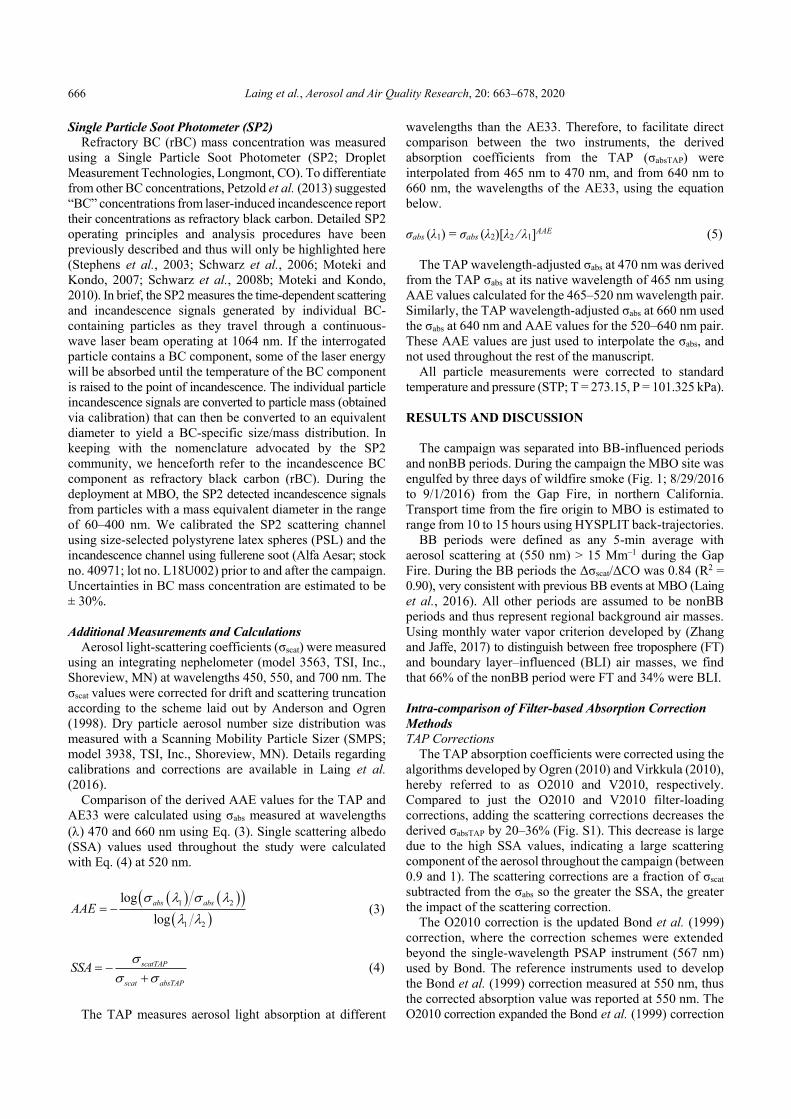
The TAP absorption coefficients were corrected using the algorithms developed by Ogren (2010) and Virkkula (2010), hereby referred to as O2010 and V2010, respectively. Compared to just the O2010 and V2010 filter-loading corrections, adding the scattering corrections decreases the derived σabsTAP by 20–36% (Fig. S1). This decrease is large due to the high SSA values, indicating a large scattering component of the aerosol throughout the campaign (between 0.9 and 1). The scattering corrections are a fraction of σscat subtracted from the σabs so the greater the SSA, the greater the impact of the scattering correction.
The O2010 correction is the updated Bond et al. (1999) correction, where the correction schemes were extended beyond the single-wavelength PSAP instrument (567 nm) used by Bond. The reference instruments used to develop the Bond et al. (1999) correction measured at 550 nm, thus the corrected absorption value was reported at 550 nm. The O2010 correction expanded the Bond et al. (1999) correction
Laing et al., Aerosol and Air Quality Research, 20: 663–678, 2020 667
Fig. 1. Time series of 5-min averaged data during the 2016 summer campaign. The designated BB period is shaded.
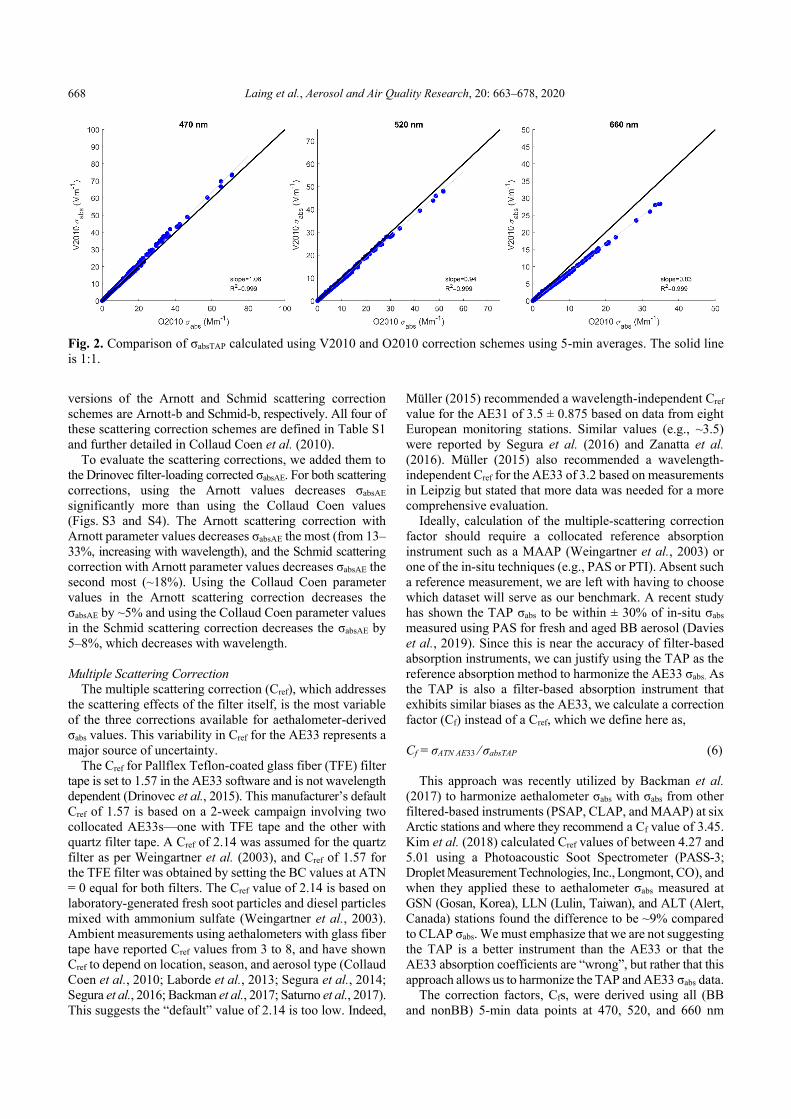
to remove the implicit adjustment to 550 nm and provide corrections for three-wavelength PSAPs. The O2010 correction parameters are the same for every wavelength, whereas the V2010 corrections were developed for the three-wavelength PSAP and thus have wavelength-specific correction parameters (Table S1). One direct consequence of this is that the correction schemes for V2010 and O2010 σabsTAP are inconsistent across wavelengths (Fig. 2). For example, at 470 nm the slope between V2010 and O2010 is 1.06, whereas at 660 nm the slope is 0.83. As discussed later in "Comparison of AAEs" section, these differences have strong implications for derived AAE values and the subsequent compositional interpretation of the sampled aerosol when using AAE values.
AE33 Corrections Filter-loading Corrections
In this section we first compare the performance of the Drinovec filter-loading correction with previously published aethalometer filter-loading corrections and then extend this evaluation to assess the impact of scattering corrections with the Drinovec filter-loading correction. To this end we evaluated three filter-loading corrections (Virkkula (RV) (Virkkula et al., 2007), Weingartner (RW) (Weingartner et al., 2003), and Collaud Coen (RC) corrections (Collaud Coen et al., 2010)) against the new dual-spot Drinovec correction (RD). These correction schemes are defined in Table S1.
The Virkkula correction employs a parameter (ki) that aligns the last measurement on a filter spot with the first measurement on the next filter spot. Determining the Virkkula ki values proved challenging due to the high variability of absorption coefficients between filter changes, especially during the biomass burning periods. The ki values were calculated as described in Virkkula et al. (2007), but minimum and maximum values of –0.005 and 0.010 were set such that calculated ki values that fell outside theses limits were set to
either the minimum or maximum allowable threshold value. The chosen minimum and maximum limits span the range observed in Virkkula et al. (2007). Most of the filter spots end up with a Virkkula ki value of 0.010, which is a typical value for wood smoke (Allen et al., 2011).
The derived Virkkula σabsAE have similar values to the Drinovec σabsAE across all wavelengths with slopes increasing with wavelength from 0.96 at 370 nm to 1.05 at 950 nm (Fig. S2). The Weingartner σabsAE and Collaud Coen σabsAE agree well with Drinovec σabsAE at high wavelengths, but the slope decreases with decreasing wavelength. This is likely due to the wavelength dependence of the Drinovec correction factor.
The Drinovec correction (RD) shows a clear wavelength dependence. This wavelength dependence was observed for the Virkkula correction (RV) when the Virkkula ki values are positive. Due to high aerosol SSA (0.9–1) throughout the campaign, the Weingartner (RW) and Collaud Coen correction factors (RC) stayed near unity at all wavelengths. For both Weingartner and Collaud Coen, as SSA approaches 1, RW and RC approach 1. The wavelength dependence of the derived AAEs on the correction schemes will be discussed in "Comparison of AAEs" section. Scattering Corrections
We evaluated four scattering corrections, (1) Arnott (Arnott et al., 2005), (2) Schmid (Schmid et al., 2006), (3) Arnott-b, and (4) Schmid-b (Collaud Coen et al., 2010). The Arnott and Schmid correction schemes use scattering correction parameters α(λ) as defined in Arnott et al. (2005). Collaud Coen et al. (2010) updated the Arnott and Schmid scattering correction schemes by creating new parameter values α(λ); and by using the mean σabsAE and SSA since the last filter spot change instead of the σabsAE and SSA measured simultaneously at the time of the absorption measurement. The updated
Laing et al., Aerosol and Air Quality Research, 20: 663–678, 2020 668
Fig. 2. Comparison of σabsTAP calculated using V2010 and O2010 correction schemes using 5-min averages. The solid line is 1:1. versions of the Arnott and Schmid scattering correction schemes are Arnott-b and Schmid-b, respectively. All four of these scattering correction schemes are defined in Table S1 and further detailed in Collaud Coen et al. (2010).
To evaluate the scattering corrections, we added them to the Drinovec filter-loading corrected σabsAE. For both scattering corrections, using the Arnott values decreases σabsAE significantly more than using the Collaud Coen values (Figs. S3 and S4). The Arnott scattering correction with Arnott parameter values decreases σabsAE the most (from 13–33%, increasing with wavelength), and the Schmid scattering correction with Arnott parameter values decreases σabsAE the second most (~18%). Using the Collaud Coen parameter values in the Arnott scattering correction decreases the σabsAE by ~5% and using the Collaud Coen parameter values in the Schmid scattering correction decreases the σabsAE by 5–8%, which decreases with wavelength.
Multiple Scattering Correction
The multiple scattering correction (Cref), which addresses the scattering effects of the filter itself, is the most variable of the three corrections available for aethalometer-derived σabs values. This variability in Cref for the AE33 represents a major source of uncertainty.
The Cref for Pallflex Teflon-coated glass fiber (TFE) filter tape is set to 1.57 in the AE33 software and is not wavelength dependent (Drinovec et al., 2015). This manufacturer’s default Cref of 1.57 is based on a 2-week campaign involving two collocated AE33s—one with TFE tape and the other with quartz filter tape. A Cref of 2.14 was assumed for the quartz filter as per Weingartner et al. (2003), and Cref of 1.57 for the TFE filter was obtained by setting the BC values at ATN = 0 equal for both filters. The Cref value of 2.14 is based on laboratory-generated fresh soot particles and diesel particles mixed with ammonium sulfate (Weingartner et al., 2003). Ambient measurements using aethalometers with glass fiber tape have reported Cref values from 3 to 8, and have shown Cref to depend on location, season, and aerosol type (Collaud Coen et al., 2010; Laborde et al., 2013; Segura et al., 2014; Segura et al., 2016; Backman et al., 2017; Saturno et al., 2017). This suggests the “default” value of 2.14 is too low. Indeed,
Müller (2015) recommended a wavelength-independent Cref value for the AE31 of 3.5 ± 0.875 based on data from eight European monitoring stations. Similar values (e.g., ~3.5) were reported by Segura et al. (2016) and Zanatta et al. (2016). Müller (2015) also recommended a wavelength-independent Cref for the AE33 of 3.2 based on measurements in Leipzig but stated that more data was needed for a more comprehensive evaluation.
Ideally, calculation of the multiple-scattering correction factor should require a collocated reference absorption instrument such as a MAAP (Weingartner et al., 2003) or one of the in-situ techniques (e.g., PAS or PTI). Absent such a reference measurement, we are left with having to choose which dataset will serve as our benchmark. A recent study has shown the TAP σabs to be within ± 30% of in-situ σabs measured using PAS for fresh and aged BB aerosol (Davies et al., 2019). Since this is near the accuracy of filter-based absorption instruments, we can justify using the TAP as the reference absorption method to harmonize the AE33 σabs. As the TAP is also a filter-based absorption instrument that exhibits similar biases as the AE33, we calculate a correction factor (Cf) instead of a Cref, which we define here as, Cf = σATN AE33 ⁄ σabsTAP (6)
This approach was recently utilized by Backman et al. (2017) to harmonize aethalometer σabs with σabs from other filtered-based instruments (PSAP, CLAP, and MAAP) at six Arctic stations and where they recommend a Cf value of 3.45. Kim et al. (2018) calculated Cref values of between 4.27 and 5.01 using a Photoacoustic Soot Spectrometer (PASS-3; Droplet Measurement Technologies, Inc., Longmont, CO), and when they applied these to aethalometer σabs measured at GSN (Gosan, Korea), LLN (Lulin, Taiwan), and ALT (Alert, Canada) stations found the difference to be ~9% compared to CLAP σabs. We must emphasize that we are not suggesting the TAP is a better instrument than the AE33 or that the AE33 absorption coefficients are “wrong”, but rather that this approach allows us to harmonize the TAP and AE33 σabs data.
The correction factors, Cfs, were derived using all (BB and nonBB) 5-min data points at 470, 520, and 660 nm
Laing et al., Aerosol and Air Quality Research, 20: 663–678, 2020 669
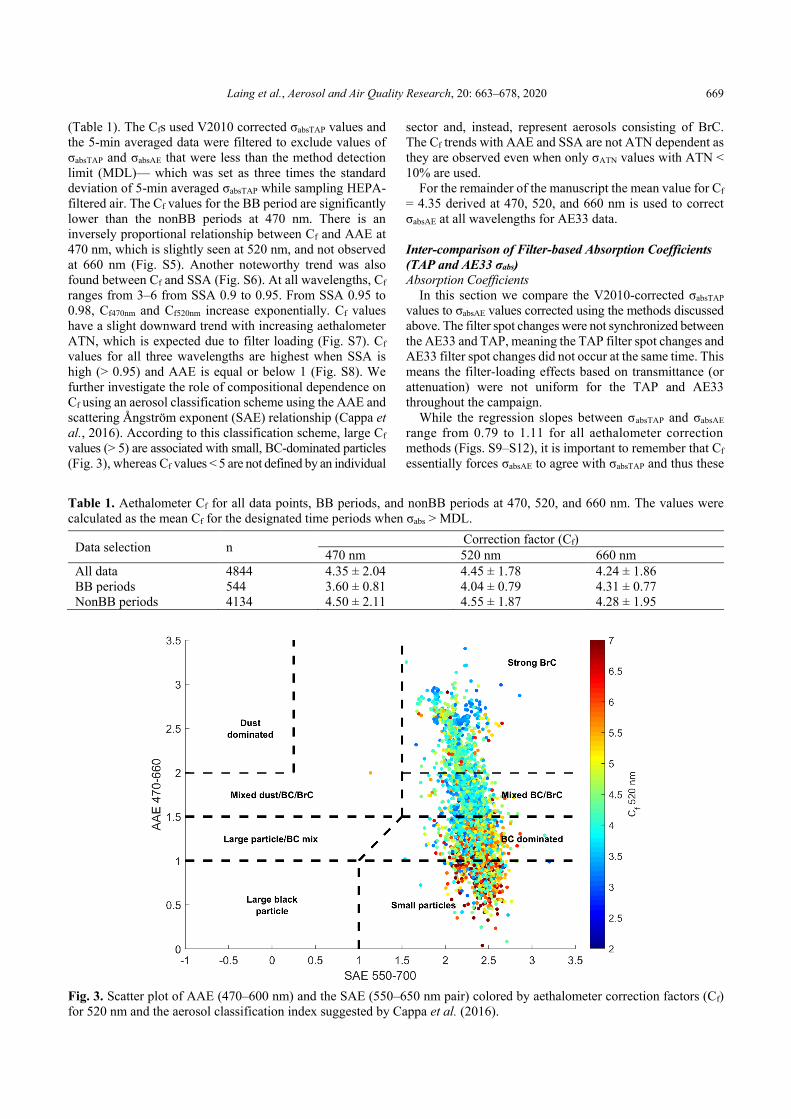
(Table 1). The Cfs used V2010 corrected σabsTAP values and the 5-min averaged data were filtered to exclude values of σabsTAP and σabsAE that were less than the method detection limit (MDL)— which was set as three times the standard deviation of 5-min averaged σabsTAP while sampling HEPA-filtered air. The Cf values for the BB period are significantly lower than the nonBB periods at 470 nm. There is an inversely proportional relationship between Cf and AAE at 470 nm, which is slightly seen at 520 nm, and not observed at 660 nm (Fig. S5). Another noteworthy trend was also found between Cf and SSA (Fig. S6). At all wavelengths, Cf ranges from 3–6 from SSA 0.9 to 0.95. From SSA 0.95 to 0.98, Cf470nm and Cf520nm increase exponentially. Cf values have a slight downward trend with increasing aethalometer ATN, which is expected due to filter loading (Fig. S7). Cf values for all three wavelengths are highest when SSA is high (> 0.95) and AAE is equal or below 1 (Fig. S8). We further investigate the role of compositional dependence on Cf using an aerosol classification scheme using the AAE and scattering Ångström exponent (SAE) relationship (Cappa et al., 2016). According to this classification scheme, large Cf values (> 5) are associated with small, BC-dominated particles (Fig. 3), whereas Cf values < 5 are not defined by an individual
sector and, instead, represent aerosols consisting of BrC. The Cf trends with AAE and SSA are not ATN dependent as they are observed even when only σATN values with ATN < 10% are used.
For the remainder of the manuscript the mean value for Cf = 4.35 derived at 470, 520, and 660 nm is used to correct σabsAE at all wavelengths for AE33 data. Inter-comparison of Filter-based Absorption Coefficients (TAP and AE33 σabs) Absorption Coefficients
In this section we compare the V2010-corrected σabsTAP values to σabsAE values corrected using the methods discussed above. The filter spot changes were not synchronized between the AE33 and TAP, meaning the TAP filter spot changes and AE33 filter spot changes did not occur at the same time. This means the filter-loading effects based on transmittance (or attenuation) were not uniform for the TAP and AE33 throughout the campaign.
While the regression slopes between σabsTAP and σabsAE range from 0.79 to 1.11 for all aethalometer correction methods (Figs. S9–S12), it is important to remember that Cf essentially forces σabsAE to agree with σabsTAP and thus these
Table 1. Aethalometer Cf for all data points, BB periods, and nonBB periods at 470, 520, and 660 nm. The values were calculated as the mean Cf for the designated time periods when σabs > MDL.
Data selection n Correction factor (Cf) 470 nm 520 nm 660 nm
All data 4844 4.35 ± 2.04 4.45 ± 1.78 4.24 ± 1.86 BB periods 544 3.60 ± 0.81 4.04 ± 0.79 4.31 ± 0.77 NonBB periods 4134 4.50 ± 2.11 4.55 ± 1.87 4.28 ± 1.95
Fig. 3. Scatter plot of AAE (470–600 nm) and the SAE (550–650 nm pair) colored by aethalometer correction factors (Cf) for 520 nm and the aerosol classification index suggested by Cappa et al. (2016).
Laing et al., Aerosol and Air Quality Research, 20: 663–678, 2020 670
slopes cannot be taken as an indicator of which correction method is best. Using all 5-min averages, the reduced major axis (RMA) regression fit between σatnAE and σabsTAP was similar for all aethalometer correction methods (R2 ranged from 0.957 to 0.984; Figs. S9–S12).
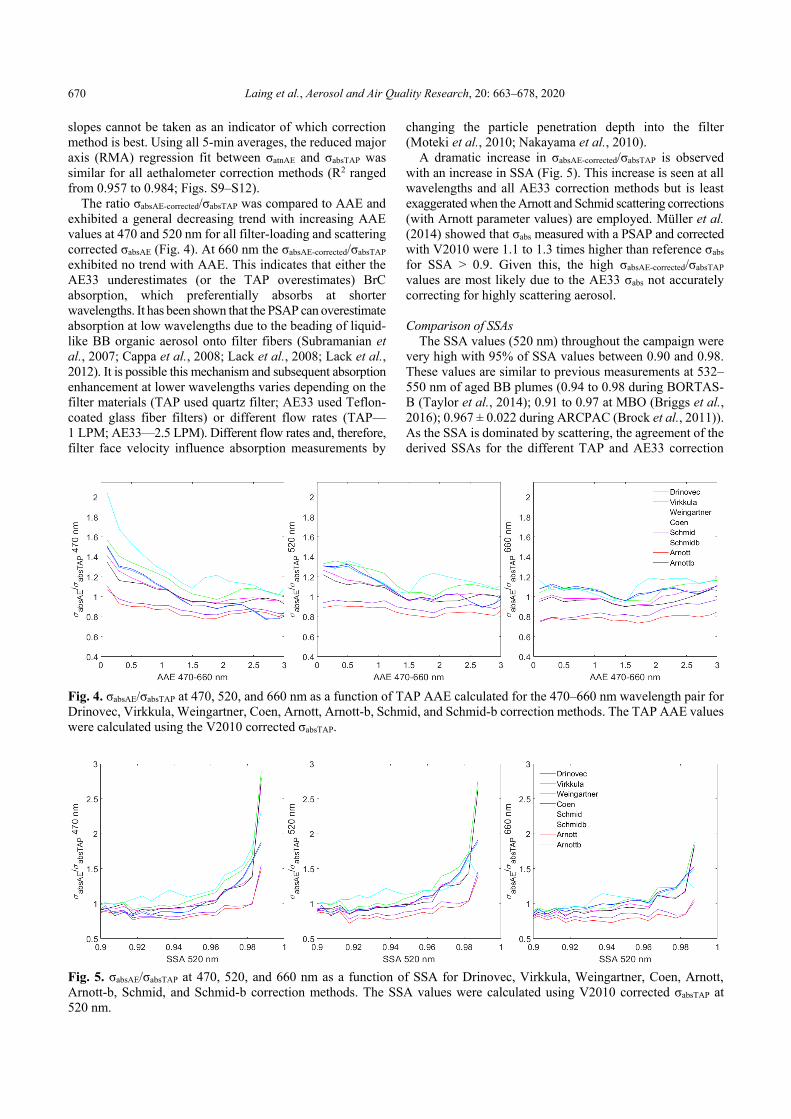
The ratio σabsAE-corrected/σabsTAP was compared to AAE and exhibited a general decreasing trend with increasing AAE values at 470 and 520 nm for all filter-loading and scattering corrected σabsAE (Fig. 4). At 660 nm the σabsAE-corrected/σabsTAP exhibited no trend with AAE. This indicates that either the AE33 underestimates (or the TAP overestimates) BrC absorption, which preferentially absorbs at shorter wavelengths. It has been shown that the PSAP can overestimate absorption at low wavelengths due to the beading of liquid-like BB organic aerosol onto filter fibers (Subramanian et al., 2007; Cappa et al., 2008; Lack et al., 2008; Lack et al., 2012). It is possible this mechanism and subsequent absorption enhancement at lower wavelengths varies depending on the filter materials (TAP used quartz filter; AE33 used Teflon-coated glass fiber filters) or different flow rates (TAP—1 LPM; AE33—2.5 LPM). Different flow rates and, therefore, filter face velocity influence absorption measurements by
changing the particle penetration depth into the filter (Moteki et al., 2010; Nakayama et al., 2010).
A dramatic increase in σabsAE-corrected/σabsTAP is observed with an increase in SSA (Fig. 5). This increase is seen at all wavelengths and all AE33 correction methods but is least exaggerated when the Arnott and Schmid scattering corrections (with Arnott parameter values) are employed. Müller et al. (2014) showed that σabs measured with a PSAP and corrected with V2010 were 1.1 to 1.3 times higher than reference σabs for SSA > 0.9. Given this, the high σabsAE-corrected/σabsTAP values are most likely due to the AE33 σabs not accurately correcting for highly scattering aerosol. Comparison of SSAs
The SSA values (520 nm) throughout the campaign were very high with 95% of SSA values between 0.90 and 0.98. These values are similar to previous measurements at 532–550 nm of aged BB plumes (0.94 to 0.98 during BORTAS-B (Taylor et al., 2014); 0.91 to 0.97 at MBO (Briggs et al., 2016); 0.967 ± 0.022 during ARCPAC (Brock et al., 2011)). As the SSA is dominated by scattering, the agreement of the derived SSAs for the different TAP and AE33 correction
Fig. 4. σabsAE/σabsTAP at 470, 520, and 660 nm as a function of TAP AAE calculated for the 470–660 nm wavelength pair for Drinovec, Virkkula, Weingartner, Coen, Arnott, Arnott-b, Schmid, and Schmid-b correction methods. The TAP AAE values were calculated using the V2010 corrected σabsTAP.
Fig. 5. σabsAE/σabsTAP at 470, 520, and 660 nm as a function of SSA for Drinovec, Virkkula, Weingartner, Coen, Arnott, Arnott-b, Schmid, and Schmid-b correction methods. The SSA values were calculated using V2010 corrected σabsTAP at 520 nm.
Laing et al., Aerosol and Air Quality Research, 20: 663–678, 2020 671
methods is not surprising as light absorption is relatively modest. The campaign median SSA values for all TAP and AE33 correction methods ranged from 0.942 to 0.955 (Table S2). Comparison of AAEs
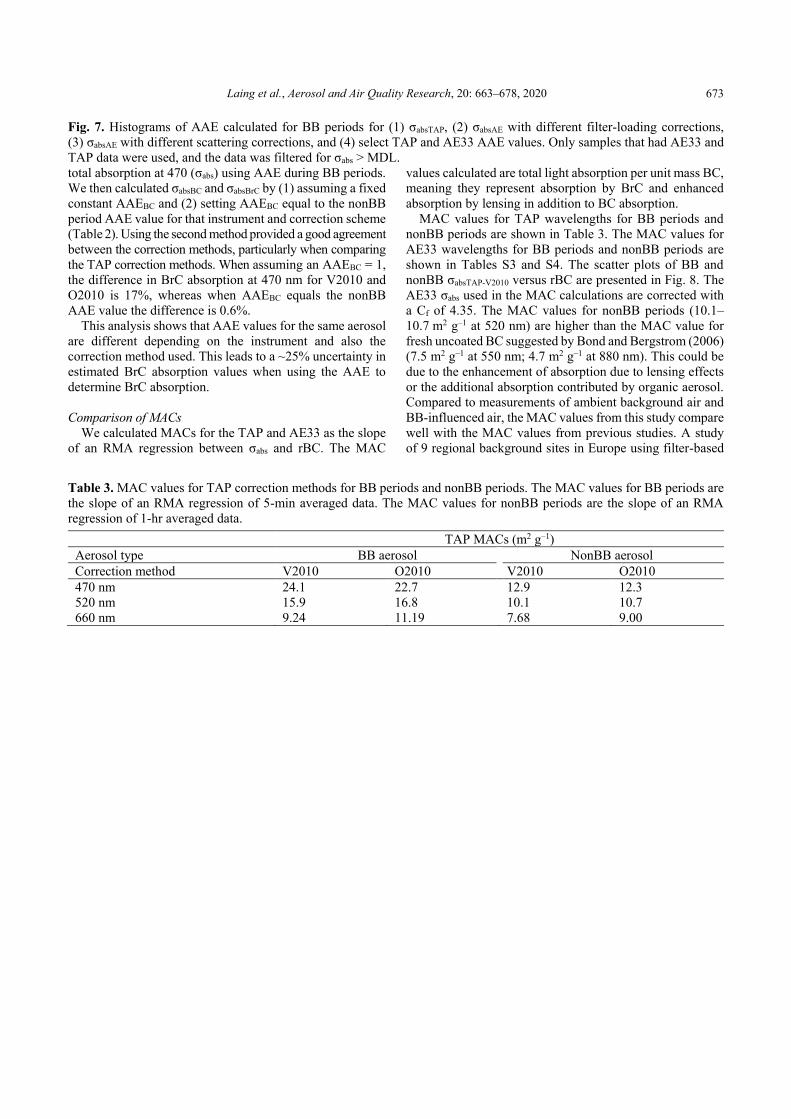
Eq. (3) was used to calculate AAE values for the 470 nm and 660 nm wavelength pair (Table 2). Mean AAE values were calculated for all data, BB periods, and nonBB periods with the constraint that the AAE was calculated only when σabs was greater than the MDL. Lack and Langridge (2013) determined that AAEBC is 1.1 ± 0.3 based on various field measurements of fossil fuel burning and urban pollution, e.g., nonBB. The mean nonBB AAE value for TAP V2010 (AAETAP-V2010: 1.31) is within this range, whereas the TAP O2010-derived value is much lower (AAETAP-O2010: 0.62). The AE33 Weingartner and Collaud Coen nonBB AAEAE33 values (1.14 and 1.13, respectively) are very close to 1.1. In contrast, the nonBB AAEAE33 for the Virkkula (1.74) and Drinovec (1.52) are much larger than 1.1. Histograms of the AAE values calculated for the AE33 and TAP for nonBB periods and BB periods are shown in Figs. 6 and 7, respectively.
The AAE values for V2010 corrected σabs are systematically higher than O2010 corrected σabs. The mean AAETAP-V2010 for all data, BB periods, and nonBB periods are all larger than AAETAP-O2010 by ~0.7. A regression between AAETAP-V2010 and AAETAP-O2010 shows a slope of 0.94 with an intercept of 0.76 (R2 = 0.96). Backman et al. (2014) reported a similar observation, reporting that their derived AAETAP-V2010 were higher than AAETAP-O2010 by 0.57 on average for measurements on the South African Highveld, where the dominant emission source is fossil fuel burning. Backman et al. (2014) further showed that derived AAEs exhibited a pronounced dependence on the scattering wavelength of σscat (i.e., SAE). Particle size is an important driver of the scattering wavelength dependence. They found that larger SAE values increase the difference between AAETAP-V2010 and AAETAP-O2010, thereby hinting at a wavelength-dependent influence of the scattering correction portion of V2010 and O2010, respectively. During our campaign the majority of the SAE values were between 2.25
and 3, and the campaign median was 2.65. This steady SAE value translates to constant scattering corrections, which then helps explain the near constant absolute difference we observe between AAETAP-V2010 and AAETAP-O2010. Davies et al. (2019) also found V2010 AAEs to be higher than O2010 AAEs, but the difference was dependent on aerosol type. They found for V2010 AAEs to be higher than O2010 AAEs for urban emissions and aged BB by values of 0.38 and 0.33, respectively, but for fresh BB V2010 AAEs were higher than O2010 AAEs by a value of 0.77.
AAE values are commonly used to apportion absorption between BC and BrC by assuming BC has an AAE typically between 0.9 and 1.1 and that at higher wavelengths the absorption contribution by BrC becomes more dominate (Clarke et al., 2007; Gyawali et al., 2009; Yang et al., 2009; Liu et al., 2015). These assumptions are explicitly written in Eqs. (7) and (8):
660600
BCAAE
absBC abs
(7)
σabsBrC (λ) = σabs (λ) – σabsBC (λ) (8)
Despite the large uncertainties associated with this approach (Lack and Langridge, 2013), multiple studies have found that it compares well with other methods of apportioning BC and BrC absorption (Sandradewi et al., 2008; Favez et al., 2010; Gianini et al., 2013; Briggs and Long, 2016). One of the largest uncertainties is the choice of value to use for AAEBC. As previously mentioned, Lack and Langridge (2013) determined that ambient AAEBC to range from 0.8 to 1.4. In addition to the range of real AAEBC, we have shown that AAE of ambient BC is operationally defined and correction specific. We used Eqs. (7) and (8) to estimate the percentage of absorption by BC (σabsBC/σabs) and BrC (σabsBrC/σabs) of BB periods at 470 nm for all correction schemes in Table 2. We assume only absorption by BC at 660 nm and calculate
Table 2. Mean AAE values for TAP and AE33 correction methods. Data used to calculate AAE was filtered to include only σabs > MDL.
Instrument Correction scheme
AAE 470–660 nm BrC absorption % at 470 nm assuming AAEBC = 1
BrC absorption % at 470 nm assuming AAEBC = AEnonBB All data BB data NonBB data
TAP V2010 1.79 ± 0.70 2.47 ± 0.29 1.31 ± 0.47 60.7 67.4 TAP O2010 1.09 ± 0.75 1.76 ± 0.30 0.62 ± 0.61 77.4 68.0 AE33 Drinovec 1.87 ± 0.56 2.35 ± 0.30 1.52 ± 0.42 63.2 75.5 AE33 Virkkula 1.97 ± 0.45 2.27 ± 0.24 1.74 ± 0.41 64.9 83.4 AE33 Weingartner 1.43 ± 0.55 1.85 ± 0.29 1.14 ± 0.49 74.8 78.3 AE33 Collaud Coen 1.43 ± 0.56 1.86 ± 0.29 1.13 ± 0.49 74.8 78.1 AE33 Arnott* 1.93 ± 0.76 2.57 ± 0.51 1.47 ± 0.55 58.6 68.9 AE33 Arnott-b** 1.88 ± 0.60 2.41 ± 0.32 1.51 ± 0.44 61.9 73.5 AE33 Schmid* 1.82 ± 0.57 2.32 ± 0.30 1.47 ± 0.44 63.9 75.0 AE33 Schmid-b** 1.83 ± 0.56 2.31 ± 0.30 1.49 ± 0.43 64.0 75.5
* Arnott and Schmid: Drinovec filter-loading correction and scattering corrections using Arnott parameter values.
Laing et al., Aerosol and Air Quality Research, 20: 663–678, 2020 672
** Arnott-b and Schmid-b: Drinovec filter-loading correction and scattering corrections using Collaud-Coen parameter values.
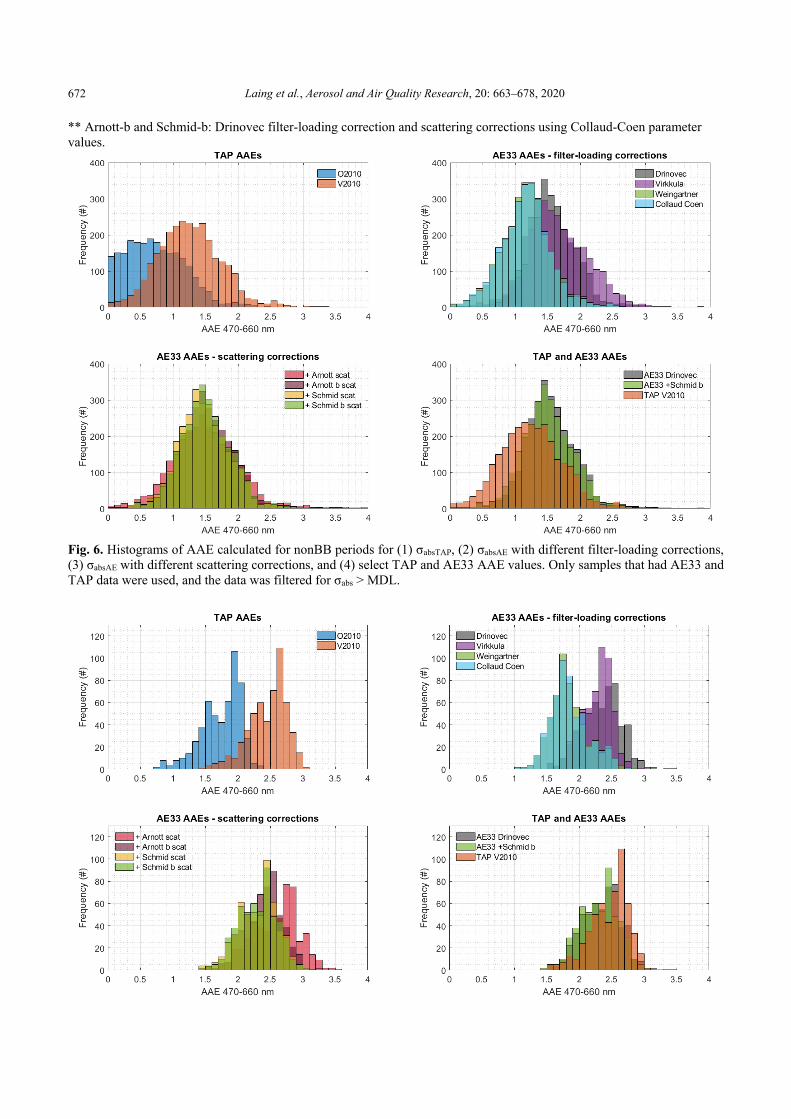
Fig. 6. Histograms of AAE calculated for nonBB periods for (1) σabsTAP, (2) σabsAE with different filter-loading corrections, (3) σabsAE with different scattering corrections, and (4) select TAP and AE33 AAE values. Only samples that had AE33 and TAP data were used, and the data was filtered for σabs > MDL.
Laing et al., Aerosol and Air Quality Research, 20: 663–678, 2020 673
Fig. 7. Histograms of AAE calculated for BB periods for (1) σabsTAP, (2) σabsAE with different filter-loading corrections, (3) σabsAE with different scattering corrections, and (4) select TAP and AE33 AAE values. Only samples that had AE33 and TAP data were used, and the data was filtered for σabs > MDL. total absorption at 470 (σabs) using AAE during BB periods. We then calculated σabsBC and σabsBrC by (1) assuming a fixed constant AAEBC and (2) setting AAEBC equal to the nonBB period AAE value for that instrument and correction scheme (Table 2). Using the second method provided a good agreement between the correction methods, particularly when comparing the TAP correction methods. When assuming an AAEBC = 1, the difference in BrC absorption at 470 nm for V2010 and O2010 is 17%, whereas when AAEBC equals the nonBB AAE value the difference is 0.6%.
This analysis shows that AAE values for the same aerosol are different depending on the instrument and also the correction method used. This leads to a ~25% uncertainty in estimated BrC absorption values when using the AAE to determine BrC absorption.
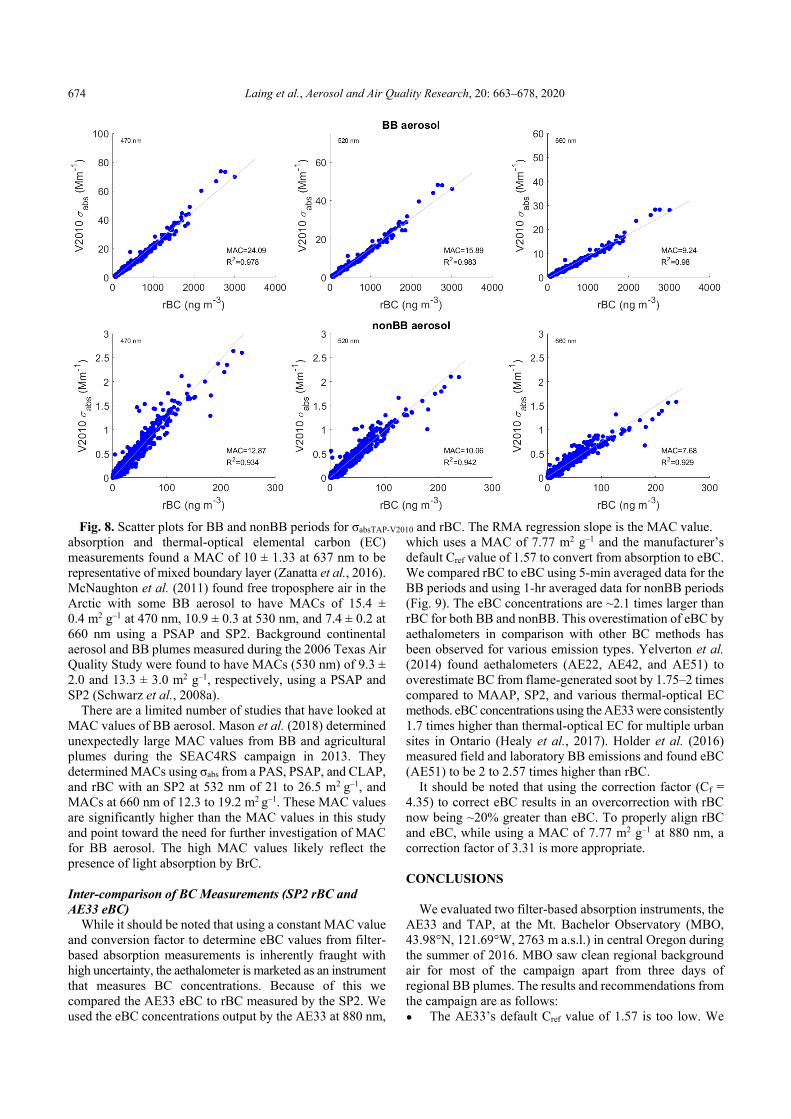
Comparison of MACs
We calculated MACs for the TAP and AE33 as the slope of an RMA regression between σabs and rBC. The MAC
values calculated are total light absorption per unit mass BC, meaning they represent absorption by BrC and enhanced absorption by lensing in addition to BC absorption.
MAC values for TAP wavelengths for BB periods and nonBB periods are shown in Table 3. The MAC values for AE33 wavelengths for BB periods and nonBB periods are shown in Tables S3 and S4. The scatter plots of BB and nonBB σabsTAP-V2010 versus rBC are presented in Fig. 8. The AE33 σabs used in the MAC calculations are corrected with a Cf of 4.35. The MAC values for nonBB periods (10.1–10.7 m2 g–1 at 520 nm) are higher than the MAC value for fresh uncoated BC suggested by Bond and Bergstrom (2006) (7.5 m2 g–1 at 550 nm; 4.7 m2 g–1 at 880 nm). This could be due to the enhancement of absorption due to lensing effects or the additional absorption contributed by organic aerosol. Compared to measurements of ambient background air and BB-influenced air, the MAC values from this study compare well with the MAC values from previous studies. A study of 9 regional background sites in Europe using filter-based
Table 3. MAC values for TAP correction methods for BB periods and nonBB periods. The MAC values for BB periods are the slope of an RMA regression of 5-min averaged data. The MAC values for nonBB periods are the slope of an RMA regression of 1-hr averaged data.
TAP MACs (m2 g–1) Aerosol type BB aerosol NonBB aerosol Correction method V2010 O2010 V2010 O2010 470 nm 24.1 22.7 12.9 12.3 520 nm 15.9 16.8 10.1 10.7 660 nm 9.24 11.19 7.68 9.00
Laing et al., Aerosol and Air Quality Research, 20: 663–678, 2020 674
Fig. 8. Scatter plots for BB and nonBB periods for σabsTAP-V2010 and rBC. The RMA regression slope is the MAC value.
absorption and thermal-optical elemental carbon (EC) measurements found a MAC of 10 ± 1.33 at 637 nm to be representative of mixed boundary layer (Zanatta et al., 2016). McNaughton et al. (2011) found free troposphere air in the Arctic with some BB aerosol to have MACs of 15.4 ± 0.4 m2 g–1 at 470 nm, 10.9 ± 0.3 at 530 nm, and 7.4 ± 0.2 at 660 nm using a PSAP and SP2. Background continental aerosol and BB plumes measured during the 2006 Texas Air Quality Study were found to have MACs (530 nm) of 9.3 ± 2.0 and 13.3 ± 3.0 m2 g–1, respectively, using a PSAP and SP2 (Schwarz et al., 2008a).
There are a limited number of studies that have looked at MAC values of BB aerosol. Mason et al. (2018) determined unexpectedly large MAC values from BB and agricultural plumes during the SEAC4RS campaign in 2013. They determined MACs using σabs from a PAS, PSAP, and CLAP, and rBC with an SP2 at 532 nm of 21 to 26.5 m2 g–1, and MACs at 660 nm of 12.3 to 19.2 m2 g–1. These MAC values are significantly higher than the MAC values in this study and point toward the need for further investigation of MAC for BB aerosol. The high MAC values likely reflect the presence of light absorption by BrC.
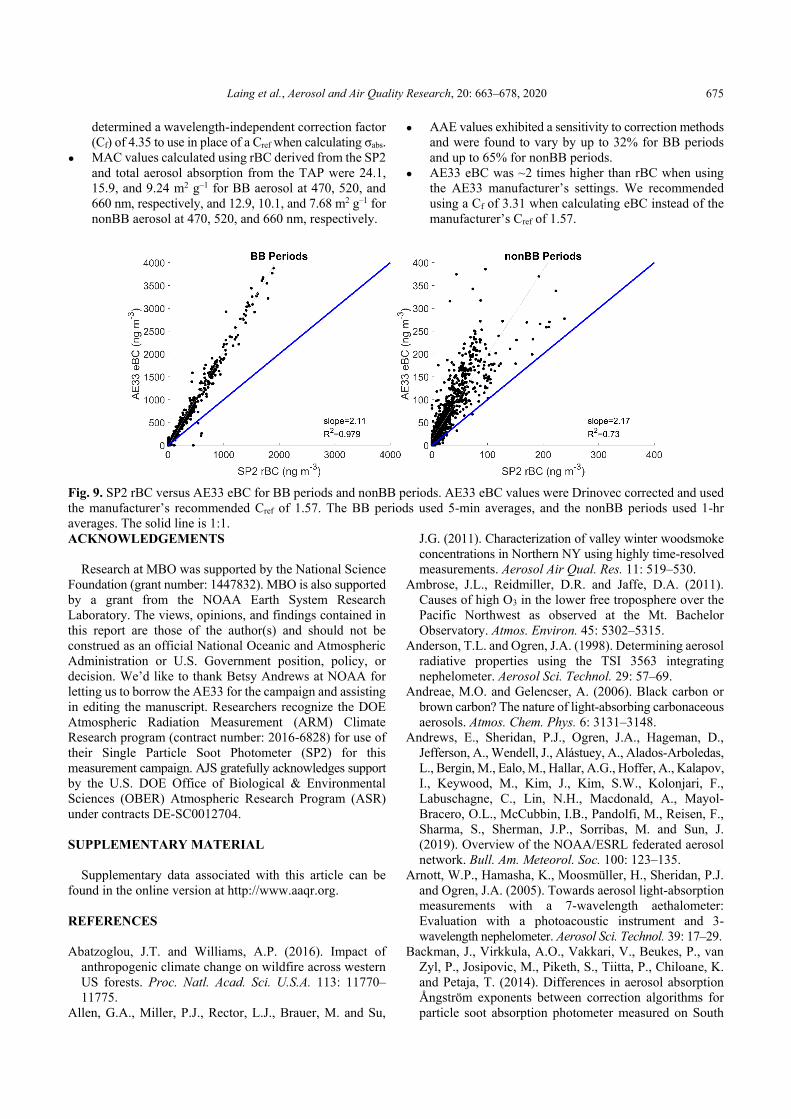
Inter-comparison of BC Measurements (SP2 rBC and AE33 eBC)
While it should be noted that using a constant MAC value and conversion factor to determine eBC values from filter-based absorption measurements is inherently fraught with high uncertainty, the aethalometer is marketed as an instrument that measures BC concentrations. Because of this we compared the AE33 eBC to rBC measured by the SP2. We used the eBC concentrations output by the AE33 at 880 nm,
which uses a MAC of 7.77 m2 g–1 and the manufacturer’s default Cref value of 1.57 to convert from absorption to eBC. We compared rBC to eBC using 5-min averaged data for the BB periods and using 1-hr averaged data for nonBB periods (Fig. 9). The eBC concentrations are ~2.1 times larger than rBC for both BB and nonBB. This overestimation of eBC by aethalometers in comparison with other BC methods has been observed for various emission types. Yelverton et al. (2014) found aethalometers (AE22, AE42, and AE51) to overestimate BC from flame-generated soot by 1.75–2 times compared to MAAP, SP2, and various thermal-optical EC methods. eBC concentrations using the AE33 were consistently 1.7 times higher than thermal-optical EC for multiple urban sites in Ontario (Healy et al., 2017). Holder et al. (2016) measured field and laboratory BB emissions and found eBC (AE51) to be 2 to 2.57 times higher than rBC.
It should be noted that using the correction factor (Cf = 4.35) to correct eBC results in an overcorrection with rBC now being ~20% greater than eBC. To properly align rBC and eBC, while using a MAC of 7.77 m2 g–1 at 880 nm, a correction factor of 3.31 is more appropriate.
CONCLUSIONS
We evaluated two filter-based absorption instruments, the
AE33 and TAP, at the Mt. Bachelor Observatory (MBO, 43.98°N, 121.69°W, 2763 m a.s.l.) in central Oregon during the summer of 2016. MBO saw clean regional background air for most of the campaign apart from three days of regional BB plumes. The results and recommendations from the campaign are as follows: ● The AE33’s default Cref value of 1.57 is too low. We
Laing et al., Aerosol and Air Quality Research, 20: 663–678, 2020 675
determined a wavelength-independent correction factor (Cf) of 4.35 to use in place of a Cref when calculating σabs.
● MAC values calculated using rBC derived from the SP2 and total aerosol absorption from the TAP were 24.1, 15.9, and 9.24 m2 g–1 for BB aerosol at 470, 520, and 660 nm, respectively, and 12.9, 10.1, and 7.68 m2 g–1 for nonBB aerosol at 470, 520, and 660 nm, respectively.
● AAE values exhibited a sensitivity to correction methods and were found to vary by up to 32% for BB periods and up to 65% for nonBB periods.
● AE33 eBC was ~2 times higher than rBC when using the AE33 manufacturer’s settings. We recommended using a Cf of 3.31 when calculating eBC instead of the manufacturer’s Cref of 1.57.
Fig. 9. SP2 rBC versus AE33 eBC for BB periods and nonBB periods. AE33 eBC values were Drinovec corrected and used the manufacturer’s recommended Cref of 1.57. The BB periods used 5-min averages, and the nonBB periods used 1-hr averages. The solid line is 1:1. ACKNOWLEDGEMENTS
Research at MBO was supported by the National Science
Foundation (grant number: 1447832). MBO is also supported by a grant from the NOAA Earth System Research Laboratory. The views, opinions, and findings contained in this report are those of the author(s) and should not be construed as an official National Oceanic and Atmospheric Administration or U.S. Government position, policy, or decision. We’d like to thank Betsy Andrews at NOAA for letting us to borrow the AE33 for the campaign and assisting in editing the manuscript. Researchers recognize the DOE Atmospheric Radiation Measurement (ARM) Climate Research program (contract number: 2016-6828) for use of their Single Particle Soot Photometer (SP2) for this measurement campaign. AJS gratefully acknowledges support by the U.S. DOE Office of Biological & Environmental Sciences (OBER) Atmospheric Research Program (ASR) under contracts DE-SC0012704. SUPPLEMENTARY MATERIAL
Supplementary data associated with this article can be found in the online version at http://www.aaqr.org. REFERENCES Abatzoglou, J.T. and Williams, A.P. (2016). Impact of
anthropogenic climate change on wildfire across western US forests. Proc. Natl. Acad. Sci. U.S.A. 113: 11770–11775.
Allen, G.A., Miller, P.J., Rector, L.J., Brauer, M. and Su,
J.G. (2011). Characterization of valley winter woodsmoke concentrations in Northern NY using highly time-resolved measurements. Aerosol Air Qual. Res. 11: 519–530.
Ambrose, J.L., Reidmiller, D.R. and Jaffe, D.A. (2011). Causes of high O3 in the lower free troposphere over the Pacific Northwest as observed at the Mt. Bachelor Observatory. Atmos. Environ. 45: 5302–5315.
Anderson, T.L. and Ogren, J.A. (1998). Determining aerosol radiative properties using the TSI 3563 integrating nephelometer. Aerosol Sci. Technol. 29: 57–69.
Andreae, M.O. and Gelencser, A. (2006). Black carbon or brown carbon? The nature of light-absorbing carbonaceous aerosols. Atmos. Chem. Phys. 6: 3131–3148.
Andrews, E., Sheridan, P.J., Ogren, J.A., Hageman, D., Jefferson, A., Wendell, J., Alástuey, A., Alados-Arboledas, L., Bergin, M., Ealo, M., Hallar, A.G., Hoffer, A., Kalapov, I., Keywood, M., Kim, J., Kim, S.W., Kolonjari, F., Labuschagne, C., Lin, N.H., Macdonald, A., Mayol-Bracero, O.L., McCubbin, I.B., Pandolfi, M., Reisen, F., Sharma, S., Sherman, J.P., Sorribas, M. and Sun, J. (2019). Overview of the NOAA/ESRL federated aerosol network. Bull. Am. Meteorol. Soc. 100: 123–135.
Arnott, W.P., Hamasha, K., Moosmüller, H., Sheridan, P.J. and Ogren, J.A. (2005). Towards aerosol light-absorption measurements with a 7-wavelength aethalometer: Evaluation with a photoacoustic instrument and 3-wavelength nephelometer. Aerosol Sci. Technol. 39: 17–29.
Backman, J., Virkkula, A.O., Vakkari, V., Beukes, P., van Zyl, P., Josipovic, M., Piketh, S., Tiitta, P., Chiloane, K. and Petaja, T. (2014). Differences in aerosol absorption Ångström exponents between correction algorithms for particle soot absorption photometer measured on South
Laing et al., Aerosol and Air Quality Research, 20: 663–678, 2020 676
African Highveld. Atmos. Meas. Tech. 7: 4285–4298. Backman, J., Schmeisser, L., Virkkula, A., Ogren, J.A.,
Asmi, E., Starkweather, S., Sharma, S., Eleftheriadis, K., Uttal, T. and Jefferson, A. (2017). On Aethalometer measurement uncertainties and an instrument correction factor for the Arctic. Atmos. Meas. Tech. 10: 5039–5062.
Baylon, P., Jaffe, D.A., Wigder, N.L., Gao, H. and Hee, J. (2015). Ozone enhancement in western US wildfire plumes at the Mt. Bachelor Observatory: The role of NOx. Atmos. Environ. 109: 297–304.
Bond, T.C., Anderson, T.L. and Campbell, D. (1999). Calibration and intercomparison of filter-based measurements of visible light absorption by aerosols. Aerosol Sci. Technol. 30: 582–600.
Bond, T.C. and Bergstrom, R.W. (2006). Light absorption by carbonaceous particles: An investigative review. Aerosol Sci. Technol. 40: 27–67.
Bond, T.C., Habib, G. and Bergstrom, R.W. (2006). Limitations in the enhancement of visible light absorption due to mixing state. J. Geophys. Res. 111: D20211.
Bond, T.C., Doherty, S.J., Fahey, D.W., Forster, P.M., Berntsen, T., DeAngelo, B.J., Flanner, M.G., Ghan, S., Kärcher, B., Koch, D., Kinne, S., Kondo, Y., Quinn, P.K., Sarofim, M.C., Schultz, M.G., Schulz, M., Venkataraman, C., Zhang, H., Zhang, S., Bellouin, N., Guttikunda, S.K., Hopke, P.K., Jacobson, M.Z., Kaiser, J.W., Klimont, Z., Lohmann, U., Schwarz, J.P., Shindell, D., Storelvmo, T., Warren, S.G. and Zender, C.S. (2013). Bounding the role of black carbon in the climate system: A scientific assessment. J. Geophys. Res. 118: 1–173.
Briggs, N.L. and Long, C.M. (2016). Critical review of black carbon and elemental carbon source apportionment in Europe and the United States. Atmos. Environ. 144: 409–427.
Briggs, N.L., Jaffe, D.A., Gao, H., Hee, J.R., Baylon, P.M., Zhang, Q., Zhou, S., Collier, S.C., Sampson, P.D. and Cary, R.A. (2016). Particulate matter, ozone, and nitrogen species in aged wildfire plumes observed at the Mount Bachelor Observatory. Aerosol Air Qual. Res. 16: 3075–3087.
Brock, C.A., Cozic, J., Bahreini, R., Froyd, K.D., Middlebrook, A.M., McComiskey, A., Brioude, J., Cooper, O., Stohl, A. and Aikin, K. (2011). Characteristics, sources, and transport of aerosols measured in spring 2008 during the aerosol, radiation, and cloud processes affecting Arctic Climate (ARCPAC) Project. Atmos. Chem. Phys. 11: 2423–2453.
Cappa, C.D., Lack, D.A., Burkholder, J.B. and Ravishankara, A. (2008). Bias in filter-based aerosol light absorption measurements due to organic aerosol loading: Evidence from laboratory measurements. Aerosol Sci. Technol. 42: 1022–1032.
Cappa, C.D., Kolesar, K.R., Zhang, X., Atkinson, D.B., Pekour, M.S., Zaveri, R.A., Zelenyuk, A. and Zhang, Q. (2016). Understanding the optical properties of ambient sub- and supermicron particulate matter: Results from the CARES 2010 field study in northern California. Atmos. Chem. Phys. 16: 6511–6535.
Clarke, A., McNaughton, C., Kapustin, V., Shinozuka, Y.,
Howell, S., Dibb, J., Zhou, J., Anderson, B., Brekhovskikh, V. and Turner, H. (2007). Biomass burning and pollution aerosol over North America: Organic components and their influence on spectral optical properties and humidification response. J. Geophys. Res. 112: D12S18,.
Collaud Coen, M., Weingartner, E., Apituley, A., Ceburnis, D., Fierz-Schmidhauser, R., Flentje, H., Henzing, J., Jennings, S.G., Moerman, M. and Petzold, A. (2010). Minimizing light absorption measurement artifacts of the Aethalometer: Evaluation of five correction algorithms. Atmos. Meas. Tech. 3: 457–474.
Collier, S., Zhou, S., Onasch, T.B., Jaffe, D.A., Kleinman, L., Sedlacek III, A.J., Briggs, N.L., Hee, J., Fortner, E. and Shilling, J.E. (2016). Regional influence of aerosol emissions from wildfires driven by combustion efficiency: Insights from the BBOP campaign. Environ. Sci. Technol. 50: 8613–8622.
Davies, N.W., Fox, C., Szpek, K., Cotterell, M.I., Taylor, J.W., Allan, J.D., Williams, P.I., Trembath, J., Haywood, J.M. and Langridge, J.M. (2019). Evaluating biases in filter-based aerosol absorption measurements using photoacoustic spectroscopy. Atmos. Meas. Tech. 12: 3417–3434.
Dennison, P.E., Brewer, S.C., Arnold, J.D. and Moritz, M.A. (2014). Large wildfire trends in the western United States, 1984–2011. Geophys. Res. Lett. 41: 2928–2933.
Drinovec, L., Močnik, G., Zotter, P., Prévôt, A., Ruckstuhl, C., Coz, E., Rupakheti, M., Sciare, J., Müller, T. and Wiedensohler, A. (2015). The "dual-spot" Aethalometer: An improved measurement of aerosol black carbon with real-time loading compensation. Atmos. Meas. Tech. 8: 1965–1979.
Favez, O., Haddad, I.E., Piot, C., Boréave, A., Abidi, E., Marchand, N., Jaffrezo, J.L., Besombes, J.L., Personnaz, M.-B. and Sciare, J. (2010). Inter-comparison of source apportionment models for the estimation of wood burning aerosols during wintertime in an Alpine city (Grenoble, France). Atmos. Chem. Phys. 10: 5295–5314.
Fischer, E.V., Jaffe, D.A., Marley, N.A., Gaffney, J.S. and Marchany-Rivera, A. (2010a). Optical properties of aged Asian aerosols observed over the US Pacific Northwest. J. Geophys. Res. 115: D20209.
Fischer, E.V., Jaffe, D.A., Reidmiller, D.R. and Jaeglé, L. (2010b). Meteorological controls on observed peroxyacetyl nitrate at Mount Bachelor during the spring of 2008. J. Geophys. Res. 115: D03302.
Gianini, M., Piot, C., Herich, H., Besombes, J.L., Jaffrezo, J.L. and Hueglin, C. (2013). Source apportionment of PM10, organic carbon and elemental carbon at Swiss sites: An intercomparison of different approaches. Sci. Total Environ. 454: 99–108.
Gratz, L.E., Jaffe, D.A. and Hee, J.R. (2015). Causes of increasing ozone and decreasing carbon monoxide in springtime at the Mt. Bachelor Observatory from 2004 to 2013. Atmos. Environ. 109: 323–330.
Gyawali, M., Arnott, W., Lewis, K. and Moosmüller, H. (2009). In situ aerosol optics in Reno, NV, USA during and after the summer 2008 California wildfires and the influence of absorbing and non-absorbing organic coatings
Laing et al., Aerosol and Air Quality Research, 20: 663–678, 2020 677
on spectral light absorption. Atmos. Chem. Phys. 9: 8007–8015.
Hansen, A., Rosen, H. and Novakov, T. (1984). The aethalometer—an instrument for the real-time measurement of optical absorption by aerosol particles. Sci. Total Environ. 36: 191–196.
Healy, R.M., Sofowote, U., Su, Y., Debosz, J., Noble, M., Jeong, C.H., Wang, J., Hilker, N., Evans, G. and Doerksen, G. (2017). Ambient measurements and source apportionment of fossil fuel and biomass burning black carbon in Ontario. Atmos. Environ. 161: 34–47.
Holder, A.L., Hagler, G.S., Aurell, J., Hays, M.D. and Gullett, B.K. (2016). Particulate matter and black carbon optical properties and emission factors from prescribed fires in the southeastern United States. J. Geophys. Res. 121: 3465–3483.
Jaffe, D., Prestbo, E., Swartzendruber, P., Weiss-Penzias, P., Kato, S., Takami, A., Hatakeyama, S. and Kajii, Y. (2005). Export of atmospheric mercury from Asia. Atmos. Environ. 39: 3029–3038.
Kim, J.H., Kim, S.W., Ogren, J.A., Sheridan, P.J., Yoon, S.C., Sharma, S. and Lin, N.H. (2018). Multiple scattering correction factor estimation for aethalometer aerosol absorption coefficient measurement. Aerosol Sci. Technol. 53: 160–171.
Kirchstetter, T.W., Novakov, T. and Hobbs, P.V. (2004). Evidence that the spectral dependence of light absorption by aerosols is affected by organic carbon. J. Geophys. Res. 109: D21208.
Kondo, Y., Sahu, L., Kuwata, M., Miyazaki, Y., Takegawa, N., Moteki, N., Imaru, J., Han, S., Nakayama, T. and Oanh, N.K. (2009). Stabilization of the mass absorption cross section of black carbon for filter-based absorption photometry by the use of a heated inlet. Aerosol Sci. Technol. 43: 741–756.
Laborde, M., Crippa, M., Tritscher, T., Jurányi, Z., Decarlo, P., Temime-Roussel, B., Marchand, N., Eckhardt, S., Stohl, A. and Baltensperger, U. (2013). Black carbon physical properties and mixing state in the European megacity Paris. Atmos. Chem. Phys. 13: 5831–5856.
Lack, D.A., Cappa, C.D., Covert, D.S., Baynard, T., Massoli, P., Sierau, B., Bates, T.S., Quinn, P.K., Lovejoy, E.R. and Ravishankara, A. (2008). Bias in filter-based aerosol light absorption measurements due to organic aerosol loading: Evidence from ambient measurements. Aerosol Sci. Technol. 42: 1033–1041.
Lack, D.A., Langridge, J., Bahreni, R., Cappa, C.D., Middlebrook, A. and Schwarz, J.P. (2012). Brown carbon and internal mixing in biomass burning particles. Proc. Natl. Acad. Sci. U.S.A. 10: 14802–14807.
Lack, D.A. and Langridge, J.M. (2013). On the attribution of black and brown carbon light absorption using the Ångström exponent. Atmos. Chem. Phys. 13: 10535–10543.
Laing, J.R., Jaffe, D.A. and Hee, J.R. (2016). Physical and optical properties of aged biomass burning aerosol from wildfires in Siberia and the Western USA at the Mt. Bachelor Observatory. Atmos. Chem. Phys. 16: 15185–15197.
Liu, J., Scheuer, E., Dibb, J., Diskin, G., Ziemba, L.,
Thornhill, K., Anderson, B., Wisthaler, A., Mikoviny, T. and Devi, J. (2015). Brown carbon aerosol in the North American continental troposphere: Sources, abundance, and radiative forcing. Atmos. Chem. Phys. 15: 7841–7858.
Mason, B., Wagner, N., Adler, G., Andrews, E., Brock, C., Gordon, T., Lack, D., Perring, A., Richardson, M. and Schwarz, J. (2018). An intercomparison of aerosol absorption measurements conducted during the SEAC4RS campaign. Aerosol Sci. Technol. 52: 1012–1027.
McNaughton, C., Clarke, A., Freitag, S., Kapustin, V., Kondo, Y., Moteki, N., Sahu, L., Takegawa, N., Schwarz, J. and Spackman, J. (2011). Absorbing aerosol in the troposphere of the Western Arctic during the 2008 ARCTAS/ARCPAC airborne field campaigns. Atmos. Chem. Phys. 11: 7561–7582.
Moosmuller, H., Chakrabarty, R.K. and Arnott, W.P. (2009). Aerosol light absorption and its measurement: A review. J. Quant. Spectrosc. Radiat. Transfer 110: 844–878.
Moteki, N. and Kondo, Y. (2007). Effects of mixing state on black carbon measurements by laser-induced incandescence. Aerosol Sci. Technol. 41: 398–417.
Moteki, N. and Kondo, Y. (2010). Dependence of laser-induced incandescence on physical properties of black carbon aerosols: Measurements and theoretical interpretation. Aerosol Sci. Technol. 44: 663–675.
Moteki, N., Kondo, Y., Nakayama, T., Kita, K., Sahu, L.K., Ishigai, T., Kinase, T. and Matsumi, Y. (2010). Radiative transfer modeling of filter-based measurements of light absorption by particles: Importance of particle size dependent penetration depth. J. Aerosol Sci. 41: 401–412.
Müller, T., Virkkula, A. and Ogren, J. (2014). Constrained two-stream algorithm for calculating aerosol light absorption coefficient from the Particle Soot Absorption Photometer. Atmos. Meas. Tech. 7: 4049–4070.
Müller, T. (2015). Development of correction factors for Aethalometers AE31 and AE33. In Proceedings of the ACTRIS-2 WP3 Workshop, 2015, Athens, Greece, pp. 10–12.
Myhre, G., Shindell, D., Bréon, F.M., Collins, W., Fuglestvedt, J., Huang, J., Koch, D., Lamarque, J.F., Lee, D., Mendoza, B., Nakajima, T., Robock, A., G. Stephens, Takemura, T. and Zhang, H. (2013). Anthropogenic and Natural Radiative Forcing. In Climate Change 2013: The Physical Science Basis. Contribution of Working Group I to the Fifth Assessment Report of the Intergovernmental Panel on Climate Change, Stocker, T.F., Qin, D., Plattner, G.K., Tignor, M., Allen, S.K., Boschung, J., Nauels, A., Xia, Y., Bex, V. and Midgley, P.M. (Eds.), Cambridge University Press, Cambridge, United Kingdom.
Nakayama, T., Kondo, Y., Moteki, N., Sahu, L., Kinase, T., Kita, K. and Matsumi, Y. (2010). Size-dependent correction factors for absorption measurements using filter-based photometers: PSAP and COSMOS. J. Aerosol Sci. 41: 333–343.
Ogren, J.A. (2010). Comment on “Calibration and intercomparison of filter-based measurements of visible light absorption by aerosols”. Aerosol Sci. Technol. 44: 589–591.
Ogren, J.A., Wendell, J., Andrews, E. and Sheridan, P.J.
Laing et al., Aerosol and Air Quality Research, 20: 663–678, 2020 678
(2017). Continuous light absorption photometer for long-term studies. Atmos. Meas. Tech. 10: 4805–4818.
Petzold, A., Ogren, J.A., Fiebig, M., Laj, P., Li, S.M., Baltensperger, U., Holzer-Popp, T., Kinne, S., Pappalardo, G., Sugimoto, N., Wehrli, C., Wiedensohler, A. and Zhang, X.Y. (2013). Recommendations for reporting "black carbon" measurements. Atmos. Chem. Phys. 13: 8365–8379.
Rajesh, T. and Ramachandran, S. (2018). Black carbon aerosol mass concentration, absorption and single scattering albedo from single and dual spot aethalometers: Radiative implications. J. Aerosol Sci. 119: 77–90.
Ran, L., Deng, Z., Wang, P. and Xia, X. (2016). Black carbon and wavelength-dependent aerosol absorption in the North China Plain based on two-year aethalometer measurements. Atmos. Environ. 142: 132–144.
Reidmiller, D.R., Jaffe, D.A., Fischer, E.V. and Finley, B. (2010). Nitrogen oxides in the boundary layer and free troposphere at the Mt. Bachelor Observatory. Atmos. Chem. Phys. 10: 6043–6062.
Saleh, R., Hennigan, C.J., McMeeking, G.R., Chuang, W.K., Robinson, E.S., Coe, H., Donahue, N.M. and Robinson, A.L. (2013). Absorptivity of brown carbon in fresh and photo-chemically aged biomass-burning emissions. Atmos. Chem. Phys. 13: 7683–7693.
Sandradewi, J., Prévôt, A.S., Szidat, S., Perron, N., Alfarra, M.R., Lanz, V.A., Weingartner, E. and Baltensperger, U. (2008). Using aerosol light absorption measurements for the quantitative determination of wood burning and traffic emission contributions to particulate matter. Environ. Sci. Technol. 42: 3316–3323.
Saturno, J., Pöhlker, C., Massabò, D., Brito, J., Carbone, S., Cheng, Y., Chi, X., Ditas, F., de Angelis, I.H. and Morán-Zuloaga, D. (2017). Comparison of different Aethalometer correction schemes and a reference multi-wavelength absorption technique for ambient aerosol data. Atmos. Meas. Tech. 10: 2837.
Schmid, O., Artaxo, P., Arnott, W., Chand, D., Gatti, L.V., Frank, G., Hoffer, A., Schnaiter, M. and Andreae, M. (2006). Spectral light absorption by ambient aerosols influenced by biomass burning in the Amazon Basin. I: Comparison and field calibration of absorption measurement techniques. Atmos. Chem. Phys. 6: 3443–3462.
Schwarz, J., Gao, R.S., Fahey, D.W., Thomson, D.S., Watts, L.A., Wilson, J.C., Reeves, J.M., Darbeheshti, M., Baumgardner, D.G., Kok, G.L., Chung, S.H., Schulz, M., Hendricks, J., Lauer, A., Karcher, B., Slowik, J.G., Rosenlof, K.H., Thompson, T.L., Langford, A.O., Loewenstein, M. and Aikin, K.C. (2006). Single-particle measurements of midlatitude black carbon and light-scattering aerosols from the boundary layer to the lower stratosphere. J. Geophys. Res. 111: D16207.
Schwarz, J., Gao, R., Spackman, J., Watts, L., Thomson, D., Fahey, D., Ryerson, T., Peischl, J., Holloway, J. and Trainer, M. (2008a). Measurement of the mixing state, mass, and optical size of individual black carbon particles in urban and biomass burning emissions. Geophys. Res. Lett. 35: L13810.
Schwarz, J., Spackman, J., Fahey, D., Gao, R., Lohmann, U., Stier, P., Watts, L., Thomson, D., Lack, D. and Pfister,
L. (2008b). Coatings and their enhancement of black carbon light absorption in the tropical atmosphere. J. Geophys. Res. 113: D03203.
Segura, S., Estellés, V., Titos, G., Lyamani, H., Utrillas, M., Zotter, P., Prévôt, A., Mocnik, G., Alados-Arboledas, L. and Martínez-Lozano, J. (2014). Determination and analysis of in situ spectral aerosol optical properties by a multi-instrumental approach. Atmos. Meas. Tech. 7: 2373.
Segura, S., Estellés, V., Esteve, A., Marcos, C., Utrillas, M. and Martínez-Lozano, J. (2016). Multiyear in-situ measurements of atmospheric aerosol absorption properties at an urban coastal site in western Mediterranean. Atmos. Environ. 129: 18–26.
Springston, S.R. and Sedlacek III, A.J. (2007). Noise characteristics of an instrumental particle absorbance technique. Aerosol Sci. Technol. 41: 1110–1116.
Stephens, M., Turner, N. and Sandberg, J. (2003). Particle identification by laser-induced incandescence in a solid-state laser cavity. Appl. Opt. 42: 3726–3736.
Subramanian, R., Roden, C.A., Boparai, P. and Bond, T.C. (2007). Yellow beads and missing particles: Trouble ahead for filter-based absorption measurements. Aerosol Sci. Technol. 41: 630–637.
Taylor, J., Allan, J., Allen, G., Coe, H., Williams, P., Flynn, M., Le Breton, M., Muller, J., Percival, C. and Oram, D. (2014). Size-dependent wet removal of black carbon in Canadian biomass burning plumes. Atmos. Chem. Phys. 14: 13755–13771.
Timonen, H., Wigder, N. and Jaffe, D. (2013). Influence of background particulate matter (PM) on urban air quality in the Pacific Northwest. J Environ. Manage. 129: 333–340.
Timonen, H., Jaffe, D.A., Wigder, N., Hee, J., Gao, H., Pitzman, L. and Cary, R.A. (2014). Sources of carbonaceous aerosol in the free troposphere. Atmos. Environ. 92: 146–153.
Virkkula, A., Ahlquist, N.C., Covert, D.S., Arnott, W.P., Sheridan, P.J., Quinn, P.K. and Coffman, D.J. (2005). Modification, calibration and a field test of an instrument for measuring light absorption by particles. Aerosol Sci. Technol. 39: 68–83.
Virkkula, A., Mäkelä, T., Hillamo, R., Yli-Tuomi, T., Hirsikko, A., Hämeri, K. and Koponen, I.K. (2007). A simple procedure for correcting loading effects of aethalometer data. J. Air Waste Manage. Assoc. 57: 1214–1222.
Virkkula, A. (2010). Correction of the Calibration of the 3-wavelength Particle Soot Absorption Photometer (3 PSAP). Aerosol Sci. Technol. 44: 706–712.
Wang, J., Virkkula, A., Gao, Y., Lee, S., Shen, Y., Chi, X., Nie, W., Liu, Q., Xu, Z., Huang, X., Wang, T., Cui, L. and Ding, A. (2017). Observations of aerosol optical properties at a coastal site in Hong Kong, South China. Atmos. Chem. Phys. 17: 2653–2671.
Weingartner, E., Saathoff, H., Schnaiter, M., Streit, N., Bitnar, B. and Baltensperger, U. (2003). Absorption of light by soot particles: Determination of the absorption coefficient by means of aethalometers. J. Aerosol Sci. 34: 1445–1463.
Weiss-Penzias, P., Jaffe, D.A., Swartzendruber, P., Dennison,
Laing et al., Aerosol and Air Quality Research, 20: 663–678, 2020 679
J.B., Chand, D., Hafner, W. and Prestbo, E. (2006). Observations of Asian air pollution in the free troposphere at Mount Bachelor Observatory during the spring of 2004. J. Geophys. Res. 111: D10304.
Weiss-Penzias, P., Jaffe, D., Swartzendruber, P., Hafner, W., Chand, D. and Prestbo, E. (2007). Quantifying Asian and biomass burning sources of mercury using the Hg/CO ratio in pollution plumes observed at the Mount Bachelor Observatory. Atmos. Environ. 41: 4366–4379.
Wigder, N.L., Jaffe, D.A. and Saketa, F.A. (2013). Ozone and particulate matter enhancements from regional wildfires observed at Mount Bachelor during 2004–2011. Atmos. Environ. 75: 24–31.
Yang, M., Howell, S., Zhuang, J. and Huebert, B. (2009). Attribution of aerosol light absorption to black carbon, brown carbon, and dust in China – interpretations of atmospheric measurements during EAST-AIRE. Atmos. Chem. Phys. 9: 2035–2050.
Yelverton, T.L., Hays, M.D., Gullett, B.K. and Linak, W.P. (2014). Black carbon measurements of flame-generated soot as determined by optical, thermal-optical, direct absorption, and laser incandescence methods. Environ.
Eng. Sci. 31: 209–215. Zanatta, M., Gysel, M., Bukowiecki, N., Müller, T.,
Weingartner, E., Areskoug, H., Fiebig, M., Yttri, K.E., Mihalopoulos, N. and Kouvarakis, G. (2016). A European aerosol phenomenology-5: Climatology of black carbon optical properties at 9 regional background sites across Europe. Atmos. Environ. 145: 346–364.
Zhang, L. and Jaffe, D.A. (2017). Trends and sources of ozone and sub-micron aerosols at the Mt. Bachelor Observatory (MBO) during 2004–2015. Atmos. Environ. 165: 143–154.
Zhou, S., Collier, S., Jaffe, D.A., Briggs, N.L., Hee, J., Sedlacek III, A.J., Kleinman, L., Onasch, T.B. and Zhang, Q. (2017). Regional influence of wildfires on aerosol chemistry in the western US and insights into atmospheric aging of biomass burning organic aerosol. Atmos. Chem. Phys. 17: 2477–2493.
Received for review, June 11, 2019 Revised, September 25, 2019
Accepted, October 2, 2019
Comparison of Filter-Based Absorption Measurements of Biomass Burning Aerosol and Background Aerosol at the Mt. Bachelor
Observatory
James R. Laing1, Daniel A. Jaffe1,2∗, Arthur J. Sedlacek, III3 1University of Washington Bothell, Bothell, Washington, USA. 2University of Washington, Seattle, Washington, USA. 3Brookhaven National Laboratory, Upton, New York, USA.
Supplement
∗ Corresponding author: Daniel A. Jaffe, [email protected]
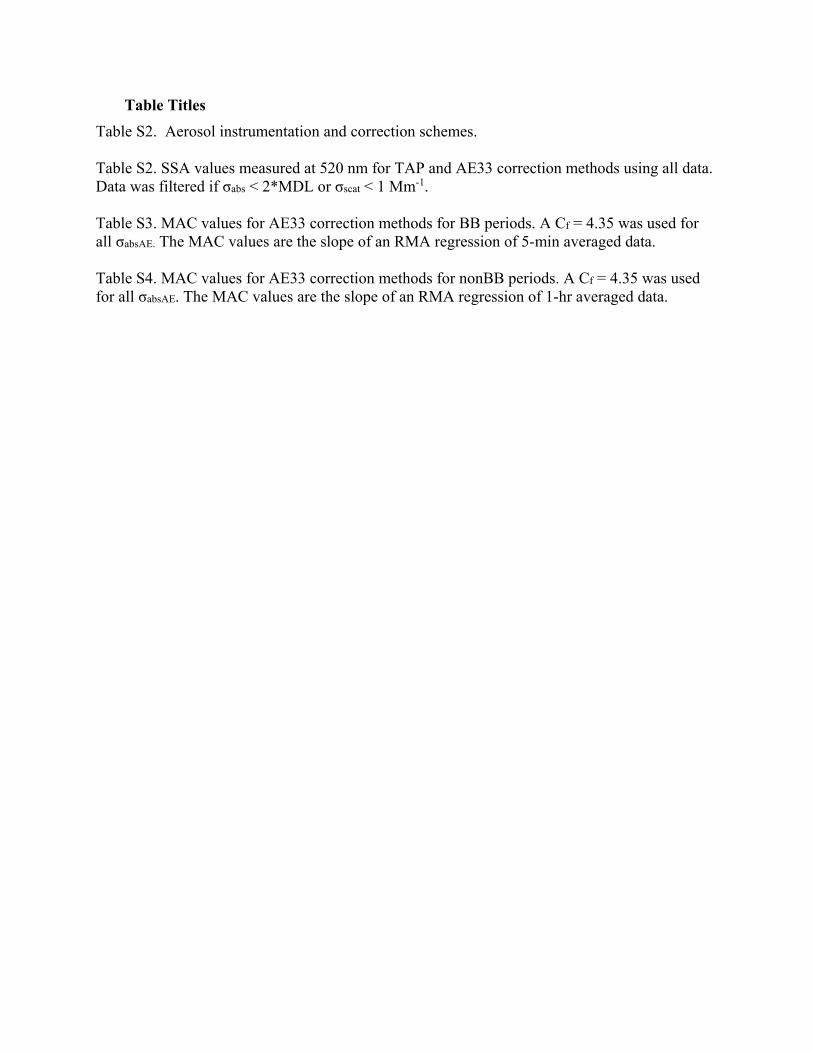
Table Titles Table S2. Aerosol instrumentation and correction schemes. Table S2. SSA values measured at 520 nm for TAP and AE33 correction methods using all data. Data was filtered if σabs < 2*MDL or σscat < 1 Mm-1. Table S3. MAC values for AE33 correction methods for BB periods. A Cf = 4.35 was used for all σabsAE. The MAC values are the slope of an RMA regression of 5-min averaged data. Table S4. MAC values for AE33 correction methods for nonBB periods. A Cf = 4.35 was used for all σabsAE. The MAC values are the slope of an RMA regression of 1-hr averaged data.
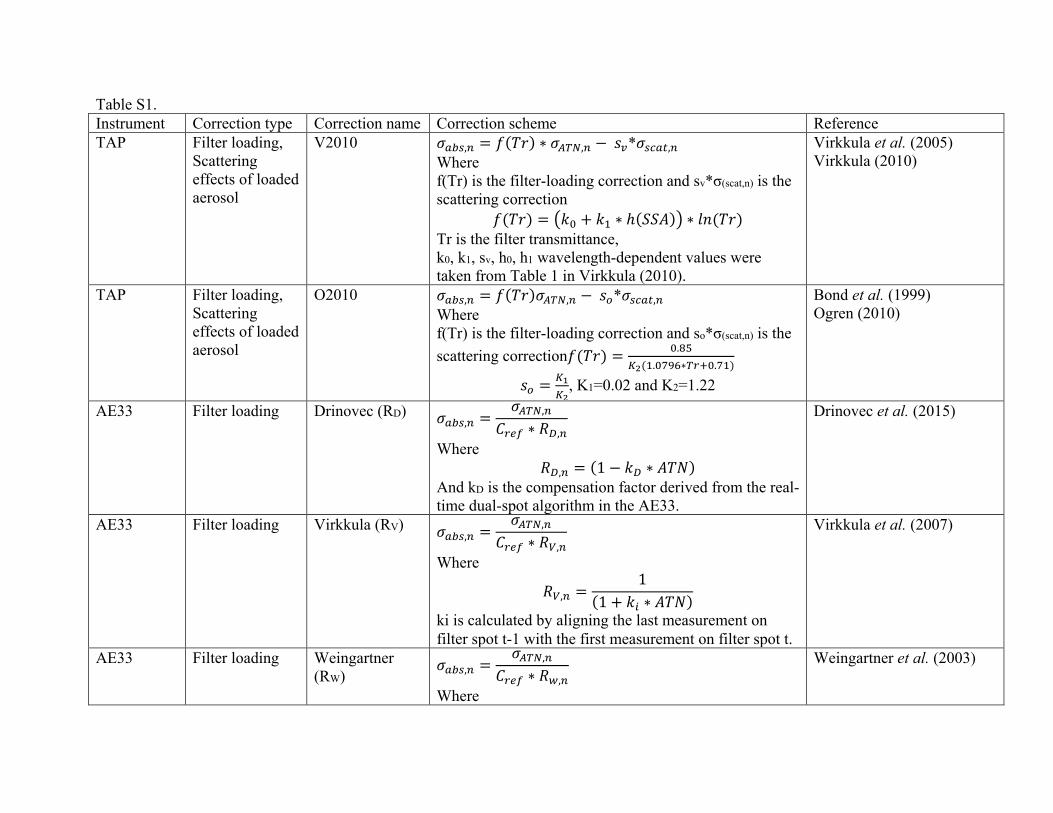
Table S1. Instrument Correction type Correction name Correction scheme Reference TAP Filter loading,
Scattering effects of loaded aerosol
V2010
𝜎𝜎𝑎𝑎𝑎𝑎𝑎𝑎,𝑛𝑛 = 𝑓𝑓(𝑇𝑇𝑇𝑇) ∗ 𝜎𝜎𝐴𝐴𝐴𝐴𝐴𝐴,𝑛𝑛 − 𝑠𝑠𝑣𝑣*𝜎𝜎𝑎𝑎𝑠𝑠𝑎𝑎𝑠𝑠,𝑛𝑛 Where f(Tr) is the filter-loading correction and sv*σ(scat,n) is the scattering correction
𝑓𝑓(𝑇𝑇𝑇𝑇) = �𝑘𝑘0 + 𝑘𝑘1 ∗ ℎ(𝑆𝑆𝑆𝑆𝑆𝑆)� ∗ 𝑙𝑙𝑙𝑙 (𝑇𝑇𝑇𝑇) Tr is the filter transmittance, k0, k1, sv, h0, h1 wavelength-dependent values were taken from Table 1 in Virkkula (2010).
Virkkula et al. (2005) Virkkula (2010)
TAP Filter loading, Scattering effects of loaded aerosol
O2010 𝜎𝜎𝑎𝑎𝑎𝑎𝑎𝑎,𝑛𝑛 = 𝑓𝑓(𝑇𝑇𝑇𝑇)𝜎𝜎𝐴𝐴𝐴𝐴𝐴𝐴,𝑛𝑛 − 𝑠𝑠𝑜𝑜*𝜎𝜎𝑎𝑎𝑠𝑠𝑎𝑎𝑠𝑠,𝑛𝑛 Where f(Tr) is the filter-loading correction and so*σ(scat,n) is the scattering correction𝑓𝑓(𝑇𝑇𝑇𝑇) = 0.85
𝐾𝐾2(1.0796∗𝐴𝐴𝑇𝑇+0.71)
𝑠𝑠𝑜𝑜 = 𝐾𝐾1𝐾𝐾2
, K1=0.02 and K2=1.22
Bond et al. (1999) Ogren (2010)
AE33 Filter loading Drinovec (RD)
𝜎𝜎𝑎𝑎𝑎𝑎𝑎𝑎,𝑛𝑛 =𝜎𝜎𝐴𝐴𝐴𝐴𝐴𝐴,𝑛𝑛
𝐶𝐶𝑇𝑇𝑟𝑟𝑟𝑟 ∗ 𝑅𝑅𝐷𝐷,𝑛𝑛
Where 𝑅𝑅𝐷𝐷,𝑛𝑛 = (1 − 𝑘𝑘𝐷𝐷 ∗ 𝑆𝑆𝑇𝑇𝐴𝐴)
And kD is the compensation factor derived from the real-time dual-spot algorithm in the AE33.
Drinovec et al. (2015)
AE33 Filter loading Virkkula (RV)
𝜎𝜎𝑎𝑎𝑎𝑎𝑎𝑎,𝑛𝑛 =𝜎𝜎𝐴𝐴𝐴𝐴𝐴𝐴,𝑛𝑛
𝐶𝐶𝑇𝑇𝑟𝑟𝑟𝑟 ∗ 𝑅𝑅𝑉𝑉,𝑛𝑛
Where
𝑅𝑅𝑉𝑉,𝑛𝑛 =1
(1 + 𝑘𝑘𝑖𝑖 ∗ 𝑆𝑆𝑇𝑇𝐴𝐴)
ki is calculated by aligning the last measurement on filter spot t-1 with the first measurement on filter spot t.
Virkkula et al. (2007)
AE33 Filter loading Weingartner (RW)
𝜎𝜎𝑎𝑎𝑎𝑎𝑎𝑎,𝑛𝑛 =𝜎𝜎𝐴𝐴𝐴𝐴𝐴𝐴,𝑛𝑛
𝐶𝐶𝑇𝑇𝑟𝑟𝑟𝑟 ∗ 𝑅𝑅𝑤𝑤,𝑛𝑛
Where
Weingartner et al. (2003)
𝑅𝑅𝑤𝑤,𝑛𝑛 = �1𝑓𝑓− 1� ∗
𝑙𝑙𝑙𝑙𝑆𝑆𝑇𝑇𝐴𝐴𝑛𝑛 − ln (10%)𝑙𝑙𝑙𝑙(50%) − ln (10%)
+ 1
𝑓𝑓 = 𝑚𝑚 ∗ (1 − 𝑆𝑆𝑆𝑆𝑆𝑆) + 1 and m = (0.87 to 0.85)
AE33 Filter loading Collaud Coen (RC)
𝜎𝜎𝑎𝑎𝑎𝑎𝑎𝑎,𝑛𝑛 =𝜎𝜎𝐴𝐴𝐴𝐴𝐴𝐴,𝑛𝑛
𝐶𝐶𝑇𝑇𝑟𝑟𝑟𝑟 ∗ 𝑅𝑅𝐶𝐶,𝑛𝑛
Where
𝑅𝑅𝐶𝐶,𝑛𝑛 = �1
𝑚𝑚 ∗ �1 − 𝑆𝑆𝑆𝑆𝑆𝑆0,𝑎𝑎,𝑛𝑛� + 1− 1� ∗
𝑆𝑆𝑇𝑇𝐴𝐴𝑛𝑛50%
+ 1
ATNn is filter attenuation as a percentage, SSA0,s,n is mean SSA since the last filter spot change.
Collaud Coen et al. (2010)
AE33 Scattering effects of loaded aerosol
Arnott 𝜎𝜎𝑎𝑎𝑎𝑎𝑎𝑎,𝑛𝑛 =
𝜎𝜎𝑎𝑎𝑠𝑠𝑛𝑛,𝑛𝑛 − 𝛼𝛼(𝜆𝜆) ∗ 𝜎𝜎𝑎𝑎𝑠𝑠𝑎𝑎𝑠𝑠,𝑛𝑛
𝐶𝐶𝑇𝑇𝑟𝑟𝑟𝑟 ∗ 𝑅𝑅𝑛𝑛
Where R is a filter-loading correction factor, 𝛼𝛼(𝜆𝜆) is parameter for scattering correction from Arnott et al. (2005).
Arnott et al. (2005)
AE33 Scattering effects of loaded aerosol
Arnott-b
𝜎𝜎𝑎𝑎𝑎𝑎𝑎𝑎,𝑛𝑛 =𝜎𝜎𝑎𝑎𝑠𝑠𝑛𝑛,𝑛𝑛 − 𝛼𝛼𝑛𝑛𝑟𝑟𝑤𝑤 ∗ 𝜎𝜎𝑎𝑎𝑠𝑠𝑎𝑎𝑠𝑠,𝑎𝑎,𝑛𝑛
𝐶𝐶𝑇𝑇𝑟𝑟𝑟𝑟 ∗ 𝑅𝑅𝑛𝑛
Where R is a filter-loading correction factor, 𝜎𝜎𝑎𝑎𝑠𝑠𝑎𝑎𝑠𝑠,𝑎𝑎,𝑛𝑛 is the mean 𝜎𝜎𝑎𝑎𝑠𝑠𝑎𝑎𝑠𝑠 since the last filter spot change, 𝛼𝛼𝑛𝑛𝑟𝑟𝑤𝑤 is parameter for scattering correction from Collaud Coen et al. (2010).
Collaud Coen et al. (2010)
AE33 Scattering effects of loaded aerosol
Schmid 𝜎𝜎𝑎𝑎𝑎𝑎𝑎𝑎,𝑛𝑛 =𝜎𝜎𝐴𝐴𝐴𝐴𝐴𝐴,𝑛𝑛
(𝐶𝐶𝑇𝑇𝑟𝑟𝑟𝑟 + 𝐶𝐶𝑎𝑎𝑠𝑠𝑎𝑎𝑠𝑠,𝑛𝑛) ∗ 𝑅𝑅𝑛𝑛
Where
𝐶𝐶𝑎𝑎𝑠𝑠𝑎𝑎𝑠𝑠,𝑛𝑛 = 𝛼𝛼(𝜆𝜆) ∗𝑆𝑆𝑆𝑆𝑆𝑆
1 − 𝑆𝑆𝑆𝑆𝑆𝑆
𝛼𝛼(𝜆𝜆) is parameter for scattering correction from Arnott et al. (2005),
(Schmid et al., 2006)
SSA0,s,n is mean SSA since the last filter spot change. AE33 Scattering
effects of loaded aerosol
Schmid-b 𝜎𝜎𝑎𝑎𝑎𝑎𝑎𝑎,𝑛𝑛 =𝜎𝜎𝐴𝐴𝐴𝐴𝐴𝐴,𝑛𝑛
(𝐶𝐶𝑇𝑇𝑟𝑟𝑟𝑟 + 𝐶𝐶𝑎𝑎𝑠𝑠𝑎𝑎𝑠𝑠,𝑛𝑛,𝑛𝑛𝑟𝑟𝑤𝑤) ∗ 𝑅𝑅𝑛𝑛
Where
𝐶𝐶𝑎𝑎𝑠𝑠𝑎𝑎𝑠𝑠,𝑛𝑛,𝑛𝑛𝑟𝑟𝑤𝑤 = 𝛼𝛼𝑛𝑛𝑟𝑟𝑤𝑤 ∗𝑆𝑆𝑆𝑆𝑆𝑆0,𝑎𝑎,𝑛𝑛
1 − 𝑆𝑆𝑆𝑆𝑆𝑆0,𝑎𝑎,𝑛𝑛
𝛼𝛼𝑛𝑛𝑟𝑟𝑤𝑤 is parameter for scattering correction from Collaud Coen et al. (2010), SSA0,s,n is mean SSA since the last filter spot change.
Collaud Coen et al. (2010)
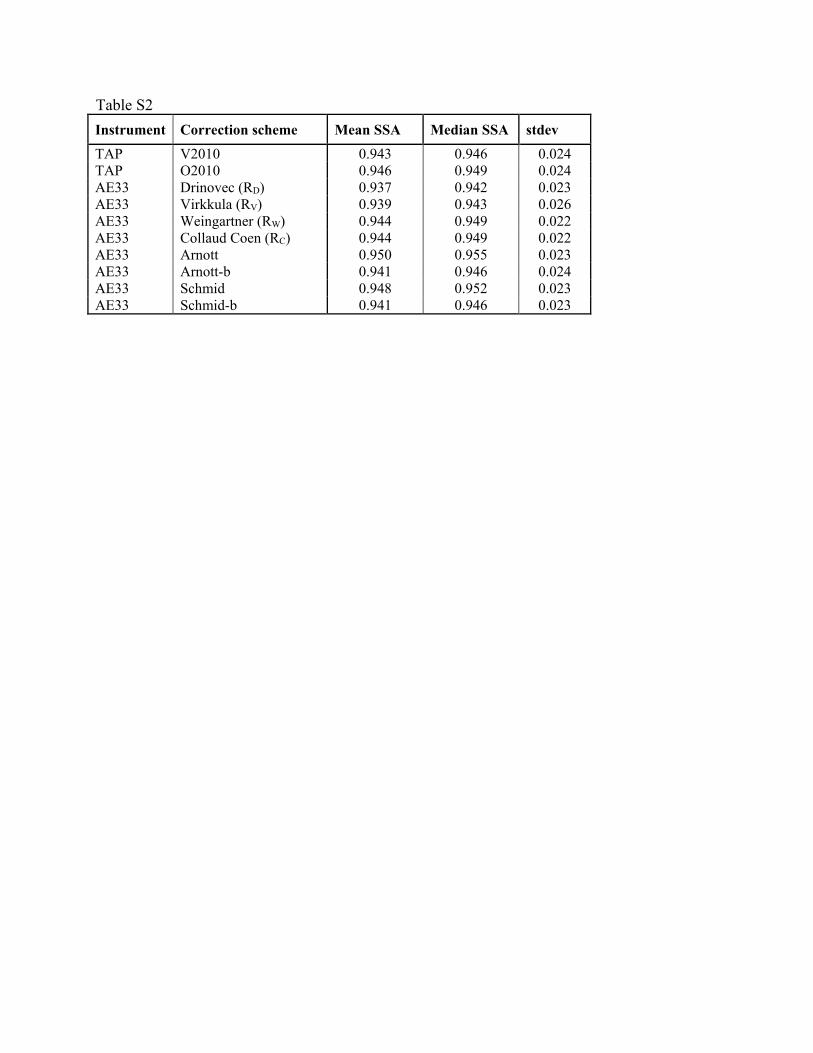
Table S2 Instrument Correction scheme Mean SSA Median SSA stdev TAP V2010 0.943 0.946 0.024 TAP O2010 0.946 0.949 0.024 AE33 Drinovec (RD) 0.937 0.942 0.023 AE33 Virkkula (RV) 0.939 0.943 0.026 AE33 Weingartner (RW) 0.944 0.949 0.022 AE33 Collaud Coen (RC) 0.944 0.949 0.022 AE33 Arnott 0.950 0.955 0.023 AE33 Arnott-b 0.941 0.946 0.024 AE33 Schmid 0.948 0.952 0.023 AE33 Schmid-b 0.941 0.946 0.023
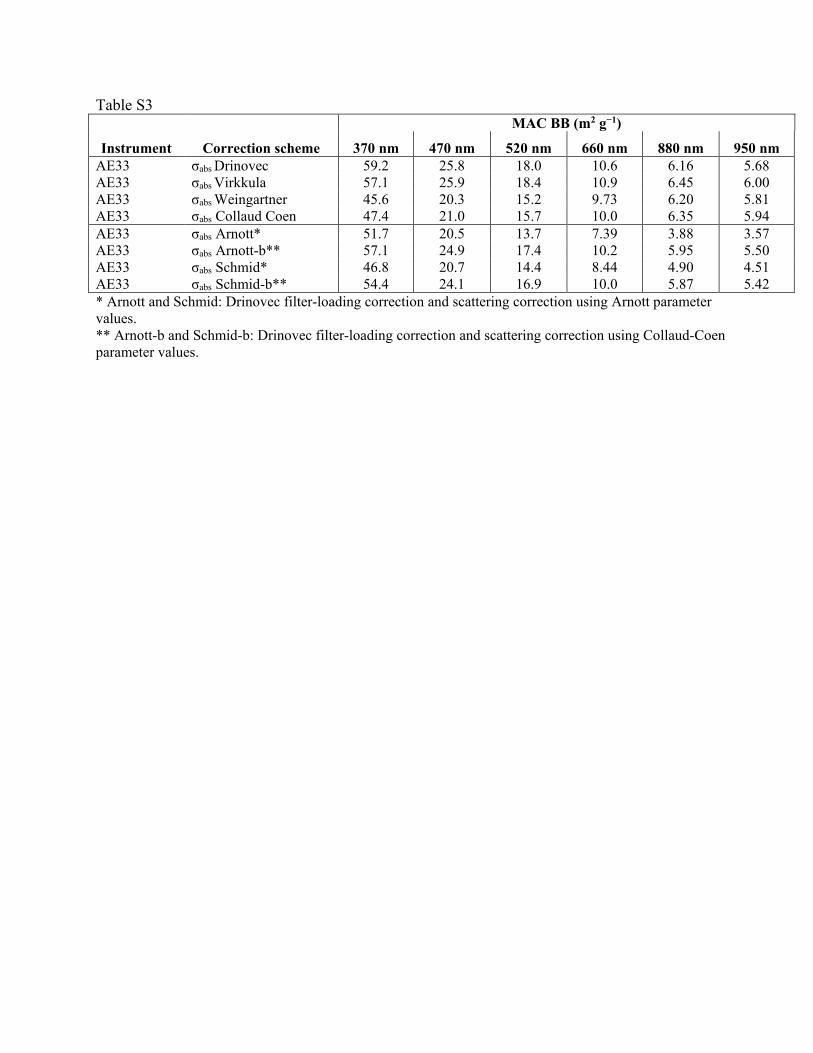
Table S3 MAC BB (m2 g−1)
Instrument Correction scheme 370 nm 470 nm 520 nm 660 nm 880 nm 950 nm AE33 σabs Drinovec 59.2 25.8 18.0 10.6 6.16 5.68 AE33 σabs Virkkula 57.1 25.9 18.4 10.9 6.45 6.00 AE33 σabs Weingartner 45.6 20.3 15.2 9.73 6.20 5.81 AE33 σabs Collaud Coen 47.4 21.0 15.7 10.0 6.35 5.94 AE33 σabs Arnott* 51.7 20.5 13.7 7.39 3.88 3.57 AE33 σabs Arnott-b** 57.1 24.9 17.4 10.2 5.95 5.50 AE33 σabs Schmid* 46.8 20.7 14.4 8.44 4.90 4.51 AE33 σabs Schmid-b** 54.4 24.1 16.9 10.0 5.87 5.42 * Arnott and Schmid: Drinovec filter-loading correction and scattering correction using Arnott parameter values. ** Arnott-b and Schmid-b: Drinovec filter-loading correction and scattering correction using Collaud-Coen parameter values.
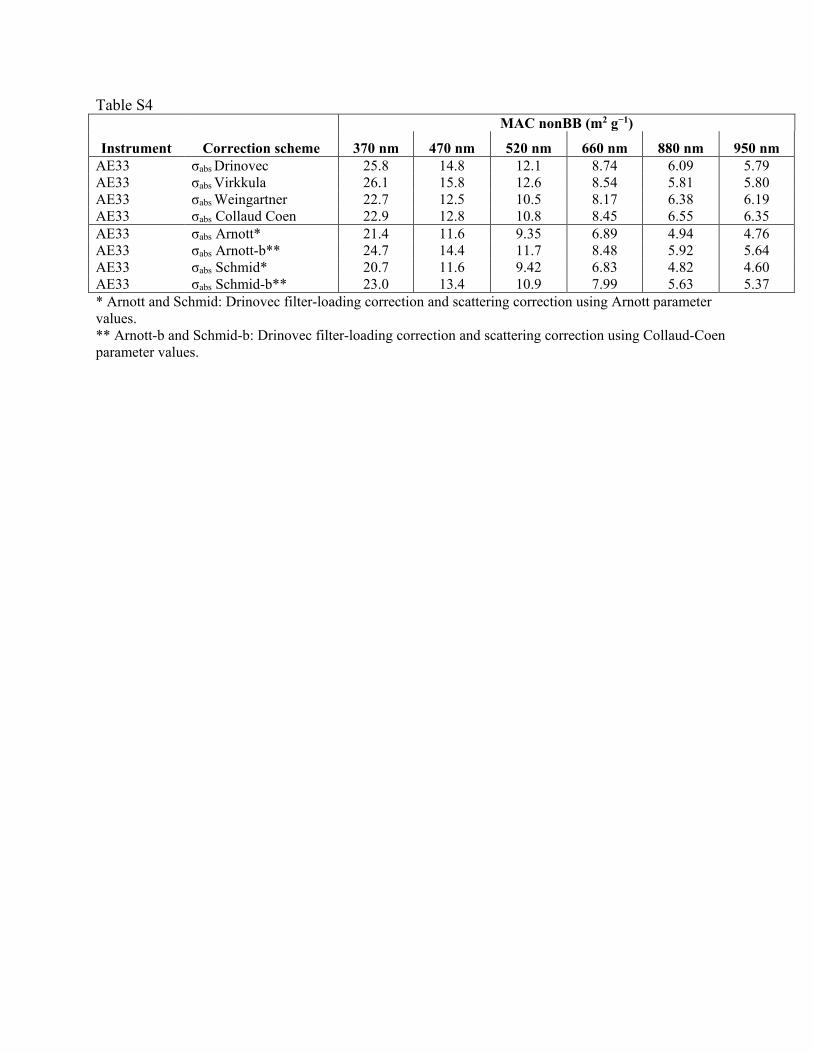
Table S4 MAC nonBB (m2 g−1)
Instrument Correction scheme 370 nm 470 nm 520 nm 660 nm 880 nm 950 nm AE33 σabs Drinovec 25.8 14.8 12.1 8.74 6.09 5.79 AE33 σabs Virkkula 26.1 15.8 12.6 8.54 5.81 5.80 AE33 σabs Weingartner 22.7 12.5 10.5 8.17 6.38 6.19 AE33 σabs Collaud Coen 22.9 12.8 10.8 8.45 6.55 6.35 AE33 σabs Arnott* 21.4 11.6 9.35 6.89 4.94 4.76 AE33 σabs Arnott-b** 24.7 14.4 11.7 8.48 5.92 5.64 AE33 σabs Schmid* 20.7 11.6 9.42 6.83 4.82 4.60 AE33 σabs Schmid-b** 23.0 13.4 10.9 7.99 5.63 5.37 * Arnott and Schmid: Drinovec filter-loading correction and scattering correction using Arnott parameter values. ** Arnott-b and Schmid-b: Drinovec filter-loading correction and scattering correction using Collaud-Coen parameter values.
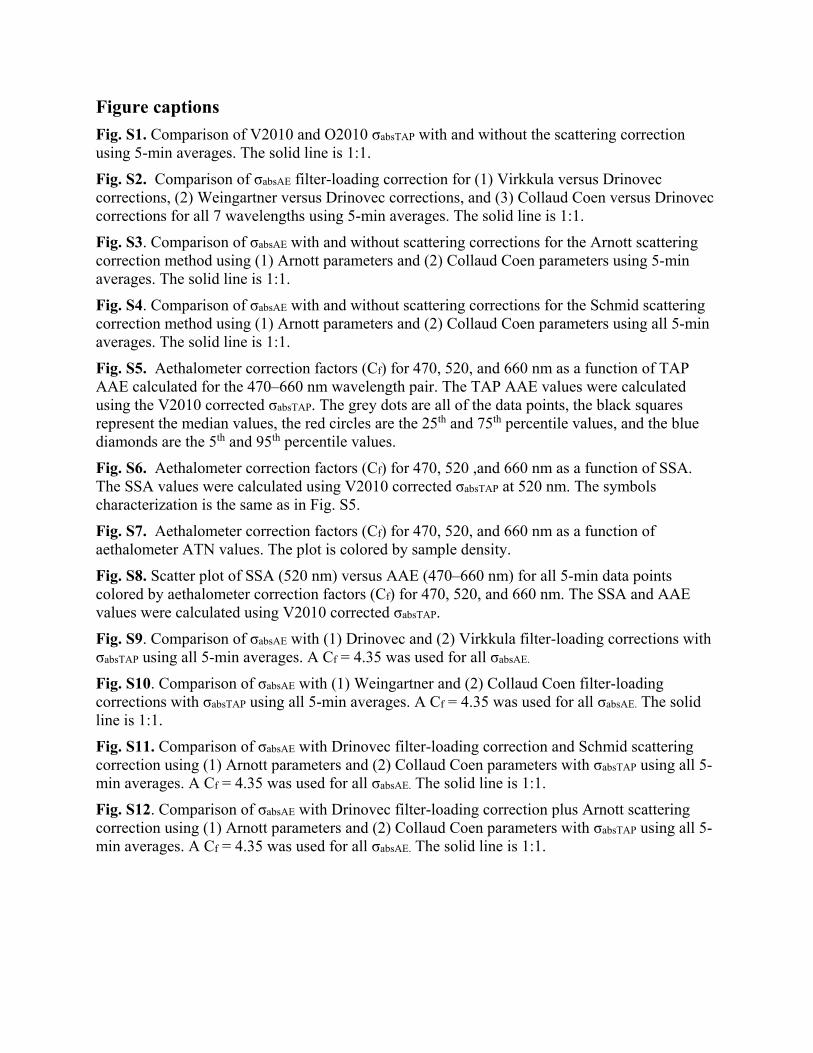
Figure captions Fig. S1. Comparison of V2010 and O2010 σabsTAP with and without the scattering correction using 5-min averages. The solid line is 1:1. Fig. S2. Comparison of σabsAE filter-loading correction for (1) Virkkula versus Drinovec corrections, (2) Weingartner versus Drinovec corrections, and (3) Collaud Coen versus Drinovec corrections for all 7 wavelengths using 5-min averages. The solid line is 1:1. Fig. S3. Comparison of σabsAE with and without scattering corrections for the Arnott scattering correction method using (1) Arnott parameters and (2) Collaud Coen parameters using 5-min averages. The solid line is 1:1. Fig. S4. Comparison of σabsAE with and without scattering corrections for the Schmid scattering correction method using (1) Arnott parameters and (2) Collaud Coen parameters using all 5-min averages. The solid line is 1:1. Fig. S5. Aethalometer correction factors (Cf) for 470, 520, and 660 nm as a function of TAP AAE calculated for the 470–660 nm wavelength pair. The TAP AAE values were calculated using the V2010 corrected σabsTAP. The grey dots are all of the data points, the black squares represent the median values, the red circles are the 25th and 75th percentile values, and the blue diamonds are the 5th and 95th percentile values. Fig. S6. Aethalometer correction factors (Cf) for 470, 520 ,and 660 nm as a function of SSA. The SSA values were calculated using V2010 corrected σabsTAP at 520 nm. The symbols characterization is the same as in Fig. S5. Fig. S7. Aethalometer correction factors (Cf) for 470, 520, and 660 nm as a function of aethalometer ATN values. The plot is colored by sample density. Fig. S8. Scatter plot of SSA (520 nm) versus AAE (470–660 nm) for all 5-min data points colored by aethalometer correction factors (Cf) for 470, 520, and 660 nm. The SSA and AAE values were calculated using V2010 corrected σabsTAP. Fig. S9. Comparison of σabsAE with (1) Drinovec and (2) Virkkula filter-loading corrections with σabsTAP using all 5-min averages. A Cf = 4.35 was used for all σabsAE. Fig. S10. Comparison of σabsAE with (1) Weingartner and (2) Collaud Coen filter-loading corrections with σabsTAP using all 5-min averages. A Cf = 4.35 was used for all σabsAE. The solid line is 1:1. Fig. S11. Comparison of σabsAE with Drinovec filter-loading correction and Schmid scattering correction using (1) Arnott parameters and (2) Collaud Coen parameters with σabsTAP using all 5-min averages. A Cf = 4.35 was used for all σabsAE. The solid line is 1:1. Fig. S12. Comparison of σabsAE with Drinovec filter-loading correction plus Arnott scattering correction using (1) Arnott parameters and (2) Collaud Coen parameters with σabsTAP using all 5-min averages. A Cf = 4.35 was used for all σabsAE. The solid line is 1:1.
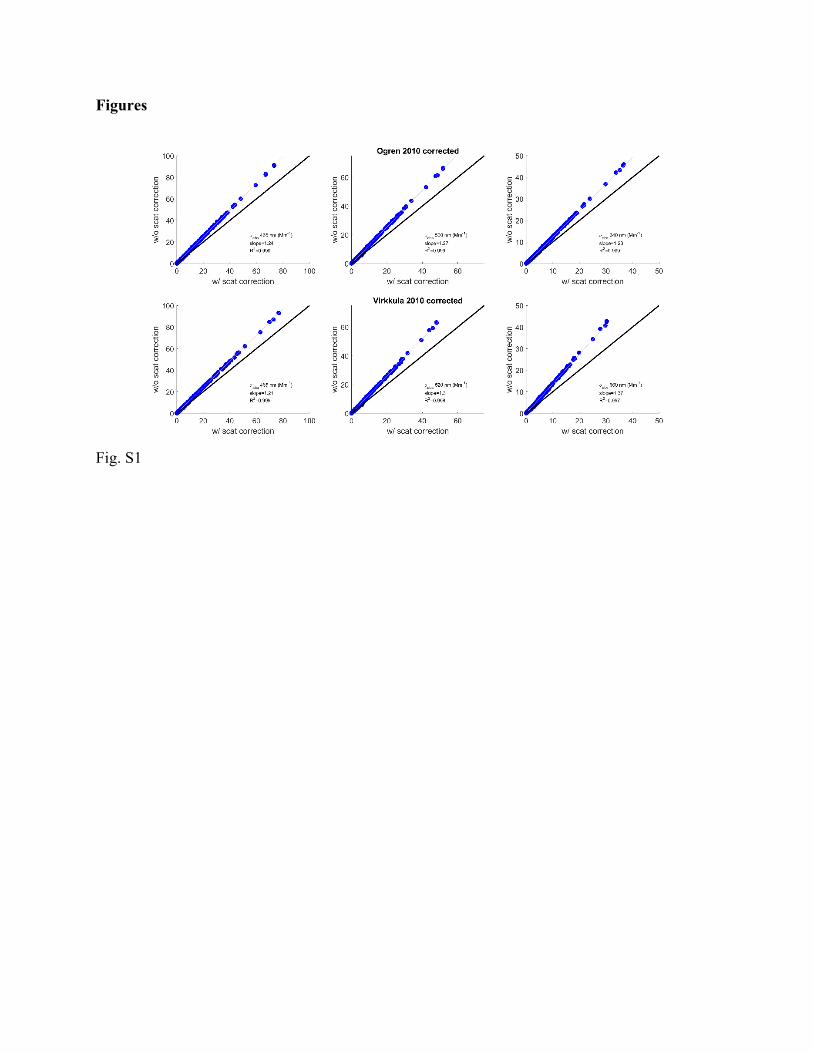
Figures
Fig. S1
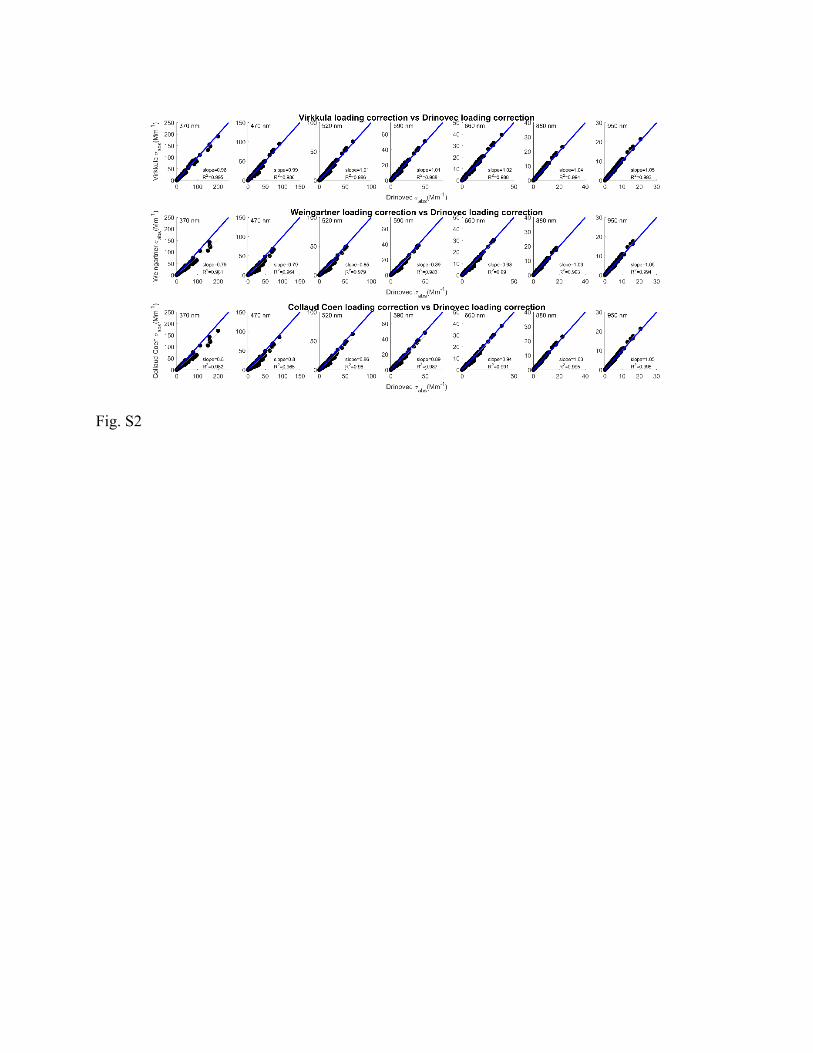
Fig. S2
Fig. S3
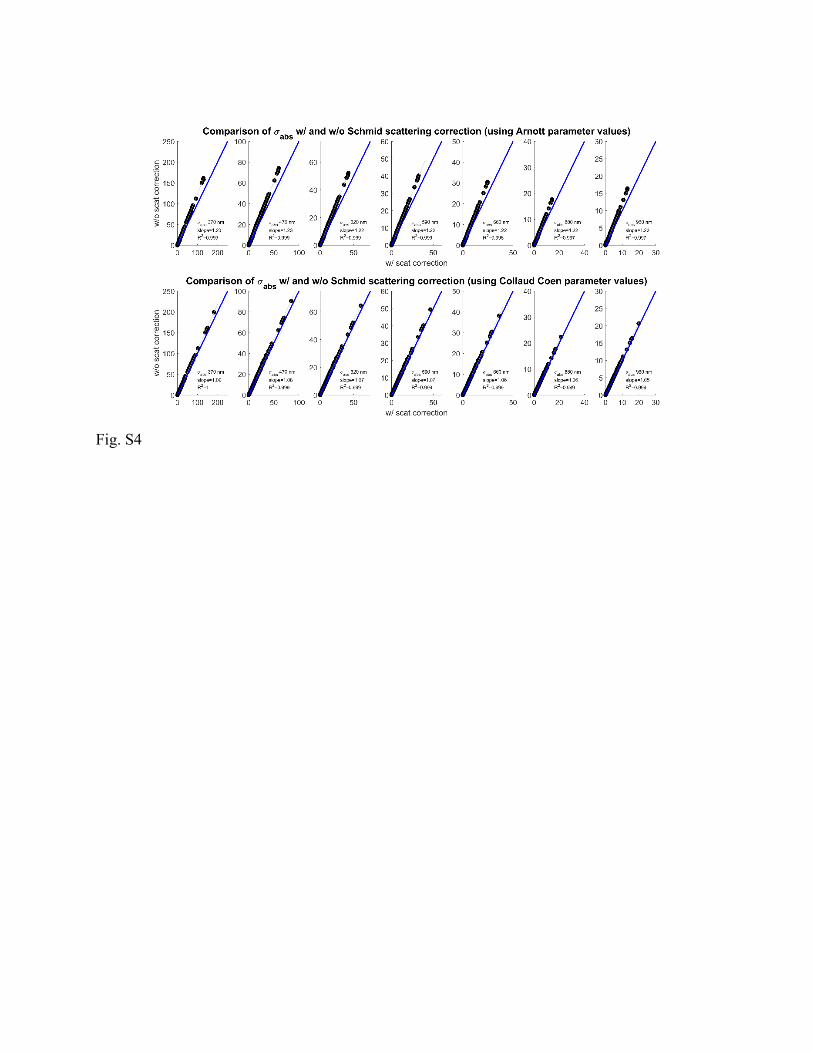
Fig. S4
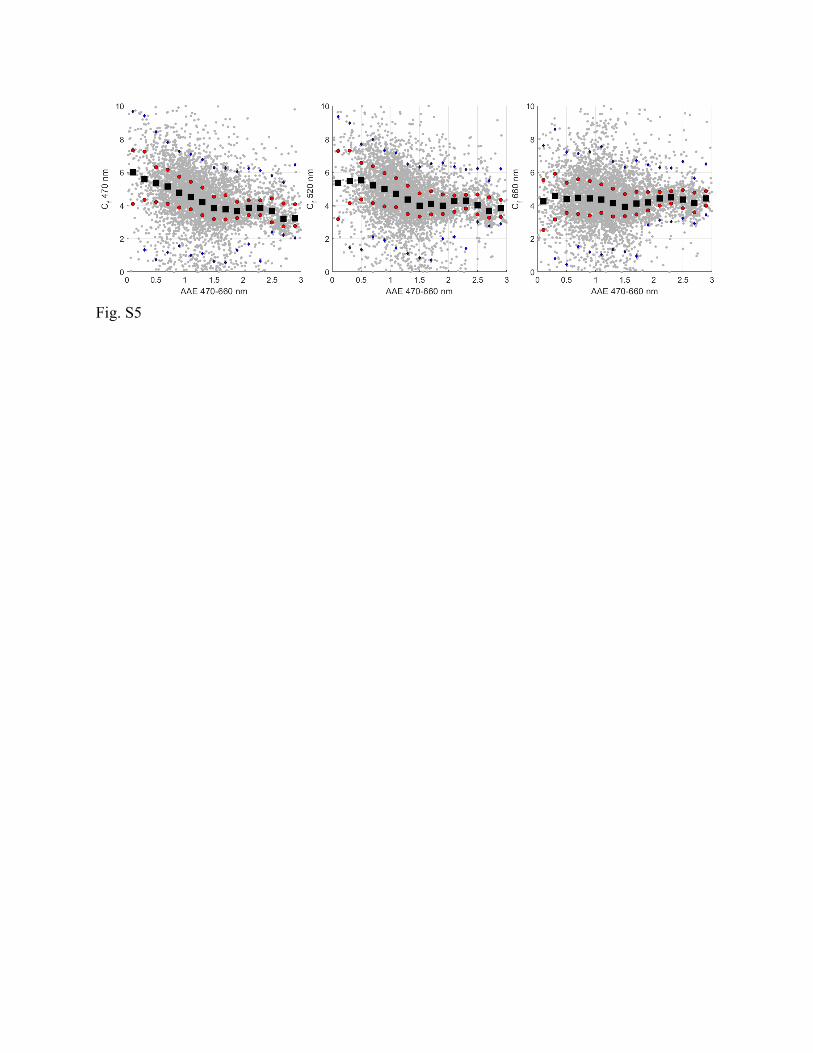
Fig. S5
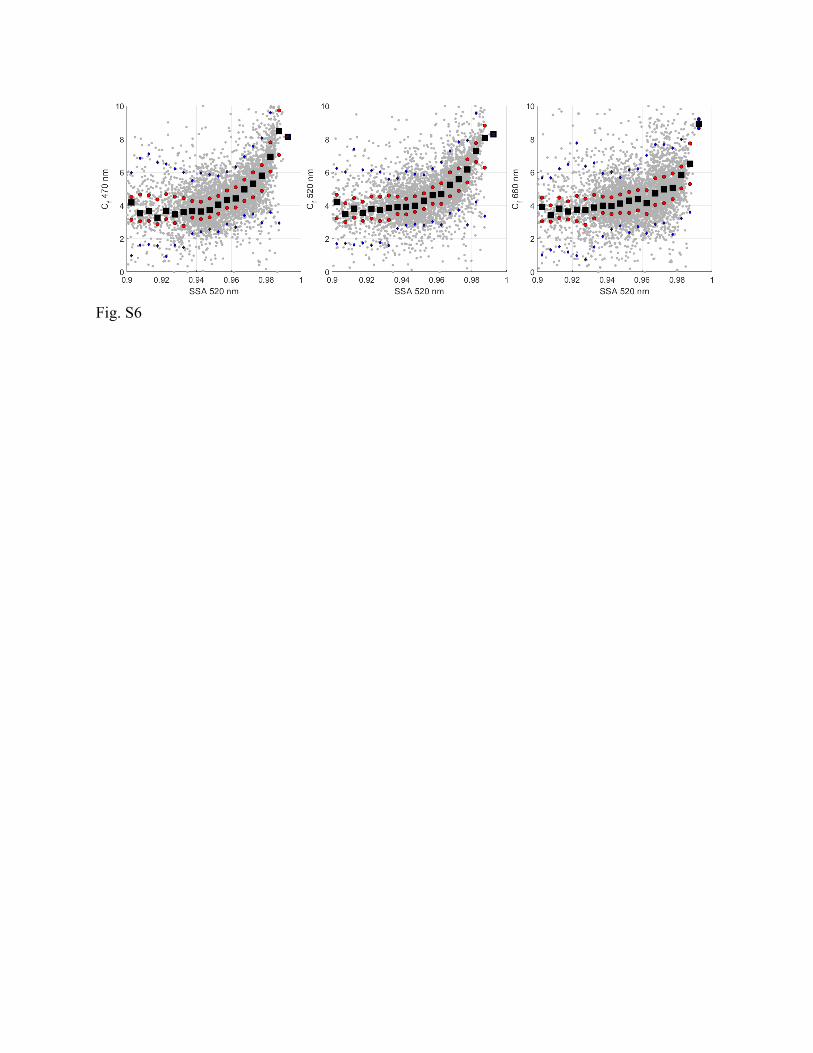
Fig. S6
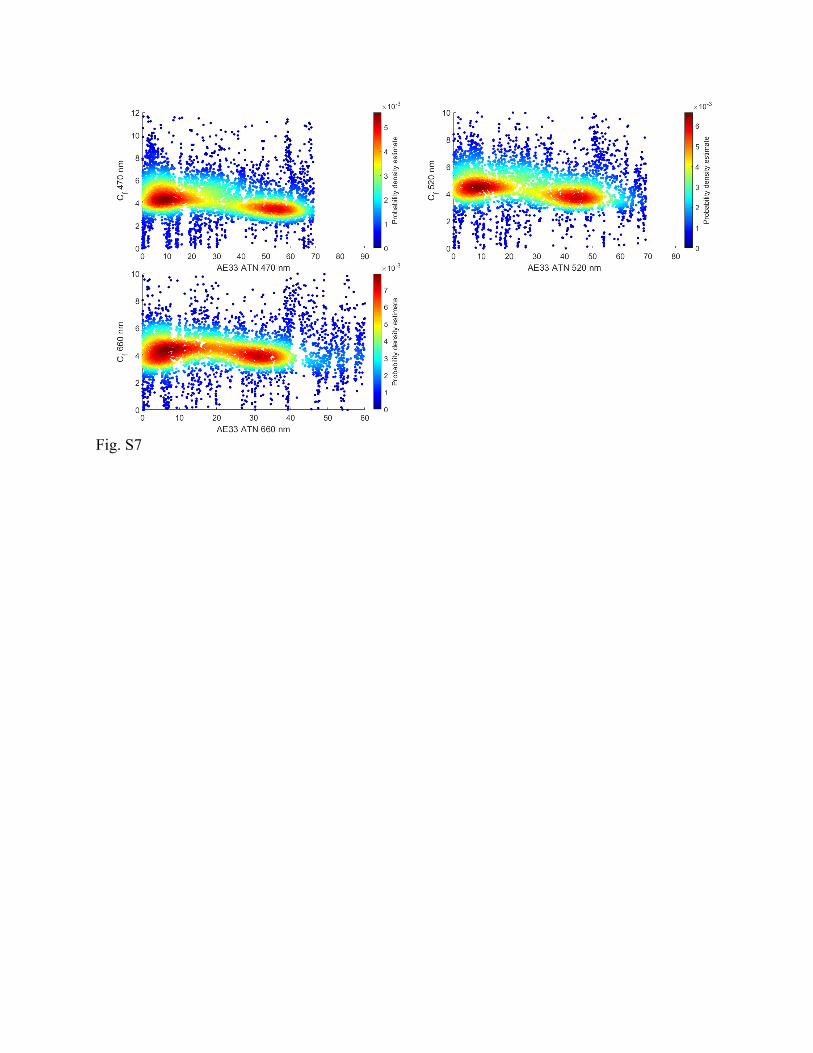
Fig. S7
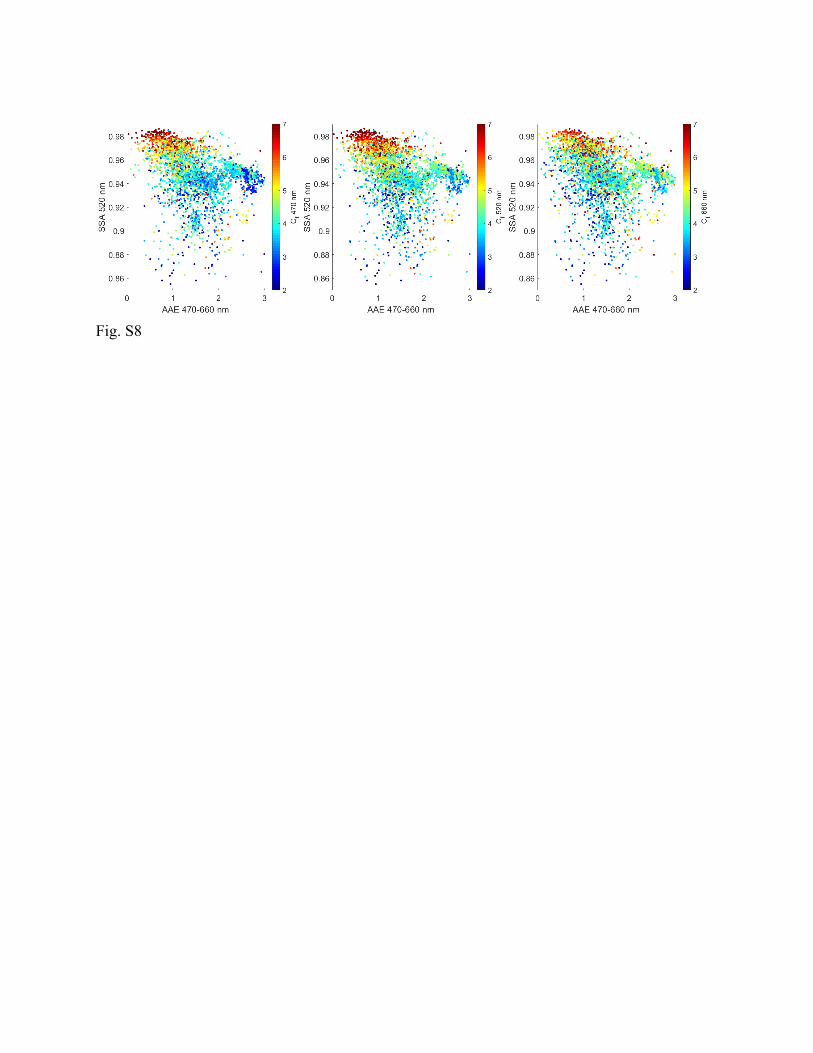
Fig. S8
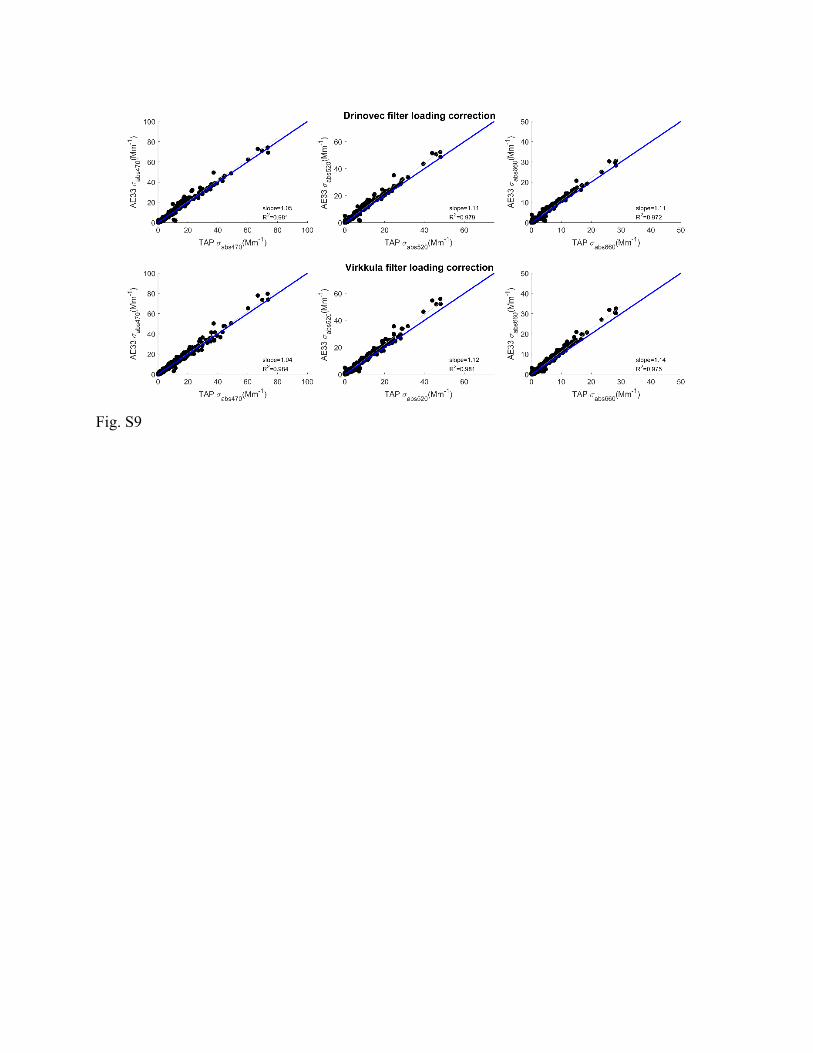
Fig. S9
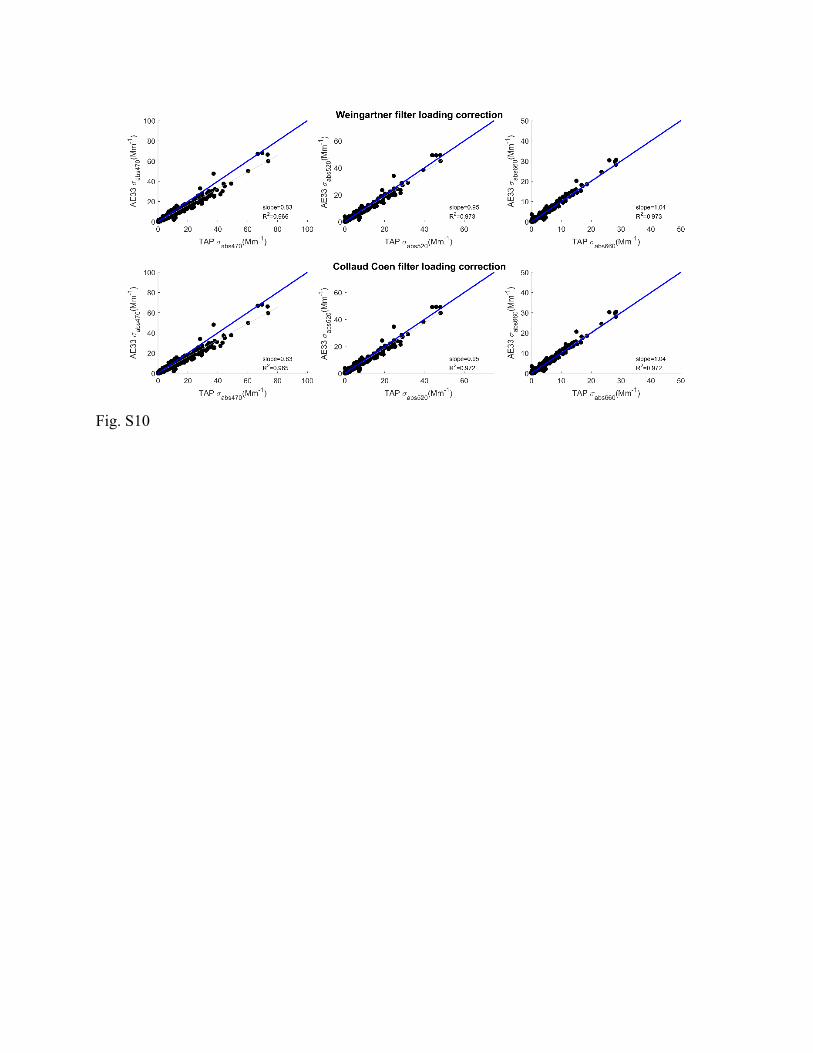
Fig. S10
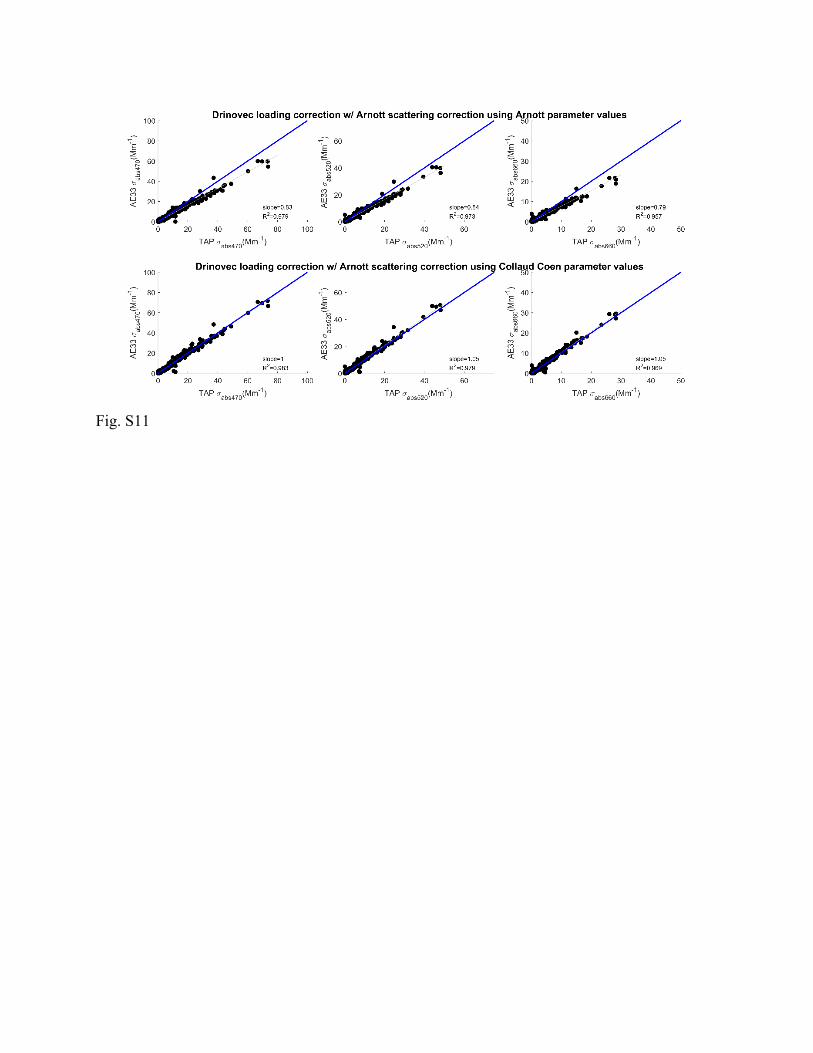
Fig. S11
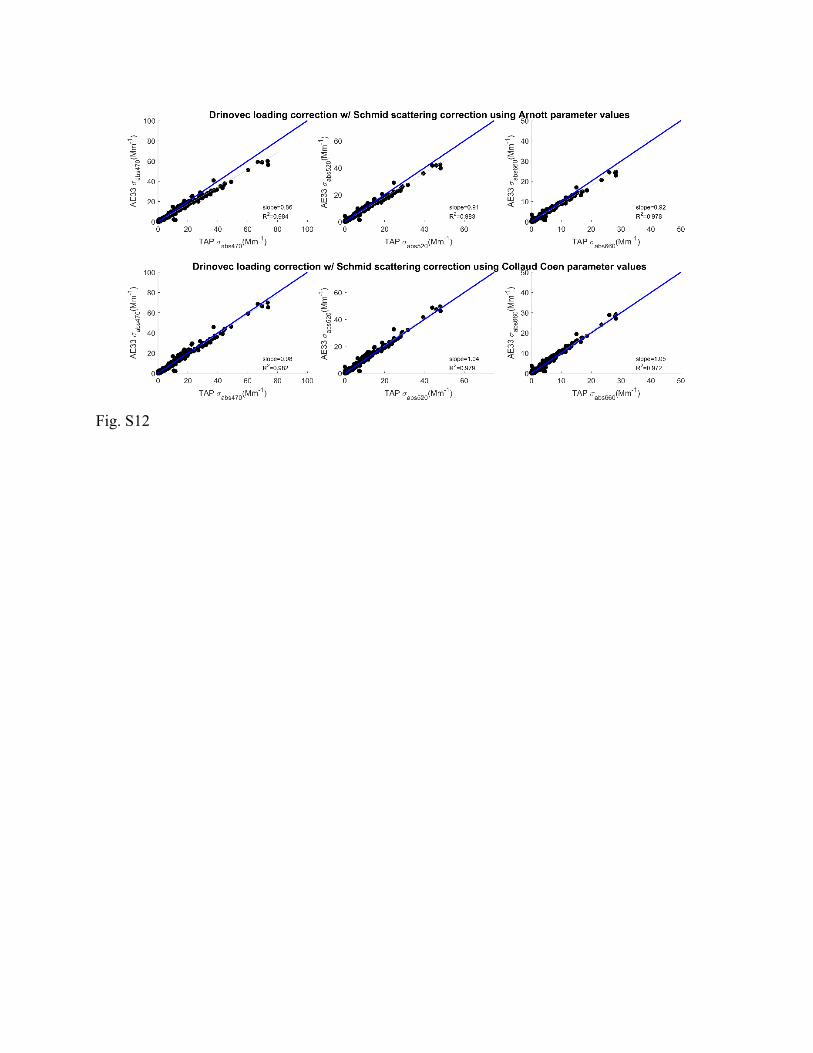
Fig. S12