Embed Size (px)
Citation preview
Comparison of error diffusion methods for computer-generatedholograms
Reiner Eschbach
Error diffusion (ED) is a powerful tool for the generation of binary computer-generated holograms (CGH's).Several modifications of the original ED algorithm have been proposed to incorporate special requirementsand assumptions present in CGH's. This paper compares different versions of the algorithm for theirapplication to computer-generated holography with respect to reconstruction errors and the overall bright-ness of the reconstruction.
1. Introduction
Computer-generated holograms (CGH's) offer attrac-tive possibilities for the manipulation of data by opti-cal means in a wide variety of areas. Examples can befound in optical computing applications where CGH'scan be used to accomplish the complex interconnec-tion patterns or in pattern recognition where they canbe used to generate required filter responses, to name afew. Standard computers and work stations are ableto calculate CGH's with a space-bandwidth product of106 in a few minutes or less and thus allow a widespreadincorporation of CGH's. Fabrication of the CGH,however, requires that the holographic data be trans-ferred to a physical medium, i.e., a piece of film or achrome-on-glass plate coated with photoresist. Alarge number of devices used to transfer computer-generated data to physical media are binary in nature;i.e., they permit only two possible output states, e.g., onand off, ink and no ink, or chrome and no chrome.
The holographic data are thus, in a large number ofcases, coded into a binary form to allow the fabricationof the actual hologram. Several coding techniqueshave been proposed and applied in the area of the CGHwith a clear trend to adaptive or active binarizationprocedures as general-purpose methods. Examples ofthese active methods are the direct-binary-searchl ap-proach, the iterative approach of Broja et al., 2 and
The author is with the Webster Research Center, Xerox Corpora-tion, 800 Phillips Road 128-27E, Webster, New York 14580.
Received 15 February 1990.0003-6935/91/263702-09$05.00/0.© 1991 Optical Society of America.
error diffusion (ED)3 with its different modifications.The advantage of iterative procedures, such as directbinary search, over ED is the possibility of optimizingthe binary CGH with respect to the desired output, butthe major disadvantage of iterative algorithms is thatthey are time-consuming. ED techniques are thusevolving as the major tool of choice in a large number ofapplications where the quality improvement achiev-able by iterative methods would not justify the associ-ated time increase of the computation.
This paper describes various modifications of theED algorithm that have been proposed in the contextof CGH's along with new modifications and comparesthem using computer simulations and optical recon-structions.
II. Point-Oriented Holograms
The application of ED techniques to computer-gener-ated holography implies the use of a point-orientedhologram generation scheme in contrast to a cell-ori-ented scheme, which uses in general a direct binarycoding. Additionally, to be able to use ED, the valuesof the hologram have to be real-valued and not com-plex. (ED has been applied to complex values,4 butnone of the schemes described here allows this.) Astandard way of producing a point-oriented Fourierhologram is used throughout and can be described asfollows:
The real-valued object distribution o(x, y) is multi-plied by a random phase distribution P(x, y) to give thecomplex object distribution u(x, y):
u(x, y) = o(x, y)exp[(i4'(x, y)], (1)
with o(x, y) = 0 for all IxJ _ Ay/2 and yl _ Ay/2. Thisobject distribution of size Ax by Ay is then placed intoa larger array of size AX by AY. The actual position of
3702 APPLIED OPTICS / Vol. 30, No. 26 / 10 September 1991
the object distribution inside the larger array deter-mines the position of the reconstruction, i.e., the carri-er frequency and direction. The object is located out-side the center of the large array to avoid overlappingof the first, minus first, and zero diffraction order.Note that all values (x, y) and (4, v) are discrete valuesof the form (kbx, ly) and (mbg, nv) so that pixelnumbering can be done by marking the pixels withtheir (k, ) and (m, n) values. The center of the largearray is determined by the way the Fourier transfor-mation routine handles the data and is in general locat-ed at pixel (0, 0). This array is subsequently trans-formed to give the complex array U(,, v), where capitalletters are used for the Fourier-transformed quanti-ties. The imaginary part of this distribution is ne-glected, and a bias B is added to assure a nonnegativedistribution:
H(tt, v) = IU(A, v)Icos[27r(x~,t + y~v) + 4(ju,v)] + B, (2)
where x, and ys represent the displacement of u(x, y)from the center of the large array. The bias B in Eq.(2) can have a function dependence on (, v), but aconstant bias is used throughout this paper, becauseone of the modifications of the ED assumes a smallshift (xs, ys) which would lead generally to disturbanceof the reconstruction by the bias term for a varying biasB. It is this real and nonnegative quantity H(ut, v) thatis binarized using the ED methods.
0
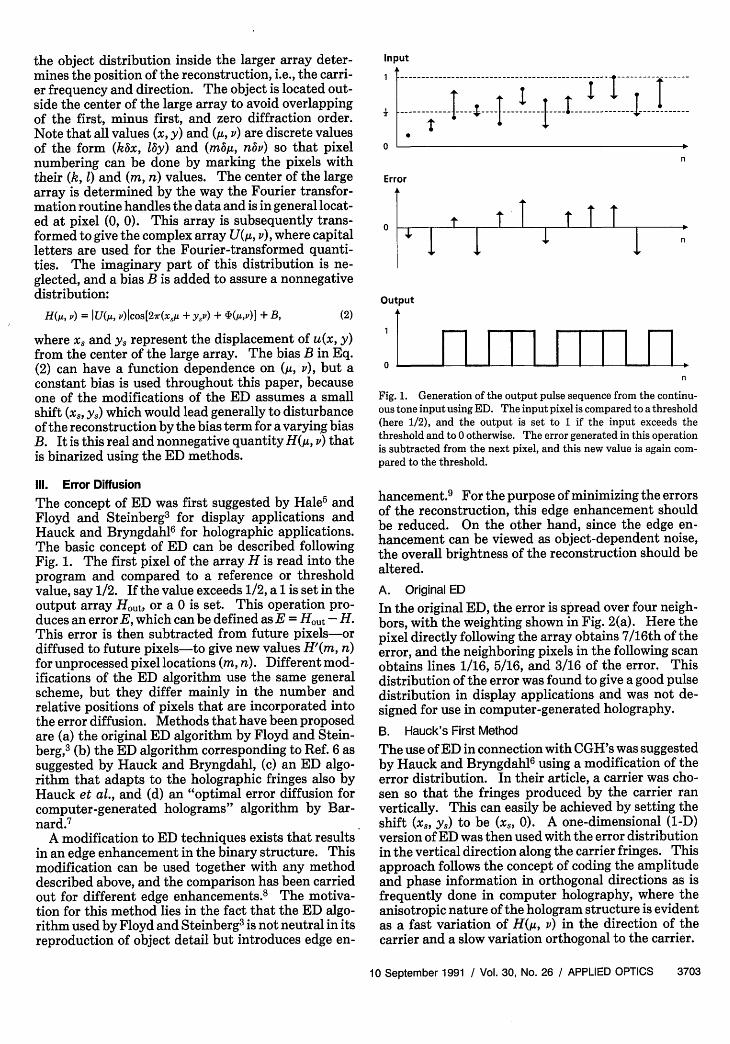
Input
1-
1 ------------------------ --- ------ ---I----------
0-0
n
Error
0t iT
41. 1I 1
t T T
I n
Output
FFLJJTLITn
Fig. 1. Generation of the output pulse sequence from the continu-ous tone input using ED. The input pixel is compared to a threshold(here 1/2), and the output is set to 1 if the input exceeds thethreshold and to 0 otherwise. The error generated in this operationis subtracted from the next pixel, and this new value is again com-pared to the threshold.
111. Error Diffusion
The concept of ED was first suggested by Hale5 andFloyd and Steinberg3 for display applications andHauck and Bryngdahl6 for holographic applications.The basic concept of ED can be described followingFig. 1. The first pixel of the array H is read into theprogram and compared to a reference or thresholdvalue, say 1/2. If the value exceeds 1/2, a 1 is set in theoutput array Hout, or a 0 is set. This operation pro-duces an error E, which can be defined as E = Hout - H.This error is then subtracted from future pixels-ordiffused to future pixels-to give new values H'(m, n)for unprocessed pixel locations (m, n). Different mod-ifications of the ED algorithm use the same generalscheme, but they differ mainly in the number andrelative positions of pixels that are incorporated intothe error diffusion. Methods that have been proposedare (a) the original ED algorithm by Floyd and Stein-berg,3 (b) the ED algorithm corresponding to Ref. 6 assuggested by Hauck and Bryngdahl, (c) an ED algo-rithm that adapts to the holographic fringes also byHauck et al., and (d) an "optimal error diffusion forcomputer-generated holograms" algorithm by Bar-nard.7
A modification to ED techniques exists that resultsin an edge enhancement in the binary structure. Thismodification can be used together with any methoddescribed above, and the comparison has been carriedout for different edge enhancements.8 The motiva-tion for this method lies in the fact that the ED algo-rithm used by Floyd and Steinberg3 is not neutral in itsreproduction of object detail but introduces edge en-
hancement.9 For the purpose of minimizing the errorsof the reconstruction, this edge enhancement shouldbe reduced. On the other hand, since the edge en-hancement can be viewed as object-dependent noise,the overall brightness of the reconstruction should bealtered.
A. Original ED
In the original ED, the error is spread over four neigh-bors, with the weighting shown in Fig. 2(a). Here thepixel directly following the array obtains 7/16th of theerror, and the neighboring pixels in the following scanobtains lines 1/16, 5/16, and 3/16 of the error. Thisdistribution of the error was found to give a good pulsedistribution in display applications and was not de-signed for use in computer-generated holography.
B. Hauck's First Method
The use of ED in connection with CGH's was suggestedby Hauck and Bryngdahl6 using a modification of theerror distribution. In their article, a carrier was cho-sen so that the fringes produced by the carrier ranvertically. This can easily be achieved by setting theshift (x8 , ys) to be (xs, 0). A one-dimensional (1-D)version of ED was then used with the error distributionin the vertical direction along the carrier fringes. Thisapproach follows the concept of coding the amplitudeand phase information in orthogonal directions as isfrequently done in computer holography, where theanisotropic nature of the hologram structure is evidentas a fast variation of H(1u, v) in the direction of thecarrier and a slow variation orthogonal to the carrier.
10 September 1991 / Vol. 30, No. 26 / APPLIED OPTICS 3703
X~~~~ ..
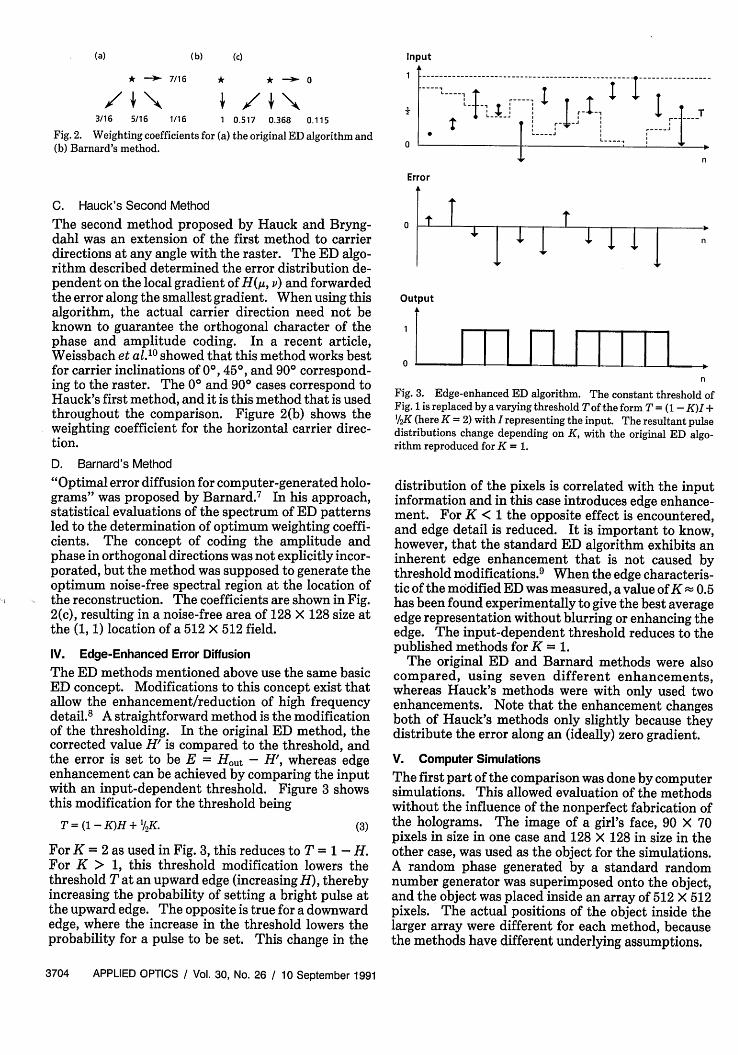
(b) (c)
* 7/16 * * : o
3/16 5/16 1/16 1 0.517 0.368 0.115
Fig. 2. Weighting coefficients for (a) the original ED algorithm and(b) Barnard's method. 0
------------ -- -- I
I~~~- ----- T I -I n
Error
C. Hauck's Second Method
The second method proposed by Hauck and Bryng-dahl was an extension of the first method to carrierdirections at any angle with the raster. The ED algo-rithm described determined the error distribution de-pendent on the local gradient of H(,u, v) and forwardedthe error along the smallest gradient. When using thisalgorithm, the actual carrier direction need not beknown to guarantee the orthogonal character of thephase and amplitude coding. In a recent article,Weissbach et al.10 showed that this method works bestfor carrier inclinations of 00, 450, and 900 correspond-ing to the raster. The 00 and 900 cases correspond toHauck's first method, and it is this method that is usedthroughout the comparison. Figure 2(b) shows theweighting coefficient for the horizontal carrier direc-tion.
D. Barnard's Method
"Optimal error diffusion for computer-generated holo-grams" was proposed by Barnard.7 In his approach,statistical evaluations of the spectrum of ED patternsled to the determination of optimum weighting coeffi-cients. The concept of coding the amplitude andphase in orthogonal directions was not explicitly incor-porated, but the method was supposed to generate theoptimum noise-free spectral region at the location ofthe reconstruction. The coefficients are shown in Fig.2(c), resulting in a noise-free area of 128 X 128 size atthe (1, 1) location of a 512 X 512 field.
IV. Edge-Enhanced Error Diffusion
The ED methods mentioned above use the same basicED concept. Modifications to this concept exist thatallow the enhancement/reduction of high frequencydetail.8 A straightforward method is the modificationof the thresholding. In the original ED method, thecorrected value H' is compared to the threshold, andthe error is set to be E = Hout - H', whereas edgeenhancement can be achieved by comparing the inputwith an input-dependent threshold. Figure 3 showsthis modification for the threshold being
T = (1 -K)H + /2K. (3)
For K = 2 as used in Fig. 3, this reduces to T = 1 - H.For K > 1, this threshold modification lowers thethreshold T at an upward edge (increasing H), therebyincreasing the probability of setting a bright pulse atthe upward edge. The opposite is true for a downwardedge, where the increase in the threshold lowers theprobability for a pulse to be set. This change in the
Output
it
n
LLLLLLLLIn
Fig. 3. Edge-enhanced ED algorithm. The constant threshold ofFig. 1 is replaced by a varying threshold Tof the form T = (1 - K)I +1/2K (here K = 2) with Irepresenting the input. The resultant pulsedistributions change depending on K, with the original ED algo-rithm reproduced for K = 1.
distribution of the pixels is correlated with the inputinformation and in this case introduces edge enhance-ment. For K < 1 the opposite effect is encountered,and edge detail is reduced. It is important to know,however, that the standard ED algorithm exhibits aninherent edge enhancement that is not caused bythreshold modifications.9 When the edge characteris-tic of the modified ED was measured, a value of K 0.5has been found experimentally to give the best averageedge representation without blurring or enhancing theedge. The input-dependent threshold reduces to thepublished methods for K = 1.
The original ED and Barnard methods were alsocompared, using seven different enhancements,whereas Hauck's methods were with only used twoenhancements. Note that the enhancement changesboth of Hauck's methods only slightly because theydistribute the error along an (ideally) zero gradient.
V. Computer Simulations
The first part of the comparison was done by computersimulations. This allowed evaluation of the methodswithout the influence of the nonperfect fabrication ofthe holograms. The image of a girl's face, 90 X 70pixels in size in one case and 128 X 128 in size in theother case, was used as the object for the simulations.A random phase generated by a standard randomnumber generator was superimposed onto the object,and the object was placed inside an array of 512 X 512pixels. The actual positions of the object inside thelarger array were different for each method, becausethe methods have different underlying assumptions.
3704 APPLIED OPTICS / Vol. 30, No. 26 / 10 September 1991
(a) Input
-1
Two measures were used to compare the differenttechniques. The first measure is the mean-squareerror (MSE), which was computed corresponding tothe formula
MSE oc fIn (fin) -(gun) 2 (4)
where (M) denotes the average of M, aM is the varianceof M, and f and g denote the functions to be compared.
In this way, the MSE calculation becomes indepen-dent of the actual brightness of the reconstruction aswell as any constant terms. The MSE and the bright-ness of the reconstruction can thus be evaluated inde-pendently. To avoid truncation errors, the recon-structions were compared with the reconstructions ofthe continuous CGH's and not with the original object.The MSE then reflects only the effects of the binarycoding and does not include the effects that are con-nected to the calculation of the continuous tone holo-gram. In the comparisons, the results were normal-ized by the value of the original ED method.
The second measure used in the comparison is theoverall brightness B of the reconstruction as calculatedby integrating the brightness B(x, y) over the recon-struction area R:
B = f B(x,y)dxdy.(XyER
(5)
The brightnesses of the reconstructions were also mea-sured relative to the brightness of the reconstructionfor the standard ED.
Brightness and reconstruction errors appear to begood measures of the performance of the coding of theholograms. Speckle characteristics and sensitivity todisturbances are strongly dependent on the phase dis-tributions used and are thus not a good measure of thecoding performance. The computational complexityis about the same for all encodings, so that computertimes can be neglected in the comparison.
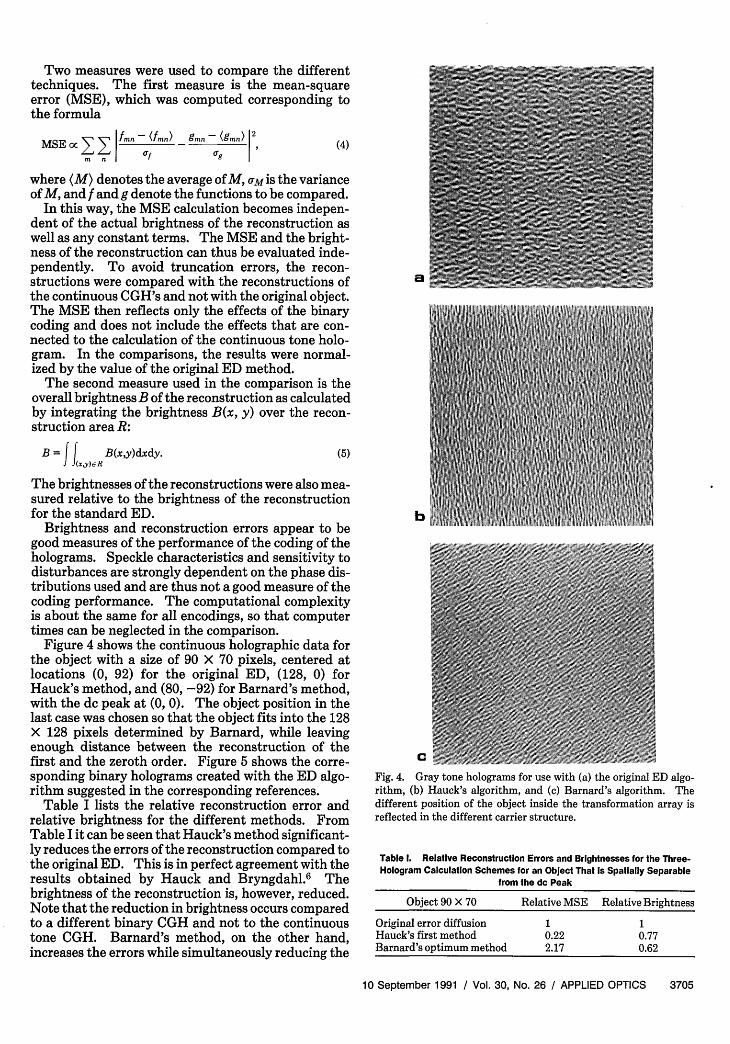
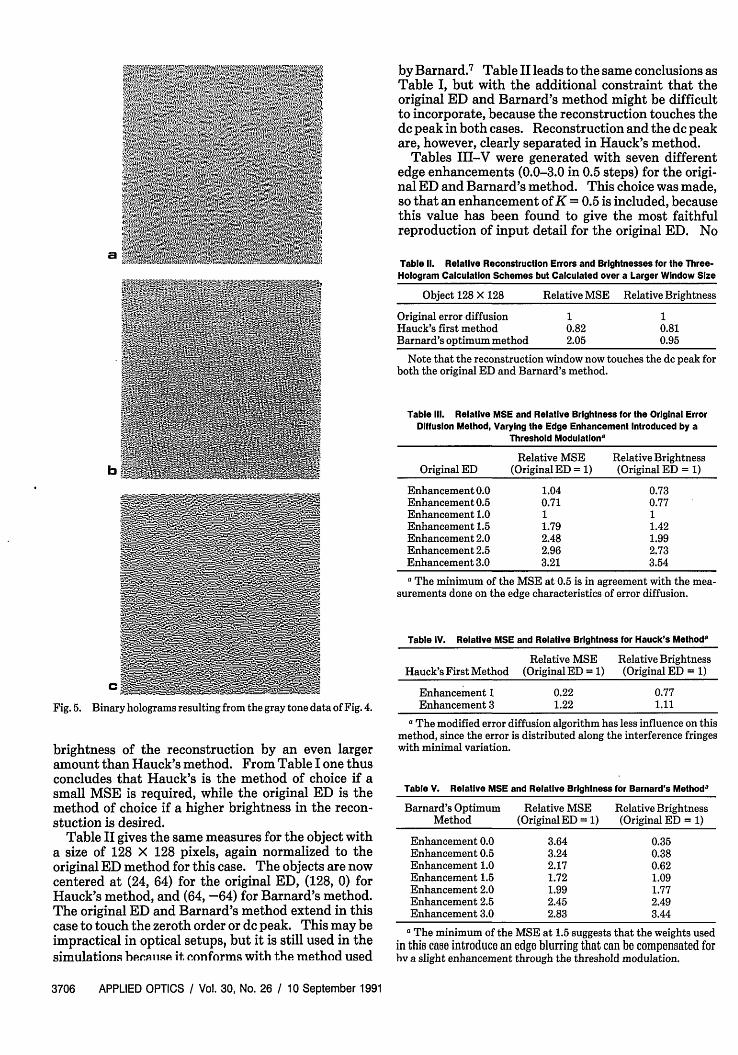
Figure 4 shows the continuous holographic data forthe object with a size of 90 X 70 pixels, centered atlocations (0, 92) for the original ED, (128, 0) forHauck's method, and (80, -92) for Barnard's method,with the dc peak at (0, 0). The object position in thelast case was chosen so that the object fits into the 128X 128 pixels determined by Barnard, while leavingenough distance between the reconstruction of thefirst and the zeroth order. Figure 5 shows the corre-sponding binary holograms created with the ED algo-rithm suggested in the corresponding references.
Table I lists the relative reconstruction error andrelative brightness for the different methods. FromTable I it can be seen that Hauck's method significant-ly reduces the errors of the reconstruction compared tothe original ED. This is in perfect agreement with theresults obtained by Hauck and Bryngdahl.6 Thebrightness of the reconstruction is, however, reduced.Note that the reduction in brightness occurs comparedto a different binary CGH and not to the continuoustone CGH. Barnard's method, on the other hand,increases the errors while simultaneously reducing the
b;
C ~ ~~~~
Fig. 4. Gray tone holograms for use with (a) the original ED algo-rithm, (b) Hauck's algorithm, and (c) Barnard's algorithm. Thedifferent position of the object inside the transformation array isreflected in the different carrier structure.
Table 1. Relative Reconstruction Errors and BrIghtnesses for the Three-Hologram Calculation Schemes for an Object That Is Spatially Separable
from the dc Peak
Object 90 X 70 Relative MSE Relative Brightness
Original error diffusion 1 1Hauck's first method 0.22 0.77Barnard's optimum method 2.17 0.62
10 September 1991 / Vol. 30, No. 26 / APPLIED OPTICS 3705
a
by Barnard.7 Table II leads to the same conclusions asTable I, but with the additional constraint that theoriginal ED and Barnard's method might be difficultto incorporate, because the reconstruction touches thedc peak in both cases. Reconstruction and the dc peakare, however, clearly separated in Hauck's method.
Tables III-V were generated with seven differentedge enhancements (0.0-3.0 in 0.5 steps) for the origi-nal ED and Barnard's method. This choice was made,so that an enhancement of K = 0.5 is included, becausethis value has been found to give the most faithfulreproduction of input detail for the original ED. No
a
b
C _
Fig. 5. Binary holograms resulting from the gray tone data of Fig. 4.
brightness of the reconstruction by an even largeramount than Hauck's method. From Table I one thusconcludes that Hauck's is the method of choice if asmall MSE is required, while the original ED is themethod of choice if a higher brightness in the recon-stuction is desired.
Table II gives the same measures for the object witha size of 128 X 128 pixels, again normalized to theoriginal ED method for this case. The objects are nowcentered at (24, 64) for the original ED, (128, 0) forHauck's method, and (64, -64) for Barnard's method.The original ED and Barnard's method extend in thiscase to touch the zeroth order or dc peak. This may beimpractical in optical setups, but it is still used in thesimulations hemrise it. conforms with the method used
Table II. Relative Reconstruction Errors and Brightnesses for the Three-Hologram Calculation Schemes but Calculated over a Larger Window Size
Object 128 X 128 Relative MSE Relative Brightness
Original error diffusion 1 1Hauck's first method 0.82 0.81Barnard's optimum method 2.05 0.95
Note that the reconstruction window now touches the dc peak forboth the original ED and Barnard's method.
Table Ill. Relative MSE and Relative Brightness for the Original ErrorDiffusion Method, Varying the Edge Enhancement Introduced by a
Threshold Modulatlona
Relative MSE Relative BrightnessOriginal ED (Original ED = 1) (Original ED = 1)
Enhancement 0.0 1.04 0.73Enhancement 0.5 0.71 0.77Enhancement 1.0 1 1Enhancement 1.5 1.79 1.42Enhancement 2.0 2.48 1.99Enhancement 2.5 2.96 2.73Enhancement 3.0 3.21 3.54
a The minimum of the MSE at 0.5 is in agreement with the mea-surements done on the edge characteristics of error diffusion.
Table IV. Relative MSE and Relative Brightness for Hauck's Methoda
Relative MSE Relative BrightnessHauck's First Method (Original ED = 1) (Original ED = 1)
Enhancement 1 0.22 0.77Enhancement 3 1.22 1.11
a The modified error diffusion algorithm has less influence on thismethod, since the error is distributed along the interference fringeswith minimal variation.
Table V. Relative MSE and Relative Brightness for Barnard's Methoda
Barnard's Optimum Relative MSE Relative BrightnessMethod (Original ED = 1) (Original ED = 1)
Enhancement 0.0 3.64 0.35Enhancement 0.5 3.24 0.38Enhancement 1.0 2.17 0.62Enhancement 1.5 1.72 1.09Enhancement 2.0 1.99 1.77Enhancement 2.5 2.45 2.49Enhancement 3.0 2.83 3.44
a The minimum of the MSE at 1.5 suggests that the weights usedin this case introduce an edge blurring that can be compensated forbv a slight enhancement through the threshold modulation.
3706 APPLIED OPTICS / Vol. 30, No. 26 / 10 September 1991
a
C
b
d
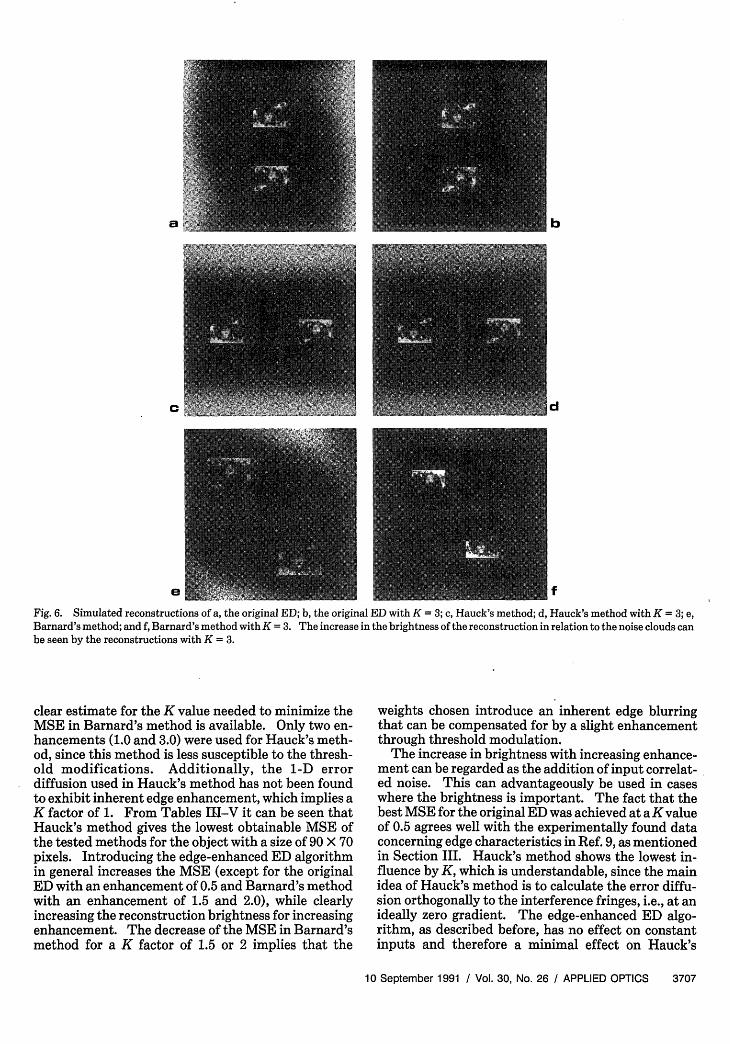
e A_ -f0 fFig. 6. Simulated reconstructions of a, the original ED; b, the original ED with K = 3; c, Hauck's method; d, Hauck's method with K = 3; e,Barnard's method; and f, Barnard's method with K = 3. The increase in the brightness of the reconstruction in relation to the noise clouds canbe seen by the reconstructions with K = 3.
clear estimate for the K value needed to minimize theMSE in Barnard's method is available. Only two en-hancements (1.0 and 3.0) were used for Hauck's meth-od, since this method is less susceptible to the thresh-old modifications. Additionally, the 1-D errordiffusion used in Hauck's method has not been foundto exhibit inherent edge enhancement, which implies aK factor of 1. From Tables III-V it can be seen thatHauck's method gives the lowest obtainable MSE ofthe tested methods for the object with a size of 90 X 70pixels. Introducing the edge-enhanced ED algorithmin general increases the MSE (except for the originalED with an enhancement of 0.5 and Barnard's methodwith an enhancement of 1.5 and 2.0), while clearlyincreasing the reconstruction brightness for increasingenhancement. The decrease of the MSE in Barnard'smethod for a K factor of 1.5 or 2 implies that the
weights chosen introduce an inherent edge blurringthat can be compensated for by a slight enhancementthrough threshold modulation.
The increase in brightness with increasing enhance-ment can be regarded as the addition of input correlat-ed noise. This can advantageously be used in caseswhere the brightness is important. The fact that thebest MSE for the original ED was achieved at a K valueof 0.5 agrees well with the experimentally found dataconcerning edge characteristics in Ref. 9, as mentionedin Section III. Hauck's method shows the lowest in-fluence by K, which is understandable, since the mainidea of Hauck's method is to calculate the error diffu-sion orthogonally to the interference fringes, i.e., at anideally zero gradient. The edge-enhanced ED algo-rithm, as described before, has no effect on constantinputs and therefore a minimal effect on Hauck's
10 September 1991 / Vol. 30, No. 26 / APPLIED OPTICS 3707
F t * M
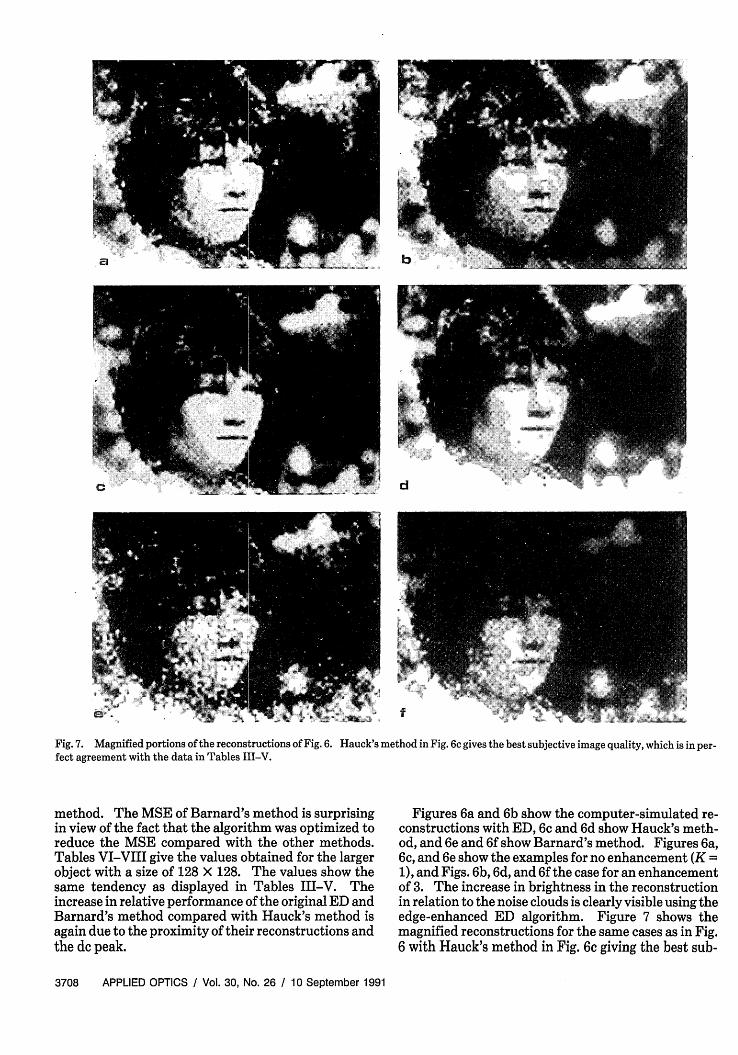
Fig. 7. Magnified portions of the reconstructions of Fig. 6.fect agreement with the data in Tables III-V.
method. The MSE of Barnard's method is surprisingin view of the fact that the algorithm was optimized toreduce the MSE compared with the other methods.Tables VI-VIII give the values obtained for the largerobject with a size of 128 X 128. The values show thesame tendency as displayed in Tables III-V. Theincrease in relative performance of the original ED andBarnard's method compared with Hauck's method isagain due to the proximity of their reconstructions andthe dc peak.
Hauck's method in Fig. 6c gives the best subjective image quality, which is in per-
Figures 6a and 6b show the computer-simulated re-constructions with ED, 6c and 6d show Hauck's meth-od, and 6e and 6f show Barnard's method. Figures 6a,6c, and 6e show the examples for no enhancement (K =1), and Figs. 6b, 6d, and 6f the case for an enhancementof 3. The increase in brightness in the reconstructionin relation to the noise clouds is clearly visible using theedge-enhanced ED algorithm. Figure 7 shows themagnified reconstructions for the same cases as in Fig.6 with Hauck's method in Fig. 6c giving the best sub-
3708 APPLIED OPTICS / Vol. 30, No. 26 / 10 September 1991
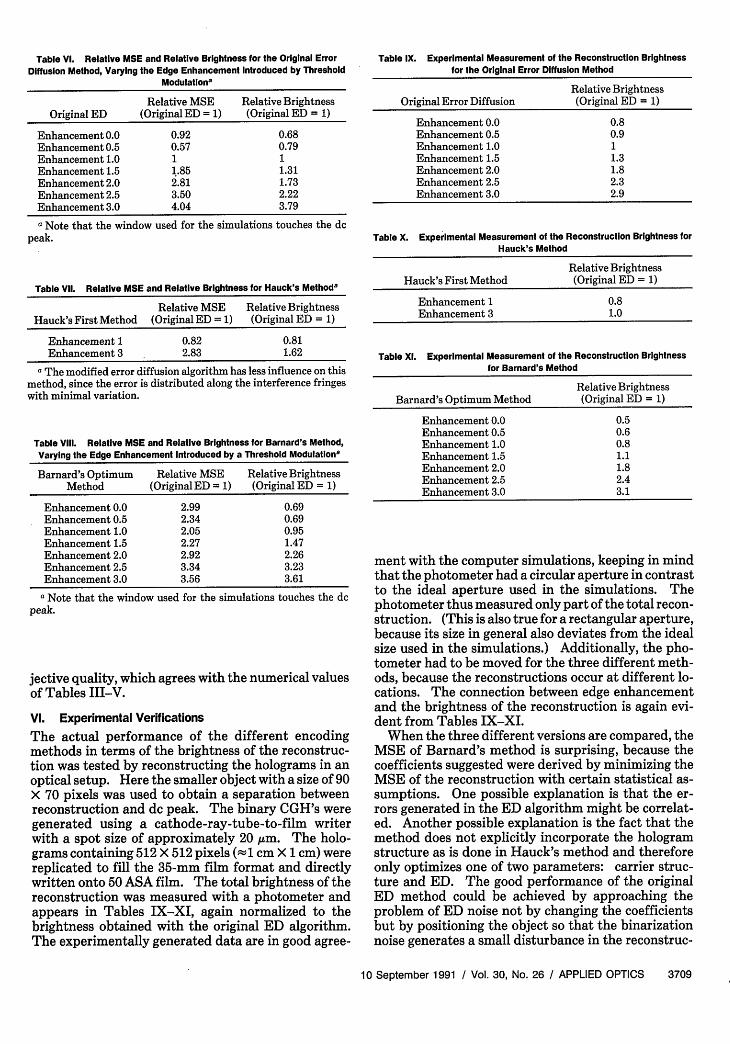
Table VI. Relative MSE and Relative Brightness for the Original ErrorDiffusion Method, Varying the Edge Enhancement Introduced by Threshold
Modulatlona
Relative MSE Relative BrightnessOriginal ED (Original ED = 1) (Original ED = 1)
Enhancement 0.0 0.92 0.68Enhancement 0.5 0.57 0.79Enhancement 1.0 1 1Enhancement 1.5 1.85 1.31Enhancement 2.0 2.81 1.73Enhancement 2.5 3.50 2.22Enhancement 3.0 4.04 3.79
a Note that the window used for the simulations touches the dcpeak.
Table Vii. Relative MSE and Relative Brightness for Hauck's Methoda
Relative MSE Relative BrightnessHauck's First Method (Original ED = 1) (Original ED = 1)
Enhancement 1 0.82 0.81Enhancement 3 2.83 1.62
a The modified error diffusion algorithm has less influence on thismethod, since the error is distributed along the interference fringeswith minimal variation.
Table Vil. Relative MSE and Relative Brightness for Barnard's Method,Varying the Edge Enhancement Introduced by a Threshold Modulatlona
Barnard's Optimum Relative MSE Relative BrightnessMethod (Original ED = 1) (Original ED = 1)
Enhancement 0.0 2.99 0.69Enhancement 0.5 2.34 0.69Enhancement 1.0 2.05 0.95Enhancement 1.5 2.27 1.47Enhancement 2.0 2.92 2.26Enhancement 2.5 3.34 3.23Enhancement 3.0 3.56 3.61
a Note that the window used for the simulations touches the dcpeak.
jective quality, which agrees with the numerical valuesof Tables III-V.
VI. Experimental Verifications
The actual performance of the different encodingmethods in terms of the brightness of the reconstruc-tion was tested by reconstructing the holograms in anoptical setup. Here the smaller object with a size of 90X 70 pixels was used to obtain a separation betweenreconstruction and dc peak. The binary CGH's weregenerated using a cathode-ray-tube-to-film writerwith a spot size of approximately 20 ,um. The holo-grams containing 512 X 512 pixels (-1 cm X 1 cm) werereplicated to fill the 35-mm film format and directlywritten onto 50 ASA film. The total brightness of thereconstruction was measured with a photometer andappears in Tables IX-XI, again normalized to thebrightness obtained with the original ED algorithm.The experimentally generated data are in good agree-
Table IX. Experimental Measurement of the Reconstruction Brightnessfor the Original Error Diffusion Method
Relative BrightnessOriginal Error Diffusion (Original ED = 1)
Enhancement 0.0 0.8Enhancement 0.5 0.9Enhancement 1.0 1Enhancement 1.5 1.3Enhancement 2.0 1.8Enhancement 2.5 2.3Enhancement 3.0 2.9
Table X. Experimental Measurement of the Reconstruction Brightness forHauck's Method
Relative BrightnessHauck's First Method (Original ED = 1)
Enhancement 1 0.8Enhancement 3 1.0
Table XI. Experimental Measurement of the Reconstruction Brightnessfor Barnard's Method
Relative BrightnessBarnard's Optimum Method (Original ED = 1)
Enhancement 0.0 0.5Enhancement 0.5 0.6Enhancement 1.0 0.8Enhancement 1.5 1.1Enhancement 2.0 1.8Enhancement 2.5 2.4Enhancement 3.0 3.1
ment with the computer simulations, keeping in mindthat the photometer had a circular aperture in contrastto the ideal aperture used in the simulations. Thephotometer thus measured only part of the total recon-struction. (This is also true for a rectangular aperture,because its size in general also deviates from the idealsize used in the simulations.) Additionally, the pho-tometer had to be moved for the three different meth-ods, because the reconstructions occur at different lo-cations. The connection between edge enhancementand the brightness of the reconstruction is again evi-dent from Tables IX-XI.
When the three different versions are compared, theMSE of Barnard's method is surprising, because thecoefficients suggested were derived by minimizing theMSE of the reconstruction with certain statistical as-sumptions. One possible explanation is that the er-rors generated in the ED algorithm might be correlat-ed. Another possible explanation is the fact that themethod does not explicitly incorporate the hologramstructure as is done in Hauck's method and thereforeonly optimizes one of two parameters: carrier struc-ture and ED. The good performance of the originalED method could be achieved by approaching theproblem of ED noise not by changing the coefficientsbut by positioning the object so that the binarizationnoise generates a small disturbance in the reconstruc-
10 September 1991 / Vol. 30, No. 26 / APPLIED OPTICS 3709
tion. This implicitly couples the weighting coefficientwith the carrier direction.
VII. Conclusions
Different ED methods for the generation of binaryFourier holograms have been compared. The compar-ison shows that the method suggested by Hauck andBryngdahl exhibits the lowest MSE of the testedmethods. The basic intention of this method is toencode the phase and amplitude information of thehologram in orthogonal directions to reduce the crosstalk generated by the nonlinear operation of binarizingthe hologram. The orthogonal encoding is common incell-oriented holograms, and the extension to point-oriented holograms resulted in the expected improve-ment over nonorthogonal codings. The method canalso be intuitively understood by regarding Eq. (2) andFigs. 4a-4c. The continuous holographic data exhibita cosine structure coupled to the carrier introduced.It is this structure of the hologram that has to be takeninto account in the binarization to produce a goodreconstruction in terms of a MSE measurement.
The original ED and Barnard's method exhibit larg-er errors in the reconstruction. In the case of theoriginal ED, this is somewhat compensated for by abrighter reconstruction. If the brightness of the re-construction is of relatively high importance comparedto the MSE, other modifications can be made. Onepossibility is the introduction of an edge-enhanced EDalgorithm that can be used with the weighting coeffi-cients suggested either by Floyd and Steinberg or byBarnard. This modification can increase the bright-ness in the above examples by a factor of 3 or more atthe cost of increasing the MSE. The edge-enhancedED thus offers a convenient tool to increase the bright-ness of the reconstruction strongly.
The ED has become an important tool in the binari-zation of CGH's. Different ED methods exist that areapplied to the field of CGH's. The selection of the ED
method, however, depends on the application, and nooverall optimal method has yet been published to ourknowledge. Different parameters, such as the MSE orthe brightness of the reconstruction, can be defined asquality metric for the ouput of the hologram, which inturn leads to different ED methods as compromises.The Hauck-Bryngdahl method has, for the exampledescribed here, provided the lowest MSE, and thismethod would thus be the method of choice for appli-cations where the MSE is important. Methods incor-porating edge enhancement, on the other hand, havebeen shown to give higher brightness in the reconstruc-tion and are thus adapted to a different set of applica-tions.
References
1. M. A. Seldowitz, J. P. Allebach, and D. W. Sweeney, "Synthesisof digital holograms by direct binary search," Appl. Opt. 26,2788-2798 (1987).
2. M. Broja, F. Wyrowski, and 0. Bryngdahl, "Digital halftoning byiterative procedure," Opt. Commun. 69, 205-210 (1989).
3. R. W. Floyd and L. Steinberg, "An adaptive algorithm for spatialgrey-scale," Proc. Soc. Inf. Disp. 17, 75-77 (1976).
4. S. Weissbach, F. Wyrowski, and 0. Bryngdahl, "Digital phaseholograms: coding and quantization with an error diffusionconcept," Opt. Commun. 72, 37-41 (1989).
5. J. A. G. Hale, "Dot spacing modulation for the production ofpseudo grey pictures," Proc. Soc. Inf. Disp. 17, 63-74 (1976).
6. R. Hauck and 0. Bryngdahl, "Computer-generated hologramswith pulse-density modulation," J. Opt. Soc. Am. A 1, 5-10(1984).
7. E. Barnard, "Optimal error diffusion for computer-generatedholograms," J. Opt. Soc. Am. A 5, 1803-1817 (1988).
8. R. Eschbach and K. T. Knox, "Error diffusion algorithm withedge enhancement," to be submitted to J. Opt. Soc. A.
9. K. T. Knox, "Measurement of edge enhancement in error diffu-sion," presented at the Society for Imaging Science and Tech-nology, SPSE Annual Meeting, Rochester, N.Y., May 1990.
10. S. Weissbach, F. Wyrowski, and 0. Bryngdahl, "Quantizationnoise in pulse density modulated holograms," Opt. Commun. 67,167-171 (1988).
3710 APPLIED OPTICS / Vol. 30, No. 26 / 10 September 1991