Embed Size (px)
Citation preview
1
Minnesota Department of Natural Resources Special Publication 161, January 2004
COMPARISON OF DAY ELECTROFISHING, NIGHT ELECTROFISHING, AND TRAP NETTING FOR SAMPLING INSHORE FISH
IN MINNESOTA LAKES1
Michael C. McInerny and Timothy K. Cross
Minnesota Department of Natural Resources 20596 Highway 7
Hutchinson, MN 55350 USA
Abstract. -- We compared fish samples collected with pulsed DC boom electrofishing during the day, the same type of electrofishing at night, and trap netting during four sampling periods (spring, early summer, late summer, and fall) in six Minnesota lakes. Night elec-trofishing captured 30 fish species, day electrofishing captured 27 species, and trap nets cap-tured 20 species in these lakes. Four species were captured most frequently with day electrofishing, 13 species were captured most frequently with night electrofishing, and 10 species were captured most frequently with trap nets. Trap nets usually caught larger golden shiner Notemigonus crysoleucas, yellow bullhead Ameiurus natalis, sunfish Lepomis spp., yellow perch Perca flavescens, and walleye Sander vitreus than either type of electrofishing. Both types of electrofishing captured similar sized individuals of all species. Based on catch per sample site, trap netting during spawning, also when aquatic macrophyte densities were low, effectively captured all three bullhead species and both crappie species, but this gear was ineffective for capturing largemouth bass Micropterus salmoides, smallmouth bass M. dolomieu, and all small nongame species during all times of the year. Both types of elec-trofishing were usually more effective in capturing most species during late summer or fall when submergent aquatic macrophyte densities were highest. However, day electrofishing was ineffective for capturing walleye, and both electrofishing times were ineffective in sam-pling either crappie species. We were also unable to determine the most effective sampling method because population densities and size structures of each fish species were unknown. However, adding either day or night electrofishing to standard lake surveys and population assessments would provide additional data on some fish taxa, especially sunfish and yellow perch, which could be missed with other gear.
1 This study was funded by the Minnesota Department of Natural Resources and by the Federal Aid in Sport Fishing Restoration (Dingell-Johnson) Program, D-J Project F-26-R, Minnesota, Study 617.
2
Introduction Pulsed DC electrofishing during the day and night, and trap netting have been used for sampling fish in littoral areas in Minnesota lakes during spring, summer, or fall (MNDNR 1993), but data on size-selectivity, relative capture efficiencies, or temporal trends are known for only a few species. Each gear cap-tures many different species, but we know of no study addressing species selectivity of these gears in Minnesota lakes. Furthermore, few or no data on relative size-selectivity, relative catch rates, and temporal trends in catch per unit effort (CPUE) have been col-lected for many species.
Species- and size-selectivity, as well as CPUE differ between trap netting, day elec-trofishing, or night electrofishing, but simulta-neous comparisons of these gears have not been done. Night electrofishing captured more Lepomis spp. and Micropterus spp. than gill nets or hoop nets in a Missouri reservoir, but these nets captured more gizzard shad Dorosoma cepedianum, white bass Morone chrysops, white crappie Pomoxis annularis, and freshwater drum Aplodinotus grunniens (Witt and Campbell 1959). Night electrofish-ing in midwestern rivers also captured more fish species than day electrofishing (Sanders 1992). Electrofishing usually selects for in-termediate-sized individuals or larger indi-viduals of several species (Reynolds and Simpson 1978; Bayley and Austen 2002; Do-lan and Miranda 2003), and trap nets in Michigan lakes selected for larger individuals of several species (Latta 1959; Laarman and Ryckman 1982). Size structure of largemouth bass Micropterus salmoides in day and night electrofishing samples in southern reservoirs usually did not differ (Malvestuto and Sonski 1990), but day electrofishing caught larger sauger Sander canadensis than night elec-trofishing (Van Zee et al. 1996). Overall, night electrofishing CPUE of many fish spe-cies exceeds day CPUE, but the converse is true for other species, and oftentimes CPUE does not differ (Witt and Campbell 1959; Malvestuto and Sonski 1990; Van Zee et al. 1996; Dumont and Dennis 1997; Pierce et al. 2001).
Relative abundance estimates in trap net and electrofishing samples also vary tem-porally, but we know of no study that ad-dressed temporal variation in the number of species caught. Temporal variation in trap net CPUE was documented for northern pike Esox lucius, bluegill, black crappie Pomoxis nigro-maculatus, yellow perch Perca flavescens and walleye Sander vitreus (Bettross and Willis 1988; Guy and Willis 1991), but trends dif-fered among species and water bodies. Night electrofishing CPUE of bluegill and large-mouth bass also vary temporally (Bettross and Willis 1988; Malvestuto and Sonski 1990; Van Horn et al. 1991), and trends also differed between species and water bodies. Temporal variation of other species in trap nets or both types of electrofishing have not been docu-mented. Historically, the Minnesota Depart-ment of Natural Resources (MNDNR) has used double-frame trap nets to sample fish populations in littoral areas of Minnesota lakes. However, net dimensions of MNDNR trap nets usually differed from those of trap nets evaluated in other studies. The MNDNR began using electrofishing in the early 1990s almost exclusively for sampling largemouth and smallmouth bass in spring, and age 0 and 1 walleye in fall. Because other studies showed that electrofishing captures many spe-cies, this gear should be evaluated for sam-pling species in Minnesota lakes other than walleye and largemouth bass. Electrofishing probably captures different inshore fish spe-cies at different sizes and rates than trap nets, and electrofishing catches will probably differ dielly. Therefore, our objective was to com-pare species selectivity, size selectivity, and capture efficiencies of inshore fish species sampled with day electrofishing, night elec-trofishing, and trap netting during four differ-ent times of the year.
Study Area
Sampling took place in Lakes Erie (Meeker County), Stahls (McLeod County), and Granite, French, Cokato, and Mary (Wright County). Each lake is representative of MNDNR Lake Class 24 (MNDNR unpub-
3
lished data). Surface areas ranged from 58 to 224 ha, mean depths from 4.1 to 6.5 m, Secchi depths from 1.0 to 1.9 m, and specific conduc-tance from 220 to 550 µS/cm among lakes (MNDNR unpublished data; Cross and McIn-erny 2001). Submergent aquatic macrophytes exist in littoral areas of each lake, and areal densities in early summer, late summer, and fall exceeded densities in spring in each lake (Cross and McInerny 2001). Submergent macrophyte stands in Erie, Stahls, Granite, and Mary lakes were much denser than stands in French and Cokato lakes. French, Stahls, Granite and Mary lakes had some cattail Ty-pha spp. fringes along the shoreline, but other emergent species were rare or nonexistent (Cross and McInerny 2001).
Methods
Sample collection We collected trap net and electrofish-ing samples from the same five to eight sites during four sample periods (spring, early summer, late summer, and fall) in each lake. Five sites were sampled at Cokato lake, six sites were sampled at Mary Lake, seven sites were sampled at French, Granite, and Erie lakes, and eight sites were sampled at Stahls Lake. We located sample sites with the aid of a global positioning system. We defined spring as late April to mid-May, early summer as late June to early July, late summer as late July and August, and fall as late September to early October. We sampled Lakes Erie and French in 1997, Lakes Stahls and Cokato in 1998, and Lakes Granite and Mary in 1999. Water temperatures at the surface ranged from 9 to 19 oC in spring, 22 to 26 oC in early sum-mer, 19 to 25 oC in late summer, and 17 to 20 oC in fall. We used three different electrofishing boats in this study. The first boat, used only on Erie and French lakes, was equipped with a Smith-Root GPP 5.0 electrofisher, and an an-ode consisting of six cables suspended from a single boom. A backup boat, equipped with a Coffelt VVP-15 electroshocker and an anode with four cables suspended from a boom par-allel to the bow, was used on these two lakes during the late summer period because of equipment failure on the first boat. The third
boat was also outfitted with a Smith-Root GPP 5.0 electrofisher, but this boat had two anodes each consisting of four cables suspended from single booms. We used this third boat to col-lect all electrofishing samples in the other four lakes. Hulls served as cathodes on each boat. We applied sufficient power (0.8 to 2.4 KW pulsed DC, 60 Hz, 1 to 6 ms pulse duration on the electrofishers) into the water so that fish exhibited similar electroshock response re-gardless of which boat was used. All elec-trofishing runs consisted of a zigzag pattern ranging from 0.5 to 2 m in depth, and each run lasted five min. The same person did all the dip netting (0.95-cm bar mesh net), and this individual attempted to capture all fish that surfaced. All night electrofishing was done within two days after day electrofishing.
Trap nets (two 0.9 x1.8 m frames, six 0.9-m diameter hoops on codend, a single 12.2 x 0.9 m lead, 1.9-cm bar mesh netting) were set perpendicular to shore (MNDNR 1993). Within each lake and sample period, all nets were set on the same day, and we emptied all fish from each net about 20 to 24 h after set-ting. Trap netting was done within 1 to 13 d (mean 5 d) of electrofishing.
All fish captured with each method at each site were identified to species and counted, and we measured to the nearest cm total length (TL) of up to 50 randomly se-lected individuals of all game species and lar-ger nongame species. We counted but did not measure small nongame species in which adults seldom exceed 10 cm TL.
Data analyses
We determined for each method the percent of sample periods when at least one individual of each fish species was captured, and the number of species captured per sample site for each gear within each sample period and lake. We used a full factorial three-way analysis of variance (ANOVA) to determine if numbers of species captured differed signifi-cantly (P < 0.05) between sampling gears in all lakes and sampling periods. The dependent variable was the number of species per site, and the independent variables were sampling gear, sample period, and lake. Sample period was categorized as an ordinal variable and the other two independent variables were catego-

4
rized as nominal. Detection of significant gear*lake, gear*period, or gear*lake*sample period interactions would indicate that one or more sampling gears captured species incon-sistently among sampling periods or lakes. We used Tukey’s Honestly Significant Differ-ence (HSD) tests to identify the gears, sample periods, or lakes where numbers of species captured differed (Snedecor and Cochran 1980; SAS 2002).
To determine relative size-selectivity of each gear for each species, we calculated minimum, median, and maximum lengths, and mean length ranges of each fish species cap-tured in each gear during each sample period within each lake. One-way ANOVAs were used to determine if minimum lengths, median lengths, maximum lengths, and length ranges of each species differed significantly among sampling gears (Snedecor and Cochran 1980). Because size and distribution of populations of all species were expected to change with time within lakes and differ among lakes, we in-cluded only those sample periods when indi-viduals of a given species were captured in all three gears. If length parameters differed sig-nificantly, we then used Tukey’s HSD tests to determine where the difference occurred (Snedecor and Cochran 1980; SAS 2002).
Lastly, we determined if catch per sample site (CPS) differed among sampling gears, sample periods, and lakes. We calcu-lated for each sampling gear the total catch (number/5 min for day and night electrofish-ing; number/lift for trap netting) per sample site for all captured species. Because elec-trofishing and trap netting is size-selective for some fish species (Latta 1959; Laarman and Ryckman 1982; Bayley and Austen 2002; Do-lan and Miranda 2003; others), we calculated CPS for two length groups of each game and larger nongame species. We used stock-size lengths for separating individuals into these two groups (Anderson and Newmann 1996; Bister et al. 2000), and used the most recent stock-size length for those species listed in both references. Those individuals shorter than stock length were defined as small, and individuals longer than stock length were de-fined as large. We defined as small all golden shiner Notemigonus crysoleucas < 8 cm and
bowfin Amia calva < 25 cm because stock-size criteria were not established for these species.
Full factorial ANOVAs were used to determine if CPS of each small nongame spe-cies and if CPS of each length group of game and larger nongame species differed between sampling gear, sample period, and lakes (Snedecor and Cochran 1980; SAS 2002). Preliminary analyses on all species failed to detect significant sample site effects on CPS, thus CPS behaved in random fashions. Catch per site was the dependent variable, and all CPS data were transformed into natural loga-rithms (catch +1). Sampling period was cate-gorized as an ordinal variable, and gear and lake were categorized as nominal variables. We excluded from ANOVA the effects of in-dividual gears and lakes if less than five indi-viduals of a particular species were captured in that gear or lake. Detection of gear*sample period, gear*lake, or gear*lake*sample period interactions would indicate inconsistent trends in CPS among gears. A Tukey’s HSD test was done for each significant three-way and two-way interaction and for each significant main effect when no significant interactions were detected with ANOVA in order to iden-tify the gear(s), sample period(s), or lake(s) where CPS differed (Snedecor and Cochran 1980; SAS 2002).
We constructed figures of CPS data to reflect the ANOVA results. For significant three-way interactions, we presented mean CPS for each gear during each sample period within each lake where that species or length group was sampled. Although only one Tukey’s HSD test was done for each signifi-cant three-way interaction, we expected CPS to differ among lakes. Thus, we partitioned the figures by lake rather than rank in a single figure each mean CPS calculated for each gear*sample period*lake group. Therefore, these figures show only the Tukey’s HSD tests for each gear and sample period comparison within lakes, but we chose not to identify the lakes where CPS differed. For figures depict-ing significant two-way interactions, we calcu-lated mean CPS representing one main effect grouped by the other main effect involved in the interaction. For example, we used all CPS data from each lake where that species was collected to calculate mean CPS for each gear

5
within each sample period when the ANOVA detected a gear*sample period interaction. If no significant interaction or main effect, or if only main effects were found to be significant, we used all CPS data from those lakes where the species was captured to calculate mean CPS grouped by the appropriate main effect.
Results and Discussion
Species-selectivity A total of 31 fish species were
captured with at least one sampling gear in all lakes combined (Table 1). The most species were collected with night electrofishing (30) followed by day electrofishing (27) and trap netting (20). Trap nets rarely captured the small minnow species, central mudminnow, tadpole madtom, brook silverside, banded kil-lifish, or brook stickleback. Day electrofish-ing captured fathead minnow, central mudminnow, banded killifish, and Iowa darter most often, and trap nets captured bowfin, golden shiner, silver redhorse, golden red-horse, all three bullhead species, green sun-fish, and pumpkinseed more often than either day or night electrofishing. Night electrofish-ing captured 13 species most frequently, and 6 species were captured with the same fre-quency in two or all gears.
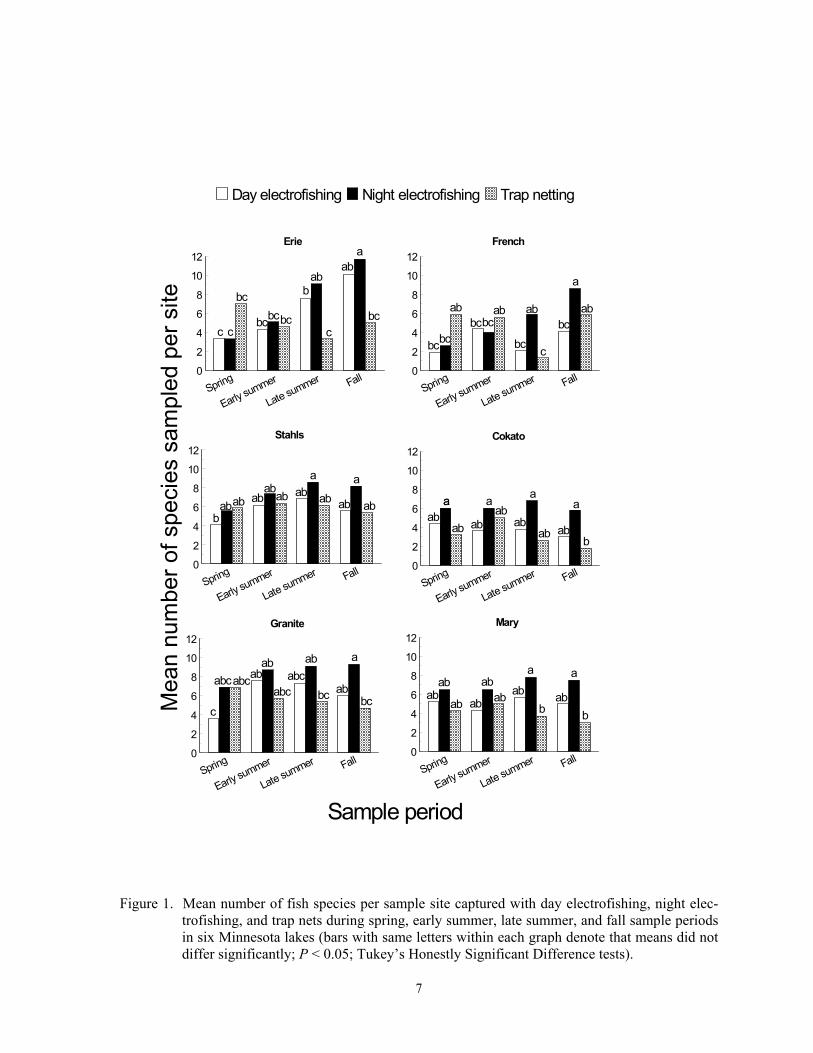
Species richness varied incon-sistently among sampling gears, sample peri-ods, and lakes, suggested by the strong gear*sample period*lake interaction (F = 2.74; df = 30, 479; P < 0.0001) effect on mean number of species captured per site. The most species (mean = 11.7) were captured with night electrofishing during fall at Lake Erie, and the fewest (mean = 1.3) were captured with trap nets during late summer at French Lake (Figure 1). The most species were usu-ally captured with night electrofishing in late summer or fall in all lakes, but trap nets cap-tured the most species during spring in three lakes. More species were captured with night electrofishing than day electrofishing during all sample periods in all lakes except at French Lake in early summer, but mean number of species caught seldom differed significantly between these two gears in most sample peri-ods and lakes. Night electrofishing in two natural lakes in Iowa also captured more fish
species than day electrofishing, and night elec-trofishing captured similar numbers of species as large beach seines (Pierce et al. 2001). Temporally, we captured fewer species with day and night electrofishing in spring than in fall at Lake Erie and captured fewer species with night electrofishing in spring than in fall at French Lake. Trap nets captured more spe-cies in spring than during late summer in French Lake, but no other temporal trends were detected in the other five lakes (Figure 1).
Mesh size differences be-tween the dip net and webbing of trap nets and fish coloration influenced species richness estimates determined with both electrofishing times and trap netting. Most of the small non-game fishes do not reach sizes large enough to be captured and retained in trap nets with 1.9-cm mesh, but they do reach sufficient sizes to be captured in dip nets with 0.95 mesh netting (Eddy and Underhill 1974; Becker 1983). Spottail shiner in an Iowa lake were captured in trap nets with identical dimensions as our nets, but with 1.3-cm mesh webbing (Stang and Hubert 1984). Dippers must see fish in order to capture them, and dark or dull colored fish species are less likely to be captured with electrofishing than brightly colored or shiny fish species. Therefore, dark or dull colored species such as banded killifish, tadpole mad-tom, all three bullhead species, Iowa darter, and johnny darter will probably be caught less frequently than brightly colored fishes such as bluntnose minnow, spottail shiner, bluegill, and yellow perch if densities are similar. High densities of aquatic macrophytes may have contributed to improved species richness in the later sample periods in day and night electrofishing. Conversely, higher den-sity of aquatic macrophytes could have im-peded capture efficiency in trap netting. Higher species richness occurs in vegetated compared to non-vegetated areas in north temperate waters, and 17 species captured in this study have some or strong affinities to-wards aquatic vegetation (Becker 1983; Poe et al. 1986; Brazner and Beals 1997; Weaver et al. 1997; Drake and Pereira 2002).
6
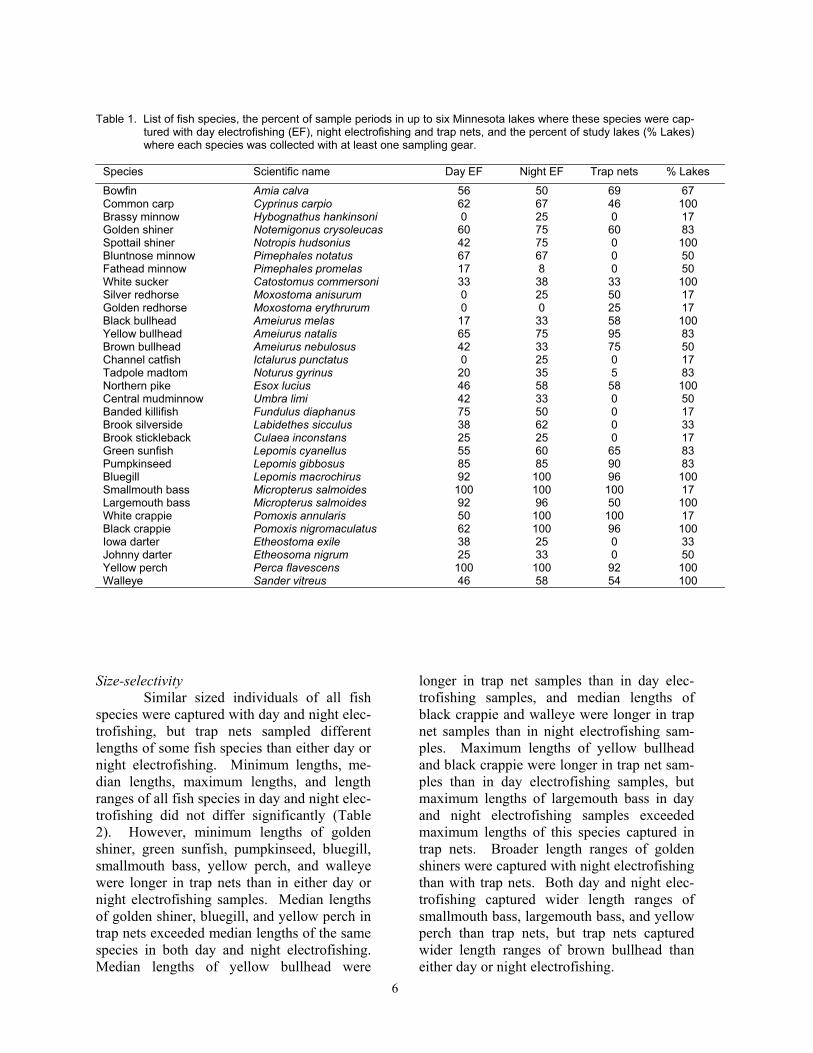
Table 1. List of fish species, the percent of sample periods in up to six Minnesota lakes where these species were cap-
tured with day electrofishing (EF), night electrofishing and trap nets, and the percent of study lakes (% Lakes) where each species was collected with at least one sampling gear.
Species Scientific name Day EF Night EF Trap nets % Lakes
Bowfin Amia calva 56 50 69 67 Common carp Cyprinus carpio 62 67 46 100 Brassy minnow Hybognathus hankinsoni 0 25 0 17 Golden shiner Notemigonus crysoleucas 60 75 60 83 Spottail shiner Notropis hudsonius 42 75 0 100 Bluntnose minnow Pimephales notatus 67 67 0 50 Fathead minnow Pimephales promelas 17 8 0 50 White sucker Catostomus commersoni 33 38 33 100 Silver redhorse Moxostoma anisurum 0 25 50 17 Golden redhorse Moxostoma erythrurum 0 0 25 17 Black bullhead Ameiurus melas 17 33 58 100 Yellow bullhead Ameiurus natalis 65 75 95 83 Brown bullhead Ameiurus nebulosus 42 33 75 50 Channel catfish Ictalurus punctatus 0 25 0 17 Tadpole madtom Noturus gyrinus 20 35 5 83 Northern pike Esox lucius 46 58 58 100 Central mudminnow Umbra limi 42 33 0 50 Banded killifish Fundulus diaphanus 75 50 0 17 Brook silverside Labidethes sicculus 38 62 0 33 Brook stickleback Culaea inconstans 25 25 0 17 Green sunfish Lepomis cyanellus 55 60 65 83 Pumpkinseed Lepomis gibbosus 85 85 90 83 Bluegill Lepomis macrochirus 92 100 96 100 Smallmouth bass Micropterus salmoides 100 100 100 17 Largemouth bass Micropterus salmoides 92 96 50 100 White crappie Pomoxis annularis 50 100 100 17 Black crappie Pomoxis nigromaculatus 62 100 96 100 Iowa darter Etheostoma exile 38 25 0 33 Johnny darter Etheosoma nigrum 25 33 0 50 Yellow perch Perca flavescens 100 100 92 100 Walleye Sander vitreus 46 58 54 100
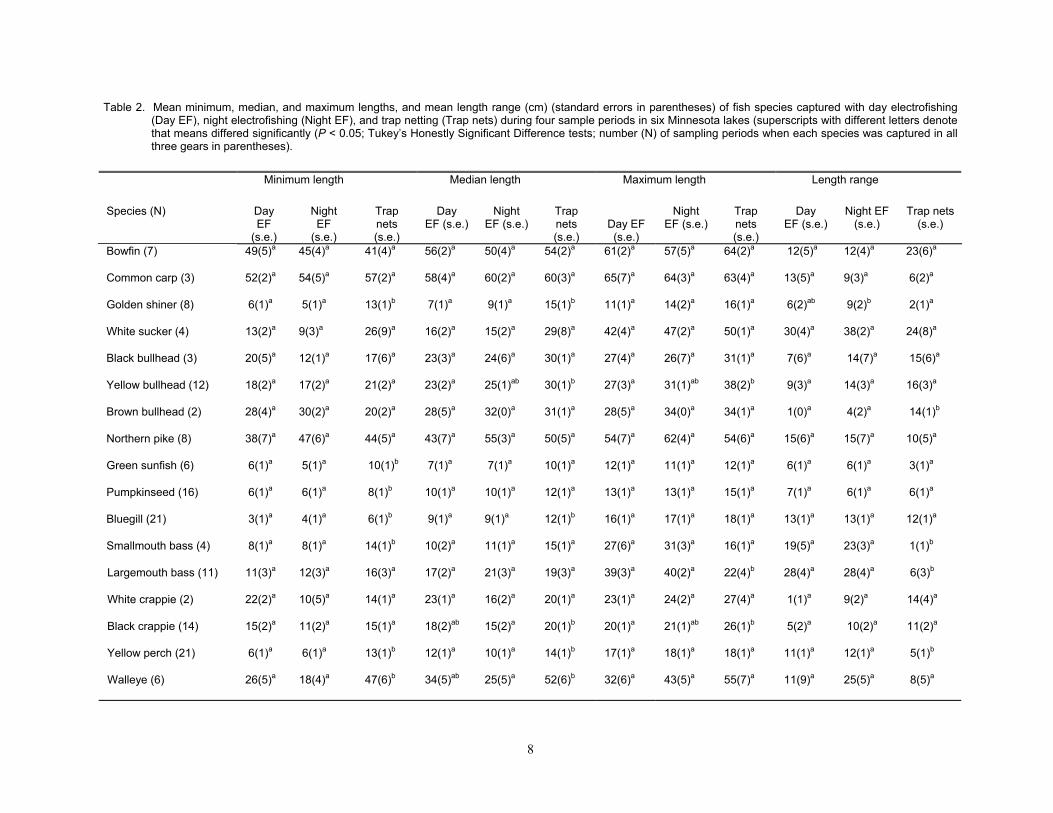
Size-selectivity
Similar sized individuals of all fish species were captured with day and night elec-trofishing, but trap nets sampled different lengths of some fish species than either day or night electrofishing. Minimum lengths, me-dian lengths, maximum lengths, and length ranges of all fish species in day and night elec-trofishing did not differ significantly (Table 2). However, minimum lengths of golden shiner, green sunfish, pumpkinseed, bluegill, smallmouth bass, yellow perch, and walleye were longer in trap nets than in either day or night electrofishing samples. Median lengths of golden shiner, bluegill, and yellow perch in trap nets exceeded median lengths of the same species in both day and night electrofishing. Median lengths of yellow bullhead were
longer in trap net samples than in day elec-trofishing samples, and median lengths of black crappie and walleye were longer in trap net samples than in night electrofishing sam-ples. Maximum lengths of yellow bullhead and black crappie were longer in trap net sam-ples than in day electrofishing samples, but maximum lengths of largemouth bass in day and night electrofishing samples exceeded maximum lengths of this species captured in trap nets. Broader length ranges of golden shiners were captured with night electrofishing than with trap nets. Both day and night elec-trofishing captured wider length ranges of smallmouth bass, largemouth bass, and yellow perch than trap nets, but trap nets captured wider length ranges of brown bullhead than either day or night electrofishing.
7
Stahls
Spring
Early summer
Late summer Fall0
2
4
6
8
10
12
French
Spring
Early summer
Late summer Fall0
2
4
6
8
10
12
Cokato
Spring
Early summer
Late summer Fall0
2
4
6
8
10
12
Granite
Spring
Early summer
Late summer Fall0
2
4
6
8
10
12Mary
Spring
Early summer
Late summer Fall0
2
4
6
8
10
12
Erie
Spring
Early summer
Late summer Fall0
2
4
6
8
10
12ab
ab
abbc
bcbcbc
bc
bcc
bcc
a
abab ab
ab
bcbcc
bc cbc
aab abab abababab ab ab
b
a
a
aa a
ab
c
a
abab
abab ab
ab
abab
ababc
a
bc
b
ab
bc
abcabcabc
aab ab
abab abababab
a
bb
Day electrofishing Night electrofishing Trap netting
Sample period
Mea
n nu
mbe
r of s
peci
es s
ampl
ed p
er s
ite
Figure 1. Mean number of fish species per sample site captured with day electrofishing, night elec-
trofishing, and trap nets during spring, early summer, late summer, and fall sample periods in six Minnesota lakes (bars with same letters within each graph denote that means did not differ significantly; P < 0.05; Tukey’s Honestly Significant Difference tests).
8
Table 2. Mean minimum, median, and maximum lengths, and mean length range (cm) (standard errors in parentheses) of fish species captured with day electrofishing (Day EF), night electrofishing (Night EF), and trap netting (Trap nets) during four sample periods in six Minnesota lakes (superscripts with different letters denote that means differed significantly (P < 0.05; Tukey’s Honestly Significant Difference tests; number (N) of sampling periods when each species was captured in all three gears in parentheses).
Minimum length Median length Maximum length Length range
Species (N) Day EF
(s.e.)
Night EF
(s.e.)
Trap nets (s.e.)
Day EF (s.e.)
Night EF (s.e.)
Trap nets (s.e.)
Day EF (s.e.)
Night EF (s.e.)
Trap nets (s.e.)
Day EF (s.e.)
Night EF (s.e.)
Trap nets (s.e.)
Bowfin (7) 49(5)a 45(4)a 41(4)a 56(2)a 50(4)a 54(2)a 61(2)a 57(5)a 64(2)a 12(5)a 12(4)a 23(6)a
Common carp (3) 52(2)a 54(5)a 57(2)a 58(4)a 60(2)a 60(3)a 65(7)a 64(3)a 63(4)a 13(5)a 9(3)a 6(2)a
Golden shiner (8) 6(1)a 5(1)a 13(1)b 7(1)a 9(1)a 15(1)b 11(1)a 14(2)a 16(1)a 6(2)ab 9(2)b 2(1)a
White sucker (4) 13(2)a 9(3)a 26(9)a 16(2)a 15(2)a 29(8)a 42(4)a 47(2)a 50(1)a 30(4)a 38(2)a 24(8)a
Black bullhead (3) 20(5)a 12(1)a 17(6)a 23(3)a 24(6)a 30(1)a 27(4)a 26(7)a 31(1)a 7(6)a 14(7)a 15(6)a
Yellow bullhead (12) 18(2)a 17(2)a 21(2)a 23(2)a 25(1)ab 30(1)b 27(3)a 31(1)ab 38(2)b 9(3)a 14(3)a 16(3)a
Brown bullhead (2) 28(4)a 30(2)a 20(2)a 28(5)a 32(0)a 31(1)a 28(5)a 34(0)a 34(1)a 1(0)a 4(2)a 14(1)b
Northern pike (8) 38(7)a 47(6)a 44(5)a 43(7)a 55(3)a 50(5)a 54(7)a 62(4)a 54(6)a 15(6)a 15(7)a 10(5)a
Green sunfish (6) 6(1)a 5(1)a 10(1)b 7(1)a 7(1)a 10(1)a 12(1)a 11(1)a 12(1)a 6(1)a 6(1)a 3(1)a
Pumpkinseed (16) 6(1)a 6(1)a 8(1)b 10(1)a 10(1)a 12(1)a 13(1)a 13(1)a 15(1)a 7(1)a 6(1)a 6(1)a
Bluegill (21) 3(1)a 4(1)a 6(1)b 9(1)a 9(1)a 12(1)b 16(1)a 17(1)a 18(1)a 13(1)a 13(1)a 12(1)a
Smallmouth bass (4) 8(1)a 8(1)a 14(1)b 10(2)a 11(1)a 15(1)a 27(6)a 31(3)a 16(1)a 19(5)a 23(3)a 1(1)b
Largemouth bass (11) 11(3)a 12(3)a 16(3)a 17(2)a 21(3)a 19(3)a 39(3)a 40(2)a 22(4)b 28(4)a 28(4)a 6(3)b
White crappie (2) 22(2)a 10(5)a 14(1)a 23(1)a 16(2)a 20(1)a 23(1)a 24(2)a 27(4)a 1(1)a 9(2)a 14(4)a
Black crappie (14) 15(2)a 11(2)a 15(1)a 18(2)ab 15(2)a 20(1)b 20(1)a 21(1)ab 26(1)b 5(2)a 10(2)a 11(2)a
Yellow perch (21) 6(1)a 6(1)a 13(1)b 12(1)a 10(1)a 14(1)b 17(1)a 18(1)a 18(1)a 11(1)a 12(1)a 5(1)b
Walleye (6) 26(5)a 18(4)a 47(6)b 34(5)ab 25(5)a 52(6)b 32(6)a 43(5)a 55(7)a 11(9)a 25(5)a 8(5)a

9
Size selectivity differences in this study were usually similar to that observed in other studies. Size structure estimates of largemouth bass in day and night electrofish-ing samples in other Minnesota lakes usually did not differ (McInerny and Cross 1996). Trap nets with 1.3–cm mesh captured longer minimum lengths and narrower length ranges of smallmouth bass than night electrofishing in natural South Dakota lakes (Milewski and Willis 1991). Proportional stock density (PSD) of bluegill was higher in modified fyke net samples than in night electrofishing sam-ples (Kruse 1993). In Tennessee reservoirs, larger black crappie and white crappie were captured with day electrofishing than with 1.3-cm mesh trap nets (Sammons et al. 2002), which differed from our results.
Mesh size differences between dip nets and webbing of trap nets and size-related escapement behavior affected species- and size-selectivity between electrofishing and trap netting. For some species, mesh size re-duction in trap nets would likely reduce differ-ences in size selectivity between trap netting and electrofishing. Double-frame trap nets with smaller mesh sizes captured smaller bluegill and white crappie than trap nets of the same dimensions, but with larger mesh sizes (Willis et al. 1984; Jackson and Bauer 2000). Smaller individuals of white sucker and pumpkinseed exhibited better escapement from trap nets than larger individuals (Patri-arch 1968), which also contributed to greater size-selectivity in trap nets.
Catch per sample site
Catch per sample site differed among species, gears, sample periods and lakes (Fig-ures 2-24), and these differences were due to fish behavior and physical attributes of each species. Each gear captured more individuals of some species, at least during some sampling periods, than the other two gears, and we re-port below specific details for most of the spe-cies captured in this study. In general, CPS in all gears was a function of fish behavior that brought them within 15 m of shore and into water depths < 2 m. Catch per sample site in trap netting is also a function of the likelihood of a fish actively encountering the net, the
likelihood of becoming captured, and the like-lihood of being retained in the net until lifted (Hubert 1996). Conversely, electrofishing CPS relies on the gear encountering either ac-tive or inactive fish, adequate power transfer from water to fish, reaction of the fish to the boat, and the ability of the dipper to see and net the fish (Reynolds 1996; Miranda and Do-lan 2003).
Temporal variation in CPS in all gears was linked to either spawning behavior, changes in macrophyte coverages, recruit-ment, mortality, or other factors. Spawning brings many fish into shallow water where they become vulnerable to each gear. Fur-thermore, increased fish activity from prespawning or spawning probably increases encounter probabilities to trap netting, which in turn increases CPS. Changing macrophyte densities in each lake affected trap net and electrofishing catchability of many species because it changed the amount of cover. Elec-trofishing catchability of largemouth bass is optimal at moderate coverages and is lower when cover is sparse or excessively dense (Reynolds and Simpson 1978; Reynolds 1996). Conversely, Bayley and Austen (2002) reported lower catchability of common carp, green sunfish, bluegill and largemouth bass with day AC electrofishing when aquatic macrophyte coverages were about 50% com-pared to coverages of near zero. However, many species sampled in this study rely on aquatic macrophytes for foraging and cover (Eddy and Underhill 1974; Becker 1983). Thus, increased encounter rates could offset decreased catchability when macrophyte den-sities were high. High macrophyte densities could also decrease encounter probabilities towards trap netting by physically impeding movement of fish or by competing as addi-tional cover. Trap nets set in water with little cover may attract cover-seeking fish (Hubert 1996). Mortality can explain decreased CPS from spring to fall, and recruitment can ex-plain increases in CPS during the same time period. Lastly, other factors such as forage, thermal preferences, turbidity, and photope-riod also affect temporal trends in CPS (Hall and Werner 1977; Pope and Willis 1996).
10
Bowfin
Sampling with any of the gears during early summer captured the most bowfin > 25 cm, but we rarely captured bowfin < 25 cm with any gear at any lake. Catch per sample site of bowfin > 25 cm did not differ among the three sampling gears (F = 2.43; df = 2, 263; P = 0.0901), but differed among sample periods in the three lakes where captured (F = 5.57; df = 3, 263; P = 0.0010). Bowfin CPS was higher in early summer than late summer or fall (Figure 2A). Because catches of bow-fin < 25 cm were rare, we did no additional analysis for this length group. Temporal variation in bowfin CPS was linked with spawning, but not with changes in aquatic macrophyte density. Bowfin spawn from late April to early June in north temperate waters (Becker 1983), and the higher CPS occurred in spring and early summer. Hall and Werner (1977) observed more bowfin in littoral areas in spring and early summer than in late sum-mer or fall in a Michigan lake. Bowfin also show strong affinity towards aquatic vegeta-tion (Becker 1983), but CPS decreased in late summer or fall when submergent aquatic macrophyte densities were still high.
Minnows Catch per sample site of minnow spe-cies usually differed among sampling gears, sample periods, or lakes. A total of six min-now species was captured including common carp, brassy minnow, golden shiner, spottail shiner, fathead minnow, and bluntnose min-now. Catches of brassy minnow and fathead minnow were too low to analyze.
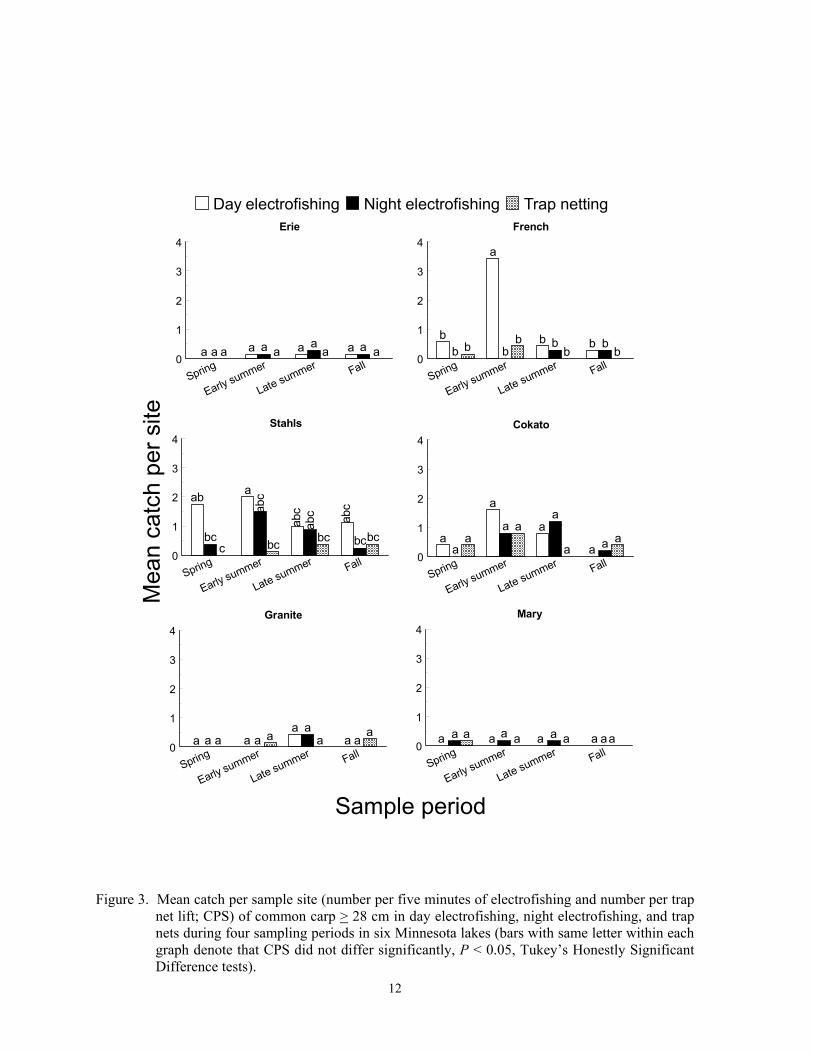
Day electrofishing during spawning appears most efficient for capturing common carp > 28 cm, but each gear seldom captured smaller individuals during any sample period so no additional analysis was done for this length group. Although CPS of common carp > 28 cm varied inconsistently among gears, sample periods, and lakes (F = 1.54; df = 30, 479; P = 0.0367 for the gear*sample pe-riod*lake interaction), we captured more indi-viduals with day electrofishing during early summer in French, Stahls, and Cokato lakes where CPS was highest among lakes (Figure 3). Catch per sample site was much lower and
did not differ among gears or sample periods in the other three lakes (Figure 3). Pierce et al. (2001) also reported that day catch per hour (CPH) of common carp in two Iowa lakes ex-ceeded night CPH during late June and early July, similar times to our early summer sample period. Some temporal variation in CPS could be due to spawning behavior. Common carp spawn from April to August at latitudes simi-lar to our lakes, but peak spawning occurs in late May and early June when water tempera-tures reach 18 to 24 oC (Becker 1983). Based on these water temperatures, peak spawning would have begun most likely after the spring sample period and into the early summer sam-ple periods. In a similar sized but deeper lake than the ones we studied, common carp in-habit littoral areas mostly during spring and move offshore and into deeper water during summer (Garcia-Berthou 2001). Stang and Hubert (1984) also found little temporal varia-tion in trap net CPUE of common carp in an Iowa lake between late June and mid August.
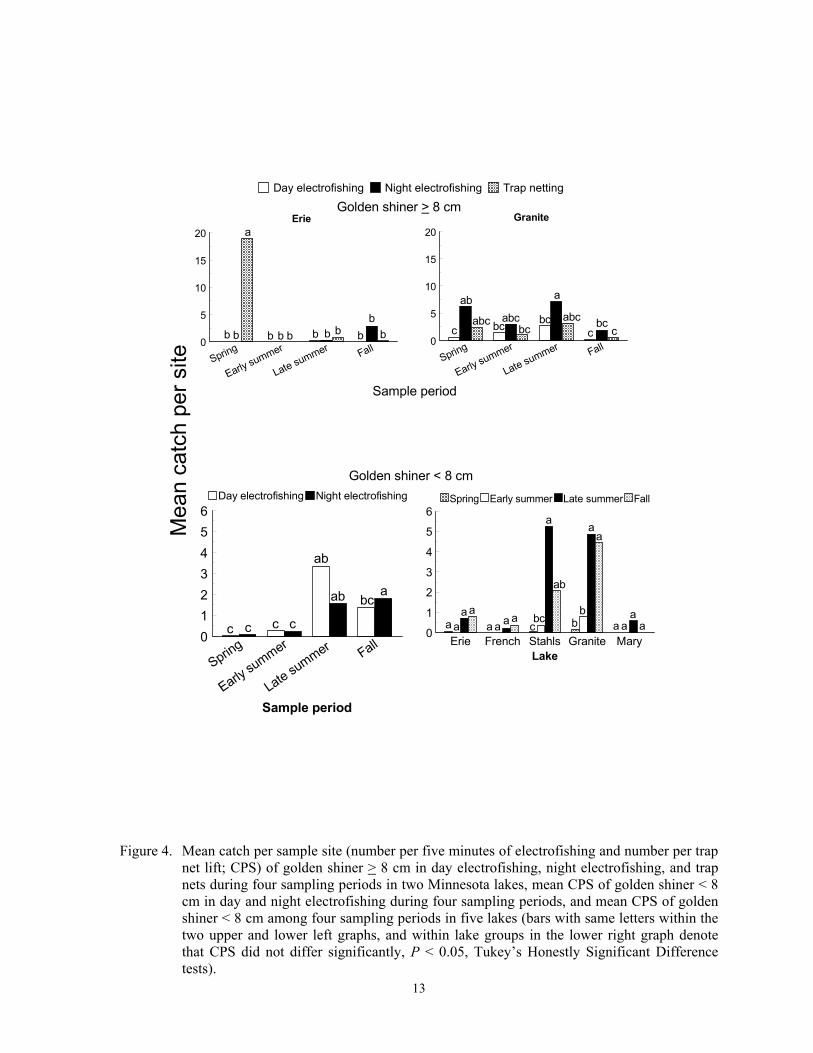
The best gear for capturing the most golden shiner > 8 cm was not clearly deter-mined, but either day or night electrofishing in late summer or fall captured the most golden shiner < 8 cm. Catch per sample site of larger golden shiner differed inconsistently among the three sampling gears and sample periods in Erie and Granite Lakes (F = 4.26; df = 6, 167; P = 0.0006). Trap nets in spring captured the most larger golden shiner in Lake Erie, but night electrofishing in spring and late summer captured the most larger golden shiner in Granite Lake (Figure 4). No golden shiner were captured in Cokato Lake, and we rarely captured with any gear larger golden shiners in the other three lakes. Electrofishing CPS of smaller golden shiners in late summer and fall exceeded CPS in spring and early summer, and CPS differed between day and night only in fall (F = 2.82; df = 3, 279; P = 0.0397 for gear*sample period interaction; Figure 4). Trap nets did not capture golden shiner < 8 cm, so effects of this gear were not tested. Catch per sample site of smaller golden shin-ers also differed among sampling periods in Stahls and Granite lakes, but not in the other three lakes probably because of low catches (F = 2.83; df = 12, 279; P = 0.0012 for sample

11
Erie Cokato0
5
10
15
20
Lake
Spring Early summerLate summer Fall
Mea
n ca
tch
per s
ite
Bowfin >= 25 cm
Spring Early summer Late summer Fall0
0.2
0.4
0.6
0.8
1
Sample period
B.
C.
A.
a
ababc
bcdcd cdcd dSpring Early summer Late summer Fall
0
5
10
15
20
25
Sample period
Day electrofishing Night electrofishing
Erie Cokato0
5
10
15
20
Lake
Day electrofishing Night electrofishingTrap nets
a a a
a
a
ab
c
b
a
a
aaa
a
White sucker < 15 cm
White sucker > 15 cm
a
abb
b
Figure 2. A. Mean catch per sample site (number per five minutes of electrofishing and number per
trap net lift; CPS) of bowfin > 25 cm among four sample periods in three Minnesota lakes, B. mean CPS of white sucker > 15 cm among three sample gears and among four sample peri-ods in Erie and Cokato lakes, and C. mean CPS of white sucker < 15 cm in day and night electrofishing during four sample periods in Cokato Lake (bars with same letters within lake groups in the upper graph, within each lake group in the middle graph, and within gear and sample period groups in the lower graph denote that CPS did not differ significantly, P < 0.05, Tukey’s Honestly Significant Difference tests).
12
Stahls
Spring
Early summer
Late summer Fall0
1
2
3
4
French
Spring
Early summer
Late summer Fall0
1
2
3
4
Cokato
Spring
Early summer
Late summer Fall0
1
2
3
4
Granite
Spring
Early summer
Late summer Fall0
1
2
3
4Mary
Spring
Early summer
Late summer Fall0
1
2
3
4
Erie
Spring
Early summer
Late summer Fall0
1
2
3
4
Day electrofishing Night electrofishing Trap netting
Sample period
Mea
n ca
tch
per s
ite
a
b b bb b b
bb b
bb
aab
abc
abc
abcab
c
bc bcbc bccbc
aa a a a a aa a a aa
aa
a
a a aa
a a a aa
a a a a a a a a aaaaaa aaa a
a aa
aaa
Figure 3. Mean catch per sample site (number per five minutes of electrofishing and number per trap
net lift; CPS) of common carp > 28 cm in day electrofishing, night electrofishing, and trap nets during four sampling periods in six Minnesota lakes (bars with same letter within each graph denote that CPS did not differ significantly, P < 0.05, Tukey’s Honestly Significant Difference tests).
13
Granite
Spring
Early summer
Late summer Fall0
5
10
15
20Erie
Spring
Early summer
Late summer Fall0
5
10
15
20
Day electrofishing Night electrofishing Trap netting
Sample period
Mea
n ca
tch
per s
ite
a
b bb b b b bb
bbb
ababc
a
bcabc bcabcbc cc cbc
Spring
Early summer
Late summer Fall0
123456
Sample period
Day electrofishing Night electrofishing
Erie French Stahls Granite Mary0
1
2
3
4
5
6
Lake
Spring Early summer Late summer Fall
c c cc
a
ab
ab bc
a
a aa a
aaaaa
aaa
a
ab
a
bcb
c b
Golden shiner < 8 cm
Golden shiner > 8 cm
Figure 4. Mean catch per sample site (number per five minutes of electrofishing and number per trap
net lift; CPS) of golden shiner > 8 cm in day electrofishing, night electrofishing, and trap nets during four sampling periods in two Minnesota lakes, mean CPS of golden shiner < 8 cm in day and night electrofishing during four sampling periods, and mean CPS of golden shiner < 8 cm among four sampling periods in five lakes (bars with same letters within the two upper and lower left graphs, and within lake groups in the lower right graph denote that CPS did not differ significantly, P < 0.05, Tukey’s Honestly Significant Difference tests).
14
period*lake interaction; Figure 4). Mean CPS of golden shiner < 8 cm was highest during late summer in Stahls Lake, and during late summer and fall in Granite Lake. Larger golden shiners should be vulnerable to capture in trap nets and both types of electrofishing because they inhabit shallow inshore habitats during either the day or night depending on optimal feeding times (Hall et al. 1979; Helf-man 1981; Reebs 2002). This species spawns multiple times from June to August after water temperatures reach 20 oC, and spatial distribu-tion is linked with diversity but not density of aquatic macrophytes (Becker 1983; Brazner and Beals 1997). However, because CPS of larger golden shiner did not increase after spring, temporal variation was not strongly related to spawning or with density of sub-mergent aquatic macrophytes. Higher CPS of smaller golden shiner in late summer and fall was likely due to recruitment of age 0 indi-viduals, which can reach 6 cm TL by fall (Becker 1983).
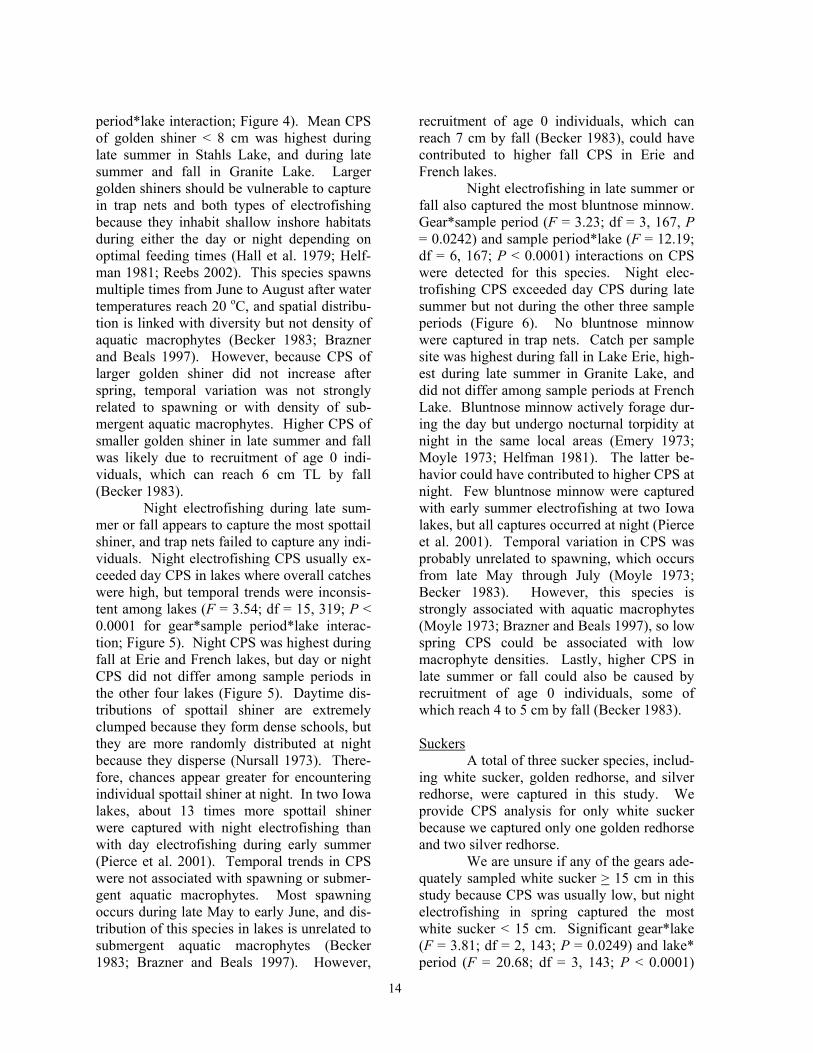
Night electrofishing during late sum-mer or fall appears to capture the most spottail shiner, and trap nets failed to capture any indi-viduals. Night electrofishing CPS usually ex-ceeded day CPS in lakes where overall catches were high, but temporal trends were inconsis-tent among lakes (F = 3.54; df = 15, 319; P < 0.0001 for gear*sample period*lake interac-tion; Figure 5). Night CPS was highest during fall at Erie and French lakes, but day or night CPS did not differ among sample periods in the other four lakes (Figure 5). Daytime dis-tributions of spottail shiner are extremely clumped because they form dense schools, but they are more randomly distributed at night because they disperse (Nursall 1973). There-fore, chances appear greater for encountering individual spottail shiner at night. In two Iowa lakes, about 13 times more spottail shiner were captured with night electrofishing than with day electrofishing during early summer (Pierce et al. 2001). Temporal trends in CPS were not associated with spawning or submer-gent aquatic macrophytes. Most spawning occurs during late May to early June, and dis-tribution of this species in lakes is unrelated to submergent aquatic macrophytes (Becker 1983; Brazner and Beals 1997). However,
recruitment of age 0 individuals, which can reach 7 cm by fall (Becker 1983), could have contributed to higher fall CPS in Erie and French lakes.
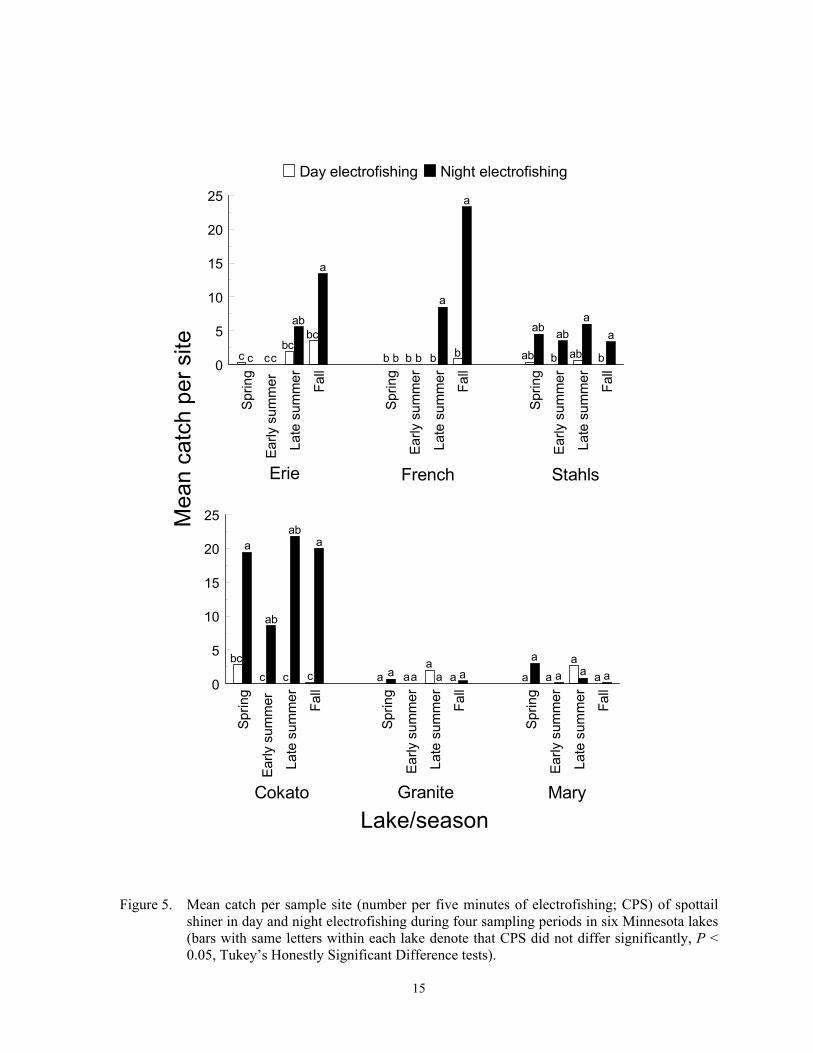
Night electrofishing in late summer or fall also captured the most bluntnose minnow. Gear*sample period (F = 3.23; df = 3, 167, P = 0.0242) and sample period*lake (F = 12.19; df = 6, 167; P < 0.0001) interactions on CPS were detected for this species. Night elec-trofishing CPS exceeded day CPS during late summer but not during the other three sample periods (Figure 6). No bluntnose minnow were captured in trap nets. Catch per sample site was highest during fall in Lake Erie, high-est during late summer in Granite Lake, and did not differ among sample periods at French Lake. Bluntnose minnow actively forage dur-ing the day but undergo nocturnal torpidity at night in the same local areas (Emery 1973; Moyle 1973; Helfman 1981). The latter be-havior could have contributed to higher CPS at night. Few bluntnose minnow were captured with early summer electrofishing at two Iowa lakes, but all captures occurred at night (Pierce et al. 2001). Temporal variation in CPS was probably unrelated to spawning, which occurs from late May through July (Moyle 1973; Becker 1983). However, this species is strongly associated with aquatic macrophytes (Moyle 1973; Brazner and Beals 1997), so low spring CPS could be associated with low macrophyte densities. Lastly, higher CPS in late summer or fall could also be caused by recruitment of age 0 individuals, some of which reach 4 to 5 cm by fall (Becker 1983).
Suckers A total of three sucker species, includ-ing white sucker, golden redhorse, and silver redhorse, were captured in this study. We provide CPS analysis for only white sucker because we captured only one golden redhorse and two silver redhorse.
We are unsure if any of the gears ade-quately sampled white sucker > 15 cm in this study because CPS was usually low, but night electrofishing in spring captured the most white sucker < 15 cm. Significant gear*lake (F = 3.81; df = 2, 143; P = 0.0249) and lake* period (F = 20.68; df = 3, 143; P < 0.0001)
15
Sprin
g
Early
sum
mer
Late
sum
mer
Fall
Sprin
g
Early
sum
mer
Late
sum
mer
Fall
Sprin
g
Early
sum
mer
Late
sum
mer
Fall0
5
10
15
20
25
Sprin
g
Early
sum
mer
Late
sum
mer
Fall
Sprin
g
Early
sum
mer
Late
sum
mer
Fall
Sprin
g
Early
sum
mer
Late
sum
mer
Fall0
5
10
15
20
25
French Stahls
Cokato Granite Mary
Erie
Lake/season
Mea
n ca
tch
per s
ite
a
ab
bcbc
c ccc
a
a
b b b b bb
aa
ab
abab
ab
bb
aa
ab
ab
bcc cc
Day electrofishing Night electrofishing
a aaa
a a
aa a a a
aa a aa
Figure 5. Mean catch per sample site (number per five minutes of electrofishing; CPS) of spottail
shiner in day and night electrofishing during four sampling periods in six Minnesota lakes (bars with same letters within each lake denote that CPS did not differ significantly, P < 0.05, Tukey’s Honestly Significant Difference tests).
16
Erie French Granite0
2
4
6
8
10
12
Lake
Spring Early summer Late summer Fall
Spring Early summer Late summer Fall0
1
2
3
4
5
6
Sample period
Day electrofishing Night electrofishing
a
a
ab
bc
c c cc
Mea
n ca
tch
per s
ite
abc
c
a
b
b
abaaa
a
Figure 6. Mean catch per sample site (number per five minutes of electrofishing; CPS) of blunt-
nose minnow in day and night electrofishing among four sampling periods, and mean CPS among four sampling periods in three Minnesota lakes (bars with same letters in the upper graph and within lake groups in the lower graph denote that CPS did not differ sig-nificantly, P < 0.05, Tukey’s Honestly Significant Difference tests).
17
interactions were detected for larger white sucker. Trap nets were the only gear that cap-tured larger white sucker in Lake Erie, but all three gears captured this length group in Co-kato Lake (Figure 2B). The Tukey’s HSD tests did not identify a lake or gear where CPS differed significantly. Catch per sample site of larger white sucker did not differ tempo-rally in Lake Erie, but CPS was also low. Conversely, at Cokato Lake, few larger white sucker were caught in spring, and the most were caught in late summer (Figure 2B). Catch per sample site of smaller white sucker differed inconsistently between day and night electrofishing among the four sample periods at Cokato Lake (F = 4.83; df = 3, 39; P < 0.0069 for gear*sample period interaction), but trap nets failed to capture smaller indi-viduals. Night electrofishing CPS of small white sucker exceeded day CPS during spring, but CPS decreased and did not differ between day and night in the other three sample periods (Figure 2C). White sucker increase activity and move into shallow water at night (Emery 1973; Reynolds and Casterlin 1978), which likely resulted in higher CPS during night than day when catches were high. Day electrofish-ing during early summer failed to capture white sucker in two Iowa lakes, but they were captured in one-half of the night electrofishing samples (Pierce et al. 2001). Temporal varia-tion was not linked with spawning or changes in density of aquatic macrophytes. They spawn at water temperatures ranging from 12 to 17 oC (Corbett and Powles 1983), which coincides with the spring sample period or earlier, and this species also show no strong affinity towards aquatic vegetation (Brazner and Beals 1997). We suspect that the decrease in CPS of small individuals coupled with the increase in CPS of larger in individuals be-tween spring and late summer at Cokato Lake was caused by a single year class (likely age 1; Carlander 1969) that grew out of the small length group and recruited into the larger length group. Trap net CPUE of this species in an Iowa lake did not differ between late June and mid August (Stang and Hubert 1984).
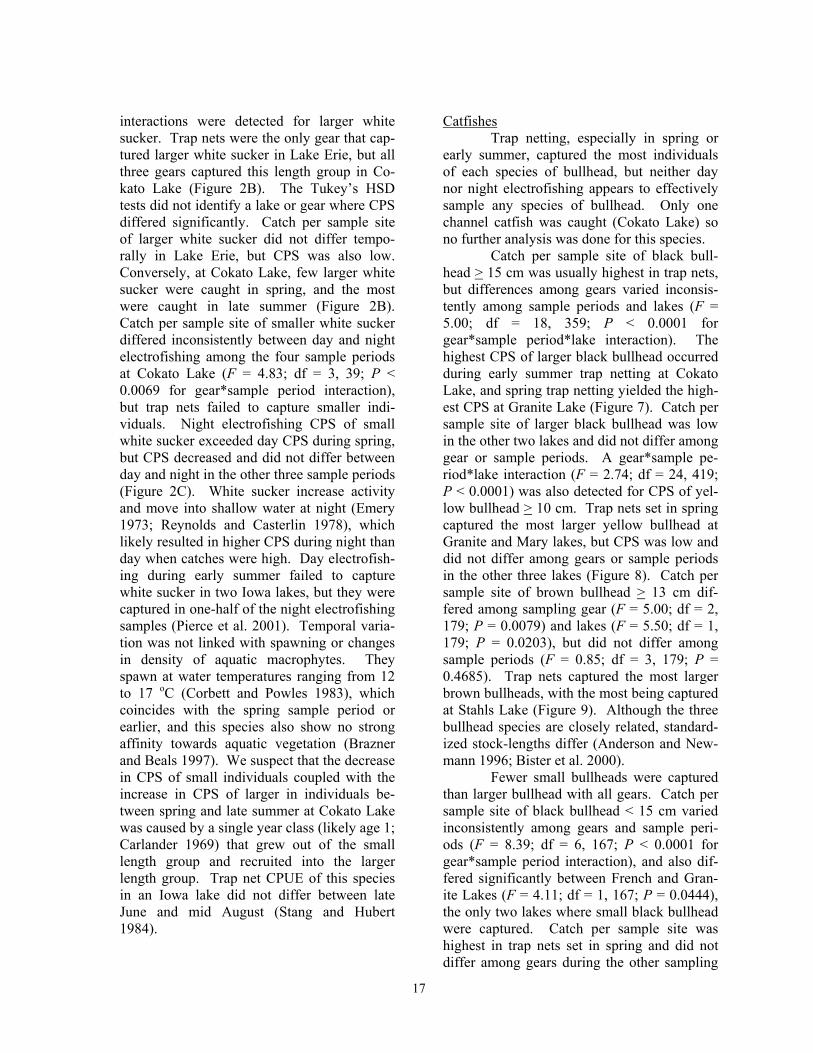
Catfishes Trap netting, especially in spring or early summer, captured the most individuals of each species of bullhead, but neither day nor night electrofishing appears to effectively sample any species of bullhead. Only one channel catfish was caught (Cokato Lake) so no further analysis was done for this species.
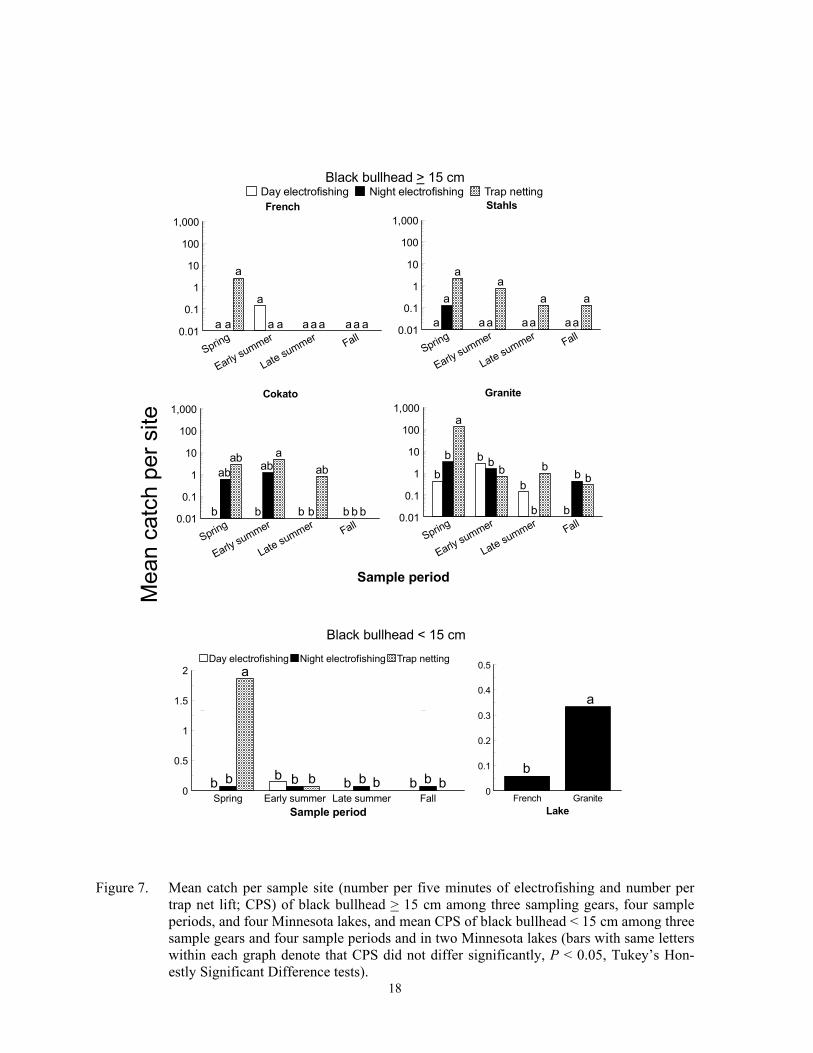
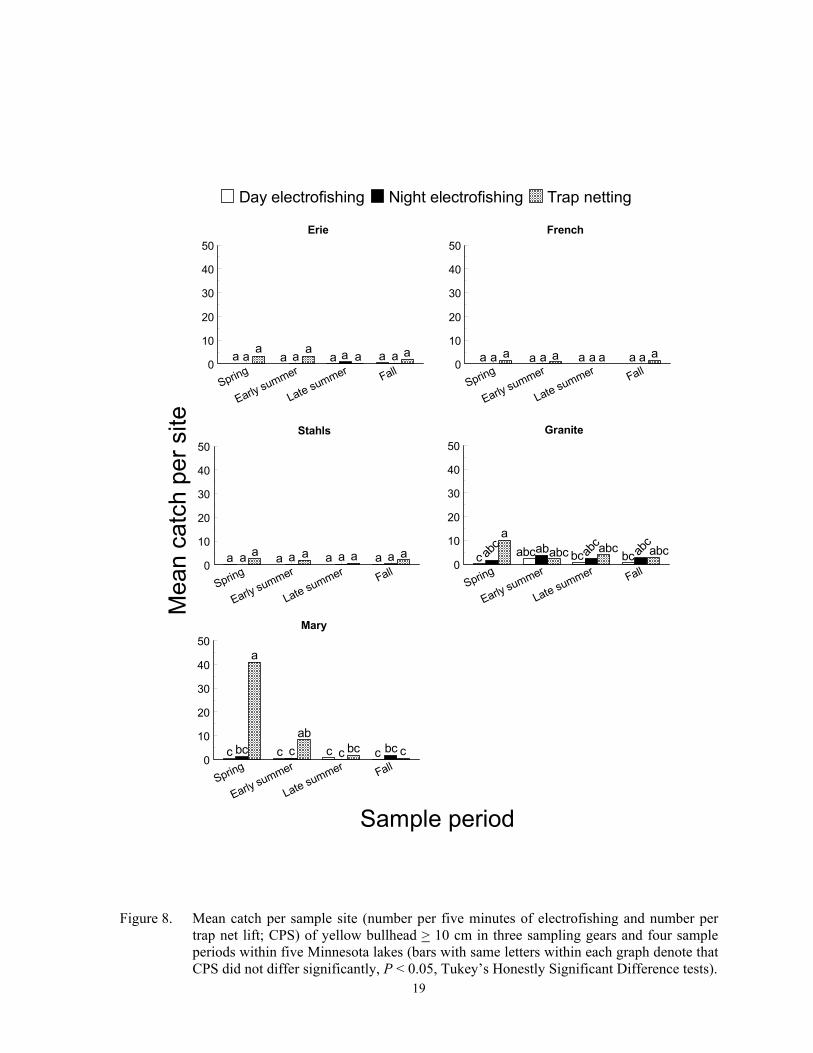
Catch per sample site of black bull-head > 15 cm was usually highest in trap nets, but differences among gears varied inconsis-tently among sample periods and lakes (F = 5.00; df = 18, 359; P < 0.0001 for gear*sample period*lake interaction). The highest CPS of larger black bullhead occurred during early summer trap netting at Cokato Lake, and spring trap netting yielded the high-est CPS at Granite Lake (Figure 7). Catch per sample site of larger black bullhead was low in the other two lakes and did not differ among gear or sample periods. A gear*sample pe-riod*lake interaction (F = 2.74; df = 24, 419; P < 0.0001) was also detected for CPS of yel-low bullhead > 10 cm. Trap nets set in spring captured the most larger yellow bullhead at Granite and Mary lakes, but CPS was low and did not differ among gears or sample periods in the other three lakes (Figure 8). Catch per sample site of brown bullhead > 13 cm dif-fered among sampling gear (F = 5.00; df = 2, 179; P = 0.0079) and lakes (F = 5.50; df = 1, 179; P = 0.0203), but did not differ among sample periods (F = 0.85; df = 3, 179; P = 0.4685). Trap nets captured the most larger brown bullheads, with the most being captured at Stahls Lake (Figure 9). Although the three bullhead species are closely related, standard-ized stock-lengths differ (Anderson and New-mann 1996; Bister et al. 2000).
Fewer small bullheads were captured than larger bullhead with all gears. Catch per sample site of black bullhead < 15 cm varied inconsistently among gears and sample peri-ods (F = 8.39; df = 6, 167; P < 0.0001 for gear*sample period interaction), and also dif-fered significantly between French and Gran-ite Lakes (F = 4.11; df = 1, 167; P = 0.0444), the only two lakes where small black bullhead were captured. Catch per sample site was highest in trap nets set in spring and did not differ among gears during the other sampling
18
Stahls
Spring
Early summer
Late summer Fall0.01
0.1
1
10
100
1,000French
Spring
Early summer
Late summer Fall0.01
0.1
1
10
100
1,000
Cokato
Spring
Early summer
Late summer Fall0.01
0.1
1
10
100
1,000Granite
Spring
Early summer
Late summer Fall0.01
0.1
1
10
100
1,000
Day electrofishing Night electrofishing Trap netting
Sample period
Mea
n ca
tch
per s
ite
a
a
a
a a aa a a aaa a
a
aa
a
aa
a
aa
a a
a
bb b bbb
ab ababab
a
bb b b
b
b
b
b
b b
b
Black bullhead < 15 cm
Spring Early summer Late summer Fall0
0.5
1
1.5
2
Sample period
Day electrofishing Night electrofishing Trap netting
French Granite0
0.1
0.2
0.3
0.4
0.5
Lake
Black bullhead > 15 cm
a
b b b b b bb b bbb
b
a
b
Figure 7. Mean catch per sample site (number per five minutes of electrofishing and number per trap net lift; CPS) of black bullhead > 15 cm among three sampling gears, four sample periods, and four Minnesota lakes, and mean CPS of black bullhead < 15 cm among three sample gears and four sample periods and in two Minnesota lakes (bars with same letters within each graph denote that CPS did not differ significantly, P < 0.05, Tukey’s Hon-estly Significant Difference tests).
19
Stahls
Spring
Early summer
Late summer Fall0
10
20
30
40
50
French
Spring
Early summer
Late summer Fall0
10
20
30
40
50
Granite
Spring
Early summer
Late summer Fall0
10
20
30
40
50
Erie
Spring
Early summer
Late summer Fall0
10
20
30
40
50
Day electrofishing Night electrofishing Trap netting
Sample period
Mea
n ca
tch
per s
ite
ab abcabc abc
abc
abcabc abc bcbcc
a
Mary
Spring
Early summer
Late summer Fall0
10
20
30
40
50
aa aaa a aa a aaa
aa a aa a aa a aaa
aa a aa a aa a aaa
a
abbcbc bccc c c ccc
Figure 8. Mean catch per sample site (number per five minutes of electrofishing and number per
trap net lift; CPS) of yellow bullhead > 10 cm in three sampling gears and four sample periods within five Minnesota lakes (bars with same letters within each graph denote that CPS did not differ significantly, P < 0.05, Tukey’s Honestly Significant Difference tests).
20
Stahls Granite0
0.2
0.4
0.6
0.8
1
Lake
Spring Early summer Late summer Fall0
0.2
0.4
0.6
0.8
1
Sample period
Day electrofishing Night electrofishing Trap nets0
0.5
1
1.5
Gear
a
b
a
b
b
a a
a
aM
ean
catc
h pe
r site
Figure 9. Mean catch per sample site (number per five minutes of electrofishing and number per
trap net lift; CPS) of brown bullhead > 13 cm in day electrofishing, night electrofishing, and trap nets (upper graph), among four sample periods (middle graph), and among two Minnesota lakes (lower graph) (bars with same letters within each graph denote that CPS did not differ significantly, P < 0.05, Tukey’s Honestly Significant Difference tests).
21
periods (Figure 7). Very few yellow bullheads < 10 cm and no brown bullheads < 13 cm were captured with any gear, so no additional analysis was done for these length groups.
Elsewhere, electrofishing appears in-effective for sampling bullheads, and spawn-ing behavior of each species probably affected temporal variation in trap net CPS. In two Iowa lakes, night electrofishing CPH exceeded day CPH of black bullhead, but electrofishing catches were extremely low compared to beach seine hauls (Pierce et al. 2001). Black bullhead associated with aquatic vegetation at night, but not during the day in another Iowa lake (Stang and Hubert 1984), which should make this species more vulnerable to night electrofishing than day electrofishing. Non-nesting brown bullhead rest in vegetation 1-4 m deep during the day and become active at night, sometimes coming to shore (Keast and Harker 1977; Helfman 1981). However, Helfman (1981) also wrote that brown bull-head flee when illuminated with artificial light, which could reduce effectiveness of night electrofishing. All three bullhead spe-cies spawn during spring and early summer sample periods (Becker 1983), which coin-cided with the highest trap net CPS. Similar to our findings, trap net CPUE of black bull-head in an Iowa lake declined from late June to mid August (Stang and Hubert 1984).
Failure to capture small bullheads in all gears was likely a function of density or spatial distribution patterns. Trap nets with 1.9-cm mesh captured many black bullhead 10 to 15 cm, likely age 1, from June to September in South Dakota waters (Hanchin et al. 2002a; 2002b), so our nets should have captured some bullheads of this size if they were present. However, each study lake also has healthy populations of yellow perch, largemouth bass, black crappie, or walleye, species strongly linked with black bullhead populations with relatively low recruitment (McInerny and Cross 1995; Brown et al. 1999). None of the gears will likely capture age-0 bullheads be-cause the mesh size of trap nets is too large, and odds are low that we would encounter them during day or night electrofishing be-cause they swarm into dense, but widely scat-
tered schools after leaving nests (Eddy and Underhill 1974).
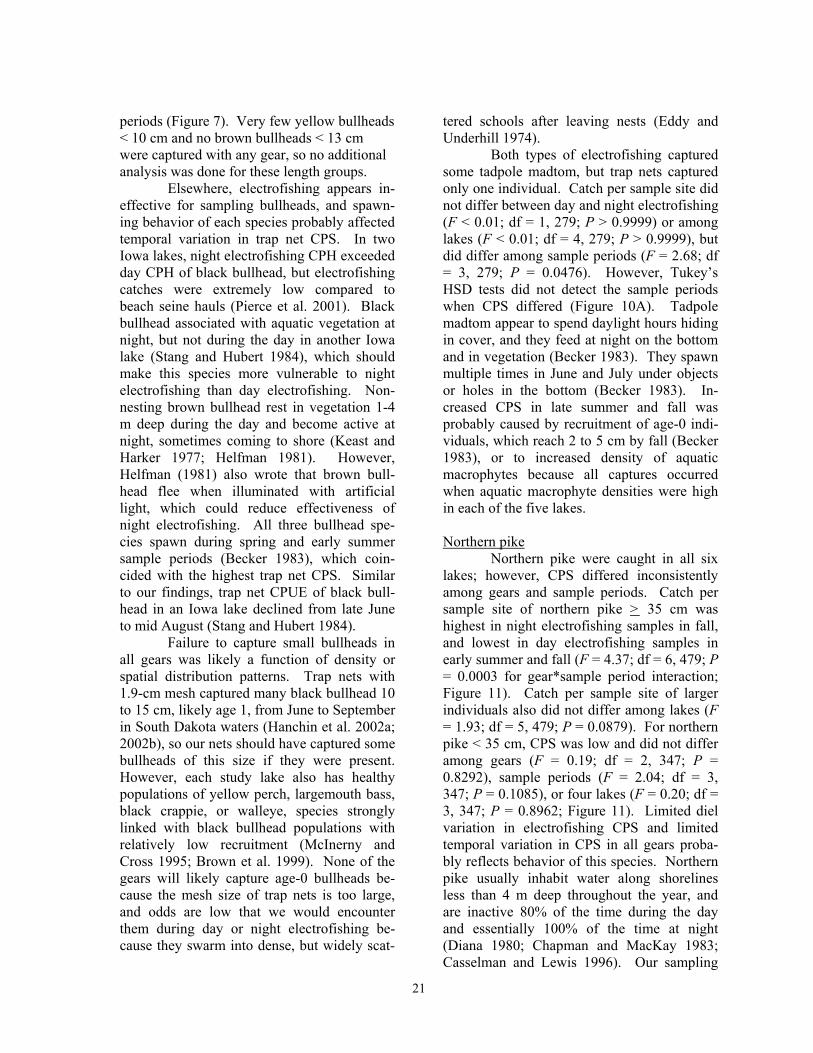
Both types of electrofishing captured some tadpole madtom, but trap nets captured only one individual. Catch per sample site did not differ between day and night electrofishing (F < 0.01; df = 1, 279; P > 0.9999) or among lakes (F < 0.01; df = 4, 279; P > 0.9999), but did differ among sample periods (F = 2.68; df = 3, 279; P = 0.0476). However, Tukey’s HSD tests did not detect the sample periods when CPS differed (Figure 10A). Tadpole madtom appear to spend daylight hours hiding in cover, and they feed at night on the bottom and in vegetation (Becker 1983). They spawn multiple times in June and July under objects or holes in the bottom (Becker 1983). In-creased CPS in late summer and fall was probably caused by recruitment of age-0 indi-viduals, which reach 2 to 5 cm by fall (Becker 1983), or to increased density of aquatic macrophytes because all captures occurred when aquatic macrophyte densities were high in each of the five lakes.
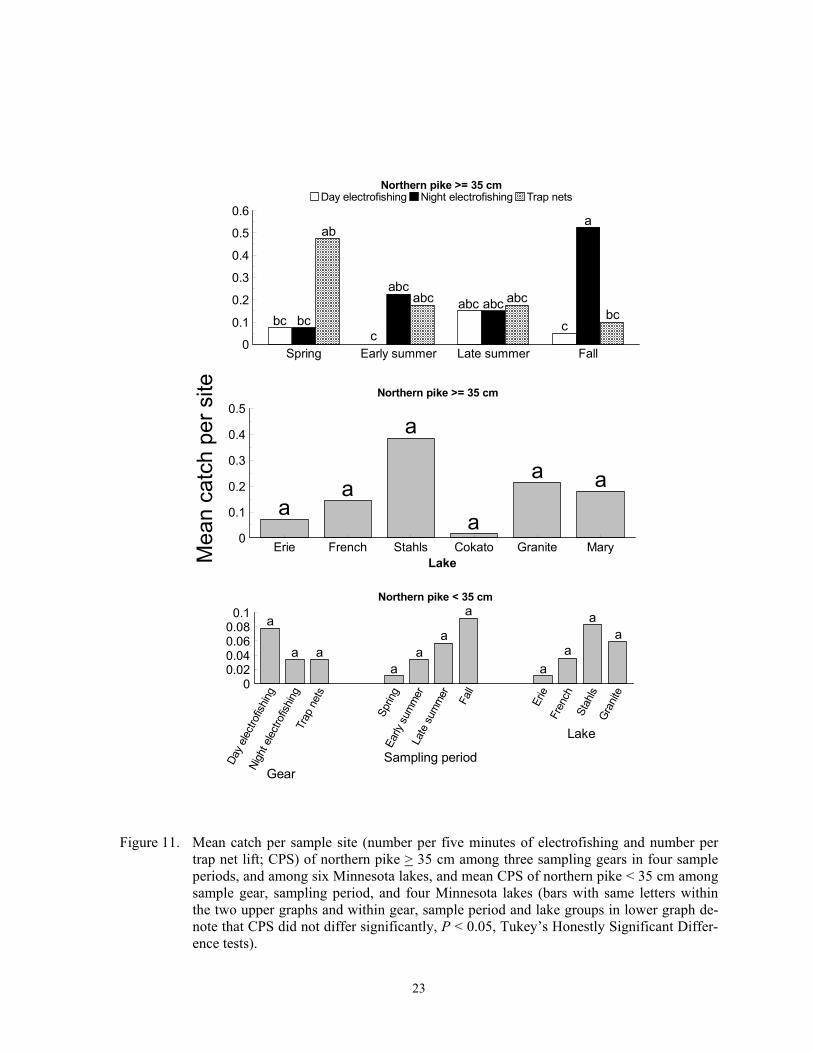
Northern pike Northern pike were caught in all six lakes; however, CPS differed inconsistently among gears and sample periods. Catch per sample site of northern pike > 35 cm was highest in night electrofishing samples in fall, and lowest in day electrofishing samples in early summer and fall (F = 4.37; df = 6, 479; P = 0.0003 for gear*sample period interaction; Figure 11). Catch per sample site of larger individuals also did not differ among lakes (F = 1.93; df = 5, 479; P = 0.0879). For northern pike < 35 cm, CPS was low and did not differ among gears (F = 0.19; df = 2, 347; P = 0.8292), sample periods (F = 2.04; df = 3, 347; P = 0.1085), or four lakes (F = 0.20; df = 3, 347; P = 0.8962; Figure 11). Limited diel variation in electrofishing CPS and limited temporal variation in CPS in all gears proba-bly reflects behavior of this species. Northern pike usually inhabit water along shorelines less than 4 m deep throughout the year, and are inactive 80% of the time during the day and essentially 100% of the time at night (Diana 1980; Chapman and MacKay 1983; Casselman and Lewis 1996). Our sampling
22
a abbba
a
Erie Mary0
0.2
0.4
0.6
0.8
1
Lake
Brook silversides
a
abbc
c cc cc
a
a
Spring
Early summer
Late summer Fall0
1
2
3
4
Sample period
Day electrofishing Night electrofishing
Mea
n ca
tch
per s
ite
GearSample period
A.
B.
C.
Sample period
Lake
Gear
Tadpole madtom
Day
ele
ctro
fishi
ngN
ight
ele
ctro
fishi
ng
Sprin
gEa
rly s
umm
erLa
te s
umm
er
Fall
Erie
Fren
chSt
ahls
Gra
nite
Mar
y00.050.1
0.150.2
Banded killifish (Lake Erie)
Day
ele
ctro
fishi
ng
Nig
ht e
lect
rofis
hing
Sprin
g
Early
sum
mer
Late
sum
mer
Fall0
0.51
1.52
aa
a
a
aa
a a aaa
Figure 10. A. Mean catch per sample site (number per five minutes of electrofishing; CPS) of tad-
pole madtom in day and night electrofishing among four sample periods and five lakes, B. mean CPS of banded killifish in day and night electrofishing during four sample peri-ods in Lake Erie, and C. mean CPS of brook silverside in day and night electrofishing among four sample periods and in two Minnesota lakes (bars with same letters within gear, sample period or lake groups in tadpole madtom and banded killifish graphs and within each brook silverside graph denote that CPS did not differ significantly, P < 0.05, Tukey’s Honestly Significant Difference tests).
23
Northern pike >= 35 cm
Erie French Stahls Cokato Granite Mary0
0.1
0.2
0.3
0.4
0.5
Lake
Northern pike < 35 cm
Day e
lectro
fishin
gNi
ght e
lectro
fishin
gTr
ap n
ets
Sprin
gEa
rly s
umm
erLa
te s
umm
er Fall
Erie
Fren
chSt
ahls
Gran
ite
00.020.040.060.080.1
Northern pike >= 35 cm
Spring Early summer Late summer Fall0
0.1
0.2
0.3
0.4
0.5
0.6Day electrofishing Night electrofishing Trap nets
GearSampling period
Lake
Mea
n ca
tch
per s
itea
ab
abcabc abcabcabc
bc bc bcc
c
a
a
a
a aa
a aa
aa
a
aa
aa
a
Figure 11. Mean catch per sample site (number per five minutes of electrofishing and number per
trap net lift; CPS) of northern pike > 35 cm among three sampling gears in four sample periods, and among six Minnesota lakes, and mean CPS of northern pike < 35 cm among sample gear, sampling period, and four Minnesota lakes (bars with same letters within the two upper graphs and within gear, sample period and lake groups in lower graph de-note that CPS did not differ significantly, P < 0.05, Tukey’s Honestly Significant Differ-ence tests).
24
began after northern pike spawned at each lake. Guy and Willis (1991) found increased trap net CPUE of northern pike during March and April when they were in pre-spawn or spawning condition in a South Dakota lake, but, as in this study, they found no significant change in CPUE between May and the follow-ing October. Killifishes, silversides, mudminnows, and sticklebacks
Banded killifish, brook silverside, central mudminnow, and brook stickleback were captured with day or night electrofishing, but trap nets failed to capture these species. We did not include trap net data in CPS analy-sis of these species, and we did not analyze factors affecting CPS of central mudminnow and brook stickleback because catches were too low.
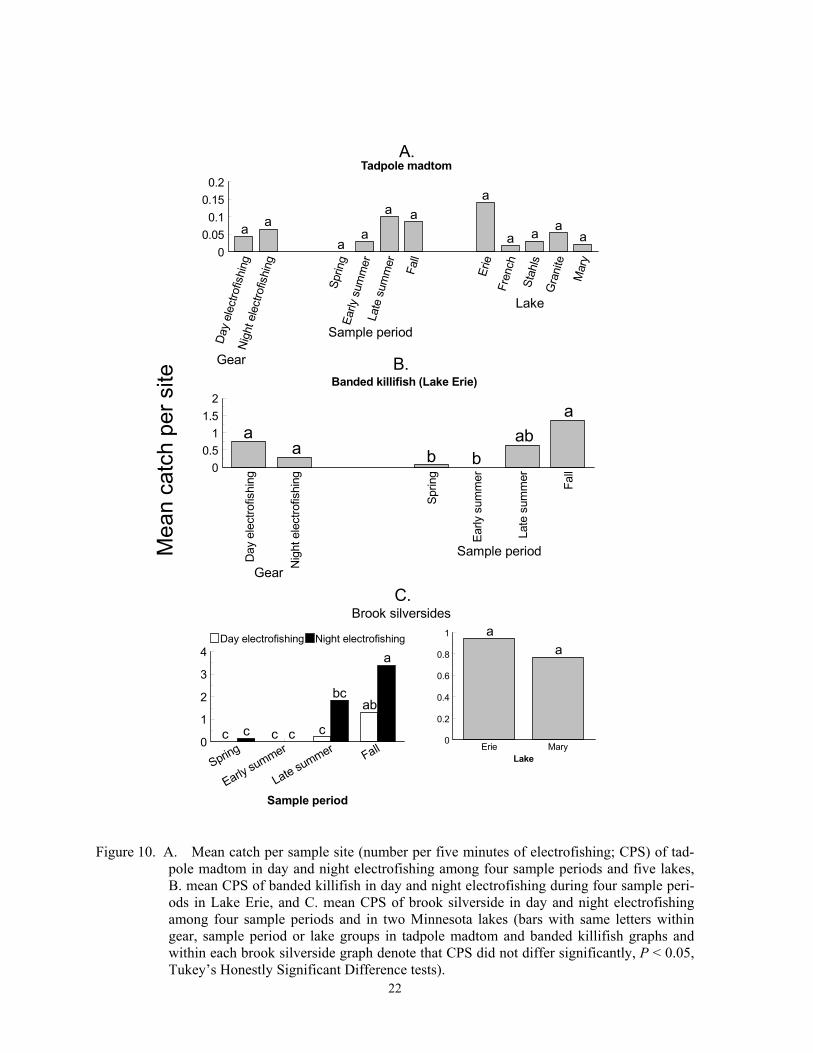
Both day and night electrofishing in late summer or fall captured banded killifish in Lake Erie, the one lake where captured. Elec-trofishing CPS of banded killifish did not dif-fer dielly (F = 0.21; df = 1, 55; P = 0.6504), but CPS was higher in fall than in spring or early summer (F = 7.95; df = 3, 55; P = 0.0002)(Figure 10B). Banded killifish form schools in water 1 to 1.6 m deep during the day, but disperse and move into water < 0.6 m deep at night (Helfman 1981), depths shal-lower than we usually electrofished. Thus, this species could be more vulnerable to day electrofishing than night electrofishing. Banded killifish spawn in early summer and inhabit stands of submergent aquatic vegeta-tion when available (Becker 1983). However, because temporal catches did not increase be-tween spring and early summer, spawning and changes in macrophyte density probably did not affect CPS. Increased CPS in late summer and fall was probably caused by recruitment of age-0 individuals, which can reach lengths of 4 to 6 cm by fall (Becker 1983).
We captured the most brook silverside with night electrofishing during late summer or fall. Brook silverside CPS differed incon-sistently between day and night electrofishing among sampling periods (F = 5.16; df = 3, 95; P = 0.0025), but did not differ between Lakes Erie and Mary, the only two lakes where cap-
tured (F = 0.41; df = 1, 95; P = 0.5245). Day and night CPS in late summer and fall ex-ceeded CPS in spring and early summer, and night CPS exceeded day CPS in late summer and fall but not in spring or early summer (Figure 10C). Brook silverside in late summer and fall actively move in offshore pelagic zones during the day, and come into shore af-ter sunset where they often float motionless (Becker 1983). Thus, this species should be more vulnerable to night rather than day elec-trofishing. Temporal variation is mostly caused by mortality of adults and recruitment of age-0 individuals. After spawning in June or July, age-1 adults die, so high CPS ob-served in late summer and fall resulted from recruitment of age-0 individuals, which reach 7 cm by fall (Becker 1983). This species is mostly pelagic so variation in submergent aquatic macrophyte densities did not affect CPS of this species.
Sunfishes Generally, the lowest catches of small and large individuals of each of the three sun-fish species occurred in spring, and trap nets were ineffective in sampling small sunfish. Catch per sample site of green sunfish > 8 cm varied inconsistently among the three sam-pling gears and sampling periods (F = 4.54; df = 6, 299; P = 0.0002 for the gear*sample pe-riod interaction), and did not differ between four lakes (F = 0.64; df = 2, 299; P = 0.5269). Trap netting during early summer captured the most larger green sunfish (Figure 12). Trap nets caught only one green sunfish < 8 cm in all lakes and sample periods combined, but day and night electrofishing CPS did not differ (F = 0.01; df = 1, 199; P = 0.9334). A lake*sample period interaction (F = 5.48; df = 9, 199; P < 0.0001) was also detected for this length group. Catch per sample site of small green sunfish in early summer, late summer, and fall at Granite Lake exceeded spring CPS, but CPS was low and did not differ among sample periods in the other three lakes (Figure 12). For pumpkinseed > 8 cm, CPS did not differ among the three sampling gears (F = 0.49; df = 2, 419; P = 0.6122), were lowest in spring (F = 13.42; df = 3, 419; P < 0.0001), and were higher in Lake Mary than in Erie,
25
Day electrofishingNight electrofishing
0
0.5
1
1.5
2
2.5
Gear
Mea
n ca
tch
per s
ite
Erie Cokato Granite Mary0
2
4
6
8
Lake
Spring Early summer Late summer Fall
Green sunfish < 8 cm
Spring
Early summer
Late summer Fall0
0.5
1
1.5
2
2.5
Sample period
Day electrofishing Night electrofishing Trap nets
Erie Cokato Granite Mary0
0.5
1
1.5
2
2.5
Lake
Green sunfish > 8 cm
a
abab
bb
b bb b
bbb a
a aa
a
a
a
a
a
baaa a aaaa a a
a
a
Figure 12. Mean catch per sample site (number per five minutes of electrofishing and number per
trap net lift; CPS) of green sunfish > 8 cm in three sampling gears among four sampling periods, mean CPS of green sunfish > 8 cm among four Minnesota lakes, mean CPS of green sunfish < 8 cm in day and night electrofishing, and mean CPS of green sunfish < 8 cm among four sampling periods in four Minnesota lakes (bars with same letters within each graph or within each lake group in lower right graph denote that CPS did not differ significantly, P < 0.05, Tukey’s Honestly Significant Difference tests).

26
French and Stahls lakes (F = 7.36; df = 4, 419; P < 0.0001)(Figure 13). Catch per sample site of pumpkinseed < 8 cm also did not differ among the three gears (F = 0.32; df = 2, 419; P = 0.7243), but a sample period*lake interac-tion occurred (F = 1,80; df = 12; 419; P = 0.0453). Catch per sample site of smaller pumpkinseeds was higher in early summer than in spring at Granite Lake, but CPS did not differ among sample periods in the other four lakes (Figure 13). Catch per sample site of bluegill > 8 cm and < 8 cm differed incon-sistently among sampling gears, sample peri-ods, and lakes (F = 2.21; df = 30, 479; P = 0.0003 for bluegill > 8 cm; F = 3.70; df = 30, 479; P < 0.0001 for bluegill < 8 cm). Like green sunfish, trap netting in early summer captured the most bluegill > 8 cm in most lakes, and night electrofishing CPS in fall ex-ceeded day CPS in spring in some lakes (Fig-ure 14). Night electrofishing CPS of larger bluegill exceeded trap net CPS in fall in two lakes (Figure 14). None of the gears effec-tively captured bluegill < 8 cm in spring, but night electrofishing captured more bluegill than one or both gears in five lakes (Figure 15). Trap nets captured few bluegill < 8 cm during all sample periods in all lakes (Figure 15).
Elsewhere, night electrofishing CPH of bluegill and green sunfish exceeded day CPH of each respective species, but catches of green sunfish were low in each study (Dumont and Dennis 1997; Pierce et al. 2000). Modi-fied fyke nets (13-mm mesh) captured fewer bluegill in two Missouri impoundments than night electrofishing (Kruse 1993).
Pumpkinseed and bluegill exhibit dif-ferent diel patterns, which can explain the dif-ferent electrofishing catch patterns between the two species, but diel patterns of green sun-fish are unknown. Pumpkinseed feed at most depths in littoral areas during the day, move inshore, offshore, or towards the substrate at night, are unapproachable by divers at all times, and exhibit nocturnal torpidity but are easily aroused (Emery 1973; Helfman 1981). Thus, pumpkinseed appear equally vulnerable to day and night electrofishing, and should also be vulnerable to trap netting, which was observed in the study lakes. Zooplantivorous
bluegill of all sizes move offshore during early daylight to feed and then move inshore by nightfall, but bluegill residing in vegetation move above vegetation to feed during the day (Baumann and Kitchell 1974; Helfman 1981). These behavioral patterns suggest that shore-line densities of bluegill are higher at night than day, which was reflected in electrofishing CPS during sample periods when diel differ-ences occurred. Temporal trends in trap net CPUE of larger bluegill between early and late summer were similar to those observed in other Minnesota lakes (Cross et al. 1995), and they found that peak trap net CPUE coincided with peak gonadal development. However, Kelley (1953) reported that most of the tempo-ral variation in bluegill catches in Mississippi River backwaters was caused by recruitment of young year-classes and mortality of older ones. Decreases in trap net CPUE could be associated with density of aquatic macro-phytes. Hall and Werner (1977) observed with SCUBA lower numbers of bluegill, pumpkinseed, and green sunfish in littoral ar-eas in spring than during mid-summer and fall. Bettross and Willis (1988) reported little change in trap net CPUE, but declining night electrofishing CPUE from June to August in a South Dakota cooling pond with few aquatic macrophytes. Increasing electrofishing CPS of small green sunfish, small bluegill, and both length groups of pumpkinseed from spring to early summer, late summer or fall was proba-bly associated with increased density of aquatic macrophytes. Some or most non-larval life stages of these three sunfish species are strongly associated with aquatic macro-phytes (Emery 1973; Hall and Werner 1977; Keast 1978a; Helfman 1981; Brown and Col-gan 1982).
Black basses Catch per sample site of smallmouth and largemouth bass varied inconsistently among sample gears and sample periods, and trap nets captured few individuals of either species. A gear*sample period interaction (F = 3.06; df = 3,39; P = 0.0420) was detected for CPS of smallmouth bass > 18 cm in Co-kato Lake, the only lake where captured. Trap nets failed to capture smallmouth bass > 18 cm

27
Day
ele
ctro
fishi
ng
Nig
ht e
lect
rofis
hing
Trap
net
s
Sprin
g
Early
sum
mer
Late
sum
mer
Fall
Erie
Fren
ch
Stah
ls
Gra
nite
Mar
y0
1
2
3
4
Erie French Stahls Granite Mary0
0.2
0.4
0.6
0.8
1
Lake
Spring Early summer Late summer FallD
ay e
lect
rofis
hing
Nig
ht e
lect
rofis
hing
Trap
net
s0
0.2
0.4
0.6
0.8
1
Pumpkinseed > 8 cm
Pumpkinseed < 8 cm
a
a
a aa
a
a
ab
b
b
b
b
a
ab
aba
aa
a
aa
a
a
a aa a
a
aa a
a
aa
Gear
Gear
Sample period
Lake
Mea
n ca
tch
per s
ite
Figure 13. Mean catch per sample site (number per five minutes of electrofishing and number per
trap net lift; CPS) of pumpkinseed > 8 cm among three sampling gears, four sample peri-ods and five Minnesota lakes, and mean CPS of pumpkinseed < 8 cm among four sam-pling periods in five lakes and among three sampling gears (bars with same letters within the gear, sample period, and lake groups in the upper graph, within lake groups in the lower left graph, and in the lower right graph denote that CPS did not differ significantly, P < 0.05, Tukey’s Honestly Significant Difference tests).
28
Stahls
Spring
Early summer
Late summer Fall0
50
100
150
French
Spring
Early summer
Late summer Fall0
50
100
150
Cokato
Spring
Early summer
Late summer Fall0
50
100
150
Granite
Spring
Early summer
Late summer Fall0
50
100
150Mary
Spring
Early summer
Late summer Fall0
50
100
150
Erie
Spring
Early summer
Late summer Fall0
50
100
150
Day electrofishing Night electrofishing Trap netting
Sample period
Mea
n ca
tch
per s
ite
a
ab
abc
abc
abc abc
abcab
c
bcd
bcd
cdd
a
ab
abc
abc
abc
abc
abc
bcbc bcc bcc
a
ab
c
abc
abc
abc
abc
abc
abc
abc
abc
bcca
abb bb b bb b bbb
aab
ababab
ab
ab
abc
abc abc
bcc
aa
a
ab
a
ab
abc
ab
abc
abcab
c
bcc c
Figure 14. Mean catch per sample site (number per five minutes of electrofishing and number per
trap net lift; CPS) of bluegill > 8 cm in day electrofishing, night electrofishing, and trap nets during four sampling periods in six Minnesota lakes (bars with same letter within each graph denote that CPS did not differ significantly, P < 0.05, Tukey’s Honestly Sig-nificant Difference tests).
29
Stahls
Spring
Early summer
Late summer Fall0
20
40
60
80
100
French
Spring
Early summer
Late summer Fall0
20
40
60
80
100
Cokato
Spring
Early summer
Late summer Fall0
20
40
60
80
100
Granite
Spring
Early summer
Late summer Fall0
20
40
60
80
100Mary
Spring
Early summer
Late summer Fall0
20
40
60
80
100
Erie
Spring
Early summer
Late summer Fall0
20
40
60
80
100
Day electrofishing Night electrofishing Trap netting
Sample period
Mea
n ca
tch
per s
ite
a abababab ab ababb b bbaab
b b b b b b b b bb
a
abb
b
c c c c c c cc
a
b bcbcbc
cc c cc cc
a
a
a a
ab bcbc bcc c cc
aaabab ab
bc bccdcd cd dd
Figure 15. Mean catch per sample site (number per five minutes of electrofishing and number per
trap net lift; CPS) of bluegill < 8 cm in day electrofishing, night electrofishing, and trap nets during four sampling periods in six Minnesota lakes (bars with same letter within each graph denote that CPS did not differ significantly, P < 0.05, Tukey’s Honestly Sig-nificant Difference tests).
30
so these data were excluded from analysis. Although pair-wise tests failed to identify where differences occurred, night electrofish-ing CPS exceeded day CPS in late summer and fall but not in spring or early summer (Figure 16). For smallmouth bass < 18 cm, CPS did not differ among the three sample gears (F = 1.04; df = 2, 39; P = 0.3610) or four sample periods (F = 0.36; df = 3, 39; P = 0.7757)(Figure 16). Based on overall sam-pling effort, trap nets with 13-mm mesh cap-tured about 18 times fewer smallmouth bass than night electrofishing in South Dakota lakes (Milewski and Willis 1991). These au-thors also reported that trap nets captured smallmouth bass > 18 cm, and trap net and night electrofishing CPUE among lakes were positively correlated. Smallmouth bass in New York and Ontario lakes feed and move in shallow waters during the day, move into deeper water and exhibit nocturnal torpidity at night, and were more easily approached by divers at night than day (Emery 1973; Helf-man 1981). Thus, vulnerability of smallmouth bass to night electrofishing would depend on depths of resting areas, which were likely at or deeper than effective electrofishing depths at Cokato Lake.
Catch per sample site of largemouth bass > 20 cm differed among gears in some but not all lakes (F = 2.41; df = 10; 479; P = 0.0086), but did not differ among sample peri-ods (F = 1.72; df = 3, 479; P = 0.1630). Night electrofishing CPS exceeded trap net CPS of larger individuals in Granite and Mary lakes, and day electrofishing CPS exceeded trap net CPS in Lake Mary (Figure 17). However, CPS was low did not differ among gears in the other four lakes (Figure 17). The ANOVA for CPS of largemouth bass < 20 cm suggested a gear*sample period*lake interaction (F = 2.63; df = 30, 479; P < 0.0001). Day or night electrofishing CPS of small largemouth bass exceeded trap net CPS during late summer and fall in Erie, Stahls, Granite, and Mary lakes, but CPS was low and did not differ among gears in any sample period in the other two lakes (Figure 18). Day or night CPS in late summer or fall in three lakes also exceeded CPS in spring and early summer.
Day and night CPS of largemouth bass did not differ because this species occu-pies similar shoreline habitats throughout the day, are similarly active during the day and night (Miller 1975; Warden and Lorio 1975; Helfman 1981), and because of moderate wa-ter clarity. Ratios of day to night CPH of largemouth bass > 20 cm increases with de-creasing Secchi depth, but these ratios for largemouth bass < 20 cm were unrelated to water clarity (Dumont and Dennis 1997; McInerny and Cross 1996; 2000). Night CPH began exceeding day CPH in other Minnesota lakes where Secchi depths exceeded 1.0 m (McInerny and Cross 1996), and summer Sec-chi depths in the study lakes ranged from 1.2 to 3.0 m (median = 1.7 m) (MNDNR lake sur-vey data base).
Low trap net CPS of largemouth bass was probably linked to relative inactivity. Both small and large largemouth bass have small home ranges (< 100 m) and usually move very little (< 50 m) from centers of home area (Lewis and Flickinger 1967; Winter 1977; Copeland and Noble 1994; Essington and Kitchell 1999).
The lack of temporal variation in elec-trofishing CPS of larger individuals was probably due to a combination of spawning and changes in aquatic macrophyte density. Electrofishing catchability of larger large-mouth bass improves if sampling is done dur-ing spawning and when cover is increased (Reynolds and Simpson 1978; McInerny and Cross 2000). Largemouth bass spawned dur-ing the spring sample period, so increased catchability from spawning offsets decreased catchability from low density of aquatic macrophytes in spring. Catchability after spring did not decrease because of increased cover caused by increasing density of aquatic macrophytes. Temporal variation in CPS of smaller largemouth bass was probably related to changes in aquatic macrophyte density within lakes, and to recruitment of age-0 indi-viduals. Juvenile largemouth bass show strong affinities towards aquatic macrophytes (Annett et al. 1996), and age-0 largemouth bass are 6 to 12 cm in Minnesota lakes by fall (MNDNR unpublished data).
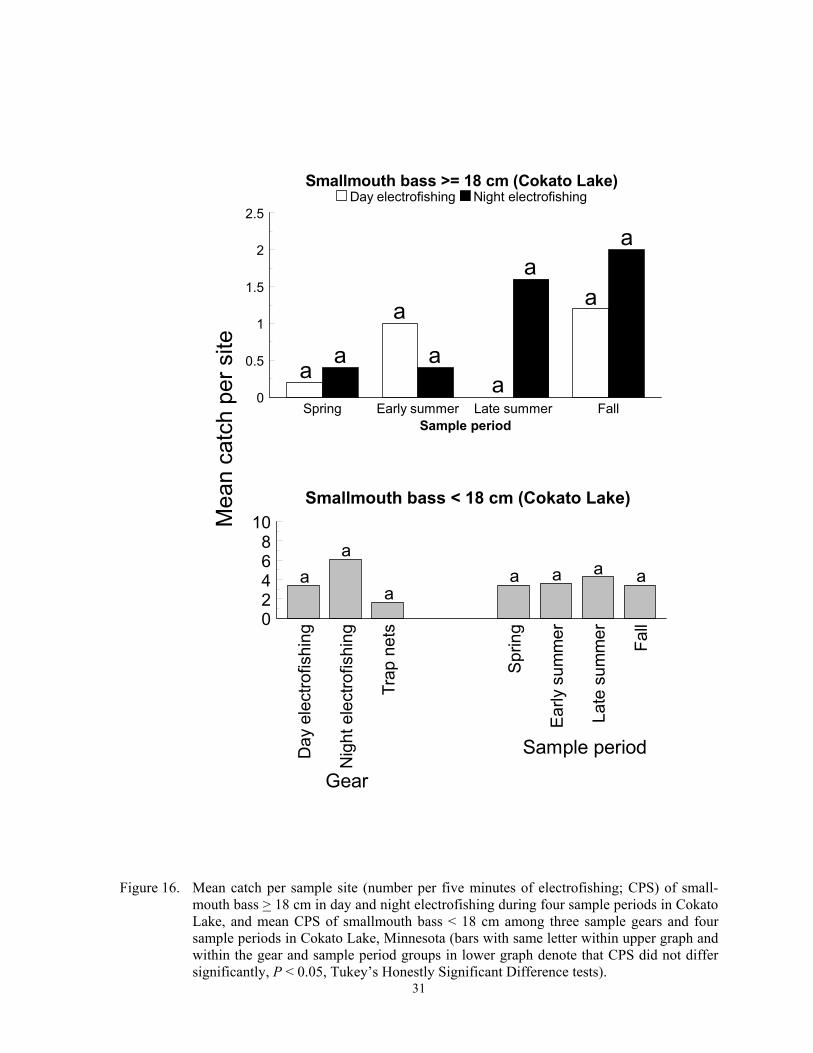
31
Smallmouth bass >= 18 cm (Cokato Lake)
Spring Early summer Late summer Fall0
0.5
1
1.5
2
2.5
Sample period
Day electrofishing Night electrofishing
Smallmouth bass < 18 cm (Cokato Lake)
Day
ele
ctro
fishi
ng
Nig
ht e
lect
rofis
hing
Trap
net
s
Spr
ing
Ear
ly s
umm
er
Late
sum
mer
Fall0
2468
10
b b bb
a
aa a a aa
Gear
Sample period
Mea
n ca
tch
per s
ite a
a
aa
aa
a
a
Figure 16. Mean catch per sample site (number per five minutes of electrofishing; CPS) of small-
mouth bass > 18 cm in day and night electrofishing during four sample periods in Cokato Lake, and mean CPS of smallmouth bass < 18 cm among three sample gears and four sample periods in Cokato Lake, Minnesota (bars with same letter within upper graph and within the gear and sample period groups in lower graph denote that CPS did not differ significantly, P < 0.05, Tukey’s Honestly Significant Difference tests).
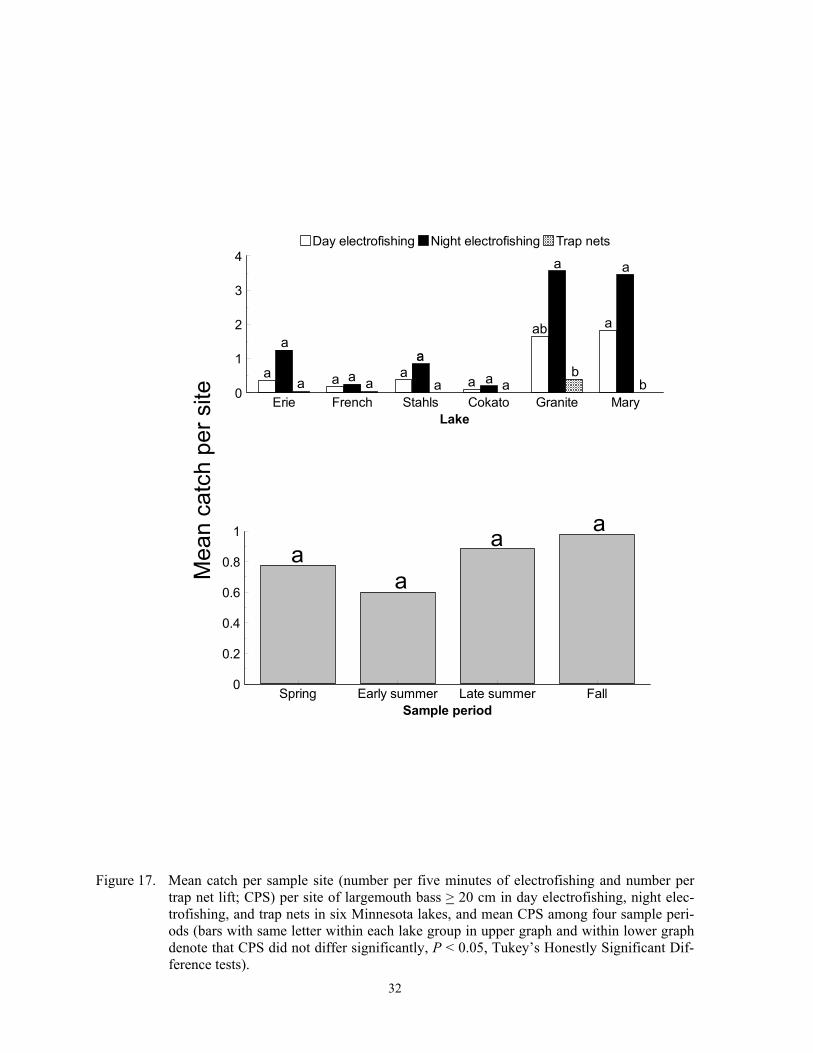
32
Spring Early summer Late summer Fall0
0.2
0.4
0.6
0.8
1
Sample period
Erie French Stahls Cokato Granite Mary0
1
2
3
4
Lake
Day electrofishing Night electrofishing Trap nets
Mea
n ca
tch
per s
ite
aa a a a
aa
aa aa a
a a
aab
a
bb
a
a aa
Figure 17. Mean catch per sample site (number per five minutes of electrofishing and number per
trap net lift; CPS) per site of largemouth bass > 20 cm in day electrofishing, night elec-trofishing, and trap nets in six Minnesota lakes, and mean CPS among four sample peri-ods (bars with same letter within each lake group in upper graph and within lower graph denote that CPS did not differ significantly, P < 0.05, Tukey’s Honestly Significant Dif-ference tests).
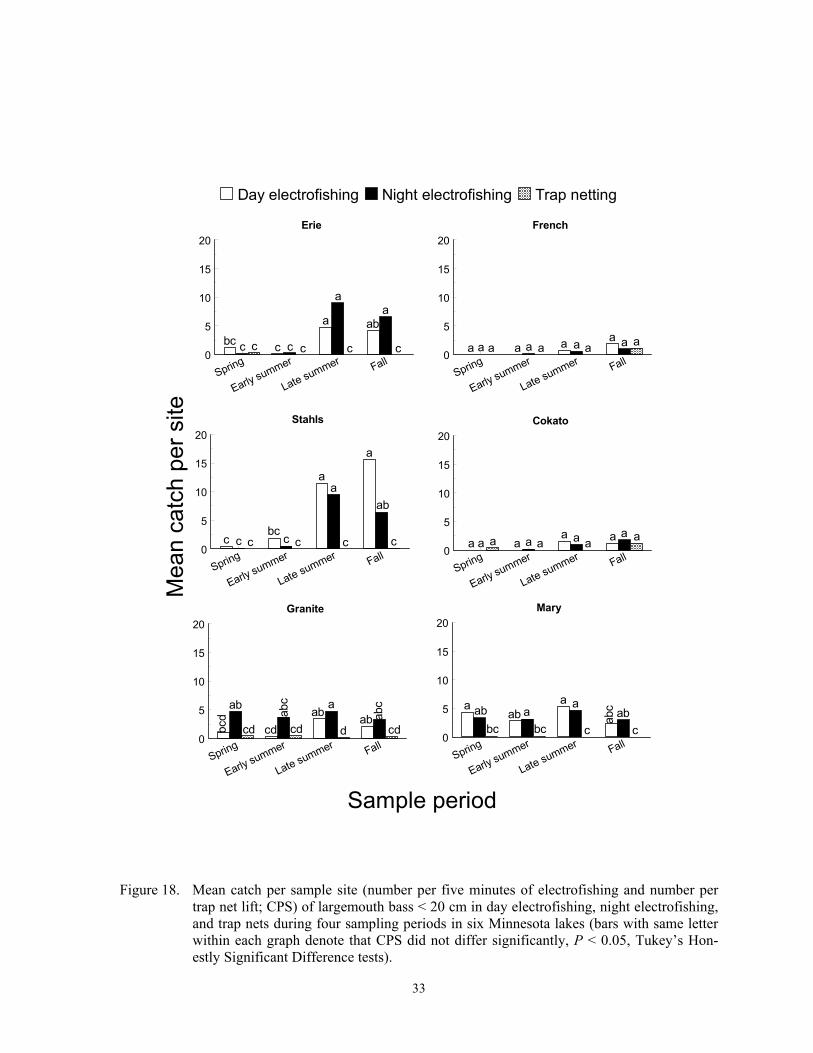
33
Stahls
Spring
Early summer
Late summer Fall0
5
10
15
20
French
Spring
Early summer
Late summer Fall0
5
10
15
20
Cokato
Spring
Early summer
Late summer Fall0
5
10
15
20
Granite
Spring
Early summer
Late summer Fall0
5
10
15
20Mary
Spring
Early summer
Late summer Fall0
5
10
15
20
Erie
Spring
Early summer
Late summer Fall0
5
10
15
20
Day electrofishing Night electrofishing Trap netting
Sample period
Mea
n ca
tch
per s
ite
aa
a
abbc c c c c c cc
aa
a
ab
bcc c c c c cc
aababcab
abcd cd cd d cdbc
d
aa aa
abab ababc
bcbc cc
abc
aa a aa a a aa a aa
aa a aaa a a a a aa
Figure 18. Mean catch per sample site (number per five minutes of electrofishing and number per
trap net lift; CPS) of largemouth bass < 20 cm in day electrofishing, night electrofishing, and trap nets during four sampling periods in six Minnesota lakes (bars with same letter within each graph denote that CPS did not differ significantly, P < 0.05, Tukey’s Hon-estly Significant Difference tests).
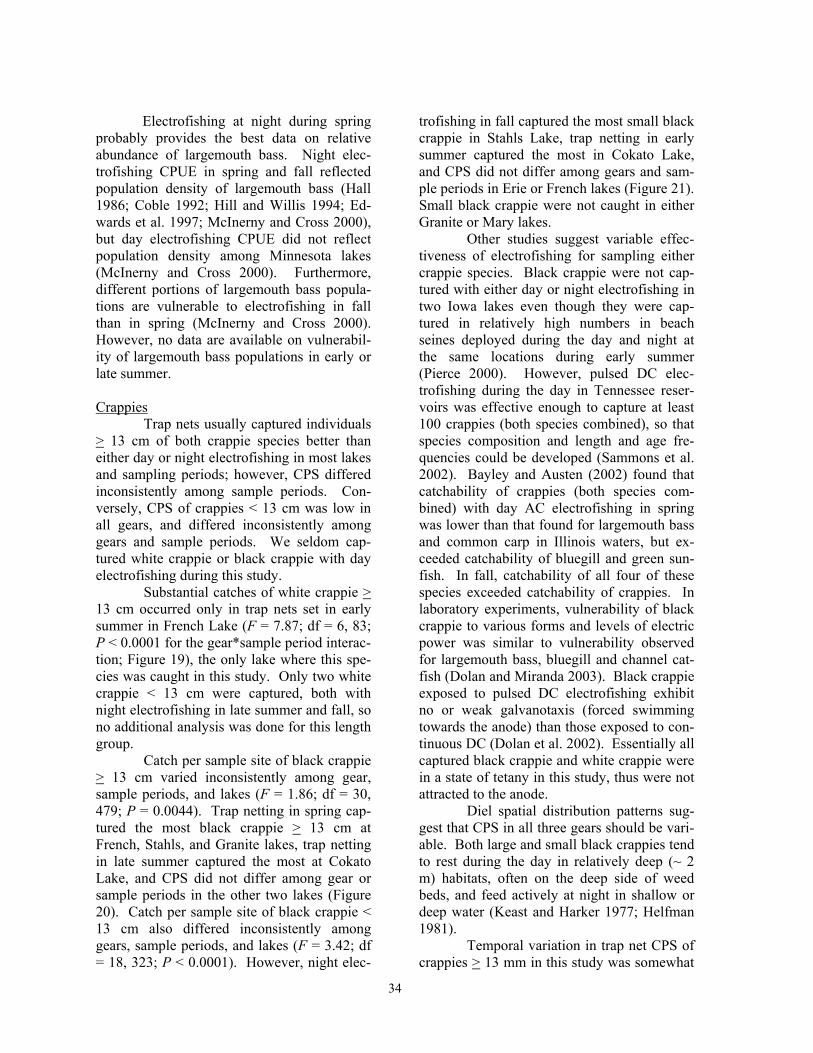
34
Electrofishing at night during spring probably provides the best data on relative abundance of largemouth bass. Night elec-trofishing CPUE in spring and fall reflected population density of largemouth bass (Hall 1986; Coble 1992; Hill and Willis 1994; Ed-wards et al. 1997; McInerny and Cross 2000), but day electrofishing CPUE did not reflect population density among Minnesota lakes (McInerny and Cross 2000). Furthermore, different portions of largemouth bass popula-tions are vulnerable to electrofishing in fall than in spring (McInerny and Cross 2000). However, no data are available on vulnerabil-ity of largemouth bass populations in early or late summer.
Crappies Trap nets usually captured individuals > 13 cm of both crappie species better than either day or night electrofishing in most lakes and sampling periods; however, CPS differed inconsistently among sample periods. Con-versely, CPS of crappies < 13 cm was low in all gears, and differed inconsistently among gears and sample periods. We seldom cap-tured white crappie or black crappie with day electrofishing during this study.
Substantial catches of white crappie > 13 cm occurred only in trap nets set in early summer in French Lake (F = 7.87; df = 6, 83; P < 0.0001 for the gear*sample period interac-tion; Figure 19), the only lake where this spe-cies was caught in this study. Only two white crappie < 13 cm were captured, both with night electrofishing in late summer and fall, so no additional analysis was done for this length group.
Catch per sample site of black crappie > 13 cm varied inconsistently among gear, sample periods, and lakes (F = 1.86; df = 30, 479; P = 0.0044). Trap netting in spring cap-tured the most black crappie > 13 cm at French, Stahls, and Granite lakes, trap netting in late summer captured the most at Cokato Lake, and CPS did not differ among gear or sample periods in the other two lakes (Figure 20). Catch per sample site of black crappie < 13 cm also differed inconsistently among gears, sample periods, and lakes (F = 3.42; df = 18, 323; P < 0.0001). However, night elec-
trofishing in fall captured the most small black crappie in Stahls Lake, trap netting in early summer captured the most in Cokato Lake, and CPS did not differ among gears and sam-ple periods in Erie or French lakes (Figure 21). Small black crappie were not caught in either Granite or Mary lakes.
Other studies suggest variable effec-tiveness of electrofishing for sampling either crappie species. Black crappie were not cap-tured with either day or night electrofishing in two Iowa lakes even though they were cap-tured in relatively high numbers in beach seines deployed during the day and night at the same locations during early summer (Pierce 2000). However, pulsed DC elec-trofishing during the day in Tennessee reser-voirs was effective enough to capture at least 100 crappies (both species combined), so that species composition and length and age fre-quencies could be developed (Sammons et al. 2002). Bayley and Austen (2002) found that catchability of crappies (both species com-bined) with day AC electrofishing in spring was lower than that found for largemouth bass and common carp in Illinois waters, but ex-ceeded catchability of bluegill and green sun-fish. In fall, catchability of all four of these species exceeded catchability of crappies. In laboratory experiments, vulnerability of black crappie to various forms and levels of electric power was similar to vulnerability observed for largemouth bass, bluegill and channel cat-fish (Dolan and Miranda 2003). Black crappie exposed to pulsed DC electrofishing exhibit no or weak galvanotaxis (forced swimming towards the anode) than those exposed to con-tinuous DC (Dolan et al. 2002). Essentially all captured black crappie and white crappie were in a state of tetany in this study, thus were not attracted to the anode.
Diel spatial distribution patterns sug-gest that CPS in all three gears should be vari-able. Both large and small black crappies tend to rest during the day in relatively deep (~ 2 m) habitats, often on the deep side of weed beds, and feed actively at night in shallow or deep water (Keast and Harker 1977; Helfman 1981).
Temporal variation in trap net CPS of crappies > 13 mm in this study was somewhat
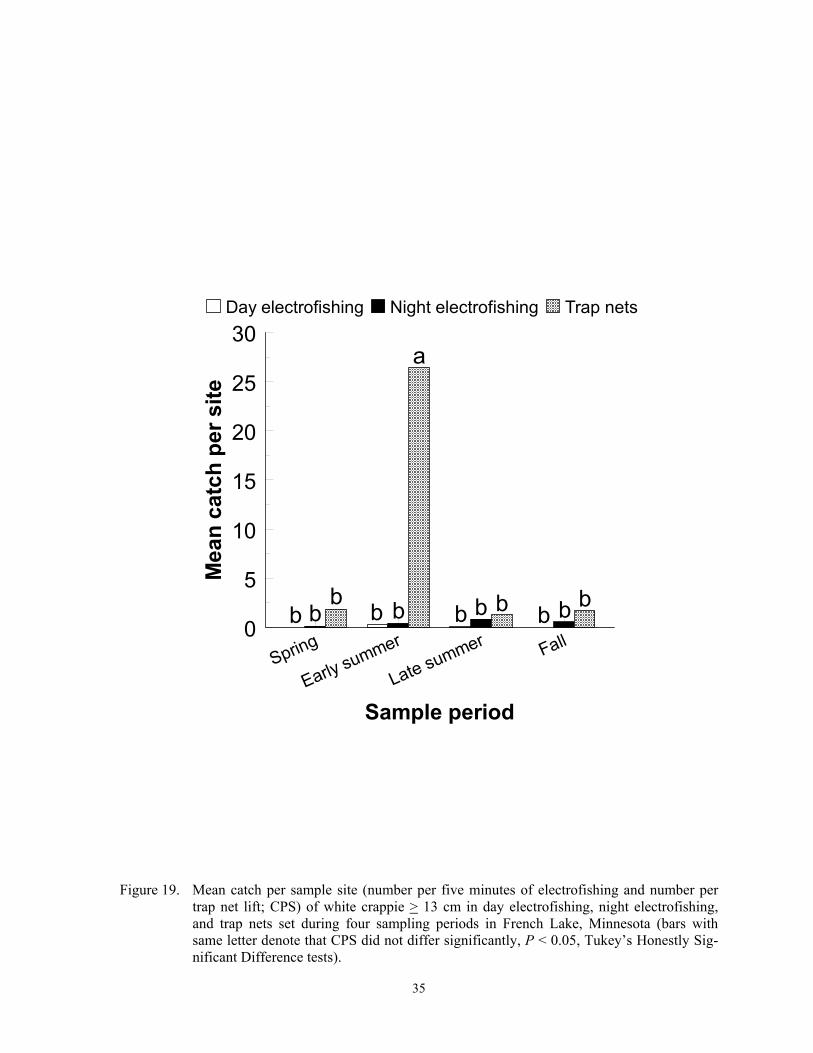
35
Spring
Early summer
Late summer Fall0
5
10
15
20
25
30
Sample period
Mea
n ca
tch
per s
ite
Day electrofishing Night electrofishing Trap nets
a
bb bb b b b b b
bb
Figure 19. Mean catch per sample site (number per five minutes of electrofishing and number per
trap net lift; CPS) of white crappie > 13 cm in day electrofishing, night electrofishing, and trap nets set during four sampling periods in French Lake, Minnesota (bars with same letter denote that CPS did not differ significantly, P < 0.05, Tukey’s Honestly Sig-nificant Difference tests).

36
Stahls
Spring
Early summer
Late summer Fall0
10
20
30
40
French
Spring
Early summer
Late summer Fall0
10
20
30
40
Cokato
Spring
Early summer
Late summer Fall0
10
20
30
40
Granite
Spring
Early summer
Late summer Fall0
10
20
30
40Mary
Spring
Early summer
Late summer Fall0
10
20
30
40
Erie
Spring
Early summer
Late summer Fall0
10
20
30
40
Day electrofishing Night electrofishing Trap netting
Sample period
Mea
n ca
tch
per s
ite
a
ab
b bb bbb b
bbb
aa a
a
ab ab abb b b bb
a
ab ababab
b b b bbbb
aababab abab ababab
abbb
aa a aa
a a a a aa
a
a a aa a a aa a aaa
Figure 20. Mean catch per sample site (number per five minutes of electrofishing and number per
trap net lift; CPS) of black crappie > 13 cm in day electrofishing, night electrofishing, and trap nets during four sampling periods in six Minnesota lakes (bars with same letter within each graph denote that CPS did not differ significantly, P < 0.05, Tukey’s Hon-estly Significant Difference tests).
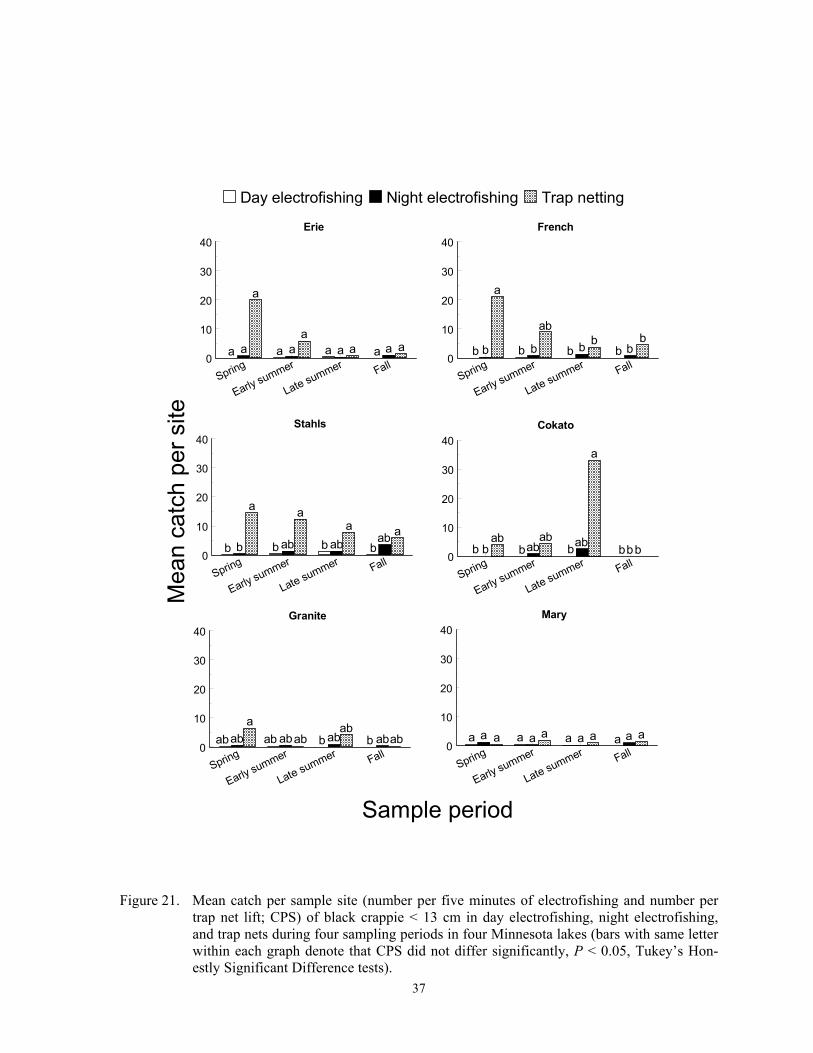
37
Stahls
Spring
Early summer
Late summer Fall0
10
20
30
40
French
Spring
Early summer
Late summer Fall0
10
20
30
40
Cokato
Spring
Early summer
Late summer Fall0
10
20
30
40
Granite
Spring
Early summer
Late summer Fall0
10
20
30
40Mary
Spring
Early summer
Late summer Fall0
10
20
30
40
Erie
Spring
Early summer
Late summer Fall0
10
20
30
40
Day electrofishing Night electrofishing Trap netting
Sample period
Mea
n ca
tch
per s
ite
a
ab
b bb bbb b
bbb
aa a
a
ab ab abb b b bb
a
ab ababab
b b b bbbb
aababab abab ababab
abbb
aa a aa
a a a a aa
a
a a aa a a aa a aaa
Figure 21. Mean catch per sample site (number per five minutes of electrofishing and number per
trap net lift; CPS) of black crappie < 13 cm in day electrofishing, night electrofishing, and trap nets during four sampling periods in four Minnesota lakes (bars with same letter within each graph denote that CPS did not differ significantly, P < 0.05, Tukey’s Hon-estly Significant Difference tests).
38
similar to that observed elsewhere, and varia-tion is probably associated with spawning, recruitment, or mortality. Trap net CPUE of black crappie differed inconsistently between summer (June through August) and fall (Sep-tember and October) in other Minnesota lakes, but summer CPUE of white crappie usually exceeded fall CPUE (McInerny and Cross 1993). Guy and Willis (1991) reported that CPUE of black crappie > 13 cm in a South Dakota lake was highest in fall and lowest in spring, the opposite of what we observed in most lakes in this study. However, CPUE of black crappie did not differ among monthly sample periods from early summer to late summer (June through August) in north tem-perate lakes (Stang and Hubert 1984; Guy and Willis 1991), similar to what we observed. Both species spawn during spring and early summer sample periods (Siefert 1968; Mitzner 1991; Pope et al. 1996; Pope and Willis 1997), but black crappie often begin spawning before white crappie. The latter could explain why peak trap net CPS of black crappie in French Lake occurred in spring, but peak white crap-pie CPS occurred in early summer (Figures 19 and 20). Telemetry studies demonstrated that white crappie in a South Dakota lake were shallower and closer to shore in June than any other time of the year (Guy et al. 1994), and black crappie in another South Dakota lake and in a different year inhabited shallow water at night during May and June (Guy et al. 1992). The high trap net CPS of black crappie > 13 cm at Cokato Lake in late summer likely resulted from recruitment of a strong year-class. Kelley (1953) also observed that re-cruitment of younger year-classes caused high trap net CPUE during late summer and fall in backwaters of the Upper Mississippi River. Darters
Day electrofishing often resulted in higher CPS of darters than night electrofish-ing, but temporal patterns differed between species and lakes. Trap nets failed to capture any darters. The ANOVA on Iowa darter CPS detected a gear*sample period interaction (F = 4.33; df = 3, 55; P = 0.0088). Most Iowa darter were captured with day electrofishing in fall in Lake Erie (Figure 22). The ANOVA on
johnny darter CPS suggested gear*lake (F = 6.66; df = 2, 151; P = 0.0018) and sample pe-riod*lake (F = 4.10; df = 6, 151; P = 0.0008) interactions. Day CPS exceeded night CPS at Cokato Lake, but CPS was low and did not differ between gears in French and Granite lakes (Figure 22). Johnny darter CPS was also highest in spring at Cokato Lake. Iowa darter are active in water < 1.5 m deep during the day, but hide in rock crevices, holes, and in or under submerged trees at night (Emery 1973), and these diel patterns could have explained diel differences in electrofishing CPS. Con-versely, johnny darter tend to inhabit shallow waters at higher densities at night than day (Emery 1973), but this behavior did not result in higher night CPS in our study lakes. Both species spawn in shallow water during spring, which could have influenced the high CPS of johnny darter in Cokato Lake, but increased CPS of Iowa darter in fall was probably due to recruitment of age-0 individuals, which also have a strong affinities for aquatic macro-phytes (Becker 1983). Yellow perch Trap nets caught fewer yellow perch > 13 cm than either type of electrofishing in all sample periods and lakes, but CPS did not dif-fer between day and night electrofishing (F = 3.64; df = 2, 479; P = 0.0272; Figure 23). Catch per sample site of smaller yellow perch in day and night electrofishing did not differ (F = 1.11; df = 1, 320; P = 0.2937; Figure 23). Trap nets captured few yellow perch < 13 cm; thus these data were excluded from catch analysis for this length group. Catch per sam-ple site of both length groups differed among sample periods in some lakes and not others (F = 7.12; df = 15, 479; P < 0.0001 for sample period*lake interaction for yellow perch > 13 cm; F = 4.60; df = 15; 320; P < 0.0001 for sample period*lake interaction for yellow perch < 13 cm). Fall CPS of larger yellow perch in Erie and French lakes exceeded CPS in late summer, and spring CPS in Granite Lake exceeded CPS in late summer and fall (Figure 23). However, CPS of larger yellow perch did not differ among sample periods in the other three lakes. Spring and fall CPS of smaller yellow perch in French Lake exceeded

39
Iowa darter (Lake Erie)
Spring Early summer Late summer Fall0
1
2
3
4
Sample period
Day electrofishing Night electrofishing
Mea
n ca
tch
per s
ite
a
b b
Johnny darter
French Cokato Granite0
0.5
1
1.5
2
Lake
Spring Early summer Late summer Fall
a
French Cokato Granite0
0.2
0.4
0.6
0.8
1
Lake
Day electrofishing Night electrofishing
a
bbb bbb b b
b bbb b
b bb
bbbb b
Figure 22. Mean catch per sample site (number per five minutes of electrofishing; CPS) of Iowa
darter among four sample periods in Lake Erie, and mean CPS of johnny darter among four sample periods and between day and night electrofishing in three Minnesota lakes (bars with same letters within the Iowa darter graph and within lake groups in each johnny darter graph denote that CPS did not differ significantly, P < 0.05, Tukey’s Hon-estly Significant Difference tests).
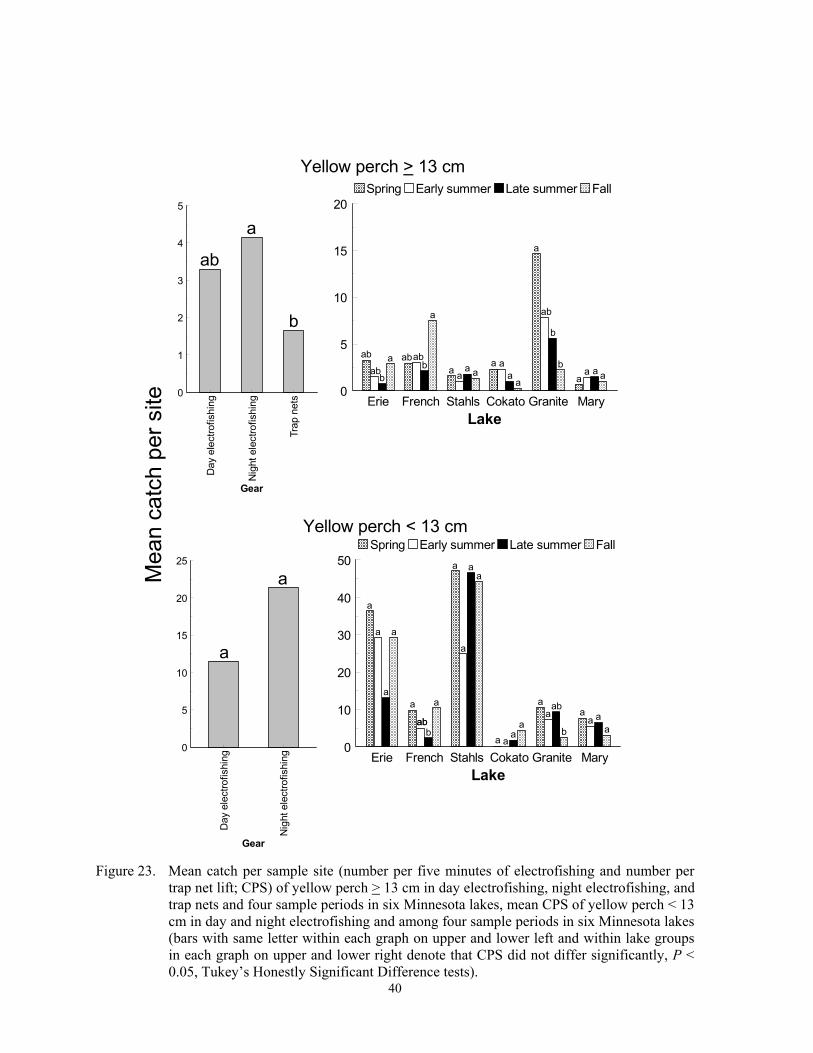
40
Erie French Stahls Cokato Granite Mary0
10
20
30
40
50
Lake
Spring Early summer Late summer Fall
Day
ele
ctro
fishi
ng
Nig
ht e
lect
rofis
hing
0
5
10
15
20
25
Gear
Mea
n ca
tch
per s
ite
Day
ele
ctro
fishi
ng
Nig
ht e
lect
rofis
hing
Trap
net
s0
1
2
3
4
5
Gear
Erie French Stahls Cokato Granite Mary0
5
10
15
20
Lake
Spring Early summer Late summer Fall
ab
a
b a
a aa a
a aa
a
a
aa a a
aab
abab
ab
abb
b
bb
a
aa
a
a
a aa
a
a
abb
a
a
a
aa
aa
a ab
bab a a
a
a
Yellow perch < 13 cm
Yellow perch > 13 cm
Figure 23. Mean catch per sample site (number per five minutes of electrofishing and number per
trap net lift; CPS) of yellow perch > 13 cm in day electrofishing, night electrofishing, and trap nets and four sample periods in six Minnesota lakes, mean CPS of yellow perch < 13 cm in day and night electrofishing and among four sample periods in six Minnesota lakes (bars with same letter within each graph on upper and lower left and within lake groups in each graph on upper and lower right denote that CPS did not differ significantly, P < 0.05, Tukey’s Honestly Significant Difference tests).
41
CPS in late summer, but CPS in spring and early summer at Granite Lake exceeded fall CPS (Figure 23). Diel spatial distribution patterns of yellow perch tend to vary among lakes, which could explain similarities between day and night electrofishing CPS. Shoreline abun-dance of yellow perch in some Ontario lakes was higher at night than day (Emery 1973). Yellow perch 7 to 20 cm in a New York lake generally stayed in shoreline areas 1 to 7 m deep during day and night, but they actively moved and fed during the day and rested at night (Helfman 1979). McCarty (1990) ob-served that yellow perch in a Wisconsin lake moved to deeper offshore waters soon after sunrise and moved toward shallower areas by sunset. Pierce et al. (2001) reported that night electrofishing CPH exceeded day CPH by about 1.6 times in two Iowa lakes, but day catches in large beach seines exceeded night catches by about 3.7 times. Temporal variation in yellow perch CPS in this study appears lake specific and was not strongly linked to effects from spawn-ing or changes in density of aquatic macro-phytes. Yellow perch spawn when water temperatures range from 7 to 11 oC (Carlander 1997), before most of our spring sampling be-gan. Most yellow perch in a Michigan lake inhabited shallow water in May, but were off-shore in midsummer and fall (Hall and Werner 1977). Distribution of juvenile yellow perch (age-0 individuals > 25 mm) were strongly linked to distribution of their forage but not linked to distribution submergent macrophytes (Fisher et al. 1999). Keast (1978b) observed yellow perch in deep water near aquatic macrophytes but also in inshore open water areas. Elsewhere, temporal variation in trap net catches differed among lakes. Trap net CPUE of yellow perch > 13 cm in a South Dakota lake peaked in late summer (August) and was low in spring, early summer and fall (Guy and Willis 1991), but CPUE in an Iowa lake was higher in early summer than in late summer (Stang and Hubert 1984). Walleye Night electrofishing and trap netting sampled walleye, but day electrofishing usu-
ally did not. Larger (> 25 cm) walleye were caught in sufficient numbers in four of the six lakes, and CPS differed inconsistently be-tween gears, sample periods, and lakes (F = 2.26; df = 18; 335; P = 0.0027). Catch per sample site of larger walleye was highest in spring trap nets at Lake Mary, but CPS was low and did not differ among sample gears or sample periods in the other three lakes (Figure 24). Sufficient numbers of smaller (< 25 cm) walleye were caught only in French Lake, and only with day and night electrofishing. Elec-trofishing CPS of smaller walleye was higher in late summer and fall than in spring or early summer, and night CPS exceeded day CPS in late summer and fall but not in the other two periods (F = 3.31; df = 3, 55; P = 0.0279 for gear*sample period interaction; Figure 24). Elsewhere, day electrofishing was also ineffective for sampling walleye, but night electrofishing and trap netting oftentimes cap-tured high numbers of this species. In two Iowa lakes, no walleye were caught with day electrofishing, but about 8 walleye/hr were captured with night electrofishing (Pierce et al. 2001). In five south central Minnesota lakes, night CPH of walleye < 25 cm always ex-ceeded and was about 7 times greater than day CPH in fall and spring (MNDNR unpublished data). Day electrofishing is probably ineffec-tive because walleye are usually inactive, and usually do not inhabit shallow shoreline habi-tats during the day probably due to the species sensitivity to light (Ryder 1977; Kelso 1978; Helfman 1981). Helfman (1981) did observe some walleyes 40-60 cm resting in aquatic vegetation during the day, and many day cap-tures of larger walleye in this study occurred in vegetated areas. Trap netting immediately after ice-out and before our spring sample pe-riods can provide sufficient numbers of adult walleye for estimating population size (Rogers et al. 2003). Spawning or changes in density of aquatic macrophytes did not affect temporal variation in CPS. Our spring sampling oc-curred after walleye spawned (water tempera-tures 1-10 oC)(Carlander 1997), and walleye are not strongly associated with submergent aquatic macrophytes. The highest trap net CPUE in a South Dakota lake occurred during

42
Stahls
Spring
Early summer
Late summer Fall0
0.5
1
1.5
2
French
Spring
Early summer
Late summer Fall0
0.5
1
1.5
2
Mary
Spring
Early summer
Late summer Fall0
0.5
1
1.5
2
Erie
Spring
Early summer
Late summer Fall0
0.5
1
1.5
2
Day electrofishing Night electrofishing Trap netting
Sample periodMea
n ca
tch
per s
ite
aa
a
a
a a a a aa aa
a
ababb
bb
bb bb
ab ab
aa a
a aa
aa
a
aa
a
aaa a a a a a
a a aa
Spring Early summer Late summer Fall0
1
2
3
4
5
Sample period
Day electrofishing Night electrofishingWalleye < 25 cm; French Lake
Walleye > 25 cm
a
b bbc bcc cc
Figure 24. Mean catch per sample site (number per five minutes of electrofishing and number per
trap net lift; CPS) of walleye > 25 cm in day electrofishing, night electrofishing, and trap nets and four sample periods in four Minnesota lakes, and mean CPS of walleye < 25 cm in day and night electrofishing among four sample periods in French Lake, Minnesota (bars with same letter within each graph denote that CPS did not differ significantly, P < 0.05, Tukey’s Honestly Significant Difference tests).
43
late October, after our fall sampling, but CPUE did not differ among the other months sampled (March through September)(Guy and Willis 1991). Increased electrofishing CPS of walleye < 25 cm from spring to fall in French Lake was probably caused by recruitment of age-0 individuals stocked as fry during spring.
Elsewhere, trap net and night elec-trofishing CPUE during some times of the year crudely reflects population density. Both trap net and night electrofishing CPH of adult wall-eye after ice-out increased nonlinearly with increasing population density among Wisconsin lakes (Rogers et al. 2003), and fall electrofish-ing CPH of fingerling walleye increased nonlinearly with increasing density among an-other set of Wisconsin lakes (Hansen et al. 2004). We do not know of any research relat-ing CPUE in trap nets or night electrofishing and population density during other times of the year.
Management Implications
Although each of these gears capture high numbers of some species during certain sample periods, CPS data must be interpreted with caution. The gear*lake and gear*sample period*lake interactions suggest that CPS in one or more gears does not reflect density among lakes for many species. Electrofishing catchability in this study surely decreased with increasing population density because of gear saturation, especially for bluegill and yellow perch where night electrofishing CPH of these two species sometimes exceeded 600/hr. Other studies showed that night electrofishing catchability of both walleye and largemouth bass decreased with increasing density, yet the highest CPH of these two species was around 300/hr (McInerny and Cross 2000; Rogers et al. 2003; Hansen et al. 2004). Density effects on catchability were likely more pronounced because we attempted to capture all fish spe-cies rather than select for a few. Trap net catchability can also be affected by density. Rogers et al. (2003) reported decreasing trap net catchability with increasing density of adult walleye immediately after ice-out. Re-sults of this study are probably applicable to most small lakes with some or high densities
of submergent macrophytes. However, in other types of lakes, species-selectivity and diel and temporal variation in CPS of some species would likely differ from that observed in this study.
Day or night electrofishing should be considered as alternatives for sampling littoral fish species during lake surveys and popula-tion assessments in Minnesota lakes. More and different species are captured with either type of electrofishing than with trap nets dur-ing the early and late summer sample periods, which is when surveys and population assess-ments are done (MNDNR 1993). Further-more, smaller fishes in habitats comprised of aquatic macrophytes, soft substrates, and un-derwater snags are sampled more effectively with electrofishing than with seines, the only other gear frequently used to sample smaller fishes in Minnesota lakes (MNDNR 1993). Managers interested in sunfish fisher-ies, evaluating stocking success of sport fish, or developing indices of biotic integrity (IBI) should also consider electrofishing in addition to other gears. Electrofishing is less size-selective than trap netting, which is the gear of choice for monitoring sunfish populations (MNDNR 1993). Thus, more accurate esti-mates of size and age structure of sunfishes can be obtained with electrofishing than trap netting. Yellow perch < 10 cm are primary forage for walleye in Minnesota lakes, and yellow perch CPUE in experimental gill nets is one of several criteria used in decisions re-garding walleye stocking (Davis 1975; John-son and Osborn 1977; MNDNR 1996). However, median lengths of yellow perch caught in the smallest mesh (1.9 cm bar) of the gill nets used in all Minnesota lakes sampled in 1994 to 1999 was 15 cm, and less than 0.03 percent were less than 10 cm (P.C. Jacobson, Minnesota Department of Natural Resources, personal communication). Few yellow perch in many lakes actively stocked with walleye reach 15 cm TL, and many of these lakes are also weedy which reduces effectiveness of seining (MNDNR unpublished data). Conse-quently, incorrect conclusions about yellow perch populations have been made, which re-sulted in less than optimum management deci-sions (MNDNR unpublished data). Lastly,
44
day and night electrofishing captured many of the same fish species as seines and backpack electrofishing used to develop fish-based IBIs for Minnesota lakes (Drake and Pereira 2002). Therefore, with some adjustments, data from shoreline electrofishing could be used to de-velop meaningful IBIs.
References
Anderson, R.O., and R.M. Neumann. 1996. Length, weight, and associated struc-tural indices. Pages 447-482 in B.R. Murphy and D.W. Willis, editors. Fisheries techniques. Second Edition. American Fisheries Society, Bethesda, Maryland.
Annett, C., J. Hunt, and E.D. Dibble. 1996. The compleat bass: habitat use patterns of all stages of the life cycle of largemouth bass. Pages 306-314 in L.E. Miranda and D.R. DeVries, editors. Multidimen-sional approaches to reservoir fisheries management. American Fisheries Soci-ety, Bethesda, Maryland.
Baumann, P.C., and J.F. Kitchell. 1974. Diel patterns of distribution and feeding of bluegill (Lepomis macrochirus) in Lake Wingra, Wisconsin. Transac-tions of the American Fisheries Soci-ety 103:255-260.
Bayley, P.B., and D.J. Austen. 2002. Capture efficiency of a boat electrofisher. Transactions of the American Fisher-ies Society 131:435-451.
Becker, G.C. 1983. Fishes of Wisconsin. The University of Wisconsin Press, Madison.
Bettross, E.A., and D.W. Willis. 1988. Sea-sonal patterns in sampling data for largemouth bass and bluegills in a northern Great Plains impoundment. Prairie Naturalist 20(4):193-202.
Bister, T.J., D.W. Willis, M.L. Brown, S.M. Jordan, R.M. Neumann, M.C. Quist, and C.S. Guy. 2000. Proposed stan-dard weight (Ws) equations and stan-dard length categories for 18 warmwater nongame and riverine fish species. North American Journal of Fisheries Management 20:570-574.
Brazner, J.C., and E.W. Beals. 1997. Patterns in fish assemblages from coastal wet-
land and beach habitats in Green Bay, Lake Michigan: a multivariate analy-sis of abiotic and biotic forcing fac-tors. Canadian Journal of Fisheries and Aquatic Sciences 54:1743-1761.
Brown, J.A., and P.W. Colgan. 1982. The inshore vertical distribution of young-of-year Lepomis in Lake Opinicon, Ontario. Copeia 1982:958-960.
Brown, M.L., D.W. Willis, and B.G. Black-well. 1999. Physiochemical and bio-logical influences on black bullhead populations in eastern South Dakota glacial lakes. Journal of Freshwater Ecology 14:47-60.
Carlander, K.D. 1969. Handbook of freshwa-ter fishery biology. Volume 1. Iowa State University Press, Ames.
Carlander, K.D. 1997. Handbook of freshwa-ter fishery biology. Volume 3. Iowa State University Press, Ames.
Casselman, J.M., and C.A. Lewis. 1996. Habitat requirements of northern pike (Esox lucius). Canadian Journal of Fisheries and Aquatic Sciences 53(Supplement 1):161-174.
Chapman, C.A., and W.C. MacKay. 1983. Direct observation of habitat utiliza-tion by northern pike. Copeia 1983:255-258.
Coble, D.W. 1992. Predicting population density of largemouth bass from elec-trofishing catch per effort. North American Journal of Fisheries Man-agement 12:650-652.
Copeland, J.R., and R.L. Noble. 1994. Movements of young-of-year and yearling largemouth bass and their implications for supplemental stock-ing. North American Journal of Fish-eries Management 14:119-124.
Corbett, B, and P.M. Powles. 1983. Spawn-ing and early-life ecological phases of the white sucker in Jack Lake, On-tario. Transactions of the American Fisheries Society 112:308-313.
Cross, T.K., M.C. McInerny, and D.H. Schupp. 1995. Seasonal variation in trap-net catches of bluegill in Minne-sota lakes. North American Journal of Fisheries Management 15:382-389.
Cross, T.K., and M.C. McInerny. 2001. Spa-tial habitat influences on inshore fish
45
communities in a selected Minnesota ecological lake class. Minnesota De-partment of Natural Resources, Divi-sion of Fisheries, Investigational Report 494, St. Paul.
Davis, R. 1975. Food habits of walleye in a southern Minnesota lake. Minnesota Department of Natural Resources, Section of Fisheries, Investigational Report 333, St. Paul.
Diana, J.S. 1980. Diel activity pattern and swimming speeds of northern pike (Esox lucius) in Lac Ste. Anne, Al-berta. Canadian Journal of Fisheries and Aquatic Sciences 37:1454-1458.
Dolan, C.R., and L.E. Miranda. 2003. Immo-bilization thresholds of electrofishing relative to fish size. Transactions of the American Fisheries Society 132:969-976.
Dolan, C.R., L.E. Miranda, and T.B. Henry. 2002. Electrofishing for crappies: electrical settings influence immobili-zation efficiency, injury, and mortal-ity. North American Journal of Fisheries Management 22:1442-1451.
Drake, M.T., and D.P. Pereira. 2002. Devel-opment of a fish-based index of biotic integrity for small inland lakes in cen-tral Minnesota. North American Journal of Fisheries Management 22:1105-1123.
Dumont, S.C., and J.A. Dennis. 1997. Com-parison of day and night electrofishing in Texas reservoirs. North American Journal of Fisheries Management 17:939-946.
Edwards, C.M., R.W. Drenner, K.L. Gallo, and K.E. Rieger. 1997. Estimation of population density of largemouth bass in ponds using mark-recapture and electrofishing catch per effort. North American Journal of Fisheries Man-agement 17:719-725.
Eddy, S., and J.C. Underhill. 1974. Northern fishes. University of Minnesota Press, Minneapolis.
Emery, A.R. 1973. Preliminary comparisons of day and night habits of freshwater fish in Ontario lakes. Journal of the Fisheries Research Board of Canada 30:761-774.
Essington, T.E., and J.F. Kitchell. 1999. Ca-nadian Journal of Fisheries and Aquatic Sciences 56 (Supplement 1):52-60.
Fisher, S.J., C.R. Pyle, and D.W. Willis. 1999. Habitat use by age-0 yellow perch in two South Dakota glacial lakes. Ecology of Freshwater Fish 8:85-93.
Garcia-Berthou, E. 2001. Size- and depth-dependent variation in habitat and diet of the common carp (Cyprinus car-pio). Aquatic Sciences 63:466-476.
Guy, C.S., R.M. Neumann, and D.W. Willis. 1992. Movement patterns of adult black crappie, Pomoxis nigromaculatus, in Brant Lake, South Dakota. Journal of Freshwater Ecology 7:137-147.
Guy, C.S., and D.W. Willis. 1991. Seasonal variation in catch rate and body condi-tion for four fish species in a South Dakota natural lake. Journal of Freshwater Ecology 6(3): 281-292.
Guy, C.S., D.W. Willis, and J.J Jackson. 1994. Biotelemetry of white crappies in a South Dakota glacial lake. Trans-actions of the American Fisheries So-ciety 123:63-70.
Hall, D.J., and E.E. Werner. 1977. Seasonal distribution and abundance of fishes in the littoral zone of a Michigan lake. Transactions of the American Fisher-ies Society 106:545-555.
Hall, D.J., E.E. Werner, J.F. Gilliam, G.G. Mittelbach, D. Howard, C.G. Doner, J.A. Dickerman, and A.J. Stewart. 1979. Diel foraging behavior and prey selection in the golden shiner (Notemigonus crysoleucas). Journal of the Fisheries Research Board of Canada 36:1029-1039.
Hall, T.J. 1986. Electrofishing catch per hour as an indicator of largemouth bass density in Ohio impoundments. North American Journal of Fisheries Man-agement 6:397-400.
Hanchin, P.A., D.W. Willis, and M.J. Hubers. 2002a. Black bullhead growth in South Dakota waters: limnological and community influences. Journal of Freshwater Ecology 17:65-73.
Hanchin, P.A., D.W. Willis, and T. R. St. Sauver. 2002b. Comparison of con-

46
current trap-net and gill-net samples for black bullheads. Journal of Freshwater Ecology 17:233-237.
Hansen, M.J., S.P. Newman, and C.J. Ed-wards. 2004. A reexamination of the relationship between electrofishing catch rate and age-0 walleye density in northern Wisconsin lakes. North American Journal of Fisheries Man-agement 24:429-439.
Helfman, G.S. 1979. Twilight activities of yellow perch, Perca flavescens. Jour-nal of the Fisheries Research Board of Canada 36:173-179.
Helfman, G.S. 1981. Twilight activities and temporal structure in a freshwater fish community. Canadian Journal of Fisheries and Aquatic Sciences 38:1405-1420.
Hill, T.D., and D.W. Willis. 1994. Influence of water conductivity on pulsed AC and pulsed DC electrofishing catch rates for largemouth bass. North American Journal of Fisheries Man-agement 14:202-207.
Hubert, W.A. 1996. Passive capture techniques. Pages 157-192 in B.R. Murphy and D.W. Willis, editors. Fisheries tech-niques. Second edition. American Fisheries Society, Bethesda, Maryland.
Jackson, J.J., and D.L. Bauer. 2000. Size structure and catch rates of white crappie, black crappie, and bluegill in trap nets with 13-mm and 16-mm mesh. North American Journal of Fisheries Management 20:646-650.
Johnson, F.H., and T.C. Osborn. 1977. Ex-perimental management of a small re-claimed lake in northern Minnesota for walleye, Stizostedion vitreum vitreum (Mitchell). Minnesota De-partment of Natural Resources, Sec-tion of Fisheries, Investigational Report 346, St. Paul.
Keast, A. 1978a. Feeding interrelationships between age-groups of pumpkinseed (Lepomis gibbosus) and comparisons with bluegill (L. macrochirus). Jour-nal of the Fisheries Research Board of Canada 35:12-27.
Keast, A. 1978b. Trophic and spatial interre-lationships in the fish species of an
Ontario temperate lake. Environ-mental Biology of Fishes 3:7-31.
Keast, A., and J. Harker. 1977. Fish distribu-tion and benthic invertebrate biomass relative to depth in an Ontario lake. Environmental Biology of Fishes 2:235-240.
Kelley, D.W. 1953. Fluctuation in trap-net catches in the Upper Mississippi River. United States Department of the Interior Fish and Wildlife Service Special Scientific Report 101, Wash-ington, D.C.
Kelso, J.R.M. 1978. Diel rhythm in activity of walleye, Stizostedion vitreum vitreum. Journal of Fish Biology 12:593-599.
Kruse, M.S. 1993. An evaluation of bluegill sampling methods. Missouri Depart-ment of Conservation, Dingell-Johnson Project F-1-R-42, Study I-29, Job 1, Final Report, Columbia.
Laarman, P.W., and J.R. Ryckman. 1982. Relative size selectivity of trap nets for eight species of fish. North American Journal of Fisheries Man-agement 2:33-37.
Latta, W.C. 1959. Significance of trap-net selectivity in estimating fish popula-tion statistics. Papers of the Michigan Academy of Science, Arts, and Letters 44:123-138.
Lewis, W.M., and S. Flickinger. 1967. Home range tendency of the largemouth bass (Micropterus salmoides). Ecology 48:1020-1023.
Malvestuto, S.P., and B.J. Sonski. 1990. Catch rate and stock structure: a com-parison of daytime versus nighttime electric fishing on West Point Reser-voir, Georgia, Alabama. Pages 210-218 in I.G. Cowx, editor. Develop-ments in electric fishing. Cambridge University Press, Cambridge, U.K.
McCarty, J.P. 1990. Diel periodicity of movement and feeding of yellow perch (Perca flavescens) in Lake Mendota, Wisconsin. Wisconsin Academy of Sciences, Arts, and Let-ters 78:65-76.
McInerny, M.C., and T.K. Cross. 1993. Comparison of summer gill netting and trap netting to fall trap netting for
47
sampling crappie populations in Min-nesota lakes. Minnesota Department of Natural Resources, Section of Fish-eries Investigational Report Number 430, St. Paul.
McInerny, M.C., and T.K. Cross. 1995. Ef-fects of lake reclamation, winter aera-tion, commercial fishing, and selected fish species on black bullhead popula-tions in shallow fishing lakes in southern Minnesota. Minnesota De-partment of Natural Resources, Sec-tion of Fisheries Staff Report 52, St. Paul.
McInerny, M.C., and T.K. Cross. 1996. Sea-sonal and diel variation in electrofish-ing size-selectivity and catch-per-hour of largemouth bass in Minnesota lakes. Minnesota Department of Natural Resources, Section of Fisher-ies Investigational Report Number 451, St. Paul.
McInerny, M.C., and T.K. Cross. 2000. Ef-fects of sampling time, intraspecific density, and environmental variables on electrofishing catch per effort of largemouth bass in Minnesota lakes. North American Journal of Fisheries Management 20:328-336.
Milewski, C.L., and D.W. Willis. 1991. Smallmouth bass size structure and catch rates in five South Dakota lakes as determined from two sampling gears. Prairie Naturalist 23(2): 53-60.
Miller, R.J. 1975. Comparative behavior of centrarchid basses. Pages 85-94 in H. Clepper, editor. Black bass biology and management. Sport Fishing Insti-tute, Washington.
Minnesota Department of Natural Resources (MNDNR). 1993. Manual of instruc-tions for lake survey. Minnesota De-partment of Natural Resources, Section of Fisheries Special Publica-tion Number 147, St. Paul.
Minnesota Department of Natural Resources (MNDNR). 1996. Walleye stocking guidelines for fisheries managers. Minnesota Department of Natural Re-sources, Section of Fisheries Special Publication Number 150, St. Paul.
Miranda, L.E., and C.R. Dolan. 2003. Test of a power transfer model for standard-
ized electrofishing. Transactions of the American Fisheries Society 132:1179-1185.
Mitzner, L. 1991. Effect of environmental variables upon crappie young, year-class strength, and the sport fishery. North American Journal of Fisheries Management 11:534-542.
Moyle, P.B. 1973. Ecological segregation among three species of minnows (Cy-prinidae) in a Minnesota lake. Trans-actions of the American Fisheries Society 102:794-805.
Nursall, J.R. 1973. Some behavioral interac-tions of spottail shiners (Notropis hud-sonius), yellow perch (Perca flavescens), and northern pike (Esox lucius). Journal of the Fisheries Re-search Board of Canada 30:1161-1178.
Patriarche, M. H. 1968. Rate of escape of fish from trap nets. Transactions of the American Fisheries Society 97:59-61.
Pierce, C.L., A.M. Corcoran, A.N. Gronbach, S. Hsia, B.J. Mullarkey, and A.J. Schwartzhoff. 2001. Influence of diel period on electrofishing and beach seining assessments of littoral fish assemblages. North American Journal of Fisheries Management 21:918-926.
Poe, T.P., C.O. Hatcher, C.L. Brown, and D.W. Schloesser. 1986. Comparison of species composition and richness of fish assemblages in altered and unal-tered littoral habitats. Journal of Freshwater Ecology 3:525-536.
Pope, K.L., W.T. Garaets, and D.W. Willis. 1996. Egg development in a high-density black crappie (Pomoxis ni-gromaculatus) population. Journal of Freshwater Ecology 11:451-458.
Pope, K.L., and D.W. Willis. 1996. Seasonal influences on freshwater fisheries sampling data. Reviews in Fisheries Science 4:57-73.
Pope, K.L., and D.W. Willis. 1997. Envi-ronmental characteristics of black crappie (Pomoxis nigromaculatus) nesting sites in two South Dakota wa-ters. Ecology of Freshwater Fish 6:183-189.
48
Reebs, S.G. 2002. Plasticity of diel and cir-cadian activity rhythms in fishes. Re-views in Fish Biology and Fisheries 12:349-371.
Reynolds, J.B. 1996. Electrofishing. Pages 221-253 in B.R. Murphy and D.W. Willis, editors. Fisheries techniques. Second edition. American Fisheries Society, Bethesda, Maryland.
Reynolds, J.B., and D.E. Simpson. 1978. Evaluation of fish sampling methods and rotenone census. Pages 11-24 in G.D. Novinger and J.G. Dillard, edi-tors. New approaches to the manage-ment of small impoundments. North Central Division, American Fisheries Society Special Publication 5, Be-thesda, Maryland.
Reynolds, W.W., and M.E. Casterlin. 1978. Behavioral thermoregulation and diel activity in white sucker (Catostomus commersoni). Comparative Biology and Physiology 59(3):261-262.
Rogers, M.W., M.J. Hansen, and T.D. Beard, Jr. 2003. Catchability of walleyes to fyke netting and electrofishing in northern Wisconsin lakes. North American Journal of Fisheries Man-agement 23:1193-1206.
Ryder, R.A. 1977. Effects of ambient light variations on behavior of yearling, subadult, and adult walleyes (Stizoste-dion vitreum vitreum). Journal of the Fisheries Research Board of Canada 34:1481-1491.
Sammons, S.M., D.A. Isermann, and P.W. Bettoli. 2002. Variation in popula-tion characteristics and gear selection between black and white crappies in Tennessee reservoirs: potential ef-fects on management decisions. North American Journal of Fisheries Management 22:863-869.
Sanders, R.E. 1992. Day versus night elec-trofishing catches from near-shore wa-ters of the Ohio and Muskingum Rivers. Ohio Journal of Science 92(3):51-59.
SAS (SAS Institute). 2002. JMP Statistics and Graphics Guide, Version 5. SAS Institute, Cary, North Carolina.
Siefert, R.E. 1968. Reproductive behavior, incubation and mortality of eggs, and
postlarval food selection in the white crappie. Transactions of the Ameri-can Fisheries Society 97:252-259.
Snedecor, G.W., and W.G. Cochran. 1980. Statistical methods. Seventh edition. The Iowa State University Press, Ames.
Stang, D.L., and W.A. Hubert. 1984. Spatial separation of fishes captured in pas-sive gear in a turbid prairie lake. En-vironmental Biology of Fishes 11:309-314.
Van Horn, S.L., J.W. Kornegay, B.Wynne, and W.R. Chapman. 1991. Intra-season variation in largemouth bass electrofishing catch-per-unit-effort: implications for management deci-sions. Proceedings of the Annual Conference of Southeastern Associa-tion of Fish and Wildlife Agencies 45:254-260.
Van Zee, B.E., D.W. Willis, and C.C. Stone. 1996. Comparison of diel sampling data for sauger collected by elec-trofishing. Journal of Freshwater Ecology 11(2):139-143.
Warden, R.L., Jr., and W.J. Lorio. 1975. Movements of largemouth bass (Mi-cropterus salmoides) in impounded waters as determined by underwater telemetry. Transactions of the Ameri-can Fisheries Society 104:696-702.
Weaver, M.J., J.J Magnuson, and M.K. Clay-ton. Distribution of littoral fishes in structurally complex macrophytes. Canadian Journal of Fisheries and Aquatic Sciences 54:2277-2289.
Witt, A., Jr., and R.S. Campbell. 1959. Re-finements of equipment and procedures in electrofishing. Transactions of the American Fisheries Society 88:33-35.
Willis, D.W., D.W. Gablehouse, and T.D. Mosher. 1984. Comparison of white crappie catches in three types of trap nets. Kansas Fish and Game Com-mission, Emporia.
Winter, J.D. 1977. Summer home range movements and habitat use by four largemouth bass in Mary Lake, Min-nesota. Transactions of the American Fisheries Society 106:323-331.

49
Acknowledgments
M. Drake, D. Dustin, and P. Jacobson provided suggestions that improved the manuscript.
Edited by: Paul J. Wingate, Fish and Wildlife Research Manager