Embed Size (px)
Citation preview
©FUNPEC-RP www.funpecrp.com.brGenetics and Molecular Research 14 (4): 18421-18430 (2015)
Comparison of BLUE and BLUP/REML in the selection of clones and families of potato (Solanum tuberosum)
C.A. Ticona-Benavente and D.F. da Silva Filho
Laboratório de Melhoramento Genético de Hortaliças, Instituto Nacional de Pesquisas da Amazônia, Manaus, AM, Brasil
Corresponding author: C.A. Ticona-BenaventeE-mail: [email protected]
Genet. Mol. Res. 14 (4): 18421-18430 (2015)Received August 24, 2015Accepted October 29, 2015Published December 23, 2015DOI http://dx.doi.org/10.4238/2015.December.23.30
ABSTRACT. The use of best linear unbiased prediction/restricted maximum likelihood (BLUP/REML) in perennial crops and animal breeding enhances selection gain. However, its advantage with respect to annual crops is not clear. We compared the BLUP and best linear unbiased estimator selection efficiency in the breeding of various potato generations. This was done by simulating various selection intensities on clonal families (full sibs), and clones. The characters evaluated were tuber yield and tuber specific gravity. Two criteria were adopted for comparison: a) incidence of families or clones and b) selection gain. For tuber yield, BLUP/REML method was slightly more efficient for selecting families in the first clonal generation, if it were above 50%. Below this value, both methods were equivalent. However, they both presented equal behavior for family selection of tuber specific gravity. For clonal selection, BLUP/REML showed robust superiority from 10 to 90% selection intensities in both characters. Therefore, the adequate use of BLUP/REML in potato breeding can enhance the selection gain on the yield and specific gravity of tubers.
Key words: Mixed models; Potato breeding; Selection gain; Tuber yield; Specific gravity
18422C.A. Ticona-Benavente and D.F. da Silva Filho
©FUNPEC-RP www.funpecrp.com.brGenetics and Molecular Research 14 (4): 18421-18430 (2015)
INTRODUCTION
Clonal selection is utilized for the improvement of the potato (Solanum tuberosum) plant, and involved producing thousands of seedlings a year for further multiplication, and obtaining seed tubers to carry out experiments (Mackay, 1987). However, the strategy of selecting clonal families in early generations has been gaining importance since it enables the reduction of the amount of genotypes to be assessed in later clonal generations (Simmonds, 1996), thus increasing the probability of finding superior clones in superior families (Bradshaw et al., 2009; Ticona-Benavente and Pinto, 2012).
These strategies usually utilize the mean value estimate of clones or families obtained by the ordinary least squares method. Assuming that there is homogeneity between treatments, normal errors distribution, and independence, this estimate will become the best linear unbiased estimate (BLUE).
However, in the practice of improvement of potato, it is difficult to comply with all these assumptions for two main reasons: i) The augmented block design (Federer, 1998) is utilized to assess hundreds of clones with no replication. ii) Lack of independence and normality of the errors through the loss of plants in the plots of the first clonal generation (FCG). One way to solve this problem would be to carry out experiments with replicates and single plant plots. However, this is not recommended since there is no tuber yield correlation from one generation to another (Ticona-Benavente et al., 2011).
On the other hand, although experiments with replicates can be carried out on the assessment of clonal families, individual plants may be lost by the growing plots, leading to imbalance, because of there being no independence of the errors associated with the neighboring plots.
Another problem of BLUE is that it does not consider heritability or parental information in the prediction of the estimate.
Animal improvement usually presents problems of balance, independence, and normality of the errors resulting in inaccurate variance components estimates. To solve these problems, contributions by Henderson (1949); Henderson (1953); Henderson (1984), and mainly Patterson and Thompson (1971) have provided the basis for BLUP/REML or simply, the BLUP method. This method would predict a more accurate genotypic value, which is important for the selection of new cultivars, or even the genetic values (additive effects) for the selection of genitors (Piepho et al., 2008).
In the breeding of annual plants, BLUP has been little utilized for the selection of genotypes. Some examples of this are sorghum (Almeida Filho et al., 2014), sugar cane (Zeni Neto et al., 2013; Barbosa et al., 2014), beans (Bertoldo et al., 2014), triticale (Gowda et al., 2013), sweet potato (Borges et al., 2010), corn (Bernardo, 1996a; Ferreira et al., 2010; Viana et al., 2014). This methodology has also been used in potato (Silva et al., 2008; Tai et al., 2009; Terres et al., 2012; Slater et al., 2014) (Silva et al., 2008; Tai et al., 2009; Terres et al., 2012; Slater et al., 2014).
These works mostly just used the BLUP/REML method. Others ascertained the efficiency of BLUP relative to that of BLUE by utilizing crossed validation (Bernardo, 1996b; Ferreira et al., 2010; Zhao et al., 2013). In those studies, BLUP was shown to be more accurate than BLUE (Piepho et al., 2008).
However, the studies that show the BLUP advantage by crossed validation have a mathematical and statistical approach, not relevant for plant breeders. This shows the paucity of comparative BLUP and BLUE studies on ascertaining the selection gain and intensities, demonstrating the BLUP advantage on selection gain. Our proposal is to measure the efficiency of two methods by a) the incidence of families or clones and b) selection gain of clones or clonal families selected in different intensity degrees. The most efficient method will present higher clone or family incidence and selection gain. We believe that this demonstration will enlighten and
18423Comparing BLUE and BLUP/REML for potato breeding
©FUNPEC-RP www.funpecrp.com.brGenetics and Molecular Research 14 (4): 18421-18430 (2015)
motivate the annual plant breeders to consider utilizing this methodology. Therefore, the present work aims to compare the BLUE and BLUP methodologies at the
level of families and clones of potato for the yield and specific gravity of tubers in the first clonal generations, and evaluate the selection intensities for determining the best way of selecting for attaining the highest selection gain.
MATERIAL AND METHODS
Database
Data to simulate the selection of clones and families, tuber yield, and tuber specific gravity were provided by Ticona-Benavente and Pinto (2012). These data comprised 30 clonal families originating from bi-parental crosses. They were assessed from the first up to the third clonal generations through randomized complete block design with four replicates. The experimental unit bore 10, 10, and 6 FCG, second clonal generation (SCG), and third clonal generation (TCG) plants, respectively, which were assessed plant by plant. The clones originating from these families were evaluated in the SCG and TCG through the augmented block design, without making any selection at all, with 750 and 500 clones being assessed in the SCG and TCG, respectively.
BLUP and BLUE models
BLUE models were y = r + g + e + p and y = r + g + e for family and clone experiments respectively, with y being the vector of data observed, r being the vector of the effects of replication, g being the vector of genotypes, e being the random residue with ~ (0, )e N R and p being the vector of plot effects.
For estimation of the BLUPs of the families, model 147 of the Selegen software was used (De Resende, 2007):
With y being the vector of the data observed, r being the vector of the effects of replication (fixed), g being the vector of the individual genotypic effects, considering them to be full sibs (random), p being the vector of the effects of the plots [r g] (random), and e being the random residue within plot ~ (0, )e N R . X, Z, and W, are the matrixes of incidence of each effect, that is, matrixes marked with “0” (with no effect) or “1” (with effect).
For estimation of the BLUPs of the clones, model 74 of the Selegen software, was used (De Resende, 2007):
with y being the vector of the data, f being the fixed effects (general mean), g being the genotypic effects vector for full sibs (random), b being the blocks effects vector (random), and e being the errors vector (random). X, Z, and W, are the incidence matrixes.
BLUP/REML models (equation 1 and 2) were for diploids background, but they can be
Equation 1
Equation 2
18424C.A. Ticona-Benavente and D.F. da Silva Filho
©FUNPEC-RP www.funpecrp.com.brGenetics and Molecular Research 14 (4): 18421-18430 (2015)
used for autotetraploids because the additive variance for both full-sib autotetraploids and diploids is equal (0.5) (Kempthorne, 1957), causing no change in restricted heritability estimate.
Estimation of incidence of families and clones
Incidence of families was estimated by simulation considering the selection effect based on BLUE and BLUP from a previous generation, and its effect on a subsequent one. The repeatability of families or clones was one of the parameters used. To avoid confusion with other breeding science terms, we prefer to name this parameter “incidence of families.”
For selection of families, we created vectors (one column with 30 lines) with the families ranking provided by BLUE and by BLUP/REML from the FCG for both traits. Likewise, for simulating the selection of clones, vectors of classified clones were created with both methodologies in the SCG (one column with 750 lines) and TCG (one column with 500). We created other vectors by identifying each clone with the family to which it belonged.
The efficiency of BLUE and BLUP/REML were evaluated by the incidence of the clonal families selected in the FCG and present in the SCG and TCG. For instance, 30% of superior families in the FCG is equivalent to nine families in the SCG. Moreover, SCG holds 750 clones, and by applying 10% selection intensity we obtain 75 clones. This approach calculates the incidence of nine families in 75 clones. If 10 out of 75 clones belonged to nine families, then the incidence of families should be 10/75*100 = 13.3%. In this simulation, family selection intensity was 30, 50, and 70% in the FCG, and clonal selection ranging from 0 to 100% in both SCG and TCG.
The estimation of incidence of clones selected in SCG found in TCG follows the method for incidence of families. In SCG the selection intensity ranges from 0 to 100%.
Selection gain estimation
This estimation was calculated based on the ranking matrixes employed to find family and clone incidence values, and on the BLUE means of families or clones. BLUP values was not considered in selection gain, only the ranking was, to avoid the model effect. Selection gain (SG) was estimated using formula 1.
With nX and mX being the means of subsequent and previous generations, respectively.
RESULTS
Yield of tubers
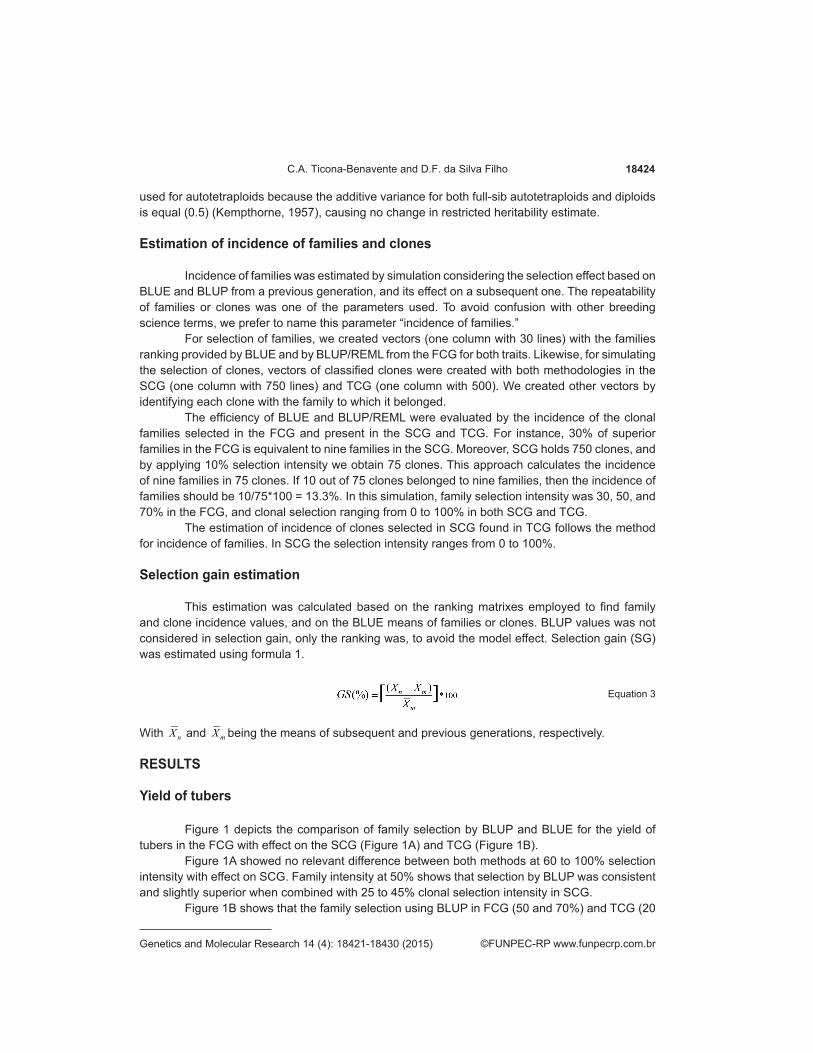
Figure 1 depicts the comparison of family selection by BLUP and BLUE for the yield of tubers in the FCG with effect on the SCG (Figure 1A) and TCG (Figure 1B).
Figure 1A showed no relevant difference between both methods at 60 to 100% selection intensity with effect on SCG. Family intensity at 50% shows that selection by BLUP was consistent and slightly superior when combined with 25 to 45% clonal selection intensity in SCG.
Figure 1B shows that the family selection using BLUP in FCG (50 and 70%) and TCG (20
Equation 3
18425Comparing BLUE and BLUP/REML for potato breeding
©FUNPEC-RP www.funpecrp.com.brGenetics and Molecular Research 14 (4): 18421-18430 (2015)
to 80%), resulted in major incidence of families. The use of BLUE in both generations led to lower values of incidence. Combination of selection based on BLUE-BLUP and BLUP-BLUE in these generations led to intermediate values of incidence of families.
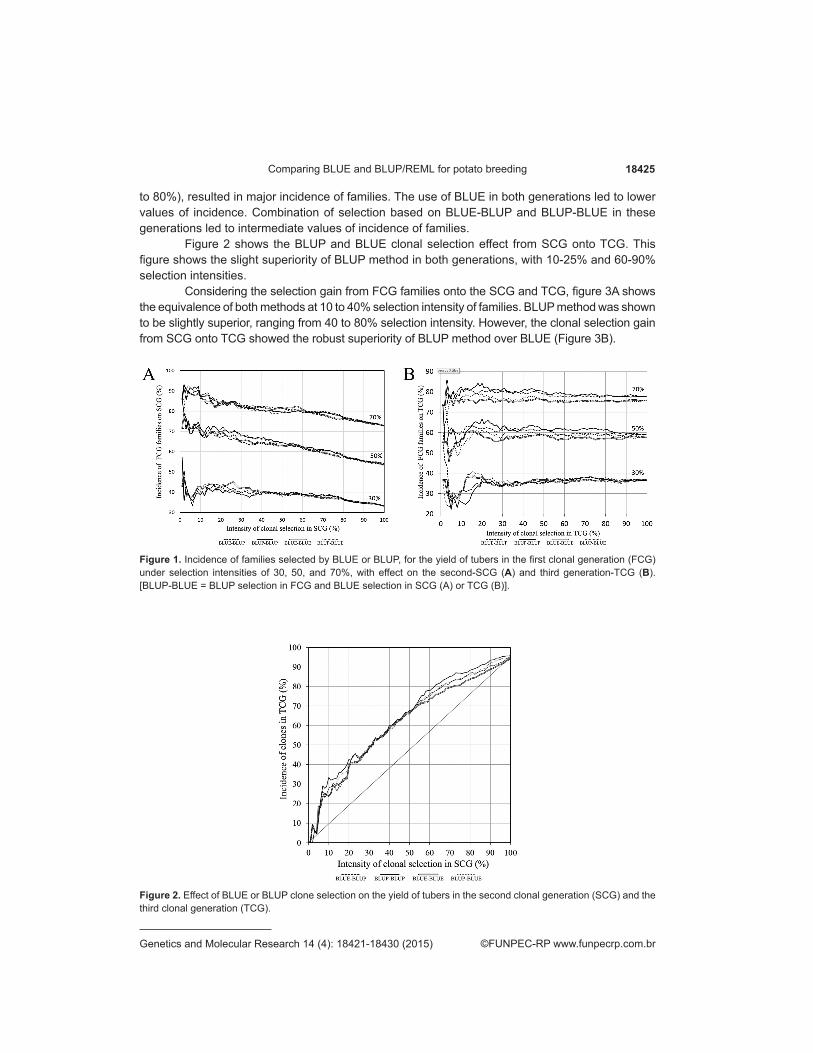
Figure 2 shows the BLUP and BLUE clonal selection effect from SCG onto TCG. This figure shows the slight superiority of BLUP method in both generations, with 10-25% and 60-90% selection intensities.
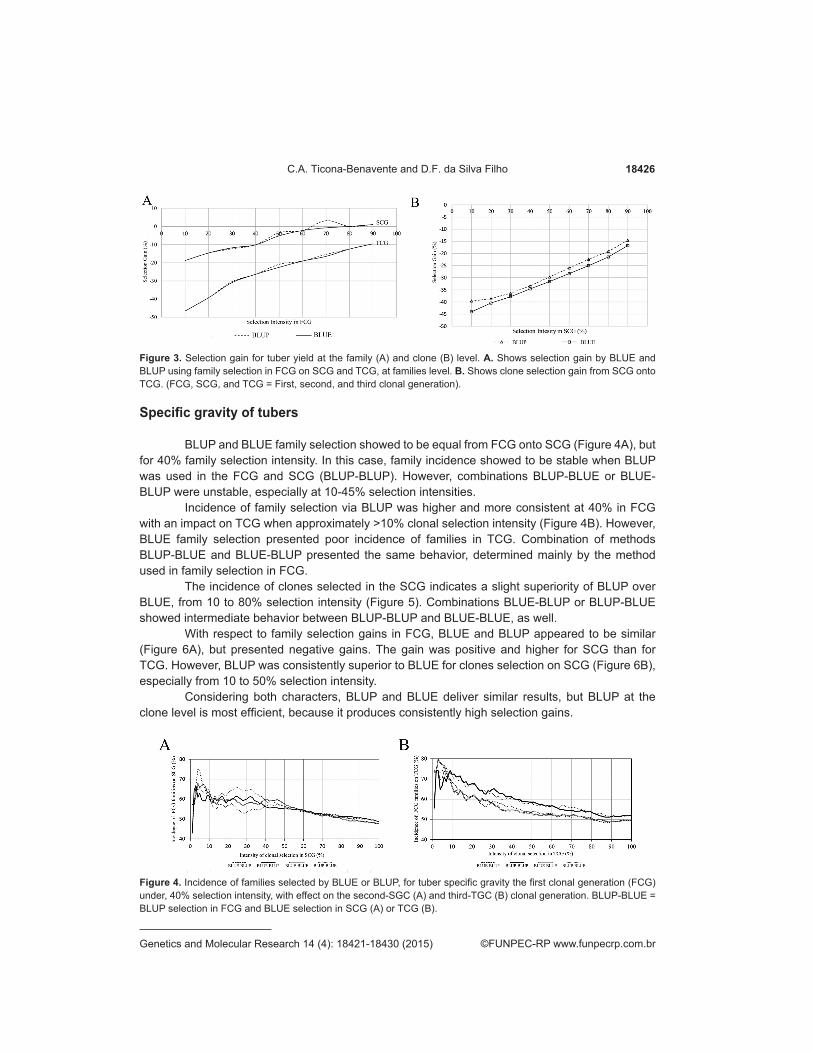
Considering the selection gain from FCG families onto the SCG and TCG, figure 3A shows the equivalence of both methods at 10 to 40% selection intensity of families. BLUP method was shown to be slightly superior, ranging from 40 to 80% selection intensity. However, the clonal selection gain from SCG onto TCG showed the robust superiority of BLUP method over BLUE (Figure 3B).
Figure 1. Incidence of families selected by BLUE or BLUP, for the yield of tubers in the first clonal generation (FCG) under selection intensities of 30, 50, and 70%, with effect on the second-SCG (A) and third generation-TCG (B). [BLUP-BLUE = BLUP selection in FCG and BLUE selection in SCG (A) or TCG (B)].
Figure 2. Effect of BLUE or BLUP clone selection on the yield of tubers in the second clonal generation (SCG) and the third clonal generation (TCG).
18426C.A. Ticona-Benavente and D.F. da Silva Filho
©FUNPEC-RP www.funpecrp.com.brGenetics and Molecular Research 14 (4): 18421-18430 (2015)
Figure 3. Selection gain for tuber yield at the family (A) and clone (B) level. A. Shows selection gain by BLUE and BLUP using family selection in FCG on SCG and TCG, at families level. B. Shows clone selection gain from SCG onto TCG. (FCG, SCG, and TCG = First, second, and third clonal generation).
Specific gravity of tubers
BLUP and BLUE family selection showed to be equal from FCG onto SCG (Figure 4A), but for 40% family selection intensity. In this case, family incidence showed to be stable when BLUP was used in the FCG and SCG (BLUP-BLUP). However, combinations BLUP-BLUE or BLUE-BLUP were unstable, especially at 10-45% selection intensities.
Incidence of family selection via BLUP was higher and more consistent at 40% in FCG with an impact on TCG when approximately >10% clonal selection intensity (Figure 4B). However, BLUE family selection presented poor incidence of families in TCG. Combination of methods BLUP-BLUE and BLUE-BLUP presented the same behavior, determined mainly by the method used in family selection in FCG.
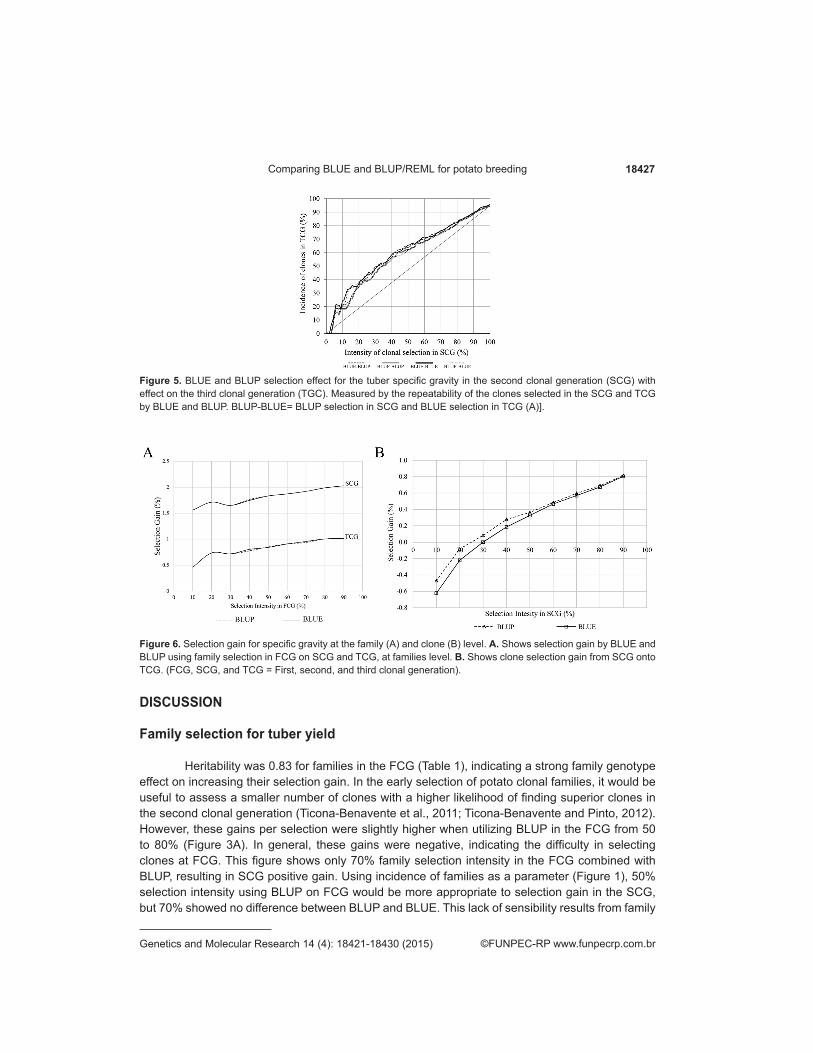
The incidence of clones selected in the SCG indicates a slight superiority of BLUP over BLUE, from 10 to 80% selection intensity (Figure 5). Combinations BLUE-BLUP or BLUP-BLUE showed intermediate behavior between BLUP-BLUP and BLUE-BLUE, as well.
With respect to family selection gains in FCG, BLUE and BLUP appeared to be similar (Figure 6A), but presented negative gains. The gain was positive and higher for SCG than for TCG. However, BLUP was consistently superior to BLUE for clones selection on SCG (Figure 6B), especially from 10 to 50% selection intensity.
Considering both characters, BLUP and BLUE deliver similar results, but BLUP at the clone level is most efficient, because it produces consistently high selection gains.
Figure 4. Incidence of families selected by BLUE or BLUP, for tuber specific gravity the first clonal generation (FCG) under, 40% selection intensity, with effect on the second-SGC (A) and third-TGC (B) clonal generation. BLUP-BLUE = BLUP selection in FCG and BLUE selection in SCG (A) or TCG (B).
18427Comparing BLUE and BLUP/REML for potato breeding
©FUNPEC-RP www.funpecrp.com.brGenetics and Molecular Research 14 (4): 18421-18430 (2015)
Figure 5. BLUE and BLUP selection effect for the tuber specific gravity in the second clonal generation (SCG) with effect on the third clonal generation (TGC). Measured by the repeatability of the clones selected in the SCG and TCG by BLUE and BLUP. BLUP-BLUE= BLUP selection in SCG and BLUE selection in TCG (A)].
Figure 6. Selection gain for specific gravity at the family (A) and clone (B) level. A. Shows selection gain by BLUE and BLUP using family selection in FCG on SCG and TCG, at families level. B. Shows clone selection gain from SCG onto TCG. (FCG, SCG, and TCG = First, second, and third clonal generation).
DISCUSSION
Family selection for tuber yield
Heritability was 0.83 for families in the FCG (Table 1), indicating a strong family genotype effect on increasing their selection gain. In the early selection of potato clonal families, it would be useful to assess a smaller number of clones with a higher likelihood of finding superior clones in the second clonal generation (Ticona-Benavente et al., 2011; Ticona-Benavente and Pinto, 2012). However, these gains per selection were slightly higher when utilizing BLUP in the FCG from 50 to 80% (Figure 3A). In general, these gains were negative, indicating the difficulty in selecting clones at FCG. This figure shows only 70% family selection intensity in the FCG combined with BLUP, resulting in SCG positive gain. Using incidence of families as a parameter (Figure 1), 50% selection intensity using BLUP on FCG would be more appropriate to selection gain in the SCG, but 70% showed no difference between BLUP and BLUE. This lack of sensibility results from family
18428C.A. Ticona-Benavente and D.F. da Silva Filho
©FUNPEC-RP www.funpecrp.com.brGenetics and Molecular Research 14 (4): 18421-18430 (2015)
ranking ignoring the genotypic value. Therefore, selection gain is more precise in determining family selection efficiency.
There was no gain per selection of family in FCG in relation to TCG. This fact shows the effect of heat on tuber yield, and the necessity of performing the plant breeding in the same conditions, since there is a family x environment interaction. FCG and SCG were sowed under hot conditions (spring and summer, respectively). Yet, TCG was sowed in the winter. Therefore, neither BLUP nor BLUE can show gains above FCG in TCG. However, BLUP was slightly superior when considering both incidence of families (Figure 1B) and selection gain (Figure 3A).
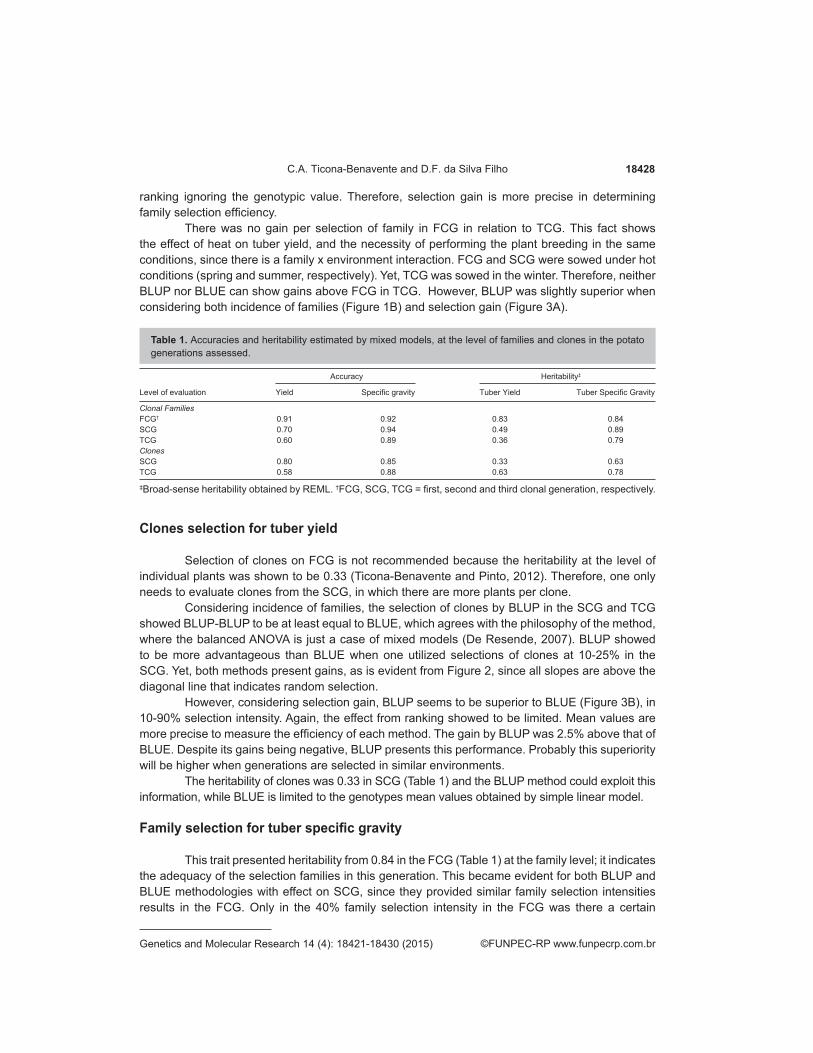
Table 1. Accuracies and heritability estimated by mixed models, at the level of families and clones in the potato generations assessed.
Accuracy Heritability‡
Level of evaluation Yield Specific gravity Tuber Yield Tuber Specific Gravity
Clonal FamiliesFCG† 0.91 0.92 0.83 0.84SCG 0.70 0.94 0.49 0.89TCG 0.60 0.89 0.36 0.79ClonesSCG 0.80 0.85 0.33 0.63TCG 0.58 0.88 0.63 0.78
‡Broad-sense heritability obtained by REML. †FCG, SCG, TCG = first, second and third clonal generation, respectively.
Clones selection for tuber yield
Selection of clones on FCG is not recommended because the heritability at the level of individual plants was shown to be 0.33 (Ticona-Benavente and Pinto, 2012). Therefore, one only needs to evaluate clones from the SCG, in which there are more plants per clone.
Considering incidence of families, the selection of clones by BLUP in the SCG and TCG showed BLUP-BLUP to be at least equal to BLUE, which agrees with the philosophy of the method, where the balanced ANOVA is just a case of mixed models (De Resende, 2007). BLUP showed to be more advantageous than BLUE when one utilized selections of clones at 10-25% in the SCG. Yet, both methods present gains, as is evident from Figure 2, since all slopes are above the diagonal line that indicates random selection.
However, considering selection gain, BLUP seems to be superior to BLUE (Figure 3B), in 10-90% selection intensity. Again, the effect from ranking showed to be limited. Mean values are more precise to measure the efficiency of each method. The gain by BLUP was 2.5% above that of BLUE. Despite its gains being negative, BLUP presents this performance. Probably this superiority will be higher when generations are selected in similar environments.
The heritability of clones was 0.33 in SCG (Table 1) and the BLUP method could exploit this information, while BLUE is limited to the genotypes mean values obtained by simple linear model.
Family selection for tuber specific gravity
This trait presented heritability from 0.84 in the FCG (Table 1) at the family level; it indicates the adequacy of the selection families in this generation. This became evident for both BLUP and BLUE methodologies with effect on SCG, since they provided similar family selection intensities results in the FCG. Only in the 40% family selection intensity in the FCG was there a certain
18429Comparing BLUE and BLUP/REML for potato breeding
©FUNPEC-RP www.funpecrp.com.brGenetics and Molecular Research 14 (4): 18421-18430 (2015)
differentiation between the methodologies, but it was inconsistent (Figure 4A). This similar response from both estimation methods could be accounted for by both
environments having similar temperature, resulting in the very similar ranking shown by both the methods. Nevertheless, the outcome of this selection in the TCG showed a consistent superiority of BLUP over BLUE (Figure 4B). It was approximately 10% higher on the family incidence, at 15-50% selection intensity. From the method combinations in both generations, one concludes the use of BLUP to be necessary in the selection of families in the FCG, and clones in the TCG, mainly when genotype x environment interaction is involved.
Combining methods in FCG and TCG generations reveals incidence of families to be associated to the method being used in FCG (Figure 4A).
For selection gain, BLUP and BLUE showed no difference on SCG and TCG (Figure 6A), probably due to the small, thousandth-level values. In this case, incidence of families seems more appropriate to differentiate both methods. The gain from 1.060 to 1.070 for specific gravity is 0.94%. In terms of quality, this gain signifies the change from domestic to industrial use. Therefore, the use of BLUP or BLUE were shown to be equivalent when selecting families in FCG.
Clone selection for tuber specific gravity
Incidence of clones reveals BLUP selection to be more advantageous than the BLUE one, if it is based on incidence of families. The incidence was about 5% higher at 10-60% selection intensity (Figure 5). This fact was confirmed by selection gain via BLUP (Figure 6B). It was 2% higher than BLUE at 10-90% clonal selection intensity. The heritability of this trait being 0.63, this gain was expected. In this study, positive selection gains were shown to be above 30%.Therefore, intensities above this value are recommended.
CONCLUSIONS
The study suggested that the selection of families by BLUP/REML was more efficient than that by BLUE for tuber yield, provided the selection intensities were over 50%.
There was no difference between both family selection methods for tuber specific gravity.Clonal selection by BLUP/REML was superior to that by BLUE for both traits, despite
the genotype x environment interaction. In tuber specific gravity, BLUP shows selection gains, especially at above 30% selection intensity.
ACKNOWLEDGMENTS
To Fundação de Amparo à Pesquisa do Estado de Amazonas (FAPEAM), Coordenação de Aperfeiçoamento de Pessoal de Nível Superior (CAPES) for support in this research.
REFERENCES
Almeida Filho JE de, Tardin FD, de Resende MDV, Silva FF, et al. (2014). Genetic evaluation of grain sorghum hybrids in Brazilian environments using the REML/BLUP procedure. Sci. Agric. 71: 146-150.
Barbosa MH, Ferreira A, Peixoto LA, de Resende MDV et al. (2014). Selection of sugar cane families by using BLUP and multi-diverse analyses for planting in the Brazilian savannah. Genet. Mol. Res. 13: 1619-1626.
Bernardo R (1996a). Best linear unbiased prediction of maize single-cross performance. Crop Sci. 36: 50-56. Bernardo R (1996b). Testcross additive and dominance effects in best linear unbiased prediction of maize single-cross
performance. Theor. Appl. Genet. 93: 1098-1102.
18430C.A. Ticona-Benavente and D.F. da Silva Filho
©FUNPEC-RP www.funpecrp.com.brGenetics and Molecular Research 14 (4): 18421-18430 (2015)
Bertoldo JG, Nodari RO, Meirelles Coimbra JL, Guidolin AF, et al. (2014). Genetic progress of black bean (Phaseolus vulgaris L.) over seven years. Interciencia 39: 24-31.
Borges V, Ferreira PV, Soares L, Santos GM et al. (2010). Seleção de clones de batata-doce pelo procedimento REML/BLUP. Acta Scientiarum. Agron. 32: 643-649.
Bradshaw JE, Dale MFB and Mackay GR (2009). Improving the yield, processing quality and disease and pest resistance of potatoes by genotypic recurrent selection. Euphytica 170: 215-227.
De Resende MDV (2007). SELEGEN-REML/BLUP Sistema Estatístico e Seleção Genética Computadorizada via Modelos Lineares Mistos. edn. Embrapa Florestas, Colombo.
Federer WT (1998). Recovery of interblock, intergradient and intervarietal information in incomplete block and lattice rectangle designed experiments. Biometrics 54: 471-481.
Ferreira DV, Von Pinho RG, Balestre M, Oliveira RL (2010). Prediction of maize hybrid performance using similarity in state and similarity by descent information. Genet. Mol. Res. 9: 2381-2394.
Gowda M, Zhao Y, Maurer HP, Weissmann EA, et al. (2013). Best linear unbiased prediction of triticale hybrid performance. Euphytica 191: 223-230.
Henderson CR (1949). Estimation of changes in herd environment. J. Dairy Sci. 32: 709. Henderson CR (1953). Estimation of variance and covariance components. Biometrics 9: 226-252. Henderson CR (1984). Applications of linear models in animal breeding. University of Guelph, Guelph. Kempthorne O (1957). An introduction to genetic statistics. edn. Wiley and Sons, New York. Mackay GR (1987). Selecting and breeding for better potato cultivars. In: Improving vegetatively propagated crops (Abbot AJ,
Atkin RK). Academic Press, London, 181-196. Patterson HD and Thompson R (1971). Recovery of Inter-block information when block sizes are unequal. Biometrics 58:
545-554. Piepho HP, Möhring J, Melchinger AE and Büchse A (2008). BLUP for phenotypic selection in plant breeding and variety
testing. Euphytica 161: 209-228. Silva GOd, Pereira AdS, Souza VQd, Carvalho FIFd et al. (2008). Qualidade de película de famílias clonais de batata.
Bragantia 67: 633-638. Simmonds NW (1996). Family selection in plant breeding. Euphytica 90: 201-208. Slater AT, Wilson GM, Cogan NOI, Forster JW, et al. (2014). Improving the analysis of low heritability complex traits for
enhanced genetic gain in potato. Theor. Appl. Genet. 127: 809-820. Tai GCC, Murphy AM and Xiong X (2009). Investigation of long-term field experiments on response of breeding lines to
common scab in a potato breeding program. Euphytica 167: 69-76. Terres LR, Ney VG, Cerioli MdF, Pereira AdS, et al. (2012). Respostas esperadas de seleção para coloração de fritura em
quatro populações híbridas de batata. Hortic. Bras. 30: 300-303. Ticona-Benavente CA and Pinto CABP (2012). Selection Intensities of Families and clones in potato breeding. Ciênc.
Agrotecnol. 36: 60-68.Ticona-Benavente CA, Pinto CABP, de Figueiredo ICR and Ribeiro GHMR (2011). Repeatability of family means in early
generations of potato under heat stress. Crop Breed and Appl Biotechnol. 11: 330-337.Viana JMS, Mundim GB, De Lima RO, E Silva FF, et al. (2014). Best linear unbiased prediction for genetic evaluation in
reciprocal recurrent selection with popcorn populations. J. Agric. Sci. 152: 428-438. Zeni Neto H, Daros E, Bespalhok Filho JC, Scapim CA, et al. (2013). Selection of families and parents of sugarcane (Saccharum
spp.) through mixed models by joint analysis of two harvests. Euphytica 193: 391-408. Zhao Y, Zeng J, Fernando R and Reif JC (2013). Genomic prediction of hybrid wheat performance. Crop Sci. 53: 802-810.