Embed Size (px)
Citation preview

CIMD0003361.A1 /FinalFebruary 2001
Comparison of Army/Air Force andPrivate-Sector Physicians' TotalCompensation, by Medical Specialty(Supplement to Health Professions' Retention-Accession Incentives Study)
Shayne Brannman • Cori Rattelman
Center for Naval Analyses4825 Mark Center Drive • Alexandria, Virginia 22311-1850

Copyright CNA ~orporation/~canned October 2002
Approved for distribution:
$ ~ a . . w Laurie 1. May, Director
Medical programs Resource Analysis Division
This document represents the best opinion of CNA at the time of issue. It does not necessarily represent the opinion of the Department of the Navy.
Approved for Public Release; Distribution Unlimited. Specific authority: N00014-00-D-0700. For copies of this document call: CNA Document Control and Distribution Section at 703-824-2943.
February 2001
Copyright O 2001 The CNA Corporation

ContentsIntroduction and b a c k g r o u n d . . . . . . . . . . . . . . . 1
Findings . . . . . . . . . . . . . . . . . . . . . . . . 2Methodology . . . . . . . . . . . . . . . . . . . . . 2Conclusions . . . . . . . . . . . . . . . . . . . . . . 5
Chapter 1: Introduction and approach . . . . . . . . . 1-1
Chapter 2: Results . . . . . . . . . . . . . . . . . . . . 2-1
Appendix A: Assumptions . . . . . . . . . . . . . . . . A-l
Appendix B: Private sector survey participants . . . . . B-l
Appendix C: Benefit Value Comparison (BVC)methodology . . . . . . . . . . . . . . . . . . . . . . C-l

THIS PAGE INTENTIONALLY LEFT BLANK

Introduction and backgroundThe appropriate level of compensation for individuals serving in themilitary is continually being monitored. This issue is particularlyimportant for Military Health System (MHS) physicians because theyare costly to access and train, and they have skills that are readilytransferable to the private sector. If compensation is perceived to betoo low for the demands and duties required, uniformed medicalofficers may abandon the military for a private-sector career path.Conversely, total compensation should be no higher than the amountrequired to attract and retain a quality force.
Congressional awareness of these issues resulted in the followingcommittee language in the National Defense Authorization Act forFiscal Year 2001:
The committee directs the Secretary of Defense to conducta review and to report to the Committee on Armed Servicesof the Senate and the House of Representatives on the ade-quacy of special pays and bonuses for medical corps officersand other health care professionals. The committee directsthis review because of the level of competition within theeconomy for health care professionals and the potentialdevaluation of current special pays and bonuses, whichcould have a significant impact on recruiting and retentionof health care professionals.
As a result of this language, the TRICARE Management Agency(TMA) at DoD asked CNA to conduct a study to address the concernsvoiced by Congress. To respond to TMA's request, CNA conducted acomparative analysis of current compensation (cash and benefits)between Army and Air Force physicians and private-sector physicians.
1. An August 2000 CNA document (CIM D0002053.A, Comparison of Navyand Private-Sector Physicians' Total Compensation, by Medical Specialty) and aFebruary 2001 CNA document (CRM D0003360.A1, Health Professions'Retention-Accession Incentive Study Report to Congress (Phase I: CompensationComparison of Selected Uniformed and Private-Sector Health Care Professionals)provide detailed descriptions of Navy physician compensation and anal-yses of how uniformed and private-sector physician pay gaps havechanged over the last decade.

The results of that comparison are contained in the attachments ofthis information memorandum.
Findings
Methodology
We calculated and compared the current total compensation (sum ofcash salary, all special pays, and benefits) between uniformed Army,Air Force, and private-sector (salaried) physicians for 24 physicianspecialties at three military physician career junctures: completion of7, 12, and 17 years of service (YOS). We find that, looking at a crosssection or "snapshot" of current compensation, a pay gap does existbetween Army and Air Force and private-sector physicians for all ofthe physician specialties that we examined, with the exception offamily practice and at the 17-YOS juncture.2 Our analysis shows thatthe current military-civilian physician pay gap varies widely by spe-cialty—13 to 63 percent at the 7-YOS juncture and 3 to 55 percent atthe 12-YOS career point. The pay gap is generally wider for physicianspecialties that perform mostly procedures, such as surgeons and radi-ologists, than for those specialties that do mostly evaluation and man-agement-type activities, such as family practice and internal medicine.
We have developed a model comparing total compensation (salary,special and incentive pays, pension, and other benefits) for 24 physi-cian specialties based on the most typical Army and Air Force physi-cian career.3 Private-sector compensation was culled from proprietarydatabases representing over 90 employer-based health care organiza-tions and over 22,000 physician incumbents. The robustness of thisdata source is necessary when comparing specialties at differentcareer junctures. We feel that comparisons to this sample, salariedphysicians, are appropriate because the characteristics of the organi-zations reporting data most closely resemble the military environ-ment (56 percent are hospital-based facilities, 29 percent are grouppractices, and 15 percent are Health Maintenance Organizations).
2. Military-civilian pay gap equals the absolute value of (MC/CC) - 1,where MC = military compensation and CC = civilian compensation.

There are concerns about using only salaried physician compensationdata. According to the American Medical Association (AMA), 36 per-cent of America's physicians self-reported working for an employer.This same report shows a pay gap, at the median net income level,between self-employed (private practice) and employee (salaried)physicians.5 The report also states:
Self-employed physicians tend to work more hours and seemore patients, have more years of experience, are likely tobe certified by one or more speciality boards, and are morelikely to be male, all factors associated with higher earning.Controlling for these factors, the income advantage of self-employed physicians would be much less than reported.
Although our compensation comparisons may underestimate thepotential compensation differential for those military physicians whochoose to separate and have the option to join select private practices,our model provides policy-makers a valuable tool for comparing themaximum amount of compensation an Army or Air Force physiciancan receive versus a salaried specialist working in a similarenvironment with the same years of experience. This methodology
3. Based on discussions widi representatives from the TMA, Army, and AirForce, the model adopts an accession, career, and training profile typi-cal of most military physicians. The profile assumes graduation frommedical school at age 26, due course promotion, a 4-year Armed ForcesHealth Professional Scholarship Program followed by an active dutyinternship (PGY-1), and completion of a full-time in-service residency(PGY-2). The Army and Air Force typically send physicians immediatelyinto residency training after internship, and into fellowship trainingright after residency training. The predominant profile for Army andAir Force physicians is the same with the exceptions of neurosurgeryand otolaryngology (residency programs are assumed to be 6 and 5years (Army), respectively, and 5 and 4 years, respectively (Air Force)).
4. The Hay Group served as subcontractor for all physician cash and ben-efit compensations. We wish to acknowledge the efforts of MichaelGaffney and Sevim Kuyumcu of Hay Group.
5. 1999/2000 AMA Physician Socioeconomic Statistics report shows that themedian net income for self-employed physicians was $200,000 versus$140,000 for employee (salaried) physicians. Data are from the 1998Socioeconomic Monitoring System Survey of Physicians.

reflects a conservative estimate of the pay gap, using an alternativewage that a military physician can be fairly assured of receiving in thecivilian sector.
Compensation includes all cash and benefits for fully trained special-ists. For uniformed physicians, cash compensation includes regularmilitary compensation (RMC), and medical officer special and incen-tive pays (including board certification pays). Benefit compensationincludes health care, military retirement, the Survivor Benefit Plan,and other active duty benefits.
Private-sector compensation includes base salary, incentive pay,health care, pension and capital accumulation plan, and other bene-fits. Capital accumulation plans include 401 (k) and 403 (b) plans.The value shown for capital accumulation plans is based on employermatching contributions only. Amounts resulting from employee con-tributions and executive benefits, such as supplemental non-qualifiedretirement plans, are not included. Calculations for uniformed and
o
private sector cash and benefits are as of 1 July 2000.
6. The study did not consider the subsidization value for the Armed ForcesHealth Professional Scholarship Program, nor did it make compensa-tion comparisons during the period of residency training.
7. RMC consists of basic pay, basic allowance for housing, basic allowancefor subsistence, and the tax advantage accruing to the non-taxablenature of housing and subsistence allowances. Basic pay representsabout 66 percent of RMC for an 0-3 and approximately 75 percent ofRMC for an 0-6. We also include all medical special pays (includingboard certification) offered to these specialties and assume each spe-cialist takes advantage of all available special programs when eligible.Appendix A describes each of these components in more detail.
8. Physician survey data are effective as of mid-1999. We adjusted all datato 2000 by applying a 4.5-percent trend factor.

Conclusions
Our comparison takes a snapshot of an Army/Air Force physician'scompensation as of July 2000 and compares this to the compensationof his or her civilian equivalent. We refer to this as a cross-sectionalcomparison. We have calculated cross-sectional compensation com-parisons for Army and Air Force physicians who are at one of threedecision points in their careers—completion of 7, 12, or 17 years ofservice. We present these cross-sectional comparisons because thesedata are often a compelling factor for many individuals faced with thedecision to continue in their current career path or to change course.For this reason, the cross-sectional comparisons may have a signifi-cant role in physician retention. Both the cross-sectional and present-value comparisons are presented for median and 75th" percentile pri-vate-sector data.
We find that a current Army, Air Force, and private-sector physicianpay gap exists and that they vary significantly by specialty.10 The datapresented in this information memorandum describe the methodol-ogy used and results for each of the 24 physician specialties.
9. By civilian equivalent, we mean a physician of the same specializationwith equivalent years of practice (YOP) as a fully trained specialist work-ing in the private sector. As an example, for internal medicine, at age 33an Army and Air Force physician would have completed 7 years of ser-vice, composed of a 1-year active duty internship, 2 years in internalmedicine (IM) residency, and 4 years of practice as a IM specialist. TheArmy and Air Force physician total compensation will be compared witha private sector IM specialist with 4 years in practice.
10. A February 2001 CNA document (CRM D0003360.A1) describes cur-rent uniformed and private-sector pay gaps and the change over the lastdecade. This report also includes Navy and private-sector physician paygap data.

THIS PAGE INTENTIONALLY LEFT BLANK

Center for Naval Analyses Comparison of Physician Total Compensation
Chapter 1: Introduction and Approach
Organization of Analysis
Total compensation comparisons are presented as a "shapshot" of the value ofcurrent cash compensation and benefits for Army and Air Force physicians whoare presently at one of three points during their careers.
The three points during an Army and Air Force medical career that were chosenfor comparison with private sector physicians were upon completion of 7, 12 or17 years of service. These were the three career decision points used in thestudy of Navy physicians.
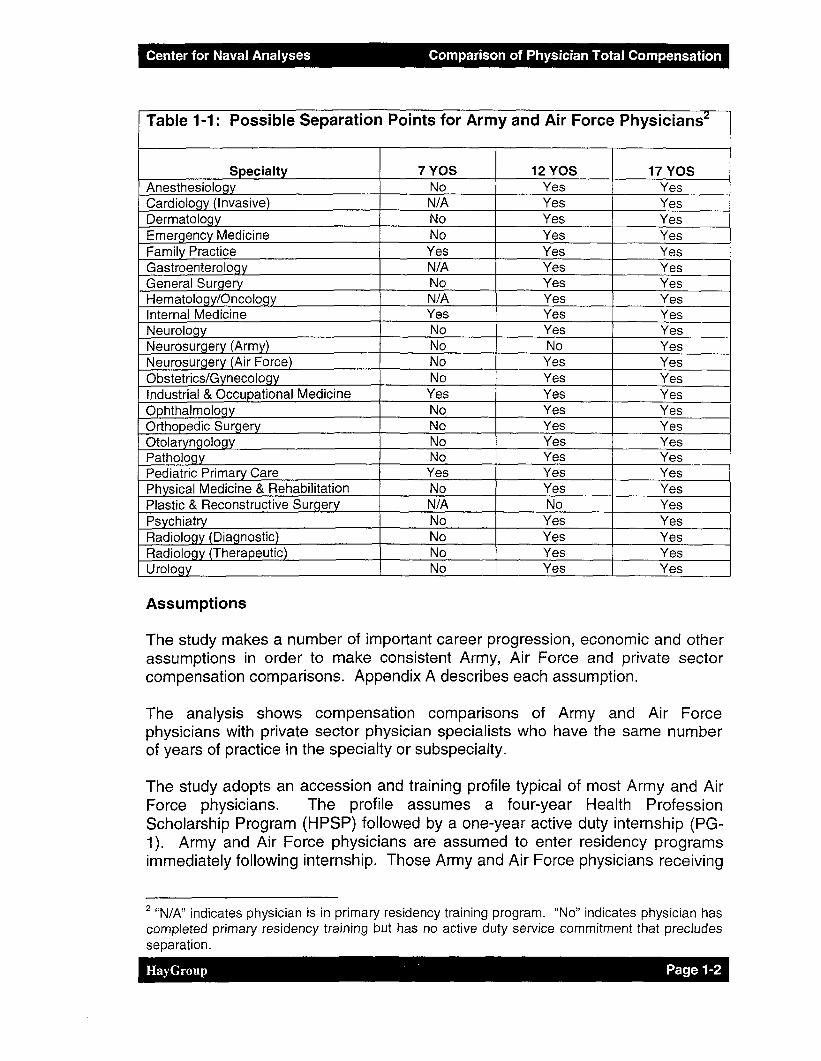
Physicians in some specialties and subspecialties may not be able to separate ateach of the three points because they are either in residency or fellowshiptraining, or they are serving an active duty service commitment resulting fromtraining. Table 1-1 on the following page summarizes the possible separationdecisions by specialty.
Elements of Compensation
Compensation includes all cash and benefits1. For Army and Air Forcephysicians, cash compensation includes Regular Military Compensation (RMC),and medical officer special and incentive pays. Benefits compensation includeshealth care, military retirement, the Survivor Benefit Plan, and other active dutyand retired Army and Air Force benefits.
Private sector compensation includes base salary, incentive pay, health care,pension and capital accumulation plan, and other benefits. Capital accumulationplans include 401 (k) plans and 403(b) plans. The value shown for capitalaccumulation plans is based on employer matching contributions only. Amountsresulting from employee contributions are not included. Executive benefits, suchas supplemental non-qualified retirement plans, are not included. The value ofArmy and Air Force-sponsored training, either before or after accession is notincluded.
Calculations reflect Army, Air Force and private sector cash and benefitsavailable on 1 July 2000.
Appendix A provides complete details on the Army, Air Force and private sectorcompensation elements.
' The study did not consider the subsidization value for the Armed Forces Health Professional ScholarshipProgram, nor did it make compensation comparisons during the period of residency training.
HayGroup Page 1-1
Center for Naval Analyses Comparison of Physician Total Compensation
Table 1-1 : Possible Separation Points for Army and Air Force Physicians2
SpecialtyAnesthesiologyCardiology (Invasive)DermatologyEmergency MedicineFamily PracticeGastroenterologyGeneral SurgeryHematology/OncologyInternal MedicineNeurologyNeurosurgery (Army)Neurosurgery (Air Force)Obstetrics/GynecologyIndustrial & Occupational MedicineOphthalmologyOrthopedic SurgeryOtolaryngologyPathologyPediatric Primary CarePhysical Medicine & RehabilitationPlastic & Reconstructive SurgeryPsychiatryRadiology (Diagnostic)Radiology (Therapeutic)Urology
7 YDSNoN/ANoNo
YesN/ANoN/AYesNoNoNoNo
YesNoNoNoNoYesNoN/ANoNoNoNo
12YOSYesYesYesYesYesYesYesYesYesYesNo
YesYesYesYesYesYesYesYesYesNoYesYesYesYes
17 YOSYesYesYesYesYesYesYesYesYesYesYesYesYesYesYesYes
L YesYesYesYesYesYesYesYesYes
Assumptions
The study makes a number of important career progression, economic and otherassumptions in order to make consistent Army, Air Force and private sectorcompensation comparisons. Appendix A describes each assumption.
The analysis shows compensation comparisons of Army and Air Forcephysicians with private sector physician specialists who have the same numberof years of practice in the specialty or subspecialty.
The study adopts an accession and training profile typical of most Army and AirForce physicians. The profile assumes a four-year Health ProfessionScholarship Program (HPSP) followed by a one-year active duty internship (PG-1). Army and Air Force physicians are assumed to enter residency programsimmediately following internship. Those Army and Air Force physicians receiving
2 "N/A" indicates physician is in primary residency training program. "No" indicates physician hascompleted primary residency training but has no active duty service commitment that precludesseparation.
HayGroup Page 1-2

Center for Naval Analyses Comparison of Physician Total Compensation
fellowship training are assumed to begin fellowship training immediately followingresidency training. Both residency and fellowship training are assumed to occuron active duty.
Private sector physicians are assumed to begin a year of internship followingmedical school at age 26, followed immediately by residency training and thenfellowship training for invasive cardiology, gastroenterology, hematology/oncology, and plastic & reconstructive surgery. The study also assumes thatprivate sector physicians enter practice in their specialty/subspecialty followingresidency/fellowship training.
As an example for internal medicine, at age 33 an Army or Air Force physicianwould have completed seven years of service, composed of one year of PG-1,two years in internal medicine residency, and four years of practice as an IMspecialist. This physician's total compensation would be compared with a privatesector IM specialist with four years of practice in the specialty.
An Army or Air Force orthopedic surgeon at age 38 with 12 completed years ofservice would have spent that time serving one year in PG-1, four years inorthopedic residency, and seven years practicing in the specialty. Theappropriate compensation comparator would be a private sector orthopedicsurgeon with seven years of practice in the specialty.
An Army or Air Force cardiologist at age 43 with 17 completed years of servicewould have spent that time serving one year in PG-1, two years in internalmedicine residency, three years in cardiology fellowship training, and 11 years ofpractice as a cardiologist. The appropriate compensation comparator would be aprivate sector cardiologist with 11 years of practice in the specialty.
With two exceptions, the study assumes that residency and fellowship traininglengths are the same for the Army and Air Force within a particular specialty orsubspecialty. For example, the study assumes a four-year residency program forboth Army and Air Force physicians specializing in pathology. The exceptionsare neurosurgery and otolaryngology where the Army residency programs areassumed to be six and five years in length, respectively, and the Air Forceresidency programs are assumed to be five and four years in length,respectively.
Data Sources
The study uses the Basic Pay and Regular Military Compensation tables thatwere effective 1 July 2000. Specialty and incentive pays are those effective 1October 1999. The study assumes no future increases in specialty or incentivepays, primarily because most increases require congressional legislation thatcannot be predicted with certainty.
HayGroup Page 1-3

Center for Naval Analyses Comparison of Physician Total Compensation
Private sector cash compensation by specialty was extracted from the 1999Physician's Total Compensation Survey conducted by the Hay Group. Thesurvey represents responses from more than 22,300 physicians employednationwide in 91 group practices, Health Maintenance Organizations, andhospital-based facilities. The data are trended by 4.5 percent to 2000.
The study uses private sector benefits data from the organizations participating inthe Physician's Compensation Survey. Benefit values for Army, Air Force andprivate sector physicians were determined using the methodology described inAppendix C.
Individual private sector compensation data are not separately identified bywhether the physician is board certified or a graduate of a U.S. medical school.These factors can affect total compensation levels. In some cases, surveyrespondents indicated the employer applied a salary differential for boardcertification, but specific amounts are not available. Most Army and Air Forcephysicians are board certified and the majority are graduates of U.S. schools.Consequently, total private sector compensation data are shown for the median(50th percentile3) and the 75th percentile4. We believe this presents a reasonablerange within which it is possible to make valid comparisons. For one specialty,neurosurgery, we had an insufficient sample size to develop a reliable estimateof the 75 percentile.
Snapshot of Current Compensation
As an example, Table 1-2 summarizes current compensation information for theinternal medicine specialty, illustrating the value of annual cash and benefits for a33-year-old Army or Air Force physician with seven completed years of service.The example compares the most typical Army or Air Force internal medicinephysician with seven years of completed service (assumes one-year of PG-1,two years in an active duty residency, and four years in a staff utilization tour)with a private-sector internal medicine physician with four years of practice.
3 The median value divides the data set in half. Half of the physicians have total annualcompensation above the median and half have total compensation below the median.4 Twenty-five percent of physicians have total compensation above the 75th percentile level and75 percent have total compensation below this amount.
HayGroup Page 1-4

Center for Naval Analyses Comparison of Physician Total Compensation
Table 1-2: Current Annual CompensationInternal Medicine - 7 Completed Years of Service
Element ofCompensation
RMC/Base SalaryIncentive PaysTotal CashBenefitsTotal Compensation
USA/USAF
$63,30050,000
113,30036,000
149,300
Private Sector(50th
Percentile)$143,400
143,40047,900
191,300
Private Sector(75th
Percentile)$156,700
156,70050,800
207,500
HayGroup Page 1-5

Center for Naval Analyses Comparison of Physician Total Compensation
Chapter 2: Results
Results by Medical Specialty and Subspecialty
This chapter provides the current annual cash compensation and benefitcomparisons of Army, Air Force and private sector physicians for the followingmedical specialties and subspecialties.
AnesthesiologyCardiology (Invasive)DermatologyEmergency MedicineFamily PracticeGastroenterologyGeneral SurgeryHematology/OncologyInternal MedicineNeurologyNeurosurgeryObstetrics/GynecologyIndustrial/Occupational MedicineOphthalmologyOrthopedic SurgeryOtolaryngologyPathologyPediatric Primary CarePhysical Medicine & RehabilitationPlastic & Reconstructive SurgeryPsychiatryRadiology (Diagnostic)Radiology (Therapeutic)Urology
Comparisons are made for Army and Air Force physicians who have completed7, 12, and 17 years of service.
All comparisons are made at the median and 75th percentiles of private sectorphysician compensation.
HayGroup Page 2-1

Center for Naval Analyses Comparison of Total CompensationAnesthesiology
Current Annual Compensation
Years ofCompleted
USA/USAF Servic7
Compensation Element
RMC/Base SalaryIncentive Pays
Total Cash
Total Benefits
Total Compensation
USA/USAF
$63,300$58,000
$121,300
$36,000
$157,300
Private Sector(50th Percentile)
$208,600
$208,600
$64,900
$273,500
Private Sector(75th Percentile)
$229,500
$229,500
$73,000
$302,500
Years ofCompleted
USA/USAF Servic12
Compensation Element
RMC/Base SalaryIncentive Pays
Total Cash
Total Benefits
Total Compensation
USA/USAF
$77,600$66,000
$143,600
$42,900
$186,500
Private Sector(50th Percentile)
$215,900
$215,900
$68,200
$284,100
Private Sector(75th Percentile)
$239,500
$239,500
$75,700
$315,200
Years ofCompleted
USA/USAF Servic17
Compensation Element
RMC/Base SalaryIncentive Pays
Total Cash
Total Benefits
Total Compensation
USA/USAF
$86,100$66,000
$152,100
$47,400
$199,500
Private Sector(50th Percentile)
$223,100
$223,100
$71 ,400
$294,500
Private Sector(75th Percentile)
$249,400
$249,400
$78,400
$327,800
Army and Air Force compensation is RMC, special and incentive pays, and benefits as of 1 July 2000
Private Sector compensation is total salary (including base and incentives) and benefits as of 1 July 2000
HavGruup Page 2-2

Center for Naval Analyses Comparison of Total Compensation
AnesthesiologyCurrent Annual Compensation
$350,000 n
$300,000
$250,000-
$200,000
$150,000
$100,000
$50,000
$0
7 Yrs Completed 12 Yrs Completed 17 Yrs Completed
n Total Benefits• Total Cash
HayGroup Page 2-3

Center for Naval AnalysesCardiology (Invasive)Current Annual Compensation
Comparison of Total Compensation
Years ofCompleted
USA/USAF Service7
Compensation Element
RMC/Base SalaryIncentive Pays
Total Cash
Total Benefits
Total Compensation
USA/USAF
$63,300$65,000
$128,300
$36,000
$164,300
Private Sector(50th Percentile)
$226,800
$226,800
$69,100
$295,900
Private Sector(75th Percentile)
$267,100
$267,100
$91 ,800
$358,900
Years ofCompleted
USA/USAF Service12
Compensation Element
RMC/Base SalaryIncentive Pays
Total Cash
Total Benefits
Total Compensation
USA/USAF
$77,600$73,000
$150,600
$42,900
$193,500
Private Sector(50th Percentile)
$230,500
$230,500
$72,200
$302,700
Private Sector(75th Percentile)
$268,400
$268,400
$88,700
$357,100
Years ofCompleted
USA/USAF Service17
Compensation Element
RMC/Base SalaryIncentive Pays
Total Cash
Total Benefits
Total Compensation
USA/USAF
$86,100$65,000
$151,100
$47,400
$198,500
Private Sector(50th Percentile)
$234,200
$234,200
$75,400
$309,600
Private Sector(75th Percentile)
$269,600
$269,600
$85,700
$355,300
Army and Air Force compensation is RMC, special and incentive pays, and benefits as of 1 July 2000
Private Sector compensation is total salary (including base and incentives) and benefits as of 1 July 2000.At 7, 12 and 17 years of completed service, private sector compensation is for cardiology.
llnvGroup Page 2-4

Center for Naval Analyses Comparison of Total Compensation
Cardiology (Invasive)Current Annual Compensation
$100,000-
$50,000-
7 Yrs Completed 12 Yrs Completed
n Total Benefits• Total Cash
17 Yrs Completed
HayGroup Page 2-5

Center for Naval Analyses Comparison of Total CompensationDermatology
Current Annual Compensation
Years ofCompleted
USA/USAF Servic7
Compensation Element
RMC/Base SalaryIncentive Pays
Total Cash
Total Benefits
Total Compensation
USA/USAF
$63,300$43,000
$106,300
$36,000
$142,300
Private Sector(50th Percentile)
$177,500
$177,500
$60,700
$238,200
Private Sector(75th Percentile)
$192,700
$192,700
$65,500
$258,200
Years ofCompleted
USA/USAF Servic12
Compensation Element
RMC/Base SalaryIncentive Pays
Total Cash
Total Benefits
Total Compensation
USA/USAF
$77,600$51,000
$128,600
$42,900
$171,500
Private Sector(50th Percentile)
$186,100
$186,100
$63,600
$249,700
Private Sector(75th Percentile)
$204,600
$204,600
$68,300
$272,900
Years ofCompleted
USA/USAF Servic17
Compensation Element
RMC/Base SalaryIncentive Pays
Total Cash
Total Benefits
Total Compensation
USA/USAF
$86,100$51,000
$137,100
$47,400
$184,500
Private Sector(50th Percentile)
$194,800
$194,800
$66,400
$261,200
Private Sector(75th Percentile)
$2t6,500
$216,500
$71,000
$287,500
Army and Air Force compensation is RMC, special and incentive pays, and benefits as of 1 July 2000
Private Sector compensation is total salary (including base and incentives) and benefits as of 1 July 2000
IlayGroup Page 2-6

Center for Naval Analyses Comparison of Total Compensation
DermatologyCurrent Annual Compensation
$300,000
$250,000-
$200,000
$150,000-
$100,000-
$50,000
7 Yrs Completed 12 Yrs Completed
Total BenefitsI Total Cash
17 Yrs Completed
HayGroup Page 2-7

Center for Naval Analyses Comparison of Total CompensationEmergency Medicine
Current Annual Compensation
Years ofCompleted
USA/USAF Servic7
Compensation Element
RMC/Base SalaryIncentive Pays
Total Cash
Total Benefits
Total Compensation
USA/USAF
$63,300$51,000
$114,300
$36,000
$150,300
Private Sector(50th Percentile)
$181,300
$181,300
$60,000
$241 ,300
Private Sector(75th Percentile)
$196,600
$196,600
$63,400
$260,000
Years ofCompleted
USA/USAF Servic12
Compensation Element
RMC/Base SalaryIncentive Pays
Total Cash
Total Benefits
Total Compensation
USA/USAF
$77,600$59,000
$136,600
$42,900
$179,500
Private Sector(50th Percentile)
$189,300
$189,300
$62,800
$252,100
Private Sector(75th Percentile)
$208,200
$208,200
$67,600
$275,800
Years ofCompleted
USA/USAF Servic17
Compensation Element
RMC/Base SalaryIncentive Pays
Total Cash
Total Benefits
Total Compensation
USA/USAF
$86,100$59,000
$145,100
$47,400
$192,500
Private Sector(50th Percentile)
$197,300
$197,300
$65,600
$262,900
Private Sector(75th Percentile)
$219,700
$219,700
$71,800
$291,500
Army and Air Force compensation is RMC, special and incentive pays, and benefits as of 1 July 2000
Private Sector compensation is total salary (including base and incentives) and benefits as of 1 July 2000
llayftroup Page 2-8

Center for Naval Analyses Comparison of Total Compensation
Emergency MedicineCurrent Annual Compensation
$300,000,
$250,000-
$200,000-
$150,000-
$100,000-
$50,000
7 Yrs Completed 12 Yrs Completed 17 Yrs Completed
a Total Benefits• Total Cash
HayGroup

Center for Naval Analyses Comparison of Total CompensationFamily Practice
Current Annual Compensation
Years ofCompleted
USA/USAF Servic7
Compensation Element
RMC/Base SalaryIncentive Pays
Total Cash
Total Benefits
Total Compensation
USA/USAF
$63,300$56,000
$119,300
$36,000
$155,300
Private Sector(50th Percentile)
$133,000
$133,000
$45,200
$178,200
Private Sector(75th Percentile)
$154,700
$154,700
$49,600
$204,300
Years ofCompleted
USA/USAF Servic12
Compensation Element
RMC/Base SalaryIncentive Pays
Total Cash
Total Benefits
Total Compensation
USA/USAF
$77,600$56,000
$133,600
$42,900
$176,500
Private Sector(50th Percentile)
$136,100
$136,100
$45,900
$182,000
Private Sector(75th Percentile)
$160,700
$160,700
$51,200
$211,900
Years ofCompleted
USA/USAF Servic17
Compensation Element
RMC/Base SalaryIncentive Pays
Total Cash
Total Benefits
Total Compensation
USA/USAF
$86,100$56,000
$142,100
$47,400
$189,500
Private Sector(50th Percentile)
$139,100
$139,100
$46,600
$185,700
Private Sector(75th Percentile)
$166,800
$166,800
$52,700
$219,500
Army and Air Force compensation is RMC, special and incentive pays, and benefits as of 1 July 2000
Private Sector compensation is total salary (including base and incentives) and benefits as of 1 July 2000
IlavGroup Page 2-10

Center for Naval Analyses Comparison of Total Compensation
Family PracticeCurrent Annual Compensation
$100,000-
$50,000-
$0
7 Yrs Completed 12 Yrs Completed Yrs Completed
D Total Benefits• Total Cash
HayGroup Page 2-11

Center for Naval Analyses Comparison of Total CompensationGastroenterology
Current Annual Compensation
Years ofCompleted
USA/USAF Servic7
Compensation Element
RMC/Base SalaryIncentive Pays
Total Cash
Total Benefits
Total Compensation
USA/USAF
$63,300$52,000
$115,300
$36,000
$151,300
Private Sector(50th Percentile)
$190,100
$190,100
$59,100
$249,200
Private Sector(75th Percentile)
$218,200
$218,200
$70,000
$288,200
Years ofCompleted
USA/USAF Servic12
Compensation Element
RMC/Base SalaryIncentive Pays
Total Cash
Total Benefits
Total Compensation
USA/USAF
$77,600$60,000
$137,600
$42,900
$180,500
Private Sector(50th Percentile)
$194,000
$194,000
$61,300
$255,300
Private Sector(75th Percentile)
$221,600
$221,600
$72,400
$294,000
Years ofCompleted
USA/USAF Servic17
Compensation Element
RMC/Base SalaryIncentive Pays
Total Cash
Total Benefits
Total Compensation
USA/USAF
$86,100$52,000
$138,100
$47,400
$185,500
Private Sector(50th Percentile)
$197,900
$197,900
$63,600
$261,500
Private Sector(75th Percentiie)
$225,100
$225,100
$74,800
$299,900
Army and Air Force compensation is RMC, special and incentive pays, and benefits as of 1 July 2000
Private Sector compensation is total salary (including base and incentives) and benefits as of 1 July 2000.At 7, 12 and 17 years of completed service, private sector compensation is for gastroenteroloy.
llay(,rmip Page 2-12

Center for Naval Analyses Comparison of Total Compensation
GastroenterologyCurrent Annual Compensation
$100,000-
$50,000
$0
7 Yrs Completed 12 Yrs Completed 17 Yrs Completed
n Total Benefits• Total Cash
HayGroup Page 2-13

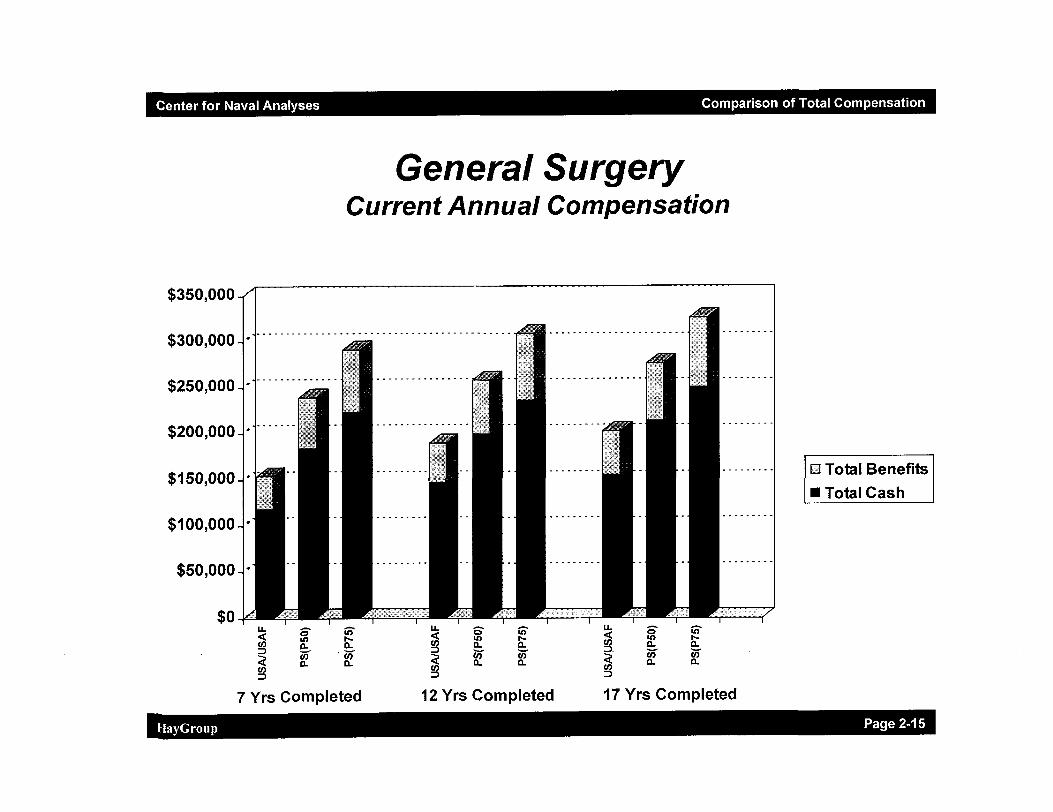
Center for Naval Analyses Comparison of Total CompensationGeneral Surgery
Current Annual Compensation
Years ofCompleted
USA/USAF Servic7
Compensation Element
RMC/Base SalaryIncentive Pays
Total Cash
Total Benefits
Total Compensation
USA/USAF
$63,300$55,000
$118,300
$36,000
$154,300
Private Sector(50th Percentile)
$184,700
$184,700
$55,000
$239,700
Private Sector(75th Percentile)
$222,800
$222,800
$68,600
$291,400
Years ofCompleted
USA/USAF Servic12
Compensation Element
RMC/Base SalaryIncentive Pays
Total Cash
Total Benefits
Total Compensation
USA/USAF
$77,600$69,000
$146,600
$42,900
$189,500
Private Sector(50th Percentile)
$198,900
$198,900
$59,200
$258,100
Private Sector(75th Percentile)
$236,400
$236,400
$72,100
$308,500
Years ofCompleted
USA/USAF Servic17
Compensation Element
RMC/Base SalaryIncentive Pays
Total Cash
Total Benefits
Total Compensation
USA/USAF
$86,100$69,000
$155,100
$47,400
$202,500
Private Sector(50th Percentile)
$213,000
$213,000
$63,400
$276,400
Private Sector(75th Percentile)
$249,900
$249,900
$75,700
$325,600
Army and Air Force compensation is RMC, special and incentive pays, and benefits as of 1 July 2000
Private Sector compensation is total salary (including base and incentives) and benefits as of 1 July 2000
HavGroiip Page 2-14
Center for Naval Analyses Comparison of Total Compensation
General SurgeryCurrent Annual Compensation
7 Yrs Completed 12 Yrs Completed 17 Yrs Completed
El Total Benefits• Total Cash
HayGroup Page 2-15

Center for Naval Analyses Comparison of Total CompensationHematology/OncologyCurrent Annual Compensation
Years ofCompleted
USA/USAF Servic7
Compensation Element
RMC/Base SalaryIncentive Pays
Total Cash
Total Benefits
Total Compensation
USA/USAF
$63,300$43,000
$106,300
$36,000
$142,300
Private Sector(50th Percentile)
$163,900
$163,900
$54,700
$218,600
Private Sector(75th Percentile)
$186,200
$186,200
$62,500
$248,700
Years ofCompleted
USA/USAF Servic12
Compensation Element
RMC/Base SalaryIncentive Pays
Total Cash
Total Benefits
Total Compensation
USA/USAF
$77,600$51,000
$128,600
$42,900
$171,500
Private Sector(50th Percentile)
$176,000
$176,000
$58,500
$234,500
Private Sector(75th Percentile)
$194,500
$194,500
$65,200
$259,700
Years ofCompleted
USA/USAF Servic17
Compensation Element
RMC/Base SalaryIncentive Pays
Total Cash
Total Benefits
Total Compensation
USA/USAF
$86,100$43,000
$129,100
$47,400
$176,500
Private Sector(50th Percentile)
$188,600
$188,600
$62,500
$251,100
Private Sector(75th Percentile)
$203,200
$203,200
$68,000
$271,200
Air Force compensation is RMC, special and incentive pays, and benefits as of 1 July 2000
Private Sector compensation is total salary (including base and incentives) and benefits as of 1 July 2000.At 7,12 and 17 years of completed service, private sector compensation is for hematology/oncology.
llavGroup Page 2-16

Center for Naval Analyses Comparison of Total Compensation
Hematology/OncologyCurrent Annual Compensation
$50,000
$0
Total BenefitsTotal Cash
7 Yrs Completed 12 Yrs Completed 17 Yrs Completed
HayGroup

Center for Naval Analyses Comparison of Total CompensationInternal Medicine
Current Annual Compensation
Years ofCompleted
USA/USAF Servic7
Compensation Element
RMC/Base SalaryIncentive Pays
Total Cash
Total Benefits
Total Compensation
USA/USAF
$63,300$50,000
$113,300
$36,000
$149,300
Private Sector(50th Percentile)
$143,400
$143,400
$47,900
$191,300
Private Sector(75th Percentile)
$156,700
$156,700
$50,800
$207,500
Years ofCompleted
USA/USAF Servic12
Compensation Element
RMC/Base SalaryIncentive Pays
Total Cash
Total Benefits
Total Compensation
USA/USAF
$77,600$50,000
$127,600
$42,900
$170,500
Private Sector(50th Percentile)
$151,200
$151,200
$50,000
$201,200
Private Sector(75th Percentile)
$167,300
$167,300
$54,600
$221,900
Years ofCompleted
USA/USAF Servic17
Compensation Element
RMC/Base SalaryIncentive Pays
Total Cash
Total Benefits
Total Compensation
USA/USAF
$86,100$50,000
$136,100
$47,400
$183,500
Private Sector(50th Percentile)
$159,000
$159,000
$52,100
$211,100
Private Sector(75th Percentile)
$177,800
$177,800
$58,500
$236,300
Army and Air Force compensation is RMC, special and incentive pays, and benefits as of 1 July 2000
Private Sector compensation is total salary (including base and incentives) and benefits as of 1 July 2000
HavGroup Page 2-18

Center for Naval Analyses Comparison of Total Compensation
Internal MedicineCurrent Annual Compensation
$100,000-
$50,000-*
$0
El Total Benefits• Total Cash
7 Yrs Completed 12 Yrs Completed 17 Yrs Completed
HayGroup

Center for Naval Analyses Comparison of Total CompensationNeurology
Current Annual Compensation
Years ofCompleted
USA/USAF Servic7
Compensation Element
RMC/Base SalaryIncentive Pays
Total Cash
Total Benefits
Total Compensation
USA/USAF
$63,300$42,000
$105,300
$36,000
$141,300
Private Sector(50th Percentile)
$160,200
$160,200
$54,700
$214,900
Private Sector(75th Percentile)
$178,400
$178,400
$63,000
$241,400
Years ofCompleted
USA/USAF Servic12
Compensation Element
RMC/Base SalaryIncentive Pays
Total Cash
Total Benefits
Total Compensation
USA/USAF
$77,600$50,000
$127,600
$42,900
$170,500
Private Sector(50th Percentile)
$166,800
$166,800
$56,300
$223,100
Private Sector(75th Percentile)
$185,100
$185,100
$64,400
$249,500
Years ofCompleted
USA/USAF Servic17
Compensation Element
RMC/Base SalaryIncentive Pays
Total Cash
Total Benefits
Total Compensation
USA/USAF
$86,100$50,000
$136,100
$47,400
$183,500
Private Sector(50th Percentile)
$173,400
$173,400
$57,900
$231,300
Private Sector(75th Percentile)
$191,800
$191,800
$65,700
$257,500
Army and Air Force compensation is RMC, special and incentive pays, and benefits as of 1 July 2000
Private Sector compensation is total salary (including base and incentives) and benefits as of 1 July 2000
HavGroup Page 2-20

Center for Naval Analyses Comparison of Total Compensation
NeurologyCurrent Annual Compensation
$300,000-,
$250,000-
$200,000-
$150,000-
$100,000-
$50,000
D Total Benefits• Total Cash
7 Yrs Completed 12 Yrs Completed 17 Yrs Completed
HayGroup

Center for Naval Analyses Comparison of Total CompensationNeurosurgery (Army)
Current Annual Compensation
Years ofCompleted
Army Service7
Compensation Element
RMC/Base SalaryIncentive Pays
Total Cash
Total Benefits
Total Compensation
Army
$63,300$62,500
$125,800
$36,000
$161,800
Private Sector(50th Percentile)
$342,500
$342,500
$95,700
$438,200
Private Sector(75th Percentile)
Insufficient Data
Years ofCompleted
Army Service12
Compensation Element
RMC/Base SalaryIncentive Pays
Total Cash
Total Benefits
Total Compensation
Army
$77,600$74,000
$151,600
$42,900
$194,500
Private Sector(50th Percentile)
$334,500
$334,500
$96,500
$431,000
Private Sector(75th Percentile)
Insufficient Data
Years ofCompleted
Army Service17
Compensation Element
RMC/Base SalaryIncentive Pays
Total Cash
Total Benefits
Total Compensation
Army
$86,100$65,000
$151,100
$47,400
$198,500
Private Sector(50th Percentile)
$326,600
$326,600
$97,300
$423,900
Private Sector(75th Percentile)
Insufficient Data
Army compensation is RMC, special and incentive pays, and benefits as of 1 July 2000
Private Sector compensation is total salary (including base and incentives) and benefits as of 1 July 2000
Private Sector base compensation increases by years of practice in the specialty. However, incentive paysdecrease by years of practice so that total cash compensation (base plus incentives) declines by years ofpractice.
Insufficient data to display comparisons for Private Sector 75th percentile
HavGroiip Page 2-22

Center for Naval Analyses Comparison of Total Compensation
Neurosurgery - ArmyCurrent Annual Compensation
$450,000
$400,000-
$350,000-
$300,000-
$250,000-
$200,000-
$150,000-
$100,000-
$50,000-
$0Army PS(P50) PS(P75)
7 Yrs Completed
Army PS(P50) PS(P75)
12 Yrs Completed
Army PS(P50) PS{P75)
17 Yrs Completed
m Total Benefits• Total Cash
Insufficient Data toDetermine the 75th
Percentile
HayGroup Page 2-23

Center for Naval Analyses Comparison of Total CompensationNeurosurgery (Air Force)
Current Annual Compensation
Years ofCompleted
USAF Service7
Compensation Element
RMC/Base SalaryIncentive Pays
Total Cash
Total Benefits
Total Compensation
USAF
$63,300$62,500
$125,800
$36,000
$161,800
Private Sector(50th Percentile)
$338,600
$338,600
$95,800
$434,400
Private Sector(75th Percentile)
Insufficient Data
Years ofCompleted
USAF Service12
Compensation Element
RMC/Base SalaryIncentive Pays
Total Cash
Total Benefits
Total Compensation
USAF
$77,600$75,000
$152,600
$42,900
$195,500
Private Sector(50th Percentile)
$332,900
$332,900
$96,600
$429,500
Private Sector(75th Percentile)
Insufficient Data
Years ofCompleted
USAF Service17
Compensation Element
RMC/Base SalaryIncentive Pays
Total Cash
Total Benefits
Total Compensation
USAF
$86,100$65,000
$151,100
$47,400
$198,500
Private Sector(50th Percentile)
$325,100
$325,100
$97,500
$422,600
Private Sector(75th Percentile)
Insufficient Data
Air Force compensation is RMC, special and incentive pays, and benefits as of 1 July 2000
Private Sector compensation is total salary (including base and incentives) and benefits as of 1 July 2000
Private Sector base compensation increases by years of practice in the specialty. However, incentive paysdecrease by years of practice so that total cash compensation (base plus incentives) declines by years ofpractice.
Insufficient data to display comparisons for Private Sector 75th percentile
HavCroiip Page 2-24

Center for Naval Analyses Comparison of Total Compensation
Neurosurgery - Air ForceCurrent Annual Compensation
$450,000
$400,000
$350,000-
$300,000-
$250,000-
$200,000
$150,000-
$100,000-
$50,000-
$0Air PS(P50) PS(P75)
Force
7 Yrs Completed
Air PS(P50) PS(P75)Force
12 Yrs Completed
Air PS(P50) PS(P75)Force
17 Yrs Completed
n Total Benefits• Total Cash
Insufficient Data toDetermine the 75th
Percentile
HayGroup Page 2-25

Center for Naval Analyses Comparison of Total CompensationObstetrics/GynecologyCurrent Annual Compensation
Years ofCompleted
USA/USAF Servic7
Compensation Element
RMC/Base SalaryIncentive Pays
Total Cash
Total Benefits
Total Compensation
USA/USAF
$63,300$60,000
$123,300
$36,000
$159,300
Private Sector(50th Percentile)
$199,200
$199,200
$62,500
$261,700
Private Sector(75th Percentile)
$221,600
$221,600
$68,900
$290,500
Years ofCompleted
USA/USAF Servic12
Compensation Element
RMC/Base SalaryIncentive Pays
Total Cash
Total Benefits
Total Compensation
USA/USAF
$77,600$68,000
$145,600
$42,900
$188,500
Private Sector(50th Percentile)
$205,600
$205,600
$65,200
$270,800
Private Sector(75th Percentile)
$229,600
$229,600
$71,900
$301,500
Years ofCompleted
USA/USAF Servic17
Compensation Element
RMC/Base SalaryIncentive Pays
Total Cash
Total Benefits
Total Compensation
USA/USAF
$86,100$68,000
$154,100
$47,400
$201 ,500
Private Sector(50th Percentile)
$212,000
$212,000
$67,800
$279,800
Private Sector(75th Percentile)
$237,600
$237,600
$75,000
$312,600
Army and Air Force compensation is RMC, special and incentive pays, and benefits as of 1 July 2000
Private Sector compensation is total salary (including base and incentives) and benefits as of 1 July 2000
llayCiroup Page 2-26

Center for Naval Analyses Comparison of Total Compensation
Obstetrics/GynecologyCurrent Annual Compensation
7 Yrs Completed 12 Yrs Completed 17 Yrs Completed
ii Total Benefits• Total Cash
HayGroup Page 2-27

Center for Naval Analyses Comparison of Total CompensationIndustrial/Occupational Medicine
Current Annual Compensation
Years ofCompleted
USA/USAF Servic7
Compensation Element
RMC/Base SalaryIncentive Pays
Total Cash
Total Benefits
Total Compensation
USA/USAF
$63,300$50,000
$113,300
$36,000
$149,300
Private Sector(50th Percentile)
$152,000
$152,000
$50,400
$202,400
Private Sector(75th Percentile)
$165,500
$165,500
$54,300
$219,800
Years ofCompleted
USA/USAF Servic12
Compensation Element
RMC/Base SalaryIncentive Pays
Total Cash
Total Benefits
Total Compensation
USA/USAF
$77,600$50,000
$127,600
$42,900
$170,500
Private Sector(50th Percentile)
$152,600
$152,600
$51,600
$204,200
Private Sector(75th Percentile)
$168,800
$168,800
$55,400
$224,200
Years ofCompleted
USA/USAF Servic17
Compensation Element
RMC/Base SalaryIncentive Pays
Total Cash
Total Benefits
Total Compensation
USA/USAF
$86,100$50,000
$136,100
$47,400
$183,500
Private Sector(50th Percentile)
$153,100
$153,100
$52,800
$205,900
Private Sector(75th Percentile)
$172,100
$172,100
$56,500
$228,600
Army and Air Force compensation is RMC, special and incentive pays, and benefits as of 1 July 2000
Private Sector compensation is total salary (including base and incentives) and benefits as of 1 July 2000
IlaYGroup Page 2-28

Industrial/Occupational MedicineCurrent Annual Compensation
$100,000-
$50,000-
$0
n Total Benefits• Total Cash
7 Yrs Completed 12 Yrs Completed 17 Yrs Completed
HayGroup

Center for Naval Analyses Comparison of Total CompensationOphthalmology
Current Annual Compensation
Years ofCompleted
USA/USAF Service7
Compensation Element
RMC/Base SalaryIncentive Pays
Total Cash
Total Benefits
Total Compensation
USA/USAF
$63,300$57,000
$120,300
$36,000
$156,300
Private Sector(50th Percentile)
$170,000
$170,000
$57,300
$227,300
Private Sector(75th Percentile)
$207,700
$207,700
$70,200
$277,900
Years ofCompleted
USA/USAF Service12
Compensation Element
RMC/Base SalaryIncentive Pays
Total Cash
Total Benefits
Total Compensation
USA/USAF
$77,600$57,000
$134,600
$42,900
$177,500
Private Sector(50th Percentile)
$185,800
$185,800
$62,600
$248,400
Private Sector(75th Percentile)
$222,200
$222,200
$74,800
$297,000
Years ofCompleted
USA/USAF Service17
Compensation Element
RMC/Base SalaryIncentive Pays
Total Cash
Total Benefits
Total Compensation
USA/USAF
$86,100$57,000
$143,100
$47,400
$190,500
Private Sector(50th Percentile)
$201,500
$201,500
$67,800
$269,300
Private Sector(75th Percentile)
$236,600
$236,600
$79,300
$315,900
Army and Air Force compensation is RMC, special and incentive pays, and benefits as of 1 July 2000
Private Sector compensation is total salary (including base and incentives) and benefits as of 1 July 2000
llayCIronn Page 2-30

Center for Naval Analyses Comparison of Total Compensation
OphthalmologyCurrent Annual Compensation
$150,000-
$100,000
$50,000
$0
7 Yrs Completed 12 Yrs Completed 17 Yrs Completed
0 Total Benefits• Total Cash
HayGroup
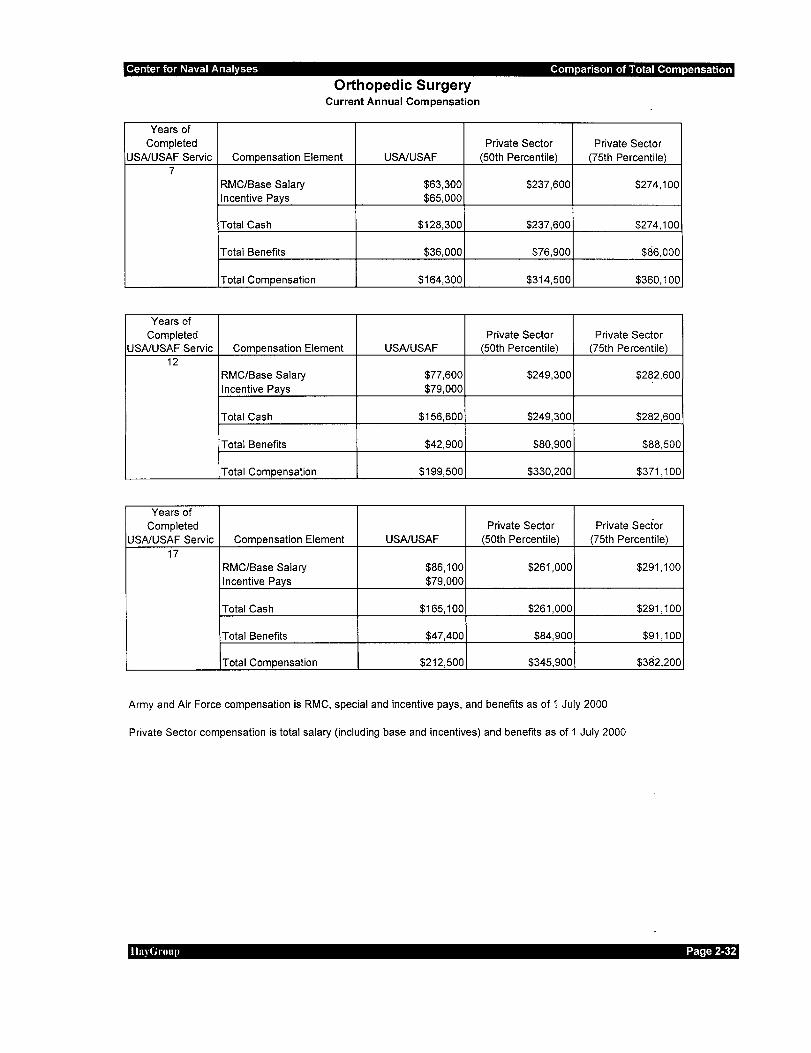
Center for Naval Analyses Comparison of Total CompensationOrthopedic Surgery
Current Annual Compensation
Years ofCompleted
USA/USAF Servic7
Compensation Element
RMC/Base SalaryIncentive Pays
Total Cash
Total Benefits
Total Compensation
USA/USAF
$63,300$65,000
$128,300
$36,000
$164,300
Private Sector(50th Percentile)
$237,600
$237,600
$76,900
$314,500
Private Sector(75th Percentile)
$274,100
$274,100
$86,000
$360,100
Years ofCompleted
USA/USAF Servic12
Compensation Element
RMC/Base SalaryIncentive Pays
Total Cash
Total Benefits
Total Compensation
USA/USAF
$77,600$79,000
$156,600
$42,900
$199,500
Private Sector(50th Percentile)
$249,300
$249,300
$80,900
$330,200
Private Sector(75th Percentile)
$282,600
$282,600
$88,500
$371,100
Years ofCompleted
USA/USAF Servic17
Compensation Element
RMC/Base SalaryIncentive Pays
Total Cash
Total Benefits
Total Compensation
USA/USAF
$86,100$79,000
$165,100
$47,400
$212,500
Private Sector(50th Percentile)
$261,000
$261,000
$84,900
$345,900
Private Sector(75th Percentile)
$291,100
$291,100
$91,100
$382,200
Army and Air Force compensation is RMC, special and incentive pays, and benefits as of 1 July 2000
Private Sector compensation is total salary (including base and incentives) and benefits as of 1 July 2000
IlayGroup Page 2-32

Center for Naval Analyses Comparison of Total Compensation
Orthopedic SurgeryCurrent Annual Compensation
$400,000,
$350,000
$300,000
$250,000-
$200,000-
$150,000-
$100,000-
$50,000
$0
7 Yrs Completed 12 Yrs Completed 17 Yrs Completed
Total BenefitsTotal Cash
Hay Group Page 2-33

Center for Naval Analyses Comparison of Total CompensationOtolaryngology (Army)Current Annual Compensation
Years ofCompleted
Army Service7
Compensation Element
RMC/Base SalaryIncentive Pays
Total Cash
Total Benefits
Total Compensation
Army
$63,300$56,500
$119,800
$36,000
$155,800
Private Sector(50th Percentile)
$240,000
$240,000
$72,300
$312,300
Private Sector(75th Percentile)
$243,300
$243,300
$83,000
$326,300
Years ofCompleted
Army Service12
Compensation Element
RMC/Base SalaryIncentive Pays
Total Cash
Total Benefits
Total Compensation
Army
$77,600$67,000
$144,600
$42,900
$187,500
Private Sector(50th Percentile)
$235,000
$235,000
$72,300
$307,300
Private Sector(75th Percentile)
$256,600
$256,600
$87,300
$343,900
Years ofCompleted
Army Service17
Compensation Element
RMC/Base SalaryIncentive Pays
Total Cash
Total Benefits
Total Compensation
Army
$86,100$59,000
$145,100
$47,400
$192,500
Private Sector(50th Percentile)
$230,200
$230,200
$72,400
$302,600
Private Sector(75th Percentile)
$270,200
$270,200
$91 ,800
$362,000
Army compensation is RMC, special and incentive pays, and benefits as of 1 July 2000
Private Sector compensation is total salary (including base and incentives) and benefits as of 1 July 2000
llavGroiip Page 2-34

Center for Naval Analyses Comparison of Total Compensation
Otolaryngology - ArmyCurrent Annual Compensation
$400,000
$350,000
$300,000-
$0Army PS(P50) PS(P75) Army PS(P50) PS(P75) Army PS(P50) PS(P75)
7 Yrs Completed 12 Yrs Completed 17 Yrs Completed
H Total Benefits• Total Cash
HayGroup

Center for Naval Analyses Comparison of Total CompensationOtolaryngology (Air Force)
Current Annual Compensation
Years ofCompleted
USAF Service7
Compensation Element
RMC/Base SalaryIncentive Pays
Total Cash
Total Benefits
Total Compensation
USAF
$63,300$59,000
$122,300
$36,000
$158,300
Private Sector(50th Percentile)
$238,900
$238,900
$72,300
$311,200
Private Sector(75th Percentile)
$245,700
$245,700
$83,700
$329,400
Years ofCompleted
USAF Service12
Compensation Element
RMC/Base SalaryIncentive Pays
Total Cash
Total Benefits
Total Compensation
USAF
$77,600$67,000
$144,600
$42,900
$187,500
Private Sector(50th Percentile)
$234,100
$234,100
$72,300
$306,400
Private Sector(75th Percentile)
$259,300
$259,300
$88,200
$347,500
Years ofCompleted
USAF Service17
Compensation Element
RMC/Base SalaryIncentive Pays
Total Cash
Total Benefits
Total Compensation
USAF
$86,100$59,000
$145,100
$47,400
$192,500
Private Sector(50th Percentile)
$229,200
$229,200
$72,400
$301,600
Private Sector(75th Percentile)
$273,000
$273,000
$92,600
$365,600
Air Force compensation is RMC, special and incentive pays, and benefits as of 1 July 2000
Private Sector compensation is total salary (including base and incentives) and benefits as of 1 July 2000
UavCiroup Page 2-36

Center for Naval Analyses Comparison of Total Compensation
Otolaryngology - Air ForceCurrent Annual Compensation
$400,000
$350,000
$300,000
$250,000
$200,000
$150,000-
$100,000
$50,000
$0Air PS(P50) PS(P75)
Force
7 Yrs Completed
Air PS(P50) PS(P75)Force
12 Yrs Completed
Air PS(P50) PS(P75)Force
17 Yrs Completed
n Total Benefits• Total Cash
HayGroup Page 2-37

Center for Naval Analyses Comparison of Total CompensationPathology
Current Annual Compensation
Years ofCompleted
USA/USAF Servic7
Compensation Element
RMC/Base SalaryIncentive Pays
Total Cash
Total Benefits
Total Compensation
USA/USAF
$63,300$45,000
$108,300
$36,000
$144,300
Private Sector(50th Percentile)
$163,300
$163,300
$56,400
$219,700
Private Sector(75th Percentile)
$21-8,200
$218,200
$74,200
$292,400
Years ofCompleted
USA/USAF Servic12
Compensation Element
RMC/Base SalaryIncentive Pays
Total Cash
Total Benefits
Total Compensation
USA/USAF
$77,600$53,000
$130,600
$42,900
$173,500
Private Sector(50th Percentile)
$173,700
$173,700
$59,700
$233,400
Private Sector(75th Percentile)
$221,200
$221,200
$75,700
$296,900
Years ofCompleted
USA/USAF Servic17
Compensation Element
RMC/Base SalaryIncentive Pays
Total Cash
Total Benefits
Total Compensation
USA/USAF
$86,100$45,000
$131,100
$47,400
$178,500
Private Sector(50th Percentile)
$184,000
$184,000
$62,900
$246,900
Private Sector(75th Percentile)
$224,100
$224,100
$77,300
$301,400
Army and Air Force compensation is RMC, special and incentive pays, and benefits as of 1 July 2000
Private Sector compensation is total salary (including base and incentives) and benefits as of 1 July 2000
HavGroup Page 2-38

Center for Naval Analyses Comparison of Total Compensation
PathologyCurrent Annual Compensation
m Total Benefits• Total Cash
7 Yrs Completed 12 Yrs Completed 17 Yrs Completed
HayGroup Page 2-39

Center for Naval Analyses Comparison of Total CompensationPediatric Primary CareCurrent Annual Compensation
Years ofCompleted
USA/USAF Servic7
Compensation Element
RMC/Base SalaryIncentive Pays
Total Cash
Total Benefits
Total Compensation
USA/USAF
$63,300$48,000
$111,300
$36,000
$147,300
Private Sector(50th Percentile)
$133,500
$133,500
$45,100
$178,600
Private Sector(75th Percentile)
$144,600
$144,600
$48,500
$193,100
Years ofCompleted
USA/USAF Servic12
Compensation Element
RMC/Base SalaryIncentive Pays
Total Cash
Total Benefits
Total Compensation
USA/USAF
$77,600$48,000
$125,600
$42,900
$168,500
Private Sector(50th Percentile)
$140,600
$140,600
$46,500
$187,100
Private Sector(75th Percentile)
$159,200
$159,200
$53,000
$212,200
Years ofCompleted
USA/USAF Servic17
Compensation Element
RMC/Base SalaryIncentive Pays
Total Cash
Total Benefits
Total Compensation
USA/USAF
$86,100$48,000
$134,100
$47,400
$181,500
Private Sector(50th Percentile)
$147,700
$147,700
$47,900
$195,600
Private Sector(75th Percentile)
$173,700
$173,700
$57,600
$231,300
Army and Air Force compensation is RMC, special and incentive pays, and benefits as of 1 July 2000
Private Sector compensation is total salary (including base and incentives) and benefits as of 1 July 2000
HayGroup Page 2-40

Center for Naval Analyses Comparison of Total Compensation
Pediatric Primary CareCurrent Annual Compensation
$100,000-
$50,000
$0
Total BenefitsTotal Cash
7 Yrs Completed 12 Yrs Completed 17 Yrs Completed
HayGroup

Center for Naval Analyses Comparison of Total CompensationPhysical Medicine & Rehabilitation
Current Annual Compensation
Years ofCompleted
USA/USAF Servic7
Compensation Element
RMC/Base SalaryIncentive Pays
Total Cash
Total Benefits
Total Compensation
USA/USAF
$63,300$40,000
$103,300
$36,000
$139,300
Private Sector(50th Percent! le)
$153,600
$153,600
$51,500
$205,100
Private Sector(75th Percentile)
$173,400
$173,400
$60,100
$233,500
Years ofCompleted
USA/USAF Servic12
Compensation Element
RMC/Base SalaryIncentive Pays
Total Cash
Total Benefits
Total Compensation
USA/USAF
$77,600$50,000
$127,600
$42,900
$170,500
Private Sector(50th Percentile)
$155,200
$155,200
$52,100
$207,300
Private Sector(75th Percentile)
$181,600
$181,600
$61,500
$243,100
Years ofCompleted
USA/USAF Servic17
Compensation Element
RMC/Base SalaryIncentive Pays
Total Cash
Total Benefits
Total Compensation
USA/USAF
$86,100$50,000
$136,100
$47,400
$183,500
Private Sector(50th Percentile)
$156,700
$156,700
$52,800
$209,500
Private Sector(75th Percentile)
$189,700
$189,700
$62,900
$252,600
Army and Air Force compensation is RMC, special and incentive pays, and benefits as of 1 July 2000
Private Sector compensation is total salary (including base and incentives) and benefits as of 1 July 2000
HayGroup Page 2-42

Center for Naval Analyses Comparison of Total Compensation
Physical Medicine & RehabilitationCurrent Annual Compensation
$300,000
$250,000-
$200,000-
$150,000-
$100,000
$50,000
7 Yrs Completed 12 Yrs Completed
I Total Benefits! Total Cash
17 Yrs Completed
HayGroup

Center for Naval Analyses Comparison of Total CompensationPlastic & Reconstructive Surgery
Current Annual Compensation
Years ofCompleted
USA/USAF Servic7
Compensation Element
RMC/Base SalaryIncentive Pays
Total Cash
Total Benefits
Total Compensation
USA/USAF
$63,300$65,000
$128,300
$36,000
$164,300
Private Sector(50th Percentile)
$209,700
$209,700
$65,400
$275,100
Private Sector(75th Percentile)
$301,000
$301,000
$104,100
$405,100
Years ofCompleted
USA/USAF Servic12
Compensation Element
RMC/Base SalaryIncentive Pays
Total Cash
Total Benefits
Total Compensation
USA/USAF
$77,600$73,000
$150,600
$42,900
$193,500
Private Sector(50th Percentiie)
$224,300
$224,300
$70,800
$295,100
Private Sector(75th Percentile)
$309,200
$309,200
$104,300
$413,500
Years ofCompleted
USA/USAF Servic17
Compensation Element
RMC/Base SalaryIncentive Pays
Total Cash
Total Benefits
Total Compensation
USA/USAF
$86,100$65,000
$151,100
$47,400
$198,500
Private Sector(50th Percentile)
$239,600
$239,600
$76,500
$316,100
Private Sector(75th Percentile)
$317,600
$317,600
$104,400
$422,000
Army and Air Force compensation is RMC, special and incentive pays, and benefits as of 1 July 2000
Private Sector compensation is total salary (including base and incentives) and benefits as of 1 July 2000
At 7 years of completed service, private sector compensation is for general surgery. At 12 and 17 years of completedservice, private sector compensation is for plastic and reconstructive surgery.
llaydroup Page 2-44

Center for Naval Analyses Comparison of Total Compensation
Plastic & Reconstructive SurgeryCurrent Annual Compensation
$450,000-,
$400,000-
$350,000-
$300,000-
$250,000-
$200,000-
$150,000
$100,000
$50,000-
$0
7 Yrs Completed 12 Yrs Completed
D Total Benefits• Total Cash
17 Yrs Completed
HayGroup Page 2-45

Center for Naval Analyses Comparison of Total CompensationPsychiatry
Current Annual Compensation
Years ofCompleted
USA/USAF Servic7
Compensation Element
RMC/Base SalaryIncentive Pays
Total Cash
Total Benefits
Total Compensation
USA/USAF
$63,300$43,000
$106,300
$36,000
$142,300
Private Sector(50th Percentile)
$141,700
$141,700
$48,400
$190,100
Private Sector(75th Percentile)
$151,000
$151,000
$51,700
$202,700
Years ofCompleted
USA/USAF Servic12
Compensation Element
RMC/Base SalaryIncentive Pays
Total Cash
Total Benefits
Total Compensation
USA/USAF
$77,600$57,000
$134,600
$42,900
$177,500
Private Sector(50th Percentile)
$148,700
$148,700
$50,700
$199,400
Private Sector(75th Percentile)
$158,000
$158,000
$54,000
$212,000
Years ofCompleted
USA/USAF Servic17
Compensation Element
RMC/Base SalaryIncentive Pays
Total Cash
Total Benefits
Total Compensation
USA/USAF
$86,100$57,000
$143,100
$47,400
$190,500
Private Sector(50th Percentile)
$155,600
$155,600
$53,000
$208,600
Private Sector(75th Percentile)
$165,100
$165,100
$56,300
$221 ,400
Army and Air Force compensation is RMC, special and incentive pays, and benefits as of 1 July 2000
Private Sector compensation is total salary (including base and incentives) and benefits as of 1 July 2000
IlayGroup Page 2-46

Center for Naval Analyses Comparison of Total Compensation
PsychiatryCurrent Annual Compensation
$100,000
$50,000-
$0
n Total Benefits• Total Cash
7 Yrs Completed 12 Yrs Completed 17 Yrs Completed
HayGroup Page 2-47

Center for Naval Analyses Comparison of Total CompensationRadiology (Diagnostic)Current Annual Compensation
Years ofCompleted
USA/USAF Servic7
Compensation Element
RMC/Base SalaryIncentive Pays
Total Cash
Total Benefits
Total Compensation
USA/USAF
$63,300$60,000
$123,300
$36,000
$159,300
Private Sector(50th Percentile)
$208,500
$208,500
$68,500
$277,000
Private Sector(75th Percentile)
$259,600
$259,600
$79,300
$338,900
Years ofCompleted
USA/USAF Servic12
Compensation Element
RMC/Base SalaryIncentive Pays
Total Cash
Total Benefits
Total Compensation
USA/USAF
$77,600$68,000
$145,600
$42,900
$188,500
Private Sector(50th Percentile)
$215,500
$215,500
$71,000
$286,500
Private Sector(75th Percentile)
$261,600
$261,600
$80,500
$342,100
Years ofCompleted
USA/USAF Servic17
Compensation Element
RMC/Base SalaryIncentive Pays
Total Cash
Total Benefits
Total Compensation
USA/USAF
$86,100$68,000
$154,100
$47,400
$201,500
Private Sector(50th Percentile)
$222,500
$222,500
$73,400
$295,900
Private Sector(75th Percentile)
$263,600
$263,600
$81,700
$345,300
Army and Air Force compensation is RMC, special and incentive pays, and benefits as of 1 July 2000
Private Sector compensation is total salary (including base and incentives) and benefits as of 1 July 2000
HavGroiip Page 2-48

Center for Naval Analyses Comparison of Total Compensation
Radiology (Diagnostic)Current Annual Compensation
7 Yrs Completed 12 Yrs Completed 17 Yrs Completed
Total BenefitsTotal Cash
HayGroup Page 2-49

Center for Naval Analyses Comparison of Total CompensationRadiology (Therapeutic)
Current Annual Compensation
Years ofCompleted
USA/USAF Servic7
Compensation Element
RMC/Base SalaryIncentive Pays
Total Cash
Total Benefits
Total Compensation
USA/USAF
$63,300$60,000
$123,300
$36,000
$159,300
Private Sector(50th Percentile)
$215,500
$215,500
$71,100
$286,600
Private Sector(75th Percentile)
$263,900
$263,900
$72,700
$336,600
Years ofCompleted
USA/USAF Servic12
Compensation Element
RMC/Base SalaryIncentive Pays
Total Cash
Total Benefits
Total Compensation
USA/USAF
$77,600$68,000
$145,600
$42,900
$188,500
Private Sector(50th Percentile)
$224,800
$224,800
$74,100
$298,900
Private Sector(75th Percentile)
$276,300
$276,300
$76,600
$352,900
Years ofCompleted
USA/USAF Servic17
Compensation Element
RMC/Base SalaryIncentive Pays
Total Cash
Total Benefits
Total Compensation
USA/USAF
$86,100$68,000
$154,100
$47,400
$201,500
Private Sector(50th Percentile)
$234,700
$234,700
$77,400
$312,100
Private Sector(75th Percentile)
$289,600
$289,600
$80,900
$370,500
Army and Air Force compensation is RMC, special and incentive pays, and benefits as of 1 July 2000
Private Sector compensation is total salary (including base and incentives) and benefits as of 1 July 2000
HavGroun Page 2-50

Center for Naval Analyses Comparison of Total Compensation
Radiology (Therapeutic)Current Annual Compensation
$400,000 -.
$350,000-
$300,000
$250,000-
$200,000
$150,000
$100,000-
$50,000
$0
7 Yrs Completed 12 Yrs Completed 17 Yrs Completed
n Total Benefits• Total Cash
HayGroup Page 2-51

Center for Naval Analyses Comparison of Total CompensationUrology
Current Annual Compensation
Years ofCompleted
USA/USAF Servic7
Compensation Element
RMC/Base SalaryIncentive Pays
Total Cash
Total Benefits
Total Compensation
USA/USAF
$63,300$54,500
$117,800
$36,000
$153,800
Private Sector(50th Percentile)
$192,800
$192,800
$62,800
$255,600
Private Sector(75th Percentile)
$215,400
$215,400
$69,400
$284,800
Years ofCompleted
USA/USAF Servic12
Compensation Element
RMC/Base SalaryIncentive Pays
Total Cash
Total Benefits
Total Compensation
USA/USAF
$77,600$65,000
$142,600
$42,900
$185,500
Private Sector(50th Percentile)
$202,200
$202,200
$65,900
$268,100
Private Sector(75th Percentile)
$225,600
$225,600
$72,600
$298,200
Years ofCompleted
USA/USAF Servic17
Compensation Element
RMC/Base SalaryIncentive Pays
Total Cash
Total Benefits
Total Compensation
USA/USAF
$86,100$57,000
$143,100
$47,400
$190,500
Private Sector(50th Percentile)
$212,200
$212,200
$69,200
$281 ,400
Private Sector(75th Percentile)
$236,500
$236,500
$76,100
$312,600
Army and Air Force compensation is RMC, special and incentive pays, and benefits as of 1 July 2000
Private Sector compensation is total salary (including base and incentives) and benefits as of 1 July 2000
HavGroup Page 2-52

Center for Naval Analyses Comparison of Total Compensation
UrologyCurrent Annual Compensation
m Total Benefits• Total Cash
7 Yrs Completed 12 Yrs Completed 17 Yrs Completed
HayGroup Page 2-53

Center for Naval Analyses Comparison of Physician Total Compensation
Appendix A: Assumptions
Career Profiles
Army and Air Force Physicians:
Army and Air Force physicians are assumed to enter active service at age 26following completion of medical school. Residency and fellowship training areassumed to occur while on active duty.
Separate career profiles1 are developed for each specialty in the study. Theseprofiles represent the predominant or most typical experience in that specialty.All entering Army and Air Force physicians are assumed to serve one year ofinternship (PG-1) immediately upon entering active duty. All specialty training isassumed to begin following the PG-1 tour, and fellowship training immediatelyfollows residency training. Table A-7 at the end of this Appendix illustrate thecareer profiles, training lengths, and training Active Duty Service Commitments(ADSCs) for each specialty.
All entering physicians are assumed to carry a four-year ADSC resulting from afour-year Armed Forces Health Professional Scholarship Program (HPSP) Noactive duty obligation is discharged when in PG-1 or residency training.Attending residency training produces additional ADSCs and these commitmentsare served concurrently with the HPSP following completion of in-serviceresidency training. For example, an Army or Air Force physician attendingradiology residency training will enter the program with a four-year ADSC fromthe scholarship program subsidization, and will incur an additional four-yearcommitment from residency. However, after residency training, the four-yearservice commitment from medical school is served concurrently with the four-year obligation from radiology training.
With two exceptions, the study assumes that residency and fellowship traininglengths are the same for the Army and Air Force within a particular specialty orsubspecialty. For example, the study assumes a four-year residency program forboth Army and Air Force physicians specializing in pathology. The exceptionsare neurosurgery and otolaryngology where the Army residency programs areassumed to be six and five years in length, respectively, and the Air Forceresidency programs are assumed to be five and four years in length,respectively.
1 Service representatives from the Army, Air Force, and the TRICARE Management Agencyapproved the career profiles, training lengths, active duty service commitments and specialtypays used in the study.
HayGroup Page A-1

Center for Naval Analyses Comparison of Physician Total Compensation
Table A-7 also indicates promotion points to O-4, O-5 and O-6. There are noADSCs that would prohibit separation at any time following a promotion. Theseparations modeled in this study (following 7, 12 and 17 years of service) areunaffected by promotions.
Private Sector Physicians:
Private sector physicians are assumed to enter practice following completion ofresidency/specialty training. For total compensation purposes, private sectorphysicians are compared with Army and Air Force physicians having the samenumber of years of practice in the specialty.
For example, an Army or Air Force family practice physician with seven years ofcompleted service (one year of PG-1, two years of residency, and four years in astaff utilization tour) would be compared with a private sector family practicephysician with four completed years of practice.
In the case of fellowship training, the Army and Air Force physician would becompared with the private sector internal medicine specialist through completionof fellowship training, then with the appropriate subspecialty, for example,cardiology. In this example, the Army or Air Force physician one year out offellowship training would be compared with a private sector cardiologist with oneyear of practice.
Cash Compensation2
Army and Air Force Physicians:
Cash compensation for Army and Air Force physicians consists of RegularMilitary Compensation and incentive pays.
Regular Military Compensation (RMC). RMC is composed of Basic Pay, BasicAllowance for Housing, Basic Allowance for Subsistence, and the tax advantageaccruing to the non-taxable nature of housing and subsistence allowances.Basic pay represents approximately 66 percent of RMC for an O-3 andapproximately 75 percent of RMC for an O-6. The study was based on the 1 July2000 RMC table, shown in Table A-7 at the end of this Appendix for the gradeand year of service combinations in this study.
Incentive pays are Variable Special Pay (VSP), Additional Special Pay (ASP),Board Certification Pay (BCP), Incentive Special Pay (ISP) and Multi-yearSpecial Pay (MSP). Incentive pays are assumed to be paid in annual installmentsbased on specialty and year of service (as appropriate). Payments are at rates
The study did not consider the subsidization value for the Armed Forces Health ProfessionalScholarship Program, nor did it make compensation comparisons during the period of residencytraining.
HayGroup Page A-2

Center for Naval Analyses Comparison of Physician Total Compensation
effective 1 October 1999. Because future increases in incentive pays are subjectto legislation, the study assumes current payment levels remain unchanged.
Variable Special Pay (VSP). VSP varies by year of service. The paymentamounts are the same for each specialty we examined and are shown in TableA-7.
Additional Special Pay (ASP). ASP is $15,000 for each year earned. ASP is notpayable during periods of internship (PG-1) or initial residency training. ASP ispayable during periods of fellowship training if the physician treats patients aspart of the training regime. The study assumes ASP is payable during fellowshiptraining. Table A-7 shows the ASP payment schedules used in the study.
Board Certification Pay (BCP). BCP payments begin after successfullycompleting board certification examinations following residency training, and theamounts vary by year of service. The study assumes that internal medicine,pediatrics, and family practice physicians will pass board certification exams on aschedule that will permit them to receive BCP during their first year followingresidency. All other specialties are assumed to pass certification exams by theend of the second year following residency. Table A-7 at the end of theAppendix illustrates the payment schedules for each specialty.
Incentive Special Pay (ISP). ISP requires a one-year service contract. Paymentvaries by specialty and is assumed to begin the fiscal year following residencytraining. Payment amounts do not vary by year of service. The threesubspecialties receive ISP for internal medicine until completion of fellowshiptraining, then begin receiving the ISP for their subspecialty. ISP amounts arealso shown in Table A-7.
Multivear Special Pay (MSP). MSP is payable to Army and Air Force physicianssigning contracts for two, three or four years of additional service. Paymentamounts vary by specialty. To qualify, physicians must have either dischargedall ADSC's for training or completed at least eight years creditable service asdetermined by their Health Profession Pay Entry Date (HPPED). If a physicianqualifies to receive MSP after completing at least eight years creditable serviceas determined by their HPPED but has not completed all ADSC for training, atsome time prior to separation or retirement the physician may not receive MSPfor the number of years equivalent to the remaining period of obligated service.For example, if a urologist with a three-year ADSC for training begins receivingMSP after completing at least eight years of creditable service as determined bytheir HPPED, that physician would not be able to receive MSP during the three-year period immediately preceding separation or retirement. Table A-7illustrates the MSP payment schedules used in this study.
HayGroup Page A-3

Center for Naval Analyses Comparison of Physician Total Compensation
Private Sector Physicians:
Base, incentive and total salary data are taken from the Hay Group 1999Physicians' Total Compensation Survey. Survey data are effective as of mid-1999. We adjusted all data to 2000 by applying a 4.5 percent trend factor.
Participants in the Physician's survey included 91 healthcare organizations inone of three categories: 1) group practices (29 percent), 2) Health MaintenanceOrganizations (HMDs) (15 percent), and 3) hospital based facilities (56 percent).The data from these organizations represent over 22,300 physician incumbents.The list of participating organizations is provided in Appendix B. The followingtable illustrates several characteristics of the organizations.
Table A-1 : Characteristics of Participating Organizations
Category
Group PracticeHMOHospital SystemsHospitals/MedicalCenters
Median GrossRevenue(Millions)$107.1M$217.9M$679.4M$306.6M
Average Number ofEmployedPhysicians
251677187119
Average Number ofOperating/Staffed
BedsN/AN/A
1,132388
Compensation data used in the study is for employed staff physicians only.Physicians serving as executives, medical directors, or faculty are excluded.
Total salary is the sum of base salary, incentives and other compensation.Sixty-nine percent of the organizations have incentive or bonus plans, and 47percent of incumbents received an incentive or bonus payout. Details by type offacility are shown in Table A-2.
Table A-2: Prevalence and Payouts of Incentive Programs
Percentage Offering anIncentive Program
GroupPractice
74%HMO86%
Hospital-BasedFacility
59%
Total for allPhysicians
69%
Percentage of Physicians Receiving an IncentiveAll Physician SpecialtiesPrimary CareOther Specialties
36.5%47.3%30.1%
67.4%62.1%72.5%
23.2%19.9%25.7%
46.5%47.0%46.1%
Other compensation includes:
• Board fees• Partnership or other equity distribution• Profit sharing payout• Property distributionHayGroup Page A-4

Center for Naval Analyses Comparison of Physician Total Compensation
• On-call differential• Overtime• Hire-in bonus or other recruiting incentives• Distribution from owned ancillary services, and• Administrative differential.
Individual private sector compensation data are not separately identified bywhether the physician is board certified or a graduate of a U.S. medical school.These factors can affect total compensation levels. In some cases, surveyrespondents indicated the employer applied a salary differential for boardcertification, but specific amounts are not available. Most Army and Air Forcephysicians are eventually board certified and a majority are graduates of U.S.schools. Consequently, total private sector compensation data are shown for themedian (50th percentile3) and the 75th percentile4. We believe this presents areasonable range within which it is possible to make valid comparisons.
Annual base salary and total salary (including incentives and othercompensation) are provided for selected years of practice in Tables A-3 and A-4below.
3 The median value divides the data set in half. Half of the physicians have total annualcompensation above the median and half have total compensation below the median.4 Twenty-five percent of physicians have incomes above the 75th percentile, and 75 percent ofphysicians have income below the 75th percentile.
HayGroup Page A-5

Center for Naval Analyses Comparison of Physician Total Compensation
Table A-3: Annual Total Compensation (Median) - Private SectorPhysicians1 by Years of Practice in the Specialty/Subspecialty
Specialty/SubspecialtyAnesthesiologyCardiology (Invasive)DermatologyEmergency MedicineFamily PracticeGastroenterologyGeneral SurgeryHematology/OncologyInternal MedicineNeurologyNeurosurgeryObstetrics/GynecologyIndustrial & Occupational MedicineOphthalmologyOrthopedic SurgeryOtolaryngologyPathologyPediatric Primary CarePhysical Medicine & RehabilitationPlastic & Reconstructive SurgeryPsychiatryRadiology (Diagnostic)Radiology (Therapeutic)Urology
3 Years$207,108225,360175,715179,741131,813190,8101 84,742165,295140,254158,933339,225197,958151,784166,871237,571238,925163,339130,596153,2791 84,742140,349208,495215,493294,671
9 Years$215,854229,790186,144189,324135,453195,553201,687181,056149,631166,806329,781205,615152,446185,775251,621233,081175,733139,164155,170233,443148,685216,899226,664206,081
15 Years$224,600234,220196,574198,906139,094200,295218,632196,188159,009174,679320,337213,271153,108204,679265,671227,237188,126147,732157,060251 ,786157,021225,303238,697218,479
1. Source: 1999 Hay Physician's Compensation Survey. Salaries are trended to 1 July 2000.
HayGroup Page A-6

Center for Naval Analyses Comparison of Physician Total Compensation
Table A-4: Annual Total Compensation (75tn Percentile) - Private SectorPhysicians1 by Years of Practice in the Specialty/Subspecialty
Specialty/SubspecialtyAnesthesiologyCardiology (Invasive)DermatologyEmergency MedicineFamily PracticeGastroenterologyGeneral SurgeryHematology/OncologyInternal MedicineNeurologyNeurosurgeryObstetrics/GynecologyIndustrial & Occupational MedicineOphthalmologyOrthopedic SurgeryOtolaryngologyPathologyPediatric Primary CarePhysical Medicine & RehabilitationPlastic & Reconstructive SurgeryPsychiatryRadiology (Diagnostic)Radiology (Therapeutic)Urology
3 Years$227,501266,6551 90,374194320152,250218,866220,834187,658152,538177,096
9 Years$239,458268,139204,587208156159,505223,016239,079197,989165,151185,119
15 Years$251,414269,622218,826221,991166,759227,167255,324208,321177,765193,141
Insufficient data for reliable estimate of 75tn percentile219,973164,200204,861274,135245,670218,219138,835171,809222,834149,567259,589263,932217,403
229,593168,143222,182284,297262,042221 ,738156,251181,554314,229158,032262,022278,835229,856
239,214172,086239,503294,459278,415225,257173,668191,309324,257166,498264,455295,050243,350
1. Source: 1999 Hay Physician's Compensation Survey. Salaries are trended to 1 July 2000.
Benefits
Benefit categories for active service Army, Air Force and private sectorphysicians are shown in Table A-5. The Benefit Value Comparison (BVC)methodology described in Appendix C is used to calculate a value for eachbenefit category in Table A-5.
HayGroup Page A-7

Center for Naval Analyses Comparison of Physician Total Compensation
Table A-5: Army, Air Force and Private Sector Physician Benefit Categories(Active Service)
Benefit CategoryGroup LifeInsurance
Disability
Health Care
Pension Plan
CapitalAccumulation PlanHolidays/Vacation
Other Benefits
Statutory Benefits
Army and Air ForceServicemen's Group Life Insurance(SGLI)Veterans Group Life Insurance(VGLI)Dependency and IndemnityCompensation (DIG)Death GratuityBurial AllowanceSocial Security Death BenefitUnused Leave PaybackShort Term DisabilityLong Term Disability (Temporaryand Permanent DisabilityRetirement)Medical and Dental for Physicianand Family (MTF and Tricare)Military Retirement SystemSurvivor Benefit PlanNo military analogue currentlyavailableHolidaysLeaveCommissaryExchangeMorale, Welfare and Recreation(MWR)Personal legal servicesChild careUnemployment CompensationWorkmen's CompensationSocial Security
Private SectorBasic Group LifeSupplemental Group LifeDependent Group LifeBasic Accidental DeathBusiness Travel Insurance
Short Term DisabilityLong Term Disability
Health Care Insurance (Medical,Dental, Vision)Defined Benefit Pension Plan
401 (k) or 403(b) plans
HolidaysVacationsFlexible Benefits Programs
Unemployment CompensationWorkmen's CompensationSocial Security
All Army and Air Force physicians are assumed to retire under the militaryretirement system that bases payments on the average of the highest three yearsof basic pay (High-3 system). Currently serving physicians who are at or nearthe 7 and 12 year of service points entered military service following enactmentof the Military Retirement Reform Act of 1996 and are covered by that system(REDUX). However, the FY2000 National Defense Authorization Act authorizedall REDUX participants the opportunity to transfer to the High-3 system at theirfifteen year of service points. The study assumes that all physicians will transferto the High-3 system.
Military benefits for retired Army and Air Force physicians working in the privatesector include military retirement and the survivor benefit plan. The study doesnot include the value of several benefits under the presumption that they would
HayGroup Page A-8

Center for Naval Analyses Comparison of Physician Total Compensation
not be used. These include retiree medical care, commissary and exchange,MWR, childcare, and use of installation legal services.
Benefits for retired private sector physicians include pension and capitalaccumulation plans, survivor benefit plans, and retiree health coverage.
HayGroup Page A-9

Center for Naval Analyses
Anesthesioloav
CurrentEnd YOS Age Grade*
1 26 O-32 273 284 295 3067891011121314151617181920
31 O-4323334353637 O-5383940414243 O-64445
Tab
Type ofMilitary
Service** ADSC***
PG-1IRIRIRSUSUSUSUSUSUSUSUSUSUSUSUSUSUSUSU
44443210
X
X
X
le A-7 (USA/USX
RMC
$46,115.52$46,115.52$49,360.81$52,104.01$55,128.01$55,128.01$63,312.76$63,312.76$65,565.16$65,565.16$69,295.30$69,295.30$77,636.70$77,636.70$81,944.86$81,944.86$86,077.62$86,077.62$97,489.60$97,489.60
Comparison of Physician Total Compensation*F)
VSP
$1,200$5,000$5,000$5,000$5,000
$12,000$12,000$11,500$11,500$11,000$11,000$10,000$10,000
$9,000$9,000$9,000$9,000$8,000$8,000$8,000
ASP
$0$0$0$0
$15,000$15,000$15,000$15,000$15,000$15,000$15,000$15,000$15,000$15,000$15,000$15,000$15,000$15,000$15,000$15,000
BCP
$0$0$0$0$0$0
$2,500$2,500$2,500$3,500$3,500$4,000$4,000$5,000$5,000$5,000$5,000$6,000$6,000$6,000
ISP
$0$0$0$0
$29,000$29,000$29,000$29,000$29,000$29,000$29,000$29,000$29,000$29,000$29,000$29,000$29,000$29,000$29,000$29,000
MSP****
$0$0$0$0$0$0$0$0
$8,000$8,000$8,000$8,000$8,000$8,000$8,000$8,000$8,000$8,000$8,000$8,000
* Promotion to O-4 occurs at end of YOS 6; to O-5 at end of YOS 12; to O-6 at end of YOS 18** Use this key to indicate the type of service for each year
PG-1 InternshipIR In-Service Residency TrainingFT In-Service Fellowship TrainingSU Staff Utilization Tour - Practicing as specialistFP Practicing as fellow
*** Active Duty Service Commitment at the end of the current year of service; maximum of HPSP or IR+FT; x = separation point of interest in study**** MSP amounts reflect combinations of contract lengths that would result in a contract expiration at end of 20 YOS;
Zero amounts occur for N years prior to retirement if physician signed MSP contract while having an N year ADSC for training
HayGroup PageA-10

Center for Naval Analyses
Cardiology (Invasive!Table A-7 (USA/USAF)
Comparison of Physician Total Compensation
CurrentEnd YOS
1234567891011121314151617181920
Age
2627282930313233343536373839404142434445
Type ofMilitary
Service** ADSC*
O-3
O-4
0-5
O-6
PG-1IRIRFTFTFTFPFPFPFPFPFPFPFPFPFPFPFPFPFP
44455543210X
X
X
RMC
$46,115.52$46,115.52$49,360.81$52,104.01$55,128.01$55,128.01$63,312.76$63,312.76$65,565.16$65,565.16$69,295.30$69,295.30$77,636.70$77,636.70$81,944.86$81,944.86$86,077.62$86,077.62$97,489.60$97,489.60
VSP
$1,200$5,000$5,000$5,000$5,000
$12,000$12,000$11,500$11,500$11,000$11,000$10,000$10,000
$9,000$9,000$9,000$9,000$8,000$8,000$8,000
ASP
$0$0$0
$15,000$15,000$15,000$15,000$15,000$15,000$15,000$15,000$15,000$15,000$15,000$15,000$15,000$15,000$15,000$15,000$15,000
BCP
$0$0$0$0$0
$2,500$2,500$2,500$2,500$3,500$3,500$4,000$4,000$5,000$5,000$5,000$5,000$6,000$6,000$6,000
ISP
$0$0$0
$13,000$13,000$13,000$36,000$36,000$36,000$36,000$36,000$36,000$36,000$36,000$36,000$36,000$36,000$36,000$36,000$36,000
$0$0$0$0$0$0$0$0
$8,000$8,000$8,000$8,000$8,000$8,000$8,000$8,000$8,000
$0$0$0
* Promotion to O-4 occurs at end of YOS 6; to 0-5 at end of YOS 12; to 0-6 at end of YOS 18** Use this key to indicate the type of service for each year
PG-1 InternshipIR In-Service Residency TrainingFT In-Service Fellowship TrainingSU Staff Utilization Tour - Practicing as specialistFP Practicing as fellow
*** Active Duty Service Commitment at the end of the current year of service; maximum of HPSP or IR+FT; x = separation point of interest in study**** MSP amounts reflect combinations of contract lengths that would result in a contract expiration at end of 20 YOS;
Zero amounts occur for N years prior to retirement if physician signed MSP contract while having an N year ADSC for training
HayGroup Page A-11

Center for Naval Analyses
Dermatology
CurrentEnd YOS
1234567891011121314151617181920
Age Grade*
26 O-32728293031 O-4323334353637 0-5383940414243 O-64445
Tab
Type ofMilitary
Service** ADSC***
PG-1IRIRIRSUSUSUSUSUSUSUSUSUSUSUSUSUSUSUSU
44443210
X
X
X
le A-7 (USA/US^
RMC
$46,115.52$46,115.52$49,360.81$52,104.01$55,128.01$55,128.01$63,312.76$63,312.76$65,565.16$65,565.16$69,295.30$69,295.30$77,636.70$77,636.70$81,944.86$81,944.86$86,077.62$86,077.62$97,489.60$97,489.60
Comparison of Physician Total Compensation^F)
VSP
$1,200$5,000$5,000$5,000$5,000
$12,000$12,000$11,500$11,500$11,000$11,000$10,000$10,000
$9,000$9,000$9,000$9,000$8,000$8,000$8,000
ASP
$0$0$0$0
$15,000$15,000$15,000$15,000$15,000$15,000$15,000$15,000$15,000$15,000$15,000$15,000$15,000$15,000$15,000$15,000
BCP
$0$0$0$0$0$0
$2,500$2,500$2,500$3,500$3,500$4,000$4,000$5,000$5,000$5,000$5,000$6,000$6,000$6,000
ISP
$0$0$0$0
$14,000$14,000$14,000$14,000$14,000$14,000$14,000$14,000$14,000$14,000$14,000$14,000$14,000$14,000$14,000$14,000
MSP****
$0$0$0$0$0$0$0$0
$8,000$8,000$8,000$8,000$8,000$8,000$8,000$8,000$8,000$8,000$8,000$8,000
* Promotion to O-4 occurs at end of YOS 6; to 0-5 at end of YOS 12; to O-6 at end of YOS 18** Use this key to indicate the type of service for each year
PG-1 InternshipIR In-Service Residency TrainingFT In-Service Fellowship TrainingSU Staff Utilization Tour - Practicing as specialistFP Practicing as fellow
*** Active Duty Service Commitment at the end of the current year of service; maximum of HPSP or IR+FT; x = separation point of interest in study**** MSP amounts reflect combinations of contract lengths that would result in a contract expiration at end of 20 YOS;
Zero amounts occur for N years prior to retirement if physician signed MSP contract while having an N year ADSC for training
HayGroup Page A-12

Center for Naval Analyses
Emergency
CurrentEnd YOS
1234567891011121314151617181920
Medicine
26 O-32728293031 O-4323334353637 O-5383940414243 0-64445
Tab
Type ofMilitary
Service** ADSC***
PG-1IRIRIRSUSUSUSUSUSUSUSUSUSUSUSUSUSUSUSU
44443210
X
X
X
le A-7 (USA/US/
RMC
$46,115.52$46,115.52$49,360.81$52,104.01$55,128.01$55,128.01$63,312.76$63,312.76$65,565.16$65,565.16$69,295.30$69,295.30$77,636.70$77,636.70$81,944.86$81,944.86$86,077.62$86,077.62$97,489.60$97,489.60
Comparison of Physician Total Compensation^F)
VSP
$1,200$5,000$5,000$5,000$5,000
$12,000$12,000$11,500$11,500$11,000$11,000$10,000$10,000$9,000$9,000$9,000$9,000$8,000$8,000$8,000
ASP
$0$0$0$0
$15,000$15,000$15,000$15,000$15,000$15,000$15,000$15,000$15,000$15,000$15,000$15,000$15,000$15,000$15,000$15,000
BCP
$0$0$0$0$0$0
$2,500$2,500$2,500$3,500$3,500$4,000$4,000$5,000$5,000$5,000$5,000$6,000$6,000$6,000
ISP
$0$0$0$0
$22,000$22,000$22,000$22,000$22,000$22,000$22,000$22,000$22,000$22,000$22,000$22,000$22,000$22,000$22,000$22,000
MSP****
$0$0$0$0$0$0$0$0
$8,000$8,000$8,000$8,000$8,000$8,000$8,000$8,000$8,000$8,000$8,000$8,000
Promotion to O-4 occurs at end of YOS 6; to 0-5 at end of YOS 12; to 0-6 at end of YOS 18* Use this key to indicate the type of service for each year
PG-1 InternshipIR In-Service Residency TrainingFT In-Service Fellowship TrainingSU Staff Utilization Tour - Practicing as specialistFP Practicing as fellow
** Active Duty Service Commitment at the end of the current year of service; maximum of HPSP or IR+FT; x = separation point of interest in study*** MSP amounts reflect combinations of contract lengths that would result in a contract expiration at end of 20 YOS;
Zero amounts occur for N years prior to retirement if physician signed MSP contract while having an N year ADSC for training
HayGroup PageA-13

Center for Naval Analyses
Family Practice
CurrentEnd YOS Age Grade*
1234567891011121314151617181920
26 O-32728293031 0-4323334353637 O-5383940414243 O-64445
Tab
Type ofMilitary
Service** ADSC***
PG-1IRIRSUSUSUSUSUSUSUSUSUSUSUSUSUSUSUSUSU
444321
0(x)
X
X
X
le A-7 (USA/US/
RMC
$46,115.52$46,115.52$49,360.81$52,104.01$55,128.01$55,128.01$63,312.76$63,312.76$65,565.16$65,565.16$69,295.30$69,295.30$77,636.70$77,636.70$81,944.86$81,944.86$86,077.62$86,077.62$97,489.60$97,489.60
Comparison of Physician Total Compensation^F)
VSP
$1,200$5,000$5,000$5,000$5,000
$12,000$12,000$11,500$11,500$11,000$11,000$10,000$10,000$9,000$9,000$9,000$9,000$8,000$8,000$8,000
ASP
$0$0$0
$15,000$15,000$15,000$15,000$15,000$15,000$15,000$15,000$15,000$15,000$15,000$15,000$15,000$15,000$15,000$15,000$15,000
BCP
$0$0$0
$2,500$2,500$2,500$2,500$2,500$2,500$3,500$3,500$4,000$4,000$5,000$5,000$5,000$5,000$6,000$6,000$6,000
ISP
$0$0$0
$13,000$13,000$13,000$13,000$13,000$13,000$13,000$13,000$13,000$13,000$13,000$13,000$13,000$13,000$13,000$13,000$13,000
MSP****
$0$0$0$0$0$0$0
$14,000$14,000$14,000$14,000$14,000$14,000$14,000$14,000$14,000$14,000$14,000$14,000$14,000
* Promotion to 0-4 occurs at end of YOS 6; to 0-5 at end of YOS 12; to O-6 at end of YOS 18** Use this key to indicate the type of service for each year
PG-1 InternshipIR In-Service Residency TrainingFT In-Service Fellowship TrainingSU Staff Utilization Tour - Practicing as specialistFP Practicing as fellow
*** Active Duty Service Commitment at the end of the current year of service; maximum of HPSP or IR+FT; x = separation point of interest in study**** MSP amounts reflect combinations of contract lengths that would result in a contract expiration at end of 20 YOS;
Zero amounts occur for N years prior to retirement if physician signed MSP contract while having an N year ADSC for training
HayGroup PageA-14

Center for Naval Analyses
Gastroenterology
CurrentEnd YOS Age Grade*
1234567891011121314151617181920
26 O-32728293031 O-4323334353637 0-5383940414243 0-64445
Type ofMilitary
Service**
PG-1IRIRFTFTFTFPFPFPFPFPFPFPFPFPFPFPFPFPFP
Tab
ADSC***
44455543210X
X
X
le A-7 (USA
RMC
$46,115$46,115$49,360$52,104$55,128$55,128$63,312$63,312$65,565$65,565$69,295$69,295$77,636$77,636$81,944$81,944$86,077$86,077$97,489$97,489
/us;
5252810101017676161630307070868662626060
Comparison of Physician Total CompensationVF)
VSP
$1,200$5,000$5,000$5,000$5,000
$12,000$12,000$11,500$11,500$11,000$11,000$10,000$10,000$9,000$9,000$9,000$9,000$8,000$8,000$8,000
ASP
$0$0$0
$15,000$15,000$15,000$15,000$15,000$15,000$15,000$15,000$15,000$15,000$15,000$15,000$15,000$15,000$15,000$15,000$15,000
BCP
$0$0$0$0$0
$2,500$2,500$2,500$2,500$3,500$3,500$4,000$4,000$5,000$5,000$5,000$5,000$6,000$6,000$6,000
ISP
$0$0$0
$13,000$13,000$13,000$23,000$23,000$23,000$23,000$23,000$23,000$23,000$23,000$23,000$23,000$23,000$23,000$23,000$23,000
MSP****
$0$0$0$0$0$0$0$0
$8,000$8,000$8,000$8,000$8,000$8,000$8,000$8,000$8,000
$0$0$0
* Promotion to O-4 occurs at end of YOS 6; to 0-5 at end of YOS 12; to O-6 at end of YOS 18** Use this key to indicate the type of service for each year
PG-1 InternshipIR In-Service Residency TrainingFT In-Service Fellowship TrainingSU Staff Utilization Tour - Practicing as specialistFP Practicing as fellow
*** Active Duty Service Commitment at the end of the current year of service; maximum of HPSP or IR+FT; x = separation point of interest in study**** MSP amounts reflect combinations of contract lengths that would result in a contract expiration at end of 20 YOS;
Zero amounts occur for N years prior to retirement if physician signed MSP contract while having an N year ADSC for training
HayGroup PageA-15

Center for Naval Analyses Comparison of Physician Total Compensation
General Surgery
CurrentEnd YQS Age Grade*
1 26 0-3234567891011121314151617181920
2728293031 O-4323334353637 0-5383940414243 0-64445
Table A-7 (USA/USAF)
Type ofMilitary
Service** ADSC*** RMC VSP ASP BCP ISP MSP****
PG-1IRIRIRIRSUSUSUSUSUSUSUSUSUSUSUSUSUSUSU
444443210
X
X
X
$46,115.52 $1,200 $0 $0 $0 $0$46,115.52 $5,000 $0 $0 $0 $0$49,360.81 $5,000 $0 $0 $0 $0$52,104.01 $5,000 $0 $0 $0 $0$55,128.01 $5,000 $0 $0 $0 $0$55,128.01 $12,000 $15,000 $0 $26,000 $0$63,312.76 $12,000 $15,000 $0 $26,000 $0$63,312.76 $11,500 $15,000 $2,500 $26,000 $0$65,565.16 $11,500 $15,000 $2,500 $26,000 $14,000$65,565.16 $11,000 $15,000 $3,500 $26,000 $14,000$69,295.30 $11,000 $15,000 $3,500 $26,000 $14,000$69,295.30 $10,000 $15,000 $4,000 $26,000 $14,000$77,636.70 $10,000 $15,000 $4,000 $26,000 $14,000$77,636.70 $9,000 $15,000 $5,000 $26,000 $14,000$81,944.86 $9,000 $15,000 $5,000 $26,000 $14,000$81,944.86 $9,000 $15,000 $5,000 $26,000 $14,000$86,077.62 $9,000 $15,000 $5,000 $26,000 $14,000$86,077.62 $8,000 $15,000 $6,000 $26,000 $14,000$97,489.60 $8,000 $15,000 $6,000 $26,000 $14,000$97,489.60 $8,000 $15,000 $6,000 $26,000 $0
: Promotion to O-4 occurs at end of YOS 6; to O-5 at end of YOS 12; to O-6 at end of YOS 18:* Use this key to indicate the type of service for each year
PG-1 InternshipIR In-Service Residency TrainingFT In-Service Fellowship TrainingSU Staff Utilization Tour - Practicing as specialistFP Practicing as fellow
** Active Duty Service Commitment at the end of the current year of service; maximum of HPSP or IR+FT; x = separation point of interest in study*** MSP amounts reflect combinations of contract lengths that would result in a contract expiration at end of 20 YOS;
Zero amounts occur for N years prior to retirement if physician signed MSP contract while having an N year ADSC for training
HayGroup Page A-16

Center for Naval Analyses
Hematoloqy/Oncology
CurrentEnd YOS Age Grade*
1 26 O-3234567891011121314151617181920
2728293031 O-4323334353637 O-5383940414243 0-64445
Tab
Type ofMilitary
Service** ADSC***
PG-1IRIRFTFTFTFPFPFPFPFPFPFPFPFPFPFPFPFPFP
44455543210X
X
X
le A-7 (USA
RMC
$46,115$46,115$49,360$52,104$55,128$55,128$63,312$63,312$65,565$65,565$69,295$69,295$77,636$77,636$81,944$81,944$86,077$86,077$97,489$97,489
/US/
5252810101017676161630307070868662626060
Comparison of Physician Total CompensationVF)
VSP
$1,200$5,000$5,000$5,000$5,000
$12,000$12,000$11,500$11,500$11,000$11,000$10,000$10,000$9,000$9,000$9,000$9,000$8,000$8,000$8,000
ASP
$0$0$0
$15,000$15,000$15,000$15,000$15,000$15,000$15,000$15,000$15,000$15,000$15,000$15,000$15,000$15,000$15,000$15,000$15,000
BCP
$0$0$0$0$0
$2,500$2,500$2,500$2,500$3,500$3,500$4,000$4,000$5,000$5,000$5,000$5,000$6,000$6,000$6,000
ISP
$0$0$0
$13,000$13,000$13,000$14,000$14,000$14,000$14,000$14,000$14,000$14,000$14,000$14,000$14,000$14,000$14,000$14,000$14,000
MSP****
$0$0$0$0$0$0$0$0
$8,000$8,000$8,000$8,000$8,000$8,000$8,000$8,000$8,000
$0$0$0
* Promotion to O-4 occurs at end of YOS 6; to O-5 at end of YOS 12; to O-6 at end of YOS 18** Use this key to indicate the type of service for each year
PG-1 InternshipIR In-Service Residency TrainingFT In-Service Fellowship TrainingSU Staff Utilization Tour - Practicing as specialistFP Practicing as fellow
*** Active Duty Service Commitment at the end of the current year of service; maximum of HPSP or IR+FT; x = separation point of interest in study**** MSP amounts reflect combinations of contract lengths that would result in a contract expiration at end of 20 YOS;
Zero amounts occur for N years prior to retirement if physician signed MSP contract while having an N year ADSC for training
HayGroup PageA-17

Center for Naval Analyses
Internal Medicine
CurrentEnd YOS Age Grade*
1234567891011121314151617181920
26 O-32728293031 O-4323334353637 O-5383940414243 O-64445
Comparison of Physician Total CompensationTable A-7 (USA/USAF)
Type ofMilitary
Service** ADSC*** RMC VSP
PG-1IRIRSUSUSUSUSUSUSUSUSUSUSUSUSUSUSUSUSU
444321
0(x)
X
X
X
$46,115$46,115$49,360$52,104$55,128$55,128
525281010101
$63,312.76$63,312.76$65,565$65,565$69,295$69,295$77,636$77,636$81,944$81,944$86,077$86,077$97,489$97,489
161630307070868662626060
$1,200$5,000$5,000$5,000$5,000
$12,000$12,000$11,500$11,500$11,000$11,000$10,000$10,000
$9,000$9,000$9,000$9,000$8,000$8,000$8,000
ASP
$0$0$0
$15,000$15,000$15,000$15,000$15,000$15,000$15,000$15,000$15,000$15,000$15,000$15,000$15,000$15,000$15,000$15,000$15,000
BCP
$0$0$0
$2,500$2,500$2,500$2,500$2,500$2,500$3,500$3,500$4,000$4,000$5,000$5,000$5,000$5,000$6,000$6,000$6,000
ISP
$0$0$0
$13,000$13,000$13,000$13,000$13,000$13,000$13,000$13,000$13,000$13,000$13,000$13,000$13,000$13,000$13,000$13,000$13,000
MSP****
$0$0$0$0$0$0$0
$8,000$8,000$8,000$8,000$8,000$8,000$8,000$8,000$8,000$8,000$8,000$8,000$8,000
* Promotion to O-4 occurs at end of YOS 6; to O-5 at end of YOS 12; to O-6 at end of YOS 18** Use this key to indicate the type of service for each year
PG-1 InternshipIR In-Service Residency TrainingFT In-Service Fellowship TrainingSU Staff Utilization Tour - Practicing as specialistFP Practicing as fellow
*** Active Duty Service Commitment at the end of the current year of sen/ice; maximum of HPSP or IR+FT; x = separation point of interest in study**** MSP amounts reflect combinations of contract lengths that would result in a contract expiration at end of 20 YOS;
Zero amounts occur for N years prior to retirement if physician signed MSP contract while having an N year ADSC for training
HayGroup PageA-18

Center for Naval Analyses
NeurologyTable A-7 (USA/USAF)
Comparison of Physician Total Compensation
CurrentEnd YOS
1234567891011121314151617181920
Age
2627282930313233343536373839404142434445
Grade*
O-3
Type ofMilitaryService** ADSC*
0-4
O-5
O-6
PG-1IRIRIRSUSUSUSUSUSUSUSUSUSUSUSUSUSUSUSU
44443210
X
X
X
RMC
$46,115.52$46,115.52$49,360.81$52,104.01$55,128.01$55,128.01$63,312.76$63,312.76$65,565.16$65,565.16$69,295.30$69,295.30$77,636.70$77,636.70$81,944.86$81,944.86$86,077.62$86,077.62$97,489.60$97,489.60
VSP
$1,200$5,000$5,000$5,000$5,000$12,000$12,000$11,500$11,500$11,000$11,000$10,000$10,000$9,000$9,000$9,000$9,000$8,000$8,000$8,000
ASP
$0$0$0$0
$15,000$15,000$15,000$15,000$15,000$15,000$15,000$15,000$15,000$15,000$15,000$15,000$15,000$15,000$15,000$15,000
BCP
$0$0$0$0$0$0
$2,500$2,500$2,500$3,500$3,500$4,000$4,000$5,000$5,000$5,000$5,000$6,000$6,000$6,000
ISP
$0$0$0$0
$13,000$13,000$13,000$13,000$13,000$13,000$13,000$13,000$13,000$13,000$13,000$13,000$13,000$13,000$13,000$13,000
MSP
$0$0$0$0$0$0$0$0
$8,000$8,000$8,000$8,000$8,000$8,000$8,000$8,000$8,000$8,000$8,000$8,000
* Promotion to O-4 occurs at end of YOS 6; to 0-5 at end of YOS 12; to O-6 at end of YOS 18** Use this key to indicate the type of service for each year
PG-1 InternshipIR In-Service Residency TrainingFT In-Service Fellowship TrainingSU Staff Utilization Tour - Practicing as specialistFP Practicing as fellow
*** Active Duty Service Commitment at the end of the current year of service; maximum of HPSP or IR+FT; x = separation point of interest in study**** MSP amounts reflect combinations of contract lengths that would result in a contract expiration at end of 20 YOS;
Zero amounts occur for N years prior to retirement if physician signed MSP contract while having an N year ADSC for training
HayGroup PageA-19

Center for Naval Analyses
Neurosurgery
CurrentEnd YOS Age Grade*
1234567891011121314151617181920
26 O-32728293031 O-4323334353637 O-5383940414243 O-64445
1
Type ofMilitary
Service** ADSC***
PG-1IRIRIRIRIRIRSUSUSUSUSUSUSUSUSUSUSUSUSU
4666666543210
X
X
"able A-7 (Army)
RMC
$46,115.52$46,115.52$49,360.81$52,104.01$55,128.01$55,128.01$63,312.76$63,312.76$65,565.16$65,565.16$69,295.30$69,295.30$77,636.70$77,636.70$81,944.86$81,944.86$86,077.62$86,077.62$97,489.60$97,489.60
Comparison of Physician Total Compensation
VSP
$1,200$5,000$5,000$5,000$5,000
$12,000$12,000$11,500$11,500$11,000$11,000$10,000$10,000
$9,000$9,000$9,000$9,000$8,000$8,000$8,000
ASP
$0$0$0$0$0$0$0
$15,000$15,000$15,000$15,000$15,000$15,000$15,000$15,000$15,000$15,000$15,000$15,000$15,000
BCP
$0$0$0$0$0$0$0$0$0
$3,500$3,500$4,000$4,000$5,000$5,000$5,000$5,000$6,000$6,000$6,000
ISP
$0$0$0$0$0$0$0
$36,000$36,000$36,000$36,000$36,000$36,000$36,000$36,000$36,000$36,000$36,000$36,000$36,000
MSP****
$0$0$0$0$0$0$0$0
$10,000$10,000$10,000$10,000$10,000$10,000$10,000
$0$0$0$0$0
* Promotion to 0-4 occurs at end of YOS 6; to O-5 at end of YOS 12; to O-6 at end of YOS 18** Use this key to indicate the type of service for each year
PG-1 InternshipIR In-Service Residency TrainingFT In-Service Fellowship TrainingSU Staff Utilization Tour - Practicing as specialistFP Practicing as fellow
*** Active Duty Service Commitment at the end of the current year of service; maximum of HPSP or IR+FT; x - separation point of interest in study**** MSP amounts reflect combinations of contract lengths that would result in a contract expiration at end of 20 YOS;
Zero amounts occur for N years prior to retirement if physician signed MSP contract while having an N year ADSC for training
HayGroup Page A-20

Center for Naval Analyses
Neurosuraerv
Comparison of Physician Total CompensationTable A-7 (Air Force)
CurrentEnd YOS
1234567891011121314151617181920
Age
2627282930313233343536373839404142434445
Grade*
O-3
Type ofMilitary
Service** ADSC*
0-4
O-5
O-6
PG-1IRIRIRIRIRSUSUSUSUSUSUSUSUSUSUSUSUSUSU
45555543210X
X
X
RMC
$46,115.52$46,115.52$49,360.81$52,104.01$55,128.01$55,128.01$63,312.76$63,312.76$65,565.16$65,565.16$69,295.30$69,295.30$77,636.70$77,636.70$81,944.86$81,944.86$86,077.62$86,077.62$97,489.60$97,489.60
VSP
$1,200$5,000$5,000$5,000$5,000
$12,000$12,000$11,500$11,500$11,000$11,000$10,000$10,000$9,000$9,000$9,000$9,000$8,000$8,000$8,000
ASP
$0$0$0$0$0$0
$15,000$15,000$15,000$15,000$15,000$15,000$15,000$15,000$15,000$15,000$15,000$15,000$15,000$15,000
YOS 18
BCP
$0$0$0$0$0$0$0$0
$2,500$3,500$3,500$4,000$4,000$5,000$5,000$5,000$5,000$6,000$6,000$6,000
ISP
$0$0$0$0$0$0
$36,000$36,000$36,000$36,000$36,000$36,000$36,000$36,000$36,000$36,000$36,000$36,000$36,000$36,000
MSP****
$0$0$0$0$0$0$0$0
$10,000$10,000$10,000$10,000$10,000$10,000$10,000$10,000$10,000
$0$0$0
* Promotion to O-4 occurs at end of YOS 6; to O-5 at end of YOS 12; to O-6 at end of** Use this key to indicate the type of service for each year
PG-1 InternshipIR In-Service Residency TrainingFT In-Service Fellowship TrainingSU Staff Utilization Tour - Practicing as specialistFP Practicing as fellow
*** Active Duty Service Commitment at the end of the current year of service; maximum of HPSP or IR+FT; x = separation point of interest in study**** MSP amounts reflect combinations of contract lengths that would result in a contract expiration at end of 20 YOS;
Zero amounts occur for N years prior to retirement if physician signed MSP contract while having an N year ADSC for training
HayGroup Page A-21

Center for Naval Analyses
Obstetrics/Gvnecology
CurrentEnd YOS Age Grade*
1234567891011121314151617181920
26 0-32728293031 O-4323334353637 O-5383940414243 O-64445
Tab
Type ofMilitary
Service** ADSC***
PG-1IRIRIRSUSUSUSUSUSUSUSUSUSUSUSUSUSUSUSU
44443210
X
X
X
le A-7 (USA/US/
RMC
$46,115.52$46,115.52$49,360.81$52,104.01$55,128.01$55,128.01$63,312.76$63,312.76$65,565.16$65,565.16$69,295.30$69,295.30$77,636.70$77,636.70$81,944.86$81,944.86$86,077.62$86,077.62$97,489.60$97,489.60
Comparison of Physician Total Compensation^F)
VSP
$1,200$5,000$5,000$5,000$5,000
$12,000$12,000$11,500$11,500$11,000$11,000$10,000$10,000
$9,000$9,000$9,000$9,000$8,000$8,000$8,000
ASP
$0$0$0$0
$15,000$15,000$15,000$15,000$15,000$15,000$15,000$15,000$15,000$15,000$15,000$15,000$15,000$15,000$15,000$15,000
BCP
$0$0$0$0$0$0
$2,500$2,500$2,500$3,500$3,500$4,000$4,000$5,000$5,000$5,000$5,000$6,000$6,000$6,000
ISP
$0$0$0$0
$31,000$31,000$31,000$31,000$31,000$31,000$31,000$31,000$31,000$31,000$31,000$31,000$31,000$31,000$31,000$31,000
MSP****
$0$0$0$0$0$0$0$0
$8,000$8,000$8,000$8,000$8,000$8,000$8,000$8,000$8,000$8,000$8,000$8,000
Promotion to O-4 occurs at end of YOS 6; to 0-5 at end of YOS 12; to O-6 at end of YOS 18* Use this key to indicate the type of service for each year
PG-1 InternshipIR In-Service Residency TrainingFT In-Service Fellowship TrainingSU Staff Utilization Tour - Practicing as specialistFP Practicing as fellow
** Active Duty Service Commitment at the end of the current year of service; maximum of HPSP or IR+FT; x = separation point of interest in study*** MSP amounts reflect combinations of contract lengths that would result in a contract expiration at end of 20 YOS;
Zero amounts occur for N years prior to retirement if physician signed MSP contract while having an N year ADSC for training
HayGroup Page A-22

Center for Naval Analyses
Industrial/0
CurrentEnd YOS
1234567891011121314151617181920
ccupational Medicin
Age Grade*
26 O-32728293031 O-4323334353637 O-5383940414243 O-64445
Tabe
Type ofMilitary
Service** ADSC***
PG-1IRIRSUSUSUSUSUSUSUSUSUSUSUSUSUSUSUSUSU
444321
0(x)
X
X
X
le A-7 (USA/US/
RMC
$46,115.52$46,115.52$49,360.81$52,104.01$55,128.01$55,128.01$63,312.76$63,312.76$65,565.16$65,565.16$69,295.30$69,295.30$77,636.70$77,636.70$81,944.86$81,944.86$86,077.62$86,077.62$97,489.60$97,489.60
Comparison of Physician Total Compensation^F)
VSP
$1,200$5,000$5,000$5,000$5,000
$12,000$12,000$11,500$11,500$11,000$11,000$10,000$10,000
$9,000$9,000$9,000$9,000$8,000$8,000$8,000
ASP
$0$0$0
$15,000$15,000$15,000$15,000$15,000$15,000$15,000$15,000$15,000$15,000$15,000$15,000$15,000$15,000$15,000$15,000$15,000
BCP
$0$0$0$0$0
$2,500$2,500$2,500$2,500$3,500$3,500$4,000$4,000$5,000$5,000$5,000$5,000$6,000$6,000$6,000
ISP
$0$0$0
$11,000$11,000$11,000$11,000$11,000$11,000$11,000$11,000$11,000$11,000$11,000$11,000$11,000$11,000$11,000$11,000$11,000
MSP****
$0$0$0$0$0$0$0
$10,000$10,000$10,000$10,000$10,000$10,000$10,000$10,000$10,000$10,000$10,000$10,000$10,000
* Promotion to O-4 occurs at end of YOS 6; to 0-5 at end of YOS 12; to 0-6 at end of YOS 18** Use this key to indicate the type of service for each year
PG-1 InternshipIR In-Service Residency TrainingFT In-Service Fellowship TrainingSU Staff Utilization Tour - Practicing as specialistFP Practicing as fellow
*** Active Duty Service Commitment at the end of the current year of service; maximum of HPSP or IR+FT; x = separation point of interest in study**** MSP amounts reflect combinations of contract lengths that would result in a contract expiration at end of 20 YOS;
Zero amounts occur for N years prior to retirement if physician signed MSP contract while having an N year ADSC for training
HayGroup Page A-23

Center for Naval Analyses
Ophthalmology
Comparison of Physician Total CompensationTable A-7 (USA/USAF)
CurrentEnd YOS
1234567891011121314151617181920
Age
2627282930313233343536373839404142434445
Type ofMilitary
Service** ADSC*
0-3
0-4
0-5
O-6
PG-1IRIRIRSUSUSUSUSUSUSUSUSUSUSUSUSUSUSUSU
44443210
X
X
X
RMC
$46,115.52$46,115.52$49,360.81$52,104.01$55,128.01$55,128.01$63,312.76$63,312.76$65,565.16$65,565.16$69,295.30$69,295.30$77,636.70$77,636.70$81,944.86$81,944.86$86,077.62$86,077.62$97,489.60$97,489.60
VSP
$1,200$5,000$5,000$5,000$5,000
$12,000$12,000$11,500$11,500$11,000$11,000$10,000$10,000
$9,000$9,000$9,000$9,000$8,000$8,000$8,000
ASP
$0$0$0$0
$15,000$15,000$15,000$15,000$15,000$15,000$15,000$15,000$15,000$15,000$15,000$15,000$15,000$15,000$15,000$15,000
YOS 18
$0$0$0$0$0$0
$2,500$2,500$2,500$3,500$3,500$4,000$4,000$5,000$5,000$5,000$5,000$6,000$6,000$6,000
ISP
$0$0$0$0
$28,000$28,000$28,000$28,000$28,000$28,000$28,000$28,000$28,000$28,000$28,000$28,000$28,000$28,000$28,000$28,000
MSP*
$0$0$0$0$0$0$0$0$0$0$0$0$0$0$0$0$0$0$0$0
* Promotion to O-4 occurs at end of YOS 6; to 0-5 at end of YOS 12; to 0-6 at end of** Use this key to indicate the type of service for each year
PG-1 InternshipIR In-Service Residency TrainingFT In-Service Fellowship TrainingSU Staff Utilization Tour - Practicing as specialistFP Practicing as fellow
*** Active Duty Service Commitment at the end of the current year of service; maximum of HPSP or IR+FT; x = separation point of interest in study**** MSP amounts reflect combinations of contract lengths that would result in a contract expiration at end of 20 YOS;
Zero amounts occur for N years prior to retirement if physician signed MSP contract while having an N year ADSC for training
HayGroup Page A-24

Center for Naval Analyses
Orthopedic
CurrentEnd YOS
1234567891011121314151617181920
Surgery
Age Grade*
26 O-32728293031 O-4323334353637 O-5383940414243 0-64445
Tab
Type ofMilitary
Service** ADSC***
PG-1IRIRIRIRSUSUSUSUSUSUSUSUSUSUSUSUSUSUSU
444443210
X
X
X
le A-7 (USA/US/
RMC
$46,115.52$46,115.52$49,360.81$52,104.01$55,128.01$55,128.01$63,312.76$63,312.76$65,565.16$65,565.16$69,295.30$69,295.30$77,636.70$77,636.70$81,944.86$81,944.86$86,077.62$86,077.62$97,489.60$97,489.60
Comparison of Physician*F)
VSP
$1,200$5,000$5,000$5,000$5,000
$12,000$12,000$11,500$11,500$11,000$11,000$10,000$10,000$9,000$9,000$9,000$9,000$8,000$8,000$8,000
ASP
$0$0$0$0$0
$15,000$15,000$15,000$15,000$15,000$15,000$15,000$15,000$15,000$15,000$15,000$15,000$15,000$15,000$15,000
BCP
$0$0$0$0$0$0$0
$2,500$3,500$3,500$3,500$4,000$4,000$5,000$5,000$5,000$5,000$6,000$6,000$6,000
Total Compensation
ISP
$0$0$0$0$0
$36,000$36,000$36,000$36,000$36,000$36,000$36,000$36,000$36,000$36,000$36,000$36,000$36,000$36,000$36,000
MSP****
$0$0$0$0$0$0$0$0
$14,000$14,000$14,000$14,000$14,000$14,000$14,000$14,000$14,000$14,000$14,000
$0* Promotion to O-4 occurs at end of YOS 6; to O-5 at end of YOS 12; to O-6 at end of YOS 18** Use this key to indicate the type of service for each year
PG-1 InternshipIR In-Service Residency TrainingFT In-Service Fellowship TrainingSU Staff Utilization Tour - Practicing as specialistFP Practicing as fellow
*** Active Duty Service Commitment at the end of the current year of service; maximum of HPSP or IR+FT; x = separation point of interest in study**** MSP amounts reflect combinations of contract lengths that would result in a contract expiration at end of 20 YOS;
Zero amounts occur for N years prior to retirement if physician signed MSP contract while having an N year ADSC for training
HayGroup Page A-25

Center for Naval Analyses
Otolaryngology
CurrentEnd YOS Age Grade*
1234567891011121314151617181920
26 0-32728293031 O-4323334353637 O-5383940414243 O-64445
-\
Type ofMilitary
Service** ADSC***
PG-1IRIRIRIRIRSUSUSUSUSUSUSUSUSUSUSUSUSUSU
45555543210X
X
X
'able A-7 (Army)
RMC
$46,115.52$46,115.52$49,360.81$52,104.01$55,128.01$55,128.01$63,312.76$63,312.76$65,565.16$65,565.16$69,295.30$69,295.30$77,636.70$77,636.70$81,944.86$81,944.86$86,077.62$86,077.62$97,489.60$97,489.60
Comparison of Physician Total Compensation
VSP
$1,200$5,000$5,000$5,000$5,000
$12,000$12,000$11,500$11,500$11,000$11,000$10,000$10,000
$9,000$9,000$9,000$9,000$8,000$8,000$8,000
ASP
$0$0$0$0$0$0
$15,000$15,000$15,000$15,000$15,000$15,000$15,000$15,000$15,000$15,000$15,000$15,000$15,000$15,000
BCP
$0$0$0$0$0$0$0$0
$2,500$3,500$3,500$4,000$4,000$5,000$5,000$5,000$5,000$6,000$6,000$6,000
ISP
$0$0$0$0$0$0
$30,000$30,000$30,000$30,000$30,000$30,000$30,000$30,000$30,000$30,000$30,000$30,000$30,000$30,000
MSP****
$0$0$0$0$0$0$0$0
$8,000$8,000$8,000$8,000$8,000$8,000$8,000$8,000$8,000
$0$0$0
* Promotion to O-4 occurs at end of YOS 6; to O-5 at end of YOS 12; to O-6 at end of YOS 18** Use this key to indicate the type of service for each year
PG-1 InternshipIR In-Service Residency TrainingFT In-Service Fellowship TrainingSU Staff Utilization Tour - Practicing as specialistFP Practicing as fellow
*** Active Duty Service Commitment at the end of the current year of service; maximum of HPSP or IR+FT; x = separation point of interest in study**** MSP amounts reflect combinations of contract lengths that would result in a contract expiration at end of 20 YOS;
Zero amounts occur for N years prior to retirement if physician signed MSP contract while having an N year ADSC for training
HayGroup Page A-26

Center for Naval Analyses
Otolaryngology
CurrentEnd YOS Age Grade*
1234567891011121314151617181920
26 O-32728293031 O-4323334353637 O-5383940414243 O-64445
Ta
Type ofMilitary
Service** ADSC***
PG-1IRIRIRIRSUSUSUSUSUSUSUSUSUSUSUSUSUSUSU
444443210
X
X
X
ble A-7 (Air
RMC
$46,115
Comparison of Physician Total CompensationForce)
VSP
.52 $1,200$46,115.52$49,360$52,104$55,128$55,128$63,312$63,312$65,565$65,565$69,295
.81
.01
.01
.01
.76
.76
.16
.16
.30$69,295.30$77,636$77,636$81,944$81,944$86,077$86,077$97,489$97,489
70.70868662626060
$5,000$5,000$5,000$5,000
$12,000$12,000$11,500$11,500$11,000$11,000$10,000$10,000$9,000$9,000$9,000$9,000$8,000$8,000$8,000
ASP
$0$0$0$0$0$0
$15,000$15,000$15,000$15,000$15,000$15,000$15,000$15,000$15,000$15,000$15,000$15,000$15,000$15,000
BCP
$0$0$0$0$0$0$0
$2,500$2,500$3,500$3,500$4,000$4,000$5,000$5,000$5,000$5,000$6,000$6,000$6,000
ISP
$0$0$0$0$0$0
$30,000$30,000$30,000$30,000$30,000$30,000$30,000$30,000$30,000$30,000$30,000$30,000$30,000$30,000
$0$0$0$0$0$0$0$0
$8,000$8,000$8,000$8,000$8,000$8,000$8,000$8,000$8,000
$0$0$0
' Promotion to O-4 occurs at end of YOS 6; to O-5 at end of YOS 12; to O-6 at end of YOS 18:* Use this key to indicate the type of service for each year
PG-1 InternshipIR In-Service Residency TrainingFT In-Service Fellowship TrainingSU Staff Utilization Tour - Practicing as specialistFP Practicing as fellow
** Active Duty Service Commitment at the end of the current year of service; maximum of HPSP or IR+FT; x = separation point of interest in study*** MSP amounts reflect combinations of contract lengths that would result in a contract expiration at end of 20 YOS;
Zero amounts occur for N years prior to retirement if physician signed MSP contract while having an N year ADSC for training
HayGroup Page A-27

Center for Naval Analyses
Pathology
Comparison of Physician Total CompensationTable A-7 (USA/USAF)
CurrentEnd YOS
1234567891011121314151617181920
Age
2627282930313233343536373839404142434445
Type ofMilitary
Service** ADSC*
O-3
O-4
0-5
O-6
PG-1IRIRIRIRSUSUSUSUSUSUSUSUSUSUSUSUSUSUSU
44444443210X
X
X
RMC
$46,115.52$46,115.52$49,360.81$52,104.01$55,128.01$55,128.01$63,312.76$63,312.76$65,565.16$65,565.16$69,295.30$69,295.30$77,636.70$77,636.70$81,944.86$81,944.86$86,077.62$86,077.62$97,489.60$97,489.60
VSP
$1,200$5,000$5,000$5,000$5,000
$12,000$12,000$11,500$11,500$11,000$11,000$10,000$10,000
$9,000$9,000$9,000$9,000$8,000$8,000$8,000
ASP
$0$0$0$0$0
$15,000$15,000$15,000$15,000$15,000$15,000$15,000$15,000$15,000$15,000$15,000$15,000$15,000$15,000$15,000
$0$0$0$0$0$0$0
$2,500$2,500$3,500$3,500$4,000$4,000$5,000$5,000$5,000$5,000$6,000$6,000$6,000
ISP
$0$0$0$0$0
$16,000$16,000$16,000$16,000$16,000$16,000$16,000$16,000$16,000$16,000$16,000$16,000$16,000$16,000$16,000
MSP****
$0$0$0$0$0$0$0$0
$8,000$8,000$8,000$8,000$8,000$8,000$8,000$8,000$8,000
$0$0$0
* Promotion to O-4 occurs at end of YOS 6; to 0-5 at end of YOS 12; to O-6 at end of YOS 18** Use this key to indicate the type of service for each year
PG-1 InternshipIR In-Service Residency TrainingFT In-Service Fellowship TrainingSU Staff Utilization Tour - Practicing as specialistFP Practicing as fellow
*** Active Duty Service Commitment at the end of the current year of service; maximum of HPSP or IR+FT; x = separation point of interest in study**** MSP amounts reflect combinations of contract lengths that would result in a contract expiration at end of 20 YOS;
Zero amounts occur for N years prior to retirement if physician signed MSP contract while having an N year ADSC for training
HayGroup Page A-28

Center for Naval Analyses
Pediatric Primary Care
Comparison of Physician Total Compensation
CurrentEnd YOS
1234567891011121314151617181920
Age
2627282930313233343536373839404142434445
O-3
O-4
O-5
O-6
Table A-7 (USA/USAF)
Type ofMilitary
Service** ADSC***
PG-1IRIRSUSUSUSUSUSUSUSUSUSUSUSUSUSUSUSUSU
444321
0(x)
X
X
X
RMC VSP ASP BCP ISP MSP***
$46,115.52$46,115.52$49,360.81$52,104.01$55,128.01$55,128.01$63,312.76$63,312.76$65,565.16$65,565.16$69,295.30$69,295.30$77,636.70$77,636.70$81,944.86$81,944.86$86,077.62$86,077.62$97,489.60$97,489.60
$1,200$5,000$5,000$5,000$5,000$12,000$12,000$11,500$11,500$11,000$11,000$10,000$10,000$9,000$9,000$9,000$9,000$8,000$8,000$8,000
$0$0$0
$15,000$15,000$15,000$15,000$15,000$15,000$15,000$15,000$15,000$15,000$15,000$15,000$15,000$15,000$15,000$15,000$15,000
$0$0$0
$2,500$2,500$2,500$2,500$2,500$2,500$3,500$3,500$4,000$4,000$5,000$5,000$5,000$5,000$6,000$6,000$6,000
$0$0$0
$11,000$11,000$11,000$11,000$11,000$11,000$11,000$11,000$11,000$11,000$11,000$11,000$11,000$11,000$11,000$11,000$11,000
$0$0$0$0$0$0$0
$8,000$8,000$8,000$8,000$8,000$8,000$8,000$8,000$8,000$8,000$8,000$8,000$8,000
* Promotion to O-4 occurs at end of YOS 6; to 0-5 at end of YOS 12; to O-6 at end of YOS 18** Use this key to indicate the type of service for each year
PG-1 InternshipIR In-Service Residency TrainingFT In-Service Fellowship TrainingSU Staff Utilization Tour - Practicing as specialistFP Practicing as fellow
*** Active Duty Service Commitment at the end of the current year of service; maximum of HPSP or IR+FT; x = separation point of interest in study**** MSP amounts reflect combinations of contract lengths that would result in a contract expiration at end of 20 YOS;
Zero amounts occur for N years prior to retirement if physician signed MSP contract while having an N year ADSC for training
HayGroup Page A-29

Center for Naval Analyses
Physical Medicine & Rehabilitation
Comparison of Physician Total CompensationTable A-7 (USA/USAF)
CurrentEnd YOS
1234567891011121314151617181920
Age
2627282930313233343536373839404142434445
Type ofMilitary
Service** ADSC*
0-3
O-4
0-5
0-6
PG-1IRIRIRSUSUSUSUSUSUSUSUSUSUSUSUSUSUSUSU
44443210
X
X
X
RMC
$46,115.52$46,115.52$49,360.81$52,104.01$55,128.01$55,128.01$63,312.76$63,312.76$65,565.16$65,565.16$69,295.30$69,295.30$77,636.70$77,636.70$81,944.86$81,944.86$86,077.62$86,077.62$97,489.60$97,489.60
VSP
$1,200$5,000$5,000$5,000$5,000
$12,000$12,000$11,500$11,500$11,000$11,000$10,000$10,000
$9,000$9,000$9,000$9,000$8,000$8,000$8,000
ASP
$0$0$0$0
$15,000$15,000$15,000$15,000$15,000$15,000$15,000$15,000$15,000$15,000$15,000$15,000$15,000$15,000$15,000$15,000
$0$0$0$0$0$0
$2,500$2,500$2,500$3,500$3,500$4,000$4,000$5,000$5,000$5,000$5,000$6,000$6,000$6,000
ISP
$0$0$0$0
$11,000$11,000$11,000$11,000$11,000$11,000$11,000$11,000$11,000$11,000$11,000$11,000$11,000$11,000$11,000$11,000
MSP****
$0$0$0$0$0$0$0$0
$10,000$10,000$10,000$10,000$10,000$10,000$10,000$10,000$10,000$10,000$10,000$10,000
* Promotion to O-4 occurs at end of YOS 6; to O-5 at end of YOS 12; to O-6 at end of YOS 18** Use this key to indicate the type of service for each year
PG-1 InternshipIR In-Service Residency TrainingFT In-Service Fellowship TrainingSU Staff Utilization Tour - Practicing as specialistFP Practicing as fellow
*** Active Duty Service Commitment at the end of the current year of service; maximum of HPSP or IR+FT; x = separation point of interest in study**** MSP amounts reflect combinations of contract lengths that would result in a contract expiration at end of 20 YOS;
Zero amounts occur for N years prior to retirement if physician signed MSP contract while having an N year ADSC for training
HayGroup Page A-30

Center for Naval Analyses
Plastic &
CurrentEnd YOS
1234567891011121314151617181920
Reconstructive Surge
26 O-32728293031 O-4323334353637 O-5383940414243 O-64445
Tabry_
Type ofMilitary
Service** ADSC***
PG-1IRIRIRIRFTFTFPFPFPFPFPFPFPFPFPFPFPFPFP
4444466543210
X
X
le A-7 (USA/US/
RMC
$46,115.52$46,115.52$49,360.81$52,104.01$55,128.01$55,128.01$63,312.76$63,312.76$65,565.16$65,565.16$69,295.30$69,295.30$77,636.70$77,636.70$81,944.86$81,944.86$86,077.62$86,077.62$97,489.60$97,489.60
Comparison of Physician Total Compensation^F)
VSP
$1,200$5,000$5,000$5,000$5,000
$12,000$12,000$11,500$11,500$11,000$11,000$10,000$10,000
$9,000$9,000$9,000$9,000$8,000$8,000$8,000
ASP
$0$0$0$0$0
$15,000$15,000$15,000$15,000$15,000$15,000$15,000$15,000$15,000$15,000$15,000$15,000$15,000$15,000$15,000
BCP
$0$0$0$0$0$0$0
$2,500$3,500$3,500$3,500$4,000$4,000$5,000$5,000$5,000$5,000$6,000$6,000$6,000
ISP
$0$0$0$0$0
$26,000$26,000$36,000$36,000$36,000$36,000$36,000$36,000$36,000$36,000$36,000$36,000$36,000$36,000$36,000
MSP****
$0$0$0$0$0$0$0$0
$8,000$8,000$8,000$8,000$8,000$8,000$8,000
$0$0$0$0$0
* Promotion to O-4 occurs at end of YOS 6; to 0-5 at end of YOS 12; to O-6 at end of YOS 18** Use this key to indicate the type of service for each year
PG-1 InternshipIR In-Service Residency TrainingFT In-Service Fellowship TrainingSU Staff Utilization Tour - Practicing as specialistFP Practicing as fellow
*** Active Duty Service Commitment at the end of the current year of service; maximum of HPSP or IR+FT; x = separation point of interest in study**** MSP amounts reflect combinations of contract lengths that would result in a contract expiration at end of 20 YOS;
Zero amounts occur for N years prior to retirement if physician signed MSP contract while having an N year ADSC for training
HayGroup Page A-31

Center for Naval Analyses Comparison of Physician Total Compensation
Psychiatry
CurrentEnd YOS
1234567891011121314151617181920
Age Grade*
26 O-32728293031 0-4323334353637 O-5383940414243 O-64445
Type ofMilitary
Service**
PG-1IRIRIRSUSUSUSUSUSUSUSUSUSUSUSUSUSUSUSU
Table A-7 (USA/USAF)
ADSC*** RMC VSP ASP BCP ISP MSP****
4 $46,115.52 $1,200 $0 $0 $0 $04 $46,115.52 $5,000 $0 $0 $0 $04 $49,360.81 $5,000 $0 $0 $0 $04 $52,104.01 $5,000 $0 $0 $0 $03 $55,128.01 $5,000 $15,000 $0 $14,000 $02 $55,128.01 $12,000 $15,000 $0 $14,000 $01 $63,312.76 $12,000 $15,000 $2,500 $14,000 $00 $63,312.76 $11,500 $15,000 $2,500 $14,000 $0
$65,565.16 $11,500 $15,000 $2,500 $14,000 $14,000$65,565.16 $11,000 $15,000 $3,500 $14,000 $14,000$69,295.30 $11,000 $15,000 $3,500 $14,000 $14,000
x $69,295.30 $10,000 $15,000 $4,000 $14,000 $14,000$77,636.70 $10,000 $15,000 $4,000 $14,000 $14,000$77,636.70 $9,000 $15,000 $5,000 $14,000 $14,000$81,944.86 $9,000 $15,000 $5,000 $14,000 $14,000$81,944.86 $9,000 $15,000 $5,000 $14,000 $14,000
x $86,077.62 $9,000 $15,000 $5,000 $14,000 $14,000$86,077.62 $8,000 $15,000 $6,000 $14,000 $14,000$97,489.60 $8,000 $15,000 $6,000 $14,000 $14,000
X $97,489.60 $8,000 $15,000 $6,000 $14,000 $14,000* Promotion to O-4 occurs at end of YOS 6; to O-5 at end of YOS 12; to O-6 at end of YOS 18** Use this key to indicate the type of service for each year
PG-1 InternshipIR In-Service Residency TrainingFT In-Service Fellowship TrainingSU Staff Utilization Tour - Practicing as specialistFP Practicing as fellow
*** Active Duty Service Commitment at the end of the current year of service; maximum of HPSP or IR+FT; x = separation point of interest in study**** MSP amounts reflect combinations of contract lengths that would result in a contract expiration at end of 20 YOS;
Zero amounts occur for N years prior to retirement if physician signed MSP contract while having an N year ADSC for training
HayGroup Page A-32

Center for Naval Analyses
Radiology
CurrentEnd YOS
1234567891011121314151617181920
(Diagnostic)
26 O-32728293031 O-4323334353637 O-5383940414243 O-64445
Tab
Type ofMilitary
Service** ADSC***
PG-1IRIRIRIRSUSUSUSUSUSUSUSUSUSUSUSUSUSUSU
444443210
X
X
X
le A-7 (USA/US/
RMC
$46,115.52$46,115.52$49,360.81$52,104.01$55,128.01$55,128.01$63,312.76$63,312.76$65,565.16$65,565.16$69,295.30$69,295.30$77,636.70$77,636.70$81,944.86$81,944.86$86,077.62$86,077.62$97,489.60$97,489.60
Comparison of Physician Total CompensationVF)
VSP
$1,200$5,000$5,000$5,000$5,000
$12,000$12,000$11,500$11,500$11,000$11,000$10,000$10,000
$9,000$9,000$9,000$9,000$8,000$8,000$8,000
ASP
$0$0$0$0$0
$15,000$15,000$15,000$15,000$15,000$15,000$15,000$15,000$15,000$15,000$15,000$15,000$15,000$15,000$15,000
BCP
$0$0$0$0$0$0$0
$2,500$2,500$3,500$3,500$4,000$4,000$5,000$5,000$5,000$5,000$6,000$6,000$6,000
ISP
$0$0$0$0$0
$31,000$31,000$31,000$31,000$31,000$31,000$31,000$31,000$31,000$31,000$31,000$31,000$31,000$31,000$31,000
MSP****
$0$0$0$0$0$0$0$0
$8,000$8,000$8,000$8,000$8,000$8,000$8,000$8,000$8,000$8,000$8,000
$0* Promotion to O-4 occurs at end of YOS 6; to 0-5 at end of YOS 12; to O-6 at end of YOS 18** Use this key to indicate the type of service for each year
PG-1 InternshipIR In-Service Residency TrainingFT In-Service Fellowship TrainingSU Staff Utilization Tour - Practicing as specialistFP Practicing as fellow
*** Active Duty Service Commitment at the end of the current year of service; maximum of HPSP or IR+FT; x = separation point of interest in study**** MSP amounts reflect combinations of contract lengths that would result in a contract expiration at end of 20 YOS;
Zero amounts occur for N years prior to retirement if physician signed MSP contract while having an N year ADSC for training
HayGroup Page A-33

Center for Naval Analyses
Radiology (Therapeutic)
Comparison of Physician Total CompensationTable A-7 (USA/USAF)
CurrentEnd YOS
1234567891011121314151617181920
Age
2627282930313233343536373839404142434445
Type ofMilitary
Service*' ADSC*
O-3
0-4
O-5
O-6
PG-1IRIRIRIRSUSUSUSUSUSUSUSUSUSUSUSUSUSUSU
444443210
X
X
X
RMC
$46,115.52$46,115.52$49,360.81$52,104.01$55,128.01$55,128.01$63,312.76$63,312.76$65,565.16$65,565.16$69,295.30$69,295.30$77,636.70$77,636.70$81,944.86$81,944.86$86,077.62$86,077.62$97,489.60$97,489.60
VSP
$1,200$5,000$5,000$5,000$5,000
$12,000$12,000$11,500$11,500$11,000$11,000$10,000$10,000$9,000$9,000$9,000$9,000$8,000$8,000$8,000
ASP
$0$0$0$0$0
$15,000$15,000$15,000$15,000$15,000$15,000$15,000$15,000$15,000$15,000$15,000$15,000$15,000$15,000$15,000
YOS 18
BCP
$0$0$0$0$0$0$0
$2,500$3,500$3,500$3,500$4,000$4,000$5,000$5,000$5,000$5,000$6,000$6,000$6,000
ISP
$0$0$0$0$0
$31,000$31,000$31,000$31,000$31,000$31,000$31,000$31,000$31,000$31,000$31,000$31,000$31,000$31,000$31,000
MSP****
$0$0$0$0$0$0$0$0
$8,000$8,000$8,000$8,000$8,000$8,000$8,000$8,000$8,000$8,000$8,000
$0' Promotion to O-4 occurs at end of YOS 6; to O-5 at end of YOS 12; to O-6 at end of'* Use this key to indicate the type of service for each year
PG-1 InternshipIR In-Service Residency TrainingFT In-Service Fellowship TrainingSU Staff Utilization Tour - Practicing as specialistFP Practicing as fellow
** Active Duty Service Commitment at the end of the current year of service; maximum of HPSP or IR+FT; x = separation point of interest in study*** MSP amounts reflect combinations of contract lengths that would result in a contract expiration at end of 20 YOS;
Zero amounts occur for N years prior to retirement if physician signed MSP contract while having an N year ADSC for training
HayGroup PageA-34
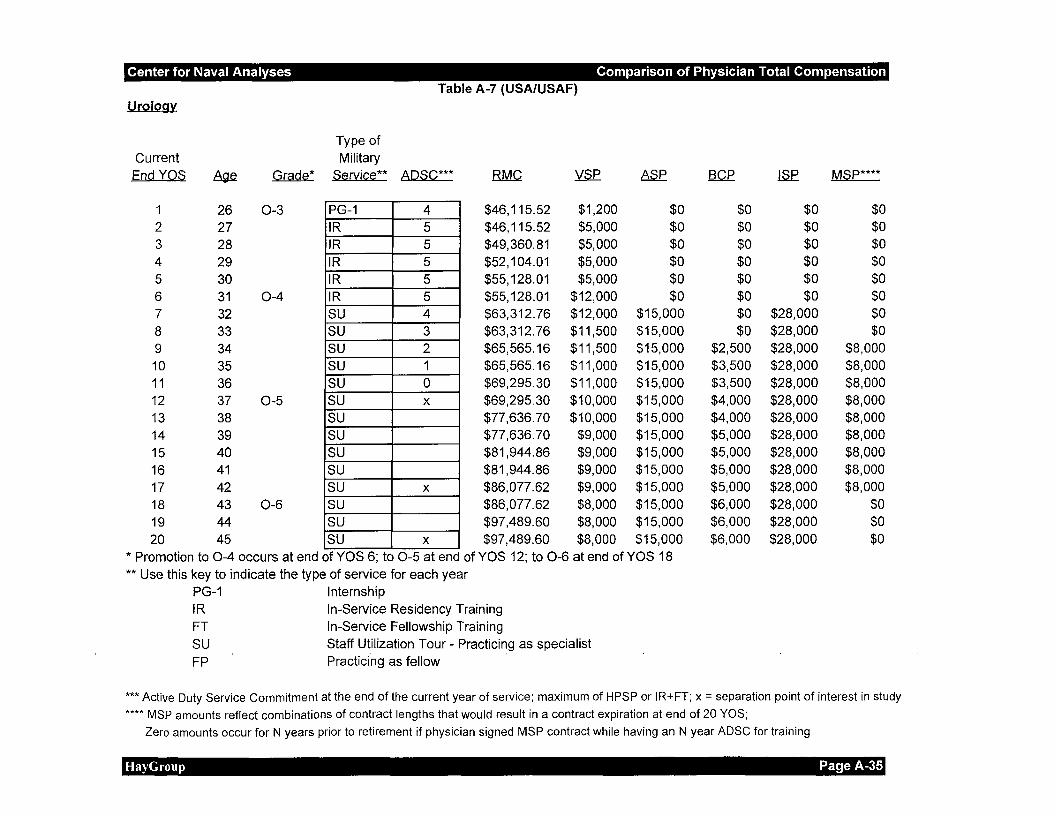
Center for Naval Analyses
Urology
Comparison of Physician Total CompensationTable A-7 (USA/USAF)
CurrentEnd YOS
1234567891011121314151617181920
Age
2627282930313233343536373839404142434445
Type ofMilitary
Service** ADSC***
O-3
O-4
O-5
0-6
PG-1IRIRIRIRIRSUSUSUSUSUSUSUSUSUSUSUSUSUSU
45555543210X
X
X
RMC
$46,115.52$46,115.52$49,360.81$52,104.01$55,128.01$55,128.01$63,312.76$63,312.76$65,565.16$65,565.16$69,295.30$69,295.30$77,636.70$77,636.70$81,944.86$81,944.86$86,077.62$86,077.62$97,489.60$97,489.60
VSP
$1,200$5,000$5,000$5,000$5,000$12,000$12,000$11,500$11,500$11,000$11,000$10,000$10,000$9,000$9,000$9,000$9,000$8,000$8,000$8,000
ASP
$0$0$0$0$0$0
$15,000$15,000$15,000$15,000$15,000$15,000$15,000$15,000$15,000$15,000$15,000$15,000$15,000$15,000
BCP
$0$0$0$0$0$0$0$0
$2,500$3,500$3,500$4,000$4,000$5,000$5,000$5,000$5,000$6,000$6,000$6,000
ISP
$0$0$0$0$0$0
$28,000$28,000$28,000$28,000$28,000$28,000$28,000$28,000$28,000$28,000$28,000$28,000$28,000$28,000
MSP****
$0$0$0$0$0$0$0$0
$8,000$8,000$8,000$8,000$8,000$8,000$8,000$8,000$8,000
$0$0$0
* Promotion to O-4 occurs at end of YOS 6; to O-5 at end of YOS 12; to O-6 at end of YOS 18** Use this key to indicate the type of service for each year
PG-1 InternshipIR In-Service Residency TrainingFT In-Service Fellowship TrainingSU Staff Utilization Tour - Practicing as specialistFP Practicing as fellow
*** Active Duty Service Commitment at the end of the current year of service; maximum of HPSP or IR+FT; x = separation point of interest in study**** MSP amounts reflect combinations of contract lengths that would result in a contract expiration at end of 20 YOS;
Zero amounts occur for N years prior to retirement if physician signed MSP contract while having an N year ADSC for training
HayGroup Page A-35

Center for Naval Analyses Comparison of Physician Total Compensation
Appendix B: Private Sector Survey Participants
Group Practices (26)Camino Medical Group (Sunnyvale, CA)Children's Associated Medical Group, Inc. (San Diego, CA)The Children's Heart Center (Atlanta, GA)Children's Physicians/Children's Hospital (Omaha, NE)Clinical Care Associates of the University of Pennsylvania Health System
(Radnor, PA)Cook Children's Physician's Network (Fort Worth, TX)Emory Clinic (Atlanta, GA)Fairfield Medical Group, Inc. (Fairfield, CA)Harvard Vanguard Medical Associates (Brookline, MA)Hitchcock Clinic (Lebanon, NH)Kelsey-Seybold Clinic, P.A. (Houston, TX)Lovelace Health Systems, Inc. (Albuquerque, NM)Mayo Clinic (Rochester, MN)MedPro (Phoenix, AZ)Mercy Health Centers (San Diego, CA)MeritCare Medical Group (Fargo, ND)Munson Healthcare, Inc. (Traverse City, Ml)Northwestern Medical Faculty Foundation, Inc. (Chicago, IL)Providence Medical Group (Seattle, WA)Sharp HealthCare (San Diego, CA)Southwest Medical Associates (Las Vegas, NV)SSM Health Care (St. Louis, MO)University of Minnesota Physicians (Minneapolis, MN)Valley Children's Hospital Specialty Medical Group (Fresno, CA)Virginia Mason Medical Center (Seattle, WA)York Health System Medical Group (York, PA)
HMOs (14)Blue Cross Blue Shield of Michigan (Detroit, Ml)Carolina Permanente Medical Group, P.A. (Raleigh, NC)CIGNA Corporation (Bloomfield, CT)Colorado Permanente Medical Group, P.C. (Denver, CO)Family Health Plan Cooperative (Milwaukee, Wl)Group Health Cooperative (Madison, Wl)Group Health Permanente (Seattle, WA)Horizon Blue Cross Blue Shield of New Jersey (Newark, NJ)M.I.T. Medical Department (Cambridge, MA)Northeast Permanente Medical Group, P.C. (Farmington, CT)
HayGroup Page B-1

Center for Naval Analyses Comparison of Physician Total Compensation
Northwest Permanente Medical Group, Inc. (Portland, OR)Ohio Permanente Medical Group, Inc. (Cleveland, OH)The Permanente Medical Group, Inc. (Oakland, CA)Southern California Permanente Medical Group (Pasadena, CA)
Hospital-Based Facilities (51)Advocate Health Care (Oak Brook, IL)All Children's Hospital (St. Petersburg, FL)Alta Bates Medical Center (Berkeley, CA)Atlantic Health System (Florham Park, NJ)Aurora Health Care, Inc. (Milwaukee, Wl)Baylor College of Medicine (Dallas, TX)Brockton Hospital (Brockton, MA)Children's Health Care Associates (Philadelphia, PA)Children's Health System (Milwaukee, Wl)The Children's Hospital (Denver, CO)Children's Hospital (New Orleans, I_A)Children's Hospital Medical Center of Akron (Akron, OH)Children's Hospital of Alabama (Birmingham, AL)The Children's Medical Center (Dayton, OH)Children's Mercy Hospital (Kansas City, MO)Children's Specialty Group, PLLC (Norfolk, VA)Connecticut Children's Medical Center (Hartford, CT)Detroit Medical Center (Detroit, Ml)DuBois Regional Medical Center (DuBois, PA)Egleston Children's Health Care System (Atlanta, GA)Fairview Hospital - Cleveland Clinic Health System (Cleveland, OH)Fairview Hospital and Healthcare Services (Minneapolis, MN)Greenville Hospital System (Greenville, SC)Intermountain Health Care, Inc. (Salt Lake City, UT)Latrobe Area Hospital (Latrobe, PA)Legacy Health System (Portland, OR)Lehigh Valley Hospital (Allentown, PA)Long Beach Memorial Medical Center (Long Beach, CA)Madigan Army Medical Center (Tacoma, WA)Mary Imogene Bassett Hospital (Cooperstown, NY)MedStar Baltimore Division, dba Helix Health System (Lutherville, MD)Memorial Hospital (Colorado Springs, CO)Memorial Sloan-Kettering Cancer Center (New York, NY)Mercy Health Services (Farmington Hills, Ml)Methodist Medical Center of Illinois (Peoria, IL)Miami Children's Hospital (Miami, FL)Mt. Clemens General Hospital (Mount Clemens, Ml)North Memorial Medical Center (Robbinsdale, MN)Parkland Health and Hospital System (Dallas, TX)Phoenix Children's Hospital (Phoenix, AZ)
HayGroup Page B-2

Center for Naval Analyses Comparison of Physician Total Compensation
Pinnacle Health System (Harrisburg, PA)Presbyterian Healthcare Services (Albuquerque, NM)Providence Health System - Oregon Region (Portland, OR)Sarah Bush Lincoln Health Center (Mattoon, IL)Southern New Hampshire Regional Medical Center (Nashua, NH)Southwestern Vermont Medical Center (Bennington, VT)St. Joseph's Regional Medical Center, Inc. (South Bend, IN)State of Minnesota Department of Human Services (St. Paul, MN)University of Texas Medical Branch at Galveston (Galveston, TX)Valley Medical Center (Renton, WA)York Hospital (York, PA)
HayCroup Page B-3

Center for Naval Analyses Comparison of Physician Total Compensation
Appendix C: Benefit Value Comparison (BVC) Methodology
The salary-equivalent values allocated with each employee benefit are derivedthrough the use of a "standard cost" model. The purpose of this approach is toeliminate the effect of differences in employee population, financing methods andother factors that can result in identical benefit programs in two differentorganizations having different costs. Under this approach, standard assumptionswere derived for all factors other than benefit provisions (e.g. employeepopulation, financing method, etc.) and applied uniformly to all organizations.The "standard assumptions" are based on the national average private sectorexempt employee population and the most common funding methods.
The methods used to value each type of benefit are those generally used bycompanies to fund each benefit. Therefore, group insurance rates weredeveloped through the use of group rate manuals of major underwriters for thosebenefits that are generally insured. The defined benefit retirement value factorswere developed reflecting major companies' employee populations andexperience using reasonable actuarial assumptions as to interest, salaryincreases and other factors that affect retirement payments.
The results are salary-equivalent benefit values that represent the approximatecost of providing each benefit program to an average salaried employeepopulation in a large private sector organization. Because these values arebased on a standard private sector work force and funding assumptions, they willbe referred to as standard BVCs.
Standard BVC values are then reduced by the amount of any employee costsharing in order to reflect that portion of the plan that is paid for by the employer.Accordingly, these values are called employer-provided or EP values. For plansthat require an employee contribution, these salary-equivalent EP valuesrepresent only the portion of the total value that is employer paid. Definedcontribution retirement plans (401 (k) plans) provide a good example. The benefitvalue for the private sector 401 (k) plan is based only on the employer matchingcontribution. The model assumes that participants will contribute enough of theirown salary to receive the maximum employer match. In this study, the mostprevalent private sector practice resulted in a maximum 2.5 percent employermatching contribution.
In addition to the employer-provided standard BVCs, the Army, Air Force, andprivate sector benefits were also valued as if they had been applied to the Armyand Air Force workforce. These are referred to as military employer-providedBVCs and are the benefit values used in this study. If there existed a knownDoD cost analogous to a BVC, such as the normal cost of the military retirementsystem, that cost was used as the BVC and the private sector BVC wasrecalibrated on that basis. While this process produces a different set of values
HayGroup Page C-1

Center for Naval Analyses Comparison of Physician Total Compensation
for each comparator's benefits package, the relative values of the differentbenefits remain unchanged. The values are simply rescaled. However, the sumof the values of all benefits does change as more value is based on the unit costof some programs and less on the unit cost of others. The advantage of thisapproach is that it uses known military benefit cost factors, employs thedemographics of the military work force, and is, therefore, a more appropriatebaseline for this analysis.
The BVCs shown in the study are the average values (costs) for benefits for theArmy, Air Force, and private sector physician work forces, assuming a workforcewith military demographic characteristics. As averages, the values do notrepresent the values for any specific individual. While it is not possible to presentthe values for specific individuals it is important to understand how the valuesmight vary depending on an individual's circumstances.
Some benefits, such as annual leave in the Army and Air Force, haveapproximately the same economic value for all members. Most of the benefits,however, can vary widely depending on the circumstances of the employee. Forinstance, health insurance has little economic value for a young, healthy singeemployee or servicemember but the economic values are much higher than theaverage BVC for a married employee with a spouse or child with a severemedical problem.
The variation in economic value is most diverse for the retirement system. Ayoung uniformed service physician who does not plan to stay beyond the firstobligated period of service will receive no economic value from the retirementsystem. However, a uniformed service physician with 17 years service willreceive a benefit that is worth much more than the average BVC simply bystaying to 20 years.
The range is even wider when it comes to the employee's perceived value ofbenefits. Even an employee who might eventually stay to retirement will placelittle value on the retirement benefit early in the career. On the other hand, theemployee with a dependent who is at risk for severe medical problems may placea much higher value on health care than a strict economic analysis would predict.
In considering the BVCs it is important to recognize what the value is and tounderstand what it is not. The BVC is an average cost of benefits for allemployees. It is not the economic value for any individual member, and it is evenless the perceived value of any individual member. The BVCs provide aquantitative measure of the relative cost of the overall benefits package. The useof the analysis should be tempered with consideration of the economic andperceived values for the individuals being considered.
HayGroup Page C-2

Distribution listCNA Information Manual D0003361.A1/Final
USA Surgeon GeneralAttn: LTG PeakeAttn: MG SculleyAttn: MG KileyAttn: Craig Buss
USAF Surgeon GeneralAttn: LTG CarltonAttn: MG RandolphAttn: MA] Bartholomew
USN Surgeon GeneralAttn: RADM ArthurAttn: CAPT SentellAttn: LCDR Bradley
TRICARE Management AgencyAttn: MAJ Wooten