Embed Size (px)
Citation preview
Comparison of acid and amyloglucosidasehydrolysis for estimation of non-structuralpolysaccharides in feed samplesGilberto V Kozloski,1*† Joao BT Rocha,1 Henrique MN Ribeiro Filho2 andJuliano Perottoni11Departamento de Quımica, Centro de Ciencias Naturais e Exatas, Universidade Federal de Santa Maria, Santa Maria, 97119-900, RS,Brasil2Centro de Ciencias Agroveterinarias-UDESC, Av Luis de Camoes 2090, Lages, SC, Brasil
Abstract: Enzymatic methods (amyloglucosidase) and methods based on acid solutions (0.1, 0.2 and
0.3M H2SO4 for 1, 2 and 3h at 100°C) for the hydrolysis of non-structural carbohydrates from different
feed samples were compared. The monomeric units resulting from the enzymatic and acid hydrolysis
were determined by the glucose oxidase and reducing sugar methods. There was a signi®cant effect of
acid concentration and of time of hydrolysis on the glucose and reducing sugar values in the
hydrolysate. Glucose values were similar for both the amyloglucosidase method and the most intense
conditions of hydrolysis (0.3M for 3h) for some samples. Under these conditions, however, the
reducing sugar values were higher. No acid hydrolysis method was found to estimate correctly the total
non-structural carbohydrates, but a-linked glucose polymers in biological samples may be determined
by sample hydrolysis with a 0.3M H2SO4 solution for 3h at 100°C since the glucose in the hydrolysate is
determined by the glucose oxidase method and the sucrose content of the sample is negligible.
# 1999 Society of Chemical Industry
Keywords: carbohydrates; amyloglucosidase; acid solutions; hydrolysis; glucose; reducing sugars
INTRODUCTIONCarbohydrates correspond to 50 to 80% of the dry
matter of forage grasses and cereals1 and represent the
primary nutritional source for the energy requirements
of animals. They may be classi®ed into two groups:
non-structural carbohydrates (NSC), which are avail-
able for plant metabolism and are represented by
sugars, starch and fructans, among others; and
structural carbohydrates, mainly represented by pec-
tins, cellulose and hemicellulose.1 The proportions of
the two groups vary with plant species and growth
stage and with plant part in the same plant. As
components of the diets of ruminants, NSC are
promptly fermented by the ruminal micro¯ora,
whereas cellulose and hemicellulose are fermented
more slowly. Pectin, although of a structural nature, is
also rapidly fermented in the rumen. Thus, depending
on the proportion of these carbohydrates in feed,
different patterns of fermentation and degrees of
digestion may occur, causing different levels of feed
assimilation by the animals. Thus, the determination
of the composition of feed in terms of these carbo-
hydrate groups permits a better understanding of the
digestive processes and a more effective prediction of
the performance of animals consuming such feeds.
Several methods have been employed for NSC
determination in feed, digesta and faecal samples. The
methods may be direct, with hydrolysis of the sample
and later determination of the resulting monosacchar-
ides, or indirect, with NSC being determined by the
following formula: NSC=100ÿ((NDF-NDF pro-
tein)�CP�EE�ash), where NDF is the ®bre in
neutral detergent, CP is the crude protein, and EE is
the ether extract.2
The direct methods differ in sample preparation by
the use of different types of extraction and hydrolysis
(with water, alcohol, acids or enzymes), and in the
determination of the monosaccharides resulting from
hydrolysis (copper-iodometric titration of Shaffer±
Somogyi, colorimetric method of Somogyi±Nelson,
glucose oxidase method or chromatography).
Among the enzymatic methods, those that seem to
be most often used are the method of Weinmann,3
which employs an enzymatic preparation denoted
Journal of the Science of Food and Agriculture J Sci Food Agric 79:1112±1116 (1999)
* Correspondence to: Gilberto V Kozloski, Curso de Pos Graduacao em Zootecnia, Universidade Federal do Rio Grande do Sul, Av BentoGoncalves 7712, Porto Alegre, 91540-000, RS, Brasil† Present address: Curso de Pos Graduacao em Zootecnia, Universidade Federal do Rio Grande do Sul, Av Bento Goncalves 7712, PortoAlegre, 91540-000, RS, Brasil(Received 9 October 1997; revised version 15 June 1998; accepted 20 November 1998)
# 1999 Society of Chemical Industry. J Sci Food Agric 0022±5142/99/$17.50 1112
takadiastase (mainly containing a-amylase) and later
modi®ed by Lindahl et al,4 and the method of McRae
and Armstrong,5 which involves incubation of the
sample with an amyloglucosidase (from Aspergillusniger). Herrera-Saldana and Huber,6 in turn, de-
scribed an enzymatic method in which hydrolysis is
performed in two steps, the ®rst using a thermo a-
amylase and the second a glucoamylase.
Several methods of hydrolysis with acid solutions
have been evaluated as alternatives to the use of
enzymes (Smith et al,7 Grotelueschen and Smith,8
McRae and Armstrong,5 Greub and Wedin,9 McAllan
and Smith10 and Kartchner and Theurer,11 among
others). Smith et al7 used hydrolysis with 0.1 to 0.4M
H2SO4 solutions and takadiastase hydrolysis by the
method of Weinmann3 for samples of alfalfa root and
timothy stem base. The resulting sugars were deter-
mined by the copper-iodometric titration method of
Shaffer±Somogyi. These investigators concluded that
the most adequate methods were the enzymatic
method and the method with 0.1M H2SO4, which
yielded similar results and permitted the determina-
tion of sugars and fructans in addition to starch. In our
laboratory we conducted preliminary studies in which
we analysed food samples with a high grain content,
corn silage, duodenal digesta and also faecal samples.
We used hydrolysis with 0.1M H2SO4 as proposed by
Smith et al7 and determined the resulting sugars by
Shaffer±Somogyi copper-iodometric titration. These
samples were also analysed using an amyloglucosidase.
All the results obtained by acid hydrolysis (unpub-
lished data) were signi®cantly lower than those
obtained by the enzymatic method. Some changes in
sample size and time of hydrolysis signi®cantly altered
the results, which, however, continued to be below
expected levels.
Enzymatic hydrolysis is more speci®c and seems to
be less subject to error, but it is more complex, more
time-consuming and more expensive than acid hydro-
lysis. Furthermore, with the enzymatic method, it is
recommended that samples containing signi®cant
amounts of other NSC (fructans, sucrose and others)
in addition to a-linked glucose polysaccharides, be
submitted to additional procedures in order not to
underestimate this fraction.5,8 In turn, sample pre-
paration by hydrolysis with acid solutions may cause
errors due to the partial solubilisation of structural
components such as pectins, hemicellulose and
cellulose1 or, conversely, due to incomplete solubilisa-
tion and hydrolysis of all NSC. The results would
represent overestimates in the former case and under-
estimates in the latter.
Thus, the objective of the present study was to
determine the effect of different times of hydrolysis
with sulphuric acid solutions of different molarities on
the release of glucose and reducing sugars from feed
samples varying in the proportion of concentrate for
tropical forage hay, in order to ®nd a simpler and less
expensive direct method than the enzymatic one for
the determination of NSC.
EXPERIMENTALSamples (250mg) of Cynodum dactilum cv coast cross
(bermuda grass) hay, of concentrate (18% corn, 12%
soy bran, 31% wheat bran, 37% defatted rice bran,
and 2.0% premix vit-min) and of different hay:con-
centrate proportions (25:75, 50:50 and 72:25), all
enriched with increasing proportions of corn starch
(0, 10 and 20%), as well as standard samples of corn
starch (Sigma), glucose, fructose, xylan (from birch-
wood, Sigma) and cellulose (cotton) were hydrolysed
at 100°C in a re¯ux system with 0.1, 0.2 and 0.3M
H2SO4 solutions (50ml) for 1, 2 and 3h. Hydrolysis
was carried out in triplicate, the solutions were then
®ltered through paper ®lter, and the tube was washed
with boiling distilled water. The ®ltrate was placed in
a 100ml volumetric ¯ask, and allowed to cool, and
the volume was adjusted with distilled water. A 10ml
aliquot of the content of the ¯ask was collected,
neutralised at pH 6 to 8 with 0.15M NaOH solution
and frozen for later determination of glucose and
reducing sugars. The samples were also hydrolysed
using amyloglucosidase (from Rhizopus mold, with
activity of 22000Ugÿ1, Sigma EC 3.2.1.3) incubated
with the sample for 40h at 60°C according to the
method of Kartchner and Theurer.11 The ®ltrate
resulting from the acid and enzymatic hydrolyses was
assayed for glucose concentration by the glucose
oxidase method and for reducing sugars by the
modi®ed colorimetric method of Somogy and Nelson,
according to Tuiskon.12 The standard curves for
sugar determinations by the acid and enzymatic
methods were constructed with pa glucose samples
treated like the samples (submitted to acid and
enzymatic hydrolysis), considering that glucose re-
covery after hydrolysis, ®ltration and neutralisation
was 100%. In the case of acid hydrolysis, the standard
glucose solution was prepared by subjection of 27
samples of glucose to acid hydrolysis conditions
(three for each acid hydrolysis condition), and in
the case of enzymatic hydrolysis the standard glucose
solution was prepared from 3 pa glucose samples. In
the determination of glucose and reducing sugars in
the samples submitted to acid hydrolysis, distilled
water was used as the blank and also to dilute the
standard glucose solution (standard curve). The
blank used for the samples submitted to enzymatic
hydrolysis was a solution originating from enzymatic
hydrolysis in the absence of a sample.
The results were submitted to analysis of variance
to determine the effect of the different molarities of
the acid and of the different times of hydrolysis on
the percentage of glucose and of reducing sugars in
the samples. Regressions were also done considering
the effect of these factors on the percentage of
glucose and of reducing sugars in the samples
submitted to acid hydrolysis. We also compared the
means obtained with the different methods of
hydrolysis and of determination of the sugars
resulting in the various samples by the Tukey test
(a=0.05).
J Sci Food Agric 79:1112±1116 (1999) 1113
Acid and amyloglucosidase hydrolysis for estimating polysaccharides in feed
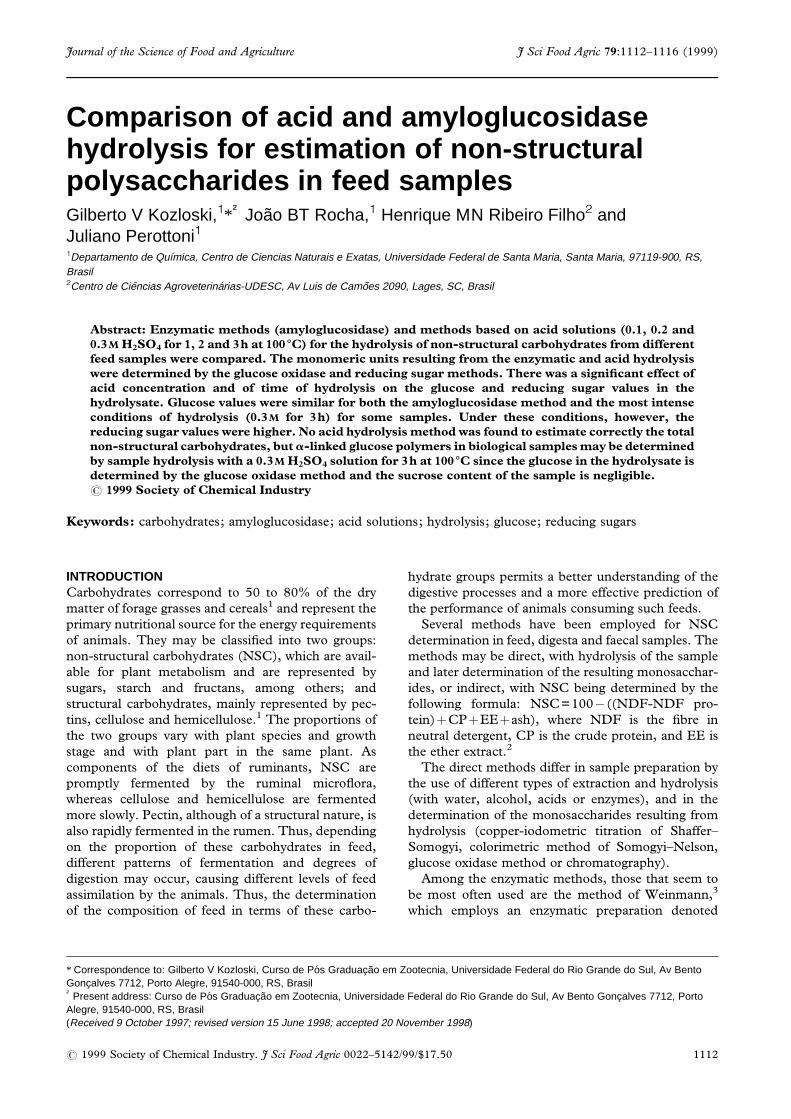
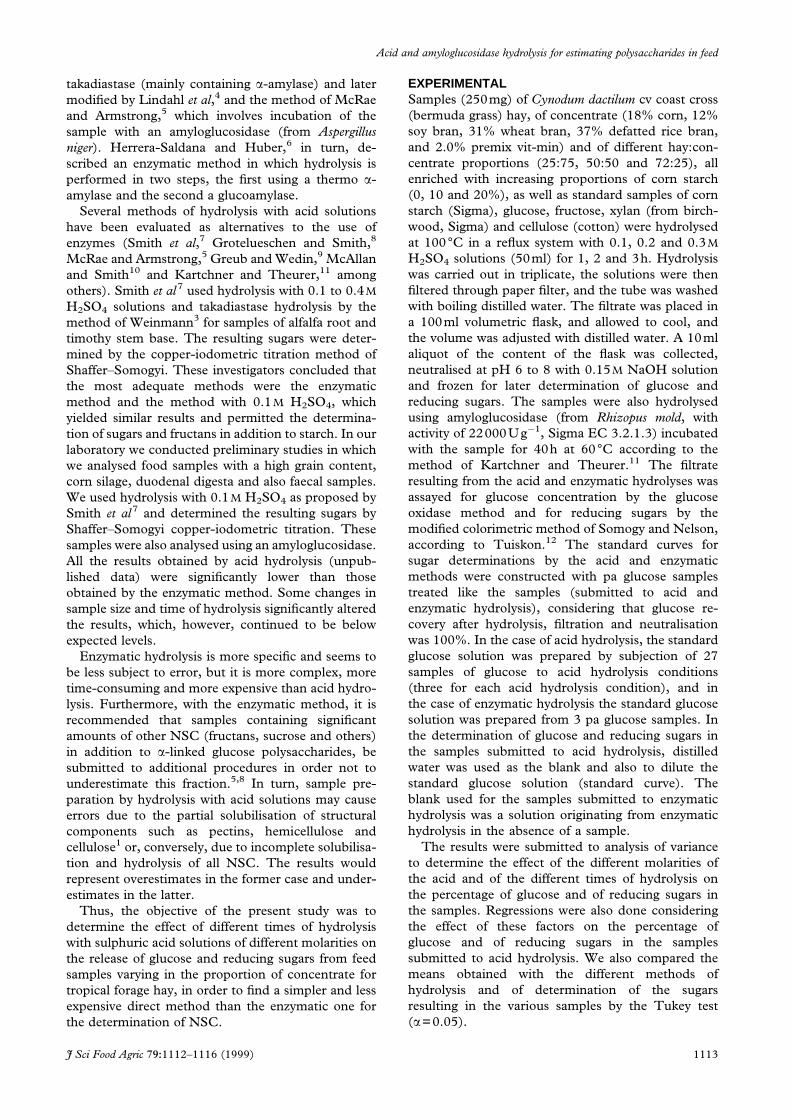
RESULTS AND DISCUSSIONThe release of reducing sugars and glucose (deter-
mined by glucose oxidase) of all feed samples assayed,
as a function of different hydrolysis methods tested, is
presented in Figs 1 and 2. Time (P<0.01) and
molarity of the H2SO4 solution (P<0.01) for acid
hydrolysis had a signi®cant effect on reducing sugar
and/or glucose release from the samples analysed.
Under milder hydrolysis conditions, the release of
reducing sugars was lower than the release of glucose
only, a behaviour that was inverted as the intensity of
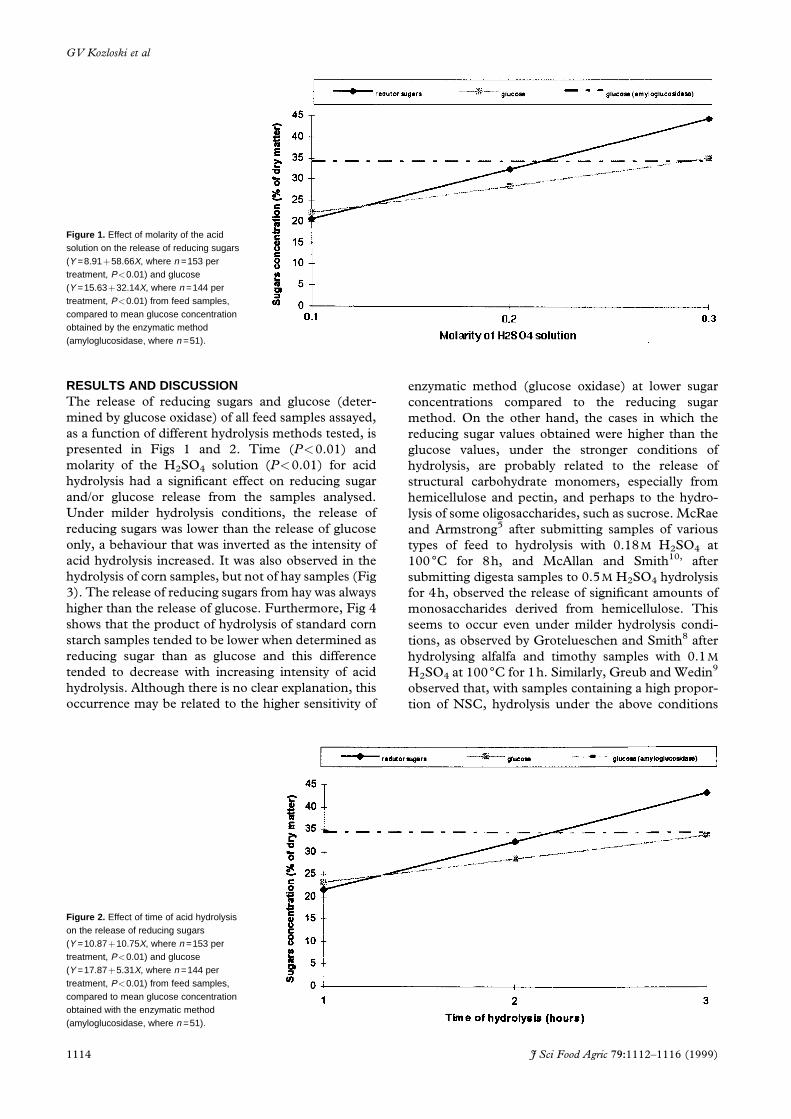
acid hydrolysis increased. It was also observed in the
hydrolysis of corn samples, but not of hay samples (Fig
3). The release of reducing sugars from hay was always
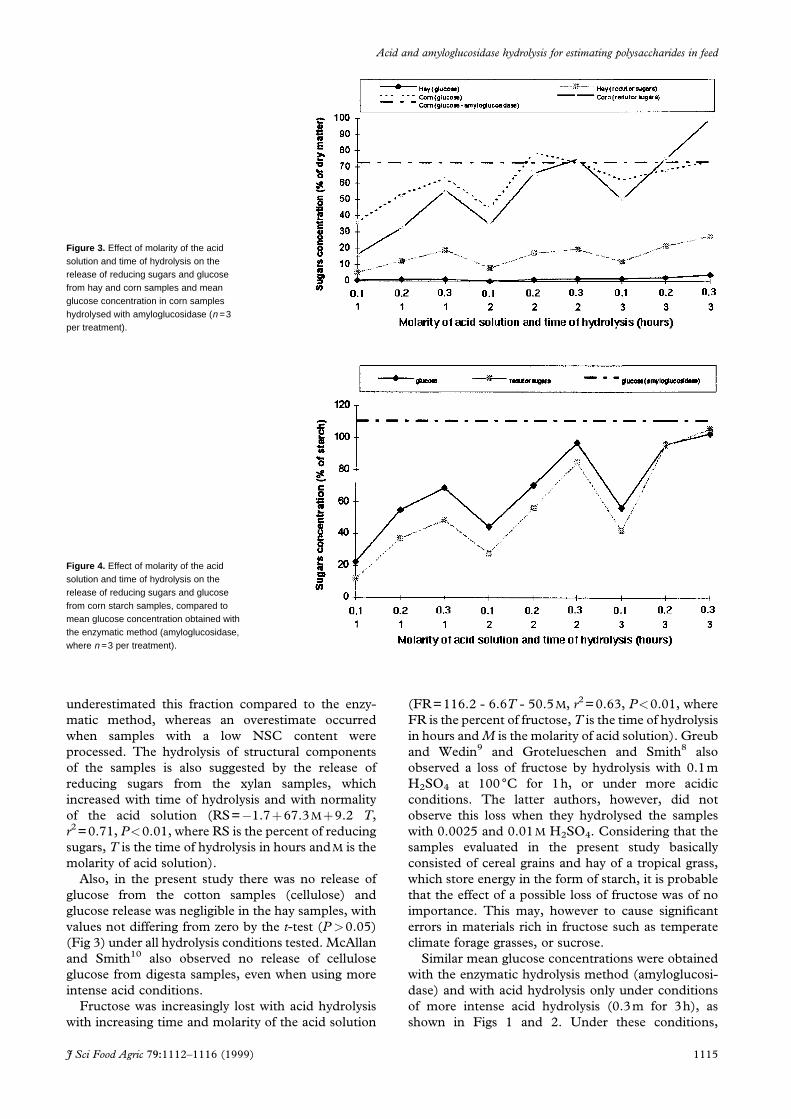
higher than the release of glucose. Furthermore, Fig 4
shows that the product of hydrolysis of standard corn
starch samples tended to be lower when determined as
reducing sugar than as glucose and this difference
tended to decrease with increasing intensity of acid
hydrolysis. Although there is no clear explanation, this
occurrence may be related to the higher sensitivity of
enzymatic method (glucose oxidase) at lower sugar
concentrations compared to the reducing sugar
method. On the other hand, the cases in which the
reducing sugar values obtained were higher than the
glucose values, under the stronger conditions of
hydrolysis, are probably related to the release of
structural carbohydrate monomers, especially from
hemicellulose and pectin, and perhaps to the hydro-
lysis of some oligosaccharides, such as sucrose. McRae
and Armstrong5 after submitting samples of various
types of feed to hydrolysis with 0.18M H2SO4 at
100°C for 8h, and McAllan and Smith10, after
submitting digesta samples to 0.5M H2SO4 hydrolysis
for 4h, observed the release of signi®cant amounts of
monosaccharides derived from hemicellulose. This
seems to occur even under milder hydrolysis condi-
tions, as observed by Grotelueschen and Smith8 after
hydrolysing alfalfa and timothy samples with 0.1M
H2SO4 at 100°C for 1h. Similarly, Greub and Wedin9
observed that, with samples containing a high propor-
tion of NSC, hydrolysis under the above conditions
Figure 1. Effect of molarity of the acidsolution on the release of reducing sugars(Y =8.91�58.66X, where n =153 pertreatment, P<0.01) and glucose(Y =15.63�32.14X, where n =144 pertreatment, P<0.01) from feed samples,compared to mean glucose concentrationobtained by the enzymatic method(amyloglucosidase, where n =51).
Figure 2. Effect of time of acid hydrolysison the release of reducing sugars(Y =10.87�10.75X, where n =153 pertreatment, P<0.01) and glucose(Y =17.87�5.31X, where n =144 pertreatment, P<0.01) from feed samples,compared to mean glucose concentrationobtained with the enzymatic method(amyloglucosidase, where n =51).
1114 J Sci Food Agric 79:1112±1116 (1999)
GV Kozloski et al
underestimated this fraction compared to the enzy-
matic method, whereas an overestimate occurred
when samples with a low NSC content were
processed. The hydrolysis of structural components
of the samples is also suggested by the release of
reducing sugars from the xylan samples, which
increased with time of hydrolysis and with normality
of the acid solution (RS=ÿ1.7�67.3M�9.2 T,
r2=0.71, P<0.01, where RS is the percent of reducing
sugars, T is the time of hydrolysis in hours andM is the
molarity of acid solution).
Also, in the present study there was no release of
glucose from the cotton samples (cellulose) and
glucose release was negligible in the hay samples, with
values not differing from zero by the t-test (P>0.05)
(Fig 3) under all hydrolysis conditions tested. McAllan
and Smith10 also observed no release of cellulose
glucose from digesta samples, even when using more
intense acid conditions.
Fructose was increasingly lost with acid hydrolysis
with increasing time and molarity of the acid solution
(FR=116.2 - 6.6T - 50.5M, r2=0.63, P<0.01, where
FR is the percent of fructose, T is the time of hydrolysis
in hours and M is the molarity of acid solution). Greub
and Wedin9 and Grotelueschen and Smith8 also
observed a loss of fructose by hydrolysis with 0.1m
H2SO4 at 100°C for 1h, or under more acidic
conditions. The latter authors, however, did not
observe this loss when they hydrolysed the samples
with 0.0025 and 0.01M H2SO4. Considering that the
samples evaluated in the present study basically
consisted of cereal grains and hay of a tropical grass,
which store energy in the form of starch, it is probable
that the effect of a possible loss of fructose was of no
importance. This may, however to cause signi®cant
errors in materials rich in fructose such as temperate
climate forage grasses, or sucrose.
Similar mean glucose concentrations were obtained
with the enzymatic hydrolysis method (amyloglucosi-
dase) and with acid hydrolysis only under conditions
of more intense acid hydrolysis (0.3m for 3h), as
shown in Figs 1 and 2. Under these conditions,
Figure 3. Effect of molarity of the acidsolution and time of hydrolysis on therelease of reducing sugars and glucosefrom hay and corn samples and meanglucose concentration in corn sampleshydrolysed with amyloglucosidase (n =3per treatment).
Figure 4. Effect of molarity of the acidsolution and time of hydrolysis on therelease of reducing sugars and glucosefrom corn starch samples, compared tomean glucose concentration obtained withthe enzymatic method (amyloglucosidase,where n =3 per treatment).
J Sci Food Agric 79:1112±1116 (1999) 1115
Acid and amyloglucosidase hydrolysis for estimating polysaccharides in feed
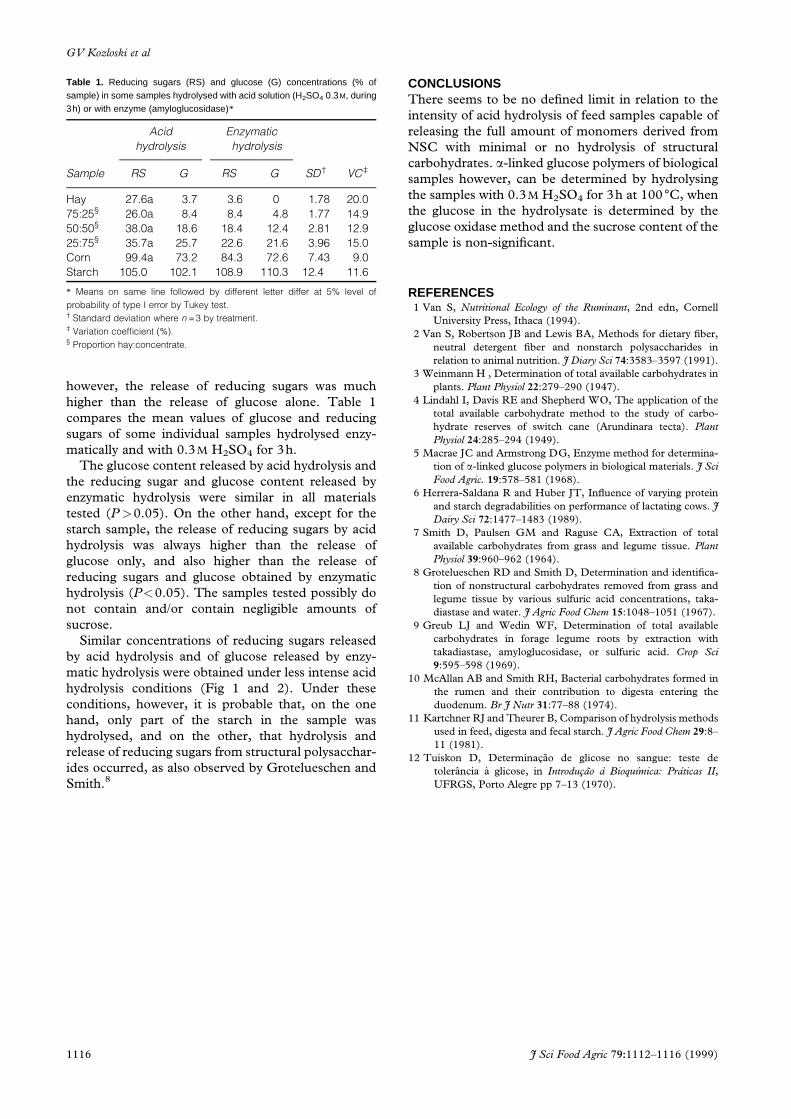
however, the release of reducing sugars was much
higher than the release of glucose alone. Table 1
compares the mean values of glucose and reducing
sugars of some individual samples hydrolysed enzy-
matically and with 0.3M H2SO4 for 3h.
The glucose content released by acid hydrolysis and
the reducing sugar and glucose content released by
enzymatic hydrolysis were similar in all materials
tested (P>0.05). On the other hand, except for the
starch sample, the release of reducing sugars by acid
hydrolysis was always higher than the release of
glucose only, and also higher than the release of
reducing sugars and glucose obtained by enzymatic
hydrolysis (P<0.05). The samples tested possibly do
not contain and/or contain negligible amounts of
sucrose.
Similar concentrations of reducing sugars released
by acid hydrolysis and of glucose released by enzy-
matic hydrolysis were obtained under less intense acid
hydrolysis conditions (Fig 1 and 2). Under these
conditions, however, it is probable that, on the one
hand, only part of the starch in the sample was
hydrolysed, and on the other, that hydrolysis and
release of reducing sugars from structural polysacchar-
ides occurred, as also observed by Grotelueschen and
Smith.8
CONCLUSIONSThere seems to be no de®ned limit in relation to the
intensity of acid hydrolysis of feed samples capable of
releasing the full amount of monomers derived from
NSC with minimal or no hydrolysis of structural
carbohydrates. a-linked glucose polymers of biological
samples however, can be determined by hydrolysing
the samples with 0.3M H2SO4 for 3h at 100°C, when
the glucose in the hydrolysate is determined by the
glucose oxidase method and the sucrose content of the
sample is non-signi®cant.
REFERENCES1 Van S, Nutritional Ecology of the Ruminant, 2nd edn, Cornell
University Press, Ithaca (1994).
2 Van S, Robertson JB and Lewis BA, Methods for dietary ®ber,
neutral detergent ®ber and nonstarch polysaccharides in
relation to animal nutrition. J Diary Sci 74:3583±3597 (1991).
3 Weinmann H , Determination of total available carbohydrates in
plants. Plant Physiol 22:279±290 (1947).
4 Lindahl I, Davis RE and Shepherd WO, The application of the
total available carbohydrate method to the study of carbo-
hydrate reserves of switch cane (Arundinara tecta). Plant
Physiol 24:285±294 (1949).
5 Macrae JC and Armstrong DG, Enzyme method for determina-
tion of a-linked glucose polymers in biological materials. J Sci
Food Agric. 19:578±581 (1968).
6 Herrera-Saldana R and Huber JT, In¯uence of varying protein
and starch degradabilities on performance of lactating cows. J
Dairy Sci 72:1477±1483 (1989).
7 Smith D, Paulsen GM and Raguse CA, Extraction of total
available carbohydrates from grass and legume tissue. Plant
Physiol 39:960±962 (1964).
8 Grotelueschen RD and Smith D, Determination and identi®ca-
tion of nonstructural carbohydrates removed from grass and
legume tissue by various sulfuric acid concentrations, taka-
diastase and water. J Agric Food Chem 15:1048±1051 (1967).
9 Greub LJ and Wedin WF, Determination of total available
carbohydrates in forage legume roots by extraction with
takadiastase, amyloglucosidase, or sulfuric acid. Crop Sci
9:595±598 (1969).
10 McAllan AB and Smith RH, Bacterial carbohydrates formed in
the rumen and their contribution to digesta entering the
duodenum. Br J Nutr 31:77±88 (1974).
11 Kartchner RJ and Theurer B, Comparison of hydrolysis methods
used in feed, digesta and fecal starch. J Agric Food Chem 29:8±
11 (1981).
12 Tuiskon D, DeterminacËaÄo de glicose no sangue: teste de
toleraÃncia aÁ glicose, in IntroducËaÄo aÁ BioquõÂmica: PraÂticas II,
UFRGS, Porto Alegre pp 7±13 (1970).
Table 1. Reducing sugars (RS) and glucose (G) concentrations (% ofsample) in some samples hydrolysed with acid solution (H2SO4 0.3M, during3h) or with enzyme (amyloglucosidase)*
Acid
hydrolysis
Enzymatic
hydrolysis
Sample RS G RS G SD² VC³
Hay 27.6a 3.7 3.6 0 1.78 20.0
75:25§ 26.0a 8.4 8.4 4.8 1.77 14.9
50:50§ 38.0a 18.6 18.4 12.4 2.81 12.9
25:75§ 35.7a 25.7 22.6 21.6 3.96 15.0
Corn 99.4a 73.2 84.3 72.6 7.43 9.0
Starch 105.0 102.1 108.9 110.3 12.4 11.6
* Means on same line followed by different letter differ at 5% level of
probability of type I error by Tukey test.² Standard deviation where n =3 by treatment.³ Variation coef®cient (%).§ Proportion hay:concentrate.
1116 J Sci Food Agric 79:1112±1116 (1999)
GV Kozloski et al