Embed Size (px)
Citation preview
BASIC INVESTIGATION
Comparison of 15:1, 15:2, and 30:2Compression-to-Ventilation Ratios forCardiopulmonary Resuscitation in a CanineModel of a Simulated, Witnessed CardiacArrestSung Oh Hwang, MD, Sun Hyu Kim, MD, Hyun Kim, MD, Yong Soo Jang, MD, Pei Ge Zhao, MD,Kang Hyun Lee, MD, Han Joo Choi, MD, Tae Yong Shin, MD
AbstractObjectives: This experimental study compared the effect of compression-to-ventilation (CV) ratios of15:1, 15:2, and 30:2 on hemodynamics and resuscitation outcome in a canine model of a simulated, wit-nessed ventricular fibrillation (VF) cardiac arrest.
Methods: Thirty healthy dogs, irrespective of species (mean ± SD, 19.2 ± 2.2 kg), were used in this study.A VF arrest was induced. The dogs received cardiopulmonary resuscitation (CPR) and were divided intothree groups based on the applied CV ratios of 15:1, 15:2, and 30:2. After 1 minute of untreated VF,4 minutes of basic life support (BLS) was performed. At the end of the 4 minutes, the dogs were defibril-lated with an automatic external defibrillator (AED) and advanced cardiac life support (ACLS) effortswere continued for 10 minutes or until restoration of spontaneous circulation (ROSC) was attained,whichever came first.
Results: None of the hemodynamic parameters, and arterial oxygen profiles was significantly differentbetween the three groups during BLS- and ACLS-CPR. Eight dogs (80%) from each group achievedROSC during BLS and ACLS. The survival rate was not different between the three groups. In the 15:1and 30:2 groups, the number of compressions delivered over 1 minute were significantly greater than inthe 15:2 group (73.1 ± 8.1 and 69.0 ± 6.9 to 56.3 ± 6.8; p < 0.01). The time for ventilation during whichcompressions were stopped at each minute was significantly lower in the 15:1 and 30:2 groups than inthe 15:2 group (15.4 ± 3.9 and 17.1 ± 2.7 to 25.2 ± 2.6 sec ⁄ min; p < 0.01).
Conclusions: In a canine model of witnessed VF using a simulated scenario, CPR with three CV ratios,15:1, 15:2, and 30:2, did not result in any differences in hemodynamics, arterial oxygen profiles, andresuscitation outcome among the three groups. CPR with a CV ratio of 15:1 provided comparable chestcompressions and shorter pauses for ventilation between each cycle compared to a CV ratio of 30:2.
ACADEMIC EMERGENCY MEDICINE 2008; 15:183–189 ª 2008 by the Society for Academic EmergencyMedicine
Keywords: cardiopulmonary resuscitation, chest compression, hemodynamics
T he optimal compression-to-ventilation (CV) ratiofor cardiopulmonary resuscitation (CPR) stillremains controversial. Although the CV ratio of
30:2 was recommended in the American Heart Associa-
tion 2005 guidelines for CPR and emergency cardiovas-cular care, further validation of this guideline is needed.1
Interruption of chest compressions during CPR is detri-mental to maintaining the coronary perfusion pressure(CPP), and the controversy over CV ratio is focused onhow to minimize interruption of chest compressions dur-ing CPR. A higher CV ratio may deliver more compres-sions per minute and decrease interruptions forventilation.2 However, a higher CV ratio or continuouscompressions might also be associated with an increasein rescuer fatigue and ⁄ or a decrease in compressionquality.3–5 Chest compression-only CPR might be asgood as CPR with ventilation for a successful outcome,6
ª 2008 by the Society for Academic Emergency Medicine ISSN 1069-6563doi: 10.1111/j.1553-2712.2008.00026.x PII ISSN 1069-6563583 183
From the Wonju College of Medicine, Yonsei University (SOH,HK, YSJ, PGZ, KHL, HJC, TYS), Wonju, Kangwondo; and theWoolsan College of Medicine, Woolsan University (SHK),Woolsan, Republic of Korea.Received June 15, 2007; revisions received August 17 andSeptember 24, 2007; accepted October 2, 2007.Address for correspondence and reprints: Sung Oh Hwang,MD; e-mail: [email protected].
but the advantage of increased blood flow is offset byemerging arterial desaturation after 1.5 to 2 minutes ofCPR, with progressively less oxygen being delivered tothe body tissues.7
In a real situation involving resuscitating a victimwith out-of-hospital cardiac arrest, usually a bystander,rather than a healthcare provider, performs basic lifesupport (BLS), including CPR and first defibrillationwith an automated external defibrillator (AED) duringthe first several minutes. CV ratio is a component ofBLS only during the first several minutes of attemptedresuscitation because healthcare providers performcontinuous compressions without pauses for ventilationonce an advanced airway is in place during advancedcardiac life support (ACLS). For this reason, the effectof various CV ratios should be tested during the firstseveral minutes of cardiac arrest.
The aim of this experimental study was to comparethe effects of CV ratios of 15:2, 30:2, and 15:1 on hemo-dynamics and resuscitation outcome in a canine modelof simulated, witnessed, ventricular fibrillation (VF) car-diac arrest. We designed this study to investigate short-term survival as a primary outcome and to comparehemodynamic variables and arterial oxygen profiles.
METHODS
Study DesignThis was an experimental protocol using dogs to assessvarious CV ratios. The study was reviewed andapproved by the Animal Research Committee of theWonju College of Medicine, Yonsei University.
Animal SubjectsThirty healthy dogs, irrespective of species, were usedin this study. The dogs were initially sedated with400 mg of intramuscular ketamine (Ketalar, YuhanCorp., Seoul, Korea) and 0.3 mg ⁄ kg intramuscular xyla-zine (Rompun, Bayer Animal Health Corp., Ansan-Shi,Korea) and then further sedated with 200 mg of intrave-nous ketamine. The thoraces of all dogs were shavedby razor for application of the AED pads to the chest.After sedation, endotracheal intubation was done witha cuffed endotracheal tube. Electrocardiographic (ECG)monitoring was recorded continuously. Under asepticconditions, the dogs were positioned supine and rightfemoral artery cannulation was done using the Selding-er method. Aortic blood pressures were recorded con-tinuously, with a micromanometer-tipped catheter(5 Fr, Millar Instruments, Inc., Houston, TX). An intro-ducer sheath (7.5 Fr, Arrow International Inc., Reading,PA) was placed in the right external jugular vein, and amicromanometer-tipped catheter was advanced to theright atrium to measure the right atrial pressure. Anintroducer sheath was placed in the right femoral veinfor infusion of normal saline and intravenous medica-tions. Left femoral artery cannulation was performedfor arterial blood gas analysis. The right common caro-tid artery was surgically exposed, and an ultrasonicflow probe (T106, Transonic Systems Inc., Ithaca, NY)was placed around it to quantify blood flow. All dogswere treated with a heparin bolus (100 units ⁄ kg intrave-nously) once catheters were in place to prevent throm-
bosis formation. During the preparation, the dogs wereventilated with room air via a volume control ventilator(MDS Matrix 3000, Orchard Park, NY). The tidal volumewas initially set at 12 mL ⁄ kg and the ventilator rate at12 breaths per minute.
Study ProtocolAfter baseline data were collected, a pacing catheter(5 Fr, bipolar lead, Arrow International Inc.) was posi-tioned in the right ventricle. VF was then induced bydelivering alternating electrical current at 60 Hz to theendocardium and confirmed by the ECG waveform anda decline in aortic pressure. Once VF was induced, theventilator was disconnected from the endotracheal tube.After 1 minute of untreated VF, mimicking the activity ofa bystander recognizing cardiac arrest and calling forhelp, 4 minutes of BLS was performed. Positive bag valveventilations were delivered with a resuscitator bag (sili-cone resuscitator 870040, Laerdal Medical, Stavanger,Norway), with controlled peak airway pressure of40 mm Hg. During BLS, each ventilation was given afterperforming a head-tilt chin-lift maneuver to mimic anairway maneuver by a bystander and make the rescueruse of time realistic. Approximately 300 to 400 mL oftidal volume for 1 second was delivered per breath.
The dogs received CPR and were randomly assignedto three groups: 1) the 15:1 group, provided with a man-ual rescue breath followed by 15 manual chest compres-sions; 2) the 15:2 group, provided with two manualrescue breaths followed by 15 manual compressions; or3) the 30:2 group, provided with two manual rescuebreaths followed by 30 manual compressions. Chestcompression was performed by emergency medicineresidents trained and experienced in BLS and ACLS withthe metronome-guided rate of 100 compressions perminute. At the end of the 4-minute BLS-CPR, dogs weredefibrillated with an AED (CU-ER1, CU Medical SystemsInc., Wonju Korea) delivering 80 J (�4 J ⁄ kg) of energy. IfVF persisted or asystole developed, 1 mg of epinephrinewas administered intravenously, and all resuscitationefforts including provision of 100% oxygen were startedfollowing the 2005 ACLS pulseless arrest algorithm.11
Shock delivery was performed every 2 minutes duringCPR, and 1 mg of epinephrine was administered intrave-nously every 3 minutes during CPR. ACLS-CPR effortswere continued for 10 minutes unless restoration ofspontaneous circulation (ROSC) was attained. ROSC wasdefined as an unassisted pulse with a systolic arterialpressure of >50 mm Hg and a pulse pressure of>20 mm Hg lasting more than 1 minute. If ROSC was notachieved by 10 minutes, despite all efforts, the experi-ment was terminated. If ROSC was attained, dogs wereobserved for 2 hours of survival without any pharmaco-logic support and then euthanized by an intravenousinjection of potassium chloride.
MeasurementsData were digitized by a digital recording system (Pow-erlab, AD Instruments, Colorado Springs, CO). All theparameters (aortic and right atrial pressure and com-mon carotid blood flow) were recorded continuouslyand analyzed at baseline, between Minutes 0 and 4 ofCPR (1 to 5 min after VF cardiac arrest), between
184 Hwang et al. • COMPRESSION-TO-VENTILATION RATIOS
Minutes 4 and 14 of CPR (5 to 15 min after VF cardiacarrest), and 2 hours after ROSC if ROSC was achieved.CPP during CPR was calculated as the differencebetween aortic pressure and right atrial pressure in therelaxation phase using an electronic subtraction unit.Gradients of peak aortic pressures and CPPs from thefirst two compressions and the last two compressionswere calculated by averaging the differences betweenmean pressures of the first two compressions and thoseof the last two compressions during BLS. End tidal CO2
(ETCO2), tidal volumes, and oxygen saturation werecontinuously measured (CO2SMO Plus, NovametrixMedical Systems, Wallingford, CT). Arterial blood gasspecimens were collected from the left femoral arteryat baseline (before cardiac arrest) and at 1, 5, 9, and15 minutes after cardiac arrest. Arterial blood gas anal-yses including oxygen saturation, pCO2, pO2, pH, baseexcess, HCO3
–, hemoglobin, and hematocrit were donewith a blood gas analyzer (i-STAT1, Abbott Laborato-ries, Abbott Park, IL). Interruption time of compres-sions was measured as a time interval between theonset of aortic pressure drop from the last compressionof the previous cycle and a very beginning of aorticpressure rise from the first compression of the cycle.Time for ventilation was measured as a time intervalbetween an initial rise of inspiratory flow and the onsetof expiratory upstroke of ETCO2 curve. Compressionsdelivered over 1 minute, interruption time of compres-sions over 1 minute, and time for ventilation at eachcycle during BLS-CPR were calculated.
Data AnalysisFor analysis, hemodynamic data during BLS and ACLSwere averaged from values measured during the entireperiod of BLS and ACLS. Data were summarized as
mean ± standard error of the mean and coded into acomputerized data processing software package (SPSSfor Windows 12.0, SPSS Inc., Chicago, IL). One-wayanalysis of variance was used when appropriate tocompare the three groups with regard to the aforemen-tioned variables including hemodynamic data, arterialblood gas profiles, compressions delivered per minute,and pauses for ventilation. Post hoc comparison wasperformed with Tukey honestly significant differencepost hoc test. Statistical differences of ROSC rate and2-hour survival rate between the three groups wereanalyzed using the chi-square test. p-Values below 0.05were defined as statistically significant.
RESULTS
The mean (± SD) weight of the dogs was 19.2 ± 2.2 kgwith no significant difference between the threegroups. There were no significant differences in aorticpressure, right atrial pressure, CPP, and common caro-tid blood flow between the three groups before VFinduction.
Hemodynamic Parameters during BLS andACLS-CPRNone of the hemodynamic parameters were signifi-cantly different among the three groups duringBLS-and ACLS-CPR (Table 1). Aortic pressure at peakcompression and common carotid blood flow duringACLS tended to be higher in the 30:2 group than the15:1 and 15:2 groups, but this trend did not reach statis-tical significance. There were no differences ingradients of aortic pressures and CPPs from the firsttwo compressions and the last two compressions of a
Table 1Hemodynamic Parameters during BLS and ACLS CPR
Characteristics
CV Ratios
p-Value15:1 15:2 30:2
BLSAortic pressure (mm Hg)
Compression 85.7 ± 5.9 94.0 ± 6.60 71.7 ± 5.9 0.546Relaxation 25.2 ± 2.3 31.3 ± 6.3 24.5 ± 3.4 0.947Mean aortic pressure (mm Hg) 42.1 ± 2.7 46.6 ± 6.9 37.5 ± 4.9 0.467
Right atrial pressure (mm Hg)Compression 96.4 ± 10.5 78.6 ± 6.0 82.5 ± 4.1 0.217Relaxation 6.0 ± 1.4 7.3 ± 1.9 5.2 ± 4.4 0.649CPP (mm Hg) 22.4 ± 4.3 22.1 ± 6.2 17.3 ± 4.1 0.722Common carotid blood flow (mL ⁄ min) 29.3 ± 10.8 29.0 ± 6.0 43.2 ± 10.1 0.480
ACLS (after epinephrine injection)Aortic pressure (mm Hg)Compression 83.6 ± 8.3 90.0 ± 10.1 101.5 ± 10.6 0.451Relaxation 25.5 ± 3.7 30.4 ± 6.0 27.4 ± 6.1 0.810Mean aortic pressure (mm Hg) 44.9 ± 6.8 50.3 ± 8.3 52.1 ± 7.8 0.707
Right atrial pressure (mm Hg)Compression 85.5 ± 17.5 75.4 ± 8.9 86.1 ± 7.1 0.768Relaxation 4.0 ± 1.4 5.1 ± 2.4 3.1 ± 1.2 0.737CPP (mm Hg) 18.3 ± 4.6 20.9 ± 8.3 18.9 ± 5.7 0.956Common carotid blood flow (mL ⁄ min) 22.1 ± 3.7 19.3 ± 5.6 34.3 ± 12.9 0.408
BLS ¼ basic life support; ACLS ¼ advanced cardiac life support; CPR ¼ cardiopulmonary resuscitation; CV ¼ compression-to-ventilation; CPP ¼ coronary perfusion pressure.Data are reported as mean ± SD.
ACAD EMERG MED • February 2008, Vol. 15, No. 2 • www.aemj.org 185
CPR cycle among the three groups (Table 2). Aorticpressure at peak compression between the first twocompressions and last two compressions during BLS-CPR tended to be higher in the 30:2 group than the 15:1and 15:2 groups, but this trend did not reach statisticalsignificance.
Arterial Blood Gas AnalysisArterial blood oxygen saturation declined below 90%after 4 minutes of BLS-CPR and was maintained above80% during BLS- and ACLS-CPR in all groups. Therewere no significant differences in arterial blood gasanalysis at baseline, immediately after VF and first defi-brillation, and 9 and 15 minutes after initiation of theexperiment between the three groups (Table 3).
Resuscitation OutcomeThe success rate of defibrillation was 70% in the 15:1group and 60% in the 15:2 and 30:2 groups at the firstshock. There were no significant differences in the suc-cess rate of defibrillation during ACLS-CPR or hemody-namics during the compressions before defibrillationbetween the three groups.
Eight dogs (80%) of each group achieved ROSC dur-ing ACLS. Time to ROSC was not different between thethree groups (6.8 ± 3.0 min in 15:1 group, 7.7 ± 3.3 minin 15:2 group, and 7.2 ± 4.4 min in 30:2 group; p > 0.05).Two-hour survival rate was 60% in the 15:1 group, 60%in the 15:2 group, and 70% in the 30:2 group. The
Table 2Hemodynamic Differences of First Two Compressions and LastTwo Compressions during BLS
Characteristics
CV Ratios
p-Value15:1
(n = 10)15:2
(n = 10)30:2
(n = 10)
Aortic pressure (mm Hg)Compression 10.1 ± 3.7 13.4 ± 3.0 19.6 ± 6.0 0.316Relaxation 5.8 ± 1.0 7.4 ± 2.2 7.5 ± 1.7 0.746
CPP (mm Hg) 5.8 ± 1.2 7.0 ± 1.9 7.3 ± 1.6 0.776
BLS ¼ basic life support; CV ¼ compression-to-ventilation;CPP ¼ coronary perfusion pressure.Data are reported as mean ± SD.
Table 3Arterial Blood Gases*
Characteristics
CV Ratios
p-Value15:1 15:2 30:2
Baseline, before VFpH 7.50 ± 0.04 7.46 ± 0.07 7.48 ± 0.03 0.861SO2 97.6 ± 1.0 97.6 ± 0.9 98.4 ± 0.2 0.728pO2 (mm Hg) 101.5 ± 6.4 100.7 ± 7.7 99.4 ± 4.0 0.968pCO2 (mm Hg) 16.2 ± 2.9 17.0 ± 3.7 14.1 ± 1.4 0.745HCO3 (mmol ⁄ L) 11.8 ± 1.1 11.5 ± 1.5 10.5 ± 0.9 0.693Base excess –11.5 ± 1.1 –12.4 ± 2.0 –12.9 ± 1.1 0.775
1 min, VFpH 7.54 ± 0.05 7.52 ± 0.07 7.49 ± 0.04 0.753SO2 96.3 ± 1.4 97.7 ± 0.8 97.9 ± 0.2 0.406pO2 (mm Hg) 82.3 ± 7.4 92.1 ± 6.0 92.3 ± 5.0 0.436pCO2 (mm Hg) 13.7 ± 2.4 10.2 ± 1.3 12.1 ± 1.6 0.432HCO3 (mmol ⁄ L) 10.0 ± 1.0 8.7 ± 1.4 7.7 ± 1.3 0.409Base excess –11.3 ± 1.5 –14.1 ± 2.4 –14.1 ± 1.3 0.395
5 min, at defibrillationpH 7.34 ± 0.05 7.31 ± 006 7.39 ± 0.05 0.538SO2 87.3 ± 4.0 82.4 ± 6.0 89.6 ± 2.7 0.506pO2 (mm Hg) 63.8 ± 5.8 63.1 ± 10.3 66.8 ± 8.2 0.945pCO2 (mm Hg) 15.5 ± 2.8 17.7 ± 3.6 14.7 ± 1.5 0.725HCO3 (mmol ⁄ L) 7.7 ± 1.3 8.6 ± 1.4 8.5 ± 0.5 0.850Base excess –17.3 ± 1.1 –17.7 ± 1.7 –16.5 ± 1.0 0.797
9 min, during ACLSpH 7.29 ± 0.07 7.17 ± 0.05 7.25 ± 0.03 0.303SO2 91.1 ± 3.7 80.1 ± 7.3 88.3 ± 2.6 0.291pO2 (mm Hg) 80.7 ± 7.0 65.0 ± 8.7 66.3 ± 5.6 0.256pCO2 (mm Hg) 18.1 ± 3.1 25.9 ± 6.3 15.9 ± 1.0 0.218HCO3 (mmol ⁄ L) 7.9 ± 0.6 8.7 ± 1.3 7.0 ± 0.6 0.384Base excess –18.6 ± 1.0 –19.9 ± 1.3 –20.3 ± 0.9 0.539
15 minpH 7.25 ± 0.05 7.14 ± 0.05 7.22 ± 0.04 0.261SO2 91.0 ± 3.0 85.9 ± 3.8 85.3 ± 5.5 0.579pO2 (mm Hg) 79.0 ± 6.8 75.1 ± 8.8 67.0 ± 6.3 0.491pCO2 (mm Hg) 15.9 ± 2.4 19.5 ± 3.2 15.6 ± 2.1 0.511HCO3 (mmol ⁄ L) 6.6 ± 0.4 6.4 ± 1.1 6.1 ± 0.5 0.893Base excess –20.8 ± 0.9 –22.6 ± 1.4 –21.8 ± 0.9 0.489
CV ¼ compression-to-ventilation; VF ¼ ventricular fibrillation; ACLS ¼ advanced cardiac life support.Data are reported as mean ± SD.
186 Hwang et al. • COMPRESSION-TO-VENTILATION RATIOS
survival rate was not different between the threegroups (Table 4).
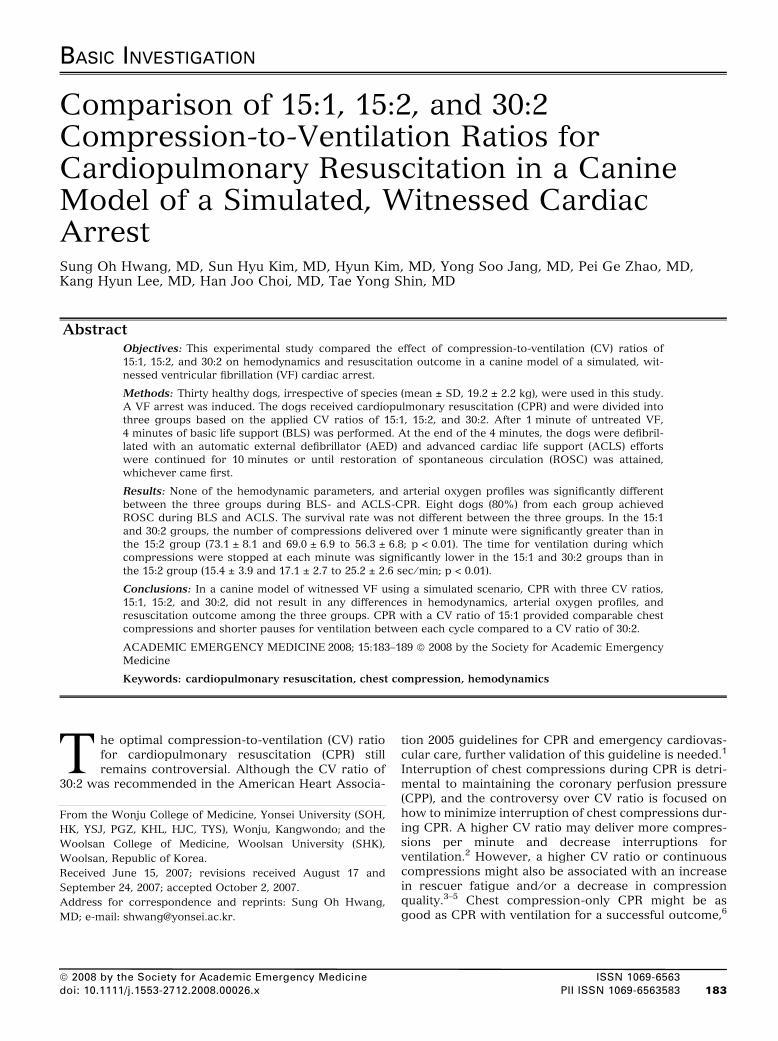
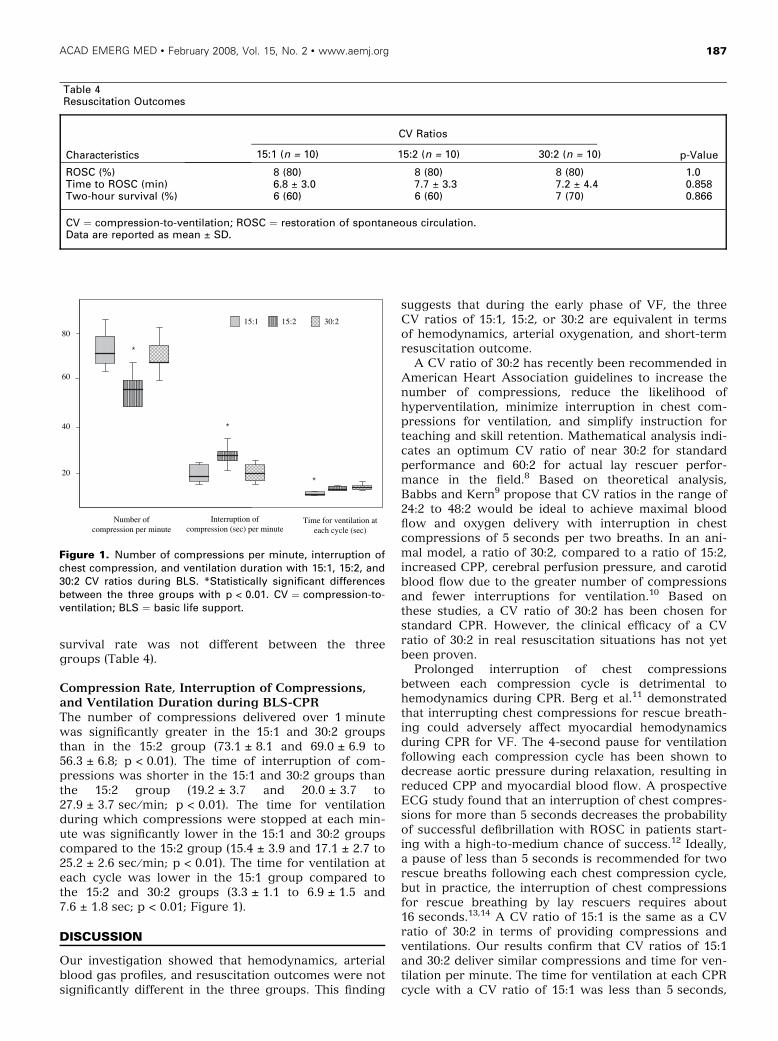
Compression Rate, Interruption of Compressions,and Ventilation Duration during BLS-CPRThe number of compressions delivered over 1 minutewas significantly greater in the 15:1 and 30:2 groupsthan in the 15:2 group (73.1 ± 8.1 and 69.0 ± 6.9 to56.3 ± 6.8; p < 0.01). The time of interruption of com-pressions was shorter in the 15:1 and 30:2 groups thanthe 15:2 group (19.2 ± 3.7 and 20.0 ± 3.7 to27.9 ± 3.7 sec ⁄ min; p < 0.01). The time for ventilationduring which compressions were stopped at each min-ute was significantly lower in the 15:1 and 30:2 groupscompared to the 15:2 group (15.4 ± 3.9 and 17.1 ± 2.7 to25.2 ± 2.6 sec ⁄ min; p < 0.01). The time for ventilation ateach cycle was lower in the 15:1 group compared tothe 15:2 and 30:2 groups (3.3 ± 1.1 to 6.9 ± 1.5 and7.6 ± 1.8 sec; p < 0.01; Figure 1).
DISCUSSION
Our investigation showed that hemodynamics, arterialblood gas profiles, and resuscitation outcomes were notsignificantly different in the three groups. This finding
suggests that during the early phase of VF, the threeCV ratios of 15:1, 15:2, or 30:2 are equivalent in termsof hemodynamics, arterial oxygenation, and short-termresuscitation outcome.
A CV ratio of 30:2 has recently been recommended inAmerican Heart Association guidelines to increase thenumber of compressions, reduce the likelihood ofhyperventilation, minimize interruption in chest com-pressions for ventilation, and simplify instruction forteaching and skill retention. Mathematical analysis indi-cates an optimum CV ratio of near 30:2 for standardperformance and 60:2 for actual lay rescuer perfor-mance in the field.8 Based on theoretical analysis,Babbs and Kern9 propose that CV ratios in the range of24:2 to 48:2 would be ideal to achieve maximal bloodflow and oxygen delivery with interruption in chestcompressions of 5 seconds per two breaths. In an ani-mal model, a ratio of 30:2, compared to a ratio of 15:2,increased CPP, cerebral perfusion pressure, and carotidblood flow due to the greater number of compressionsand fewer interruptions for ventilation.10 Based onthese studies, a CV ratio of 30:2 has been chosen forstandard CPR. However, the clinical efficacy of a CVratio of 30:2 in real resuscitation situations has not yetbeen proven.
Prolonged interruption of chest compressionsbetween each compression cycle is detrimental tohemodynamics during CPR. Berg et al.11 demonstratedthat interrupting chest compressions for rescue breath-ing could adversely affect myocardial hemodynamicsduring CPR for VF. The 4-second pause for ventilationfollowing each compression cycle has been shown todecrease aortic pressure during relaxation, resulting inreduced CPP and myocardial blood flow. A prospectiveECG study found that an interruption of chest compres-sions for more than 5 seconds decreases the probabilityof successful defibrillation with ROSC in patients start-ing with a high-to-medium chance of success.12 Ideally,a pause of less than 5 seconds is recommended for tworescue breaths following each chest compression cycle,but in practice, the interruption of chest compressionsfor rescue breathing by lay rescuers requires about16 seconds.13,14 A CV ratio of 15:1 is the same as a CVratio of 30:2 in terms of providing compressions andventilations. Our results confirm that CV ratios of 15:1and 30:2 deliver similar compressions and time for ven-tilation per minute. The time for ventilation at each CPRcycle with a CV ratio of 15:1 was less than 5 seconds,
Table 4Resuscitation Outcomes
Characteristics
CV Ratios
p-Value15:1 (n = 10) 15:2 (n = 10) 30:2 (n = 10)
ROSC (%) 8 (80) 8 (80) 8 (80) 1.0Time to ROSC (min) 6.8 ± 3.0 7.7 ± 3.3 7.2 ± 4.4 0.858Two-hour survival (%) 6 (60) 6 (60) 7 (70) 0.866
CV ¼ compression-to-ventilation; ROSC ¼ restoration of spontaneous circulation.Data are reported as mean ± SD.
Number ofcompression per minute
Interruption ofcompression (sec) per minute
Time for ventilation ateach cycle (sec)
20
40
60
80
15:1 15:2 30:2
Figure 1. Number of compressions per minute, interruption ofchest compression, and ventilation duration with 15:1, 15:2, and30:2 CV ratios during BLS. *Statistically significant differencesbetween the three groups with p < 0.01. CV ¼ compression-to-ventilation; BLS ¼ basic life support.
ACAD EMERG MED • February 2008, Vol. 15, No. 2 • www.aemj.org 187

but those with CV ratios of 30:2 and 15:2 were longerthan 6 seconds. Differences in aortic pressure at peakcompression tended to be lower in the 15:1 group thanthe 30:2 or 15:2 group, which was reflected in less dete-rioration of hemodynamics in the 15:1 group due to theshorter pause between CPR cycles. Yannopoulos et al.15
demonstrated in an animal experiment that a reductionin the ventilation frequency, by increasing the CV ratiofrom 15:2 to 15:1, improved hemodynamics and vitalorgan perfusion pressures without compromising oxy-genation and acid–base balance by reducing intratra-cheal pressure. Therefore, a CV ratio of 15:1 has theadvantage of shortening the time for ventilation at eachCPR cycle over a CV ratio of 30:2, with comparablehemodynamics and arterial oxygen profiles. In addition,by providing only a single ventilation between com-pression sets, the rescuer can start the next cycle ofCPR without any need to wait for exhalation after giv-ing a breath. In this regard, providing a single ventila-tion between compression sets of any number mighthave practical advantages over any CV ratio with twoventilations.
In our study, we tested the effect of various CVratios for CPR during the first 5 minutes of VF. Whenan AED is present, the clinically relevant time inter-vals were a mean of 3.5 minutes from collapse toAED attachment and a further 0.9 minutes to thedelivery of the first defibrillation shock.16 We formu-lated a scenario of resuscitation with BLS and anAED shock performed by a bystander, followed byfull support of ACLS by healthcare providers. Thescenario consisted of 1 minute without CPR to checkthe response of the victim and activate the emergencymedical system; 4 minutes of BLS-CPR and the firstdefibrillation shock with an AED, mimicking immedi-ate response of a bystander; and 10 minutes of ACLS-CPR, mimicking treatment by healthcare providers.Once healthcare providers arrive at the scene and theadvanced airway is in place, a CV ratio is meaning-less, because pauses for ventilation are no longer nec-essary. Our scenario to test the effect of various CVratios represented a typical emergency medicalresponse including the early BLS-CPR, defibrillationwithin 5 minutes by a bystander, and ACLS-CPR byhealthcare providers for a witnessed, out-of-hospital,cardiac arrest.
LIMITATIONS
Pauses for ventilation were not identical to those in areal resuscitation situation, although our experimentalscenario did simulate a witnessed cardiac arrest withbystander CPR. The difficulty and time required to givethe breaths and the effectiveness of the breaths mightbe quite different in non-intubated humans than in intu-bated dogs. Therefore, the data from our study cannotbe extrapolated to layperson CPR. Second, our scenariosimulated an ideal response to the victim with out-of-hospital cardiac arrest witnessed by bystanders. Not allemergency medical systems experience this kind ofemergency response to victims with out-of-hospital car-diac arrest. Not all bystanders can perform CPR or defi-brillate the victim with an AED. Therefore, our study
results are limited to the situation where a bystander isfamiliar with CPR, an AED is available, and the emer-gency medical response is adequate. Third, the intervalof untreated VF was only 1 minute in this study. Aftersuch a short period, there is minimal loss of vasculartone. Thus, perfusion achieved with any combination ofcompression and ventilations may be optimal. This situ-ation might minimize the opportunity to see differencesbetween CV ratios because of a ‘‘ceiling effect.’’ Fourth,compression-only CPR was not tested in our experi-ment. Several investigations have revealed that com-pression-only CPR resulted in similar or superiorresuscitation outcomes, compared to CPR with variousCV ratios.17,18 In our cardiac arrest model with a shortdowntime, compression-only CPR might be as effectiveas the other modes of ventilation. Finally, because wecould not measure actual depth of compression, thequality of CPR might affect the results, although allemergency residents have been certified as a CPRprovider.
CONCLUSIONS
In a canine model of witnessed VF using a simulatedscenario, CPR with three CV ratios, 15:1, 15:2, and 30:2,did not result in any differences in hemodynamics, arte-rial oxygen profiles, and resuscitation outcomes amongthe three groups. CPR with a CV ratio of 15:1 providedcomparable chest compressions and shorter pauses forventilation between each cycle compared to a CV ratioof 30:2.
This study was supported by a grant (02-PJ3-PG6-EV01-001) fromMinistry of Health and Welfare, Republic of Korea.
References
1. 2005 American Heart Association Guidelines forCardiopulmonary Resuscitation and EmergencyCardiovascular Care, Part 4: Adult Basic Life Sup-port. Circulation. 2005; 112 Suppl IV:19–34.
2. Hostler D, Guimond G, Callaway C. A comparisonof CPR delivery with various compression-to-venti-lation ratios during two-rescuer CPR. Resuscitation.2005; 65:325–8.
3. Heidenreich JW, Berg RA, Higdon TA, Ewy GA,Kern KB, Sanders AB. Rescuer fatigue: standard ver-sus continuous chest-compression cardiopulmonaryresuscitation. Acad Emerg Med. 2006; 13:1020–6.
4. Ashton A, McCluskey A, Gwinnutt CL, Keenan AM.Effect of rescuer fatigue on performance of continu-ous external chest compression over 3 min. Resusci-tation. 2002; 55:151–5.
5. Odegaard S, Saether E, Steen PA, Wik L. Quality oflay person CPR performance with compression:ventilation ratios 15:2, 30:2 or continuous chestcompressions without ventilations on manikins.Resuscitation. 2006; 71:335–40.
6. Kern KB, Hilwig RW, Berg RA, Sanders AB, EwyGA. Importance of continuous chest compressionsduring cardiopulmonary resuscitation: improvedoutcome during a simulated single lay-rescuer sce-nario. Circulation. 2002; 105:645–9.
188 Hwang et al. • COMPRESSION-TO-VENTILATION RATIOS
7. Dorph E, Wik L, Stromme TA, Eriksen M, SteenPA. Oxygen delivery and return of spontaneouscirculation with ventilation:compression ratio 2:30versus chest compression only CPR in pigs. Resus-citation. 2004; 60:309–18.
8. Chamberlain D, Smith A, Colquhoun M, HandleyAJ, Kern KB, Wollard M. Randomized controlledtrials of staged teaching for basic life support. 2.Comparison of CPR performance and skill retentionusing either staged instruction or conventionalteaching. Resuscitation. 2001; 50:27–37.
9. Babbs C, Kern K. Optimum compression-to ventila-tion ratios in CPR under realistic, practical condi-tions: a physiological and mathematical analysis.Resuscitation. 2002; 54:147–57.
10. Yannopoulos D, Aufderheide TP, Gabrielli A, et al.Clinical and hemodynamic comparison of 15:2 and30:2 compression-to-ventilation ratios for cardiopul-monary resuscitation. Crit Care Med. 2006; 34:1444–9.
11. Berg RA, Sanders AB, Kern KB, et al. Adversehemodynamic effects of interrupting chest com-pressions for rescue breathing during cardiopulmo-nary resuscitation for ventricular fibrillation cardiacarrest. Circulation. 2001; 104:2465–70.
12. Eftestol T, Sunde K, Steen PA. Effects of interrupt-ing precordial compressions on the calculatedprobability of defibrillation success during out-of-hospital cardiac arrest. Circulation. 2002; 105:2270–3.
13. Assar D, Chamberlain D, Colquhoun M, et al. Ran-domized controlled trials of staged teaching forbasic life support. 1. Skill acquisition at bronzestage. Resuscitation. 2000; 45:7–15.
14. Chamberlain D, Smith A, Colquhoun M, HandleyAJ, Kern KB, Wollard M. Randomized controlledtrials of staged teaching for basic life support. 2.Comparison of CPR performance and skill retentionusing either staged instruction or conventionaltraining. Resuscitation. 2001; 50:27–37.
15. Yannopoulos D, Tang W, Roussos C, AufderheideTP, Idris AH, Lurie KG. Reducing ventilationfrequency during cardiopulmonary resuscitation ina porcine model of cardiac arrest. Resp Care. 2005;50:628–35.
16. Valenzuela TD, Roe DJ, Nichol G, Clark LL, SpaiteDW, Hardman RG. Outcomes of rapid defibrillationby security officers after cardiac arrest in casinos.N Engl J Med. 2000; 343:1206–9.
17. Sanders AB, Kern KB, Berg RA, Hilwig RW, Heid-enrich J, Ewy GA. Survival and neurologic outcomeafter cardiopulmonary resuscitation with fourdifferent chest compression-ventilation ratios. AnnEmerg Med. 2002; 40:553–62.
18. Kellum MJ, Kennedy KW, Ewy GA. Cardiocerebralresuscitation improves survival of patients without-of-hospital cardiac arrest. Am J Med. 2006;119:335–40.
ACAD EMERG MED • February 2008, Vol. 15, No. 2 • www.aemj.org 189