Embed Size (px)
Citation preview
Comparison Modeling of System Reliability for Future NASA Projects
Amanda M. Gillespie, ASQ CRE, SAlC
Mark W. Monaghan, Ph.D, SAlC
Yuan Chen, Ph.D, NASA LaRC
Key Words: RED, Importance Measure, Cut Set, Fussell-Vesely, Comparison Modeling
SUMMARY & CONCLUSIONS
A National Aeronautics and Space Administration(NASA) supported Reliability, Maintainability, andAvailability (RMA) analysis team developed a unique RMAanalysis methodology using cut set and importance measureanalysis in order to comparison model proposed avionicscomputing architectures. In this paper we will present thisefficient application of the RMA analysis methodology forimportance measures that includes Reliability Block Diagram(RED) Analysis, Comparison modeling, Cut Set Analysis, andImportance Measure Analysis. We will also demonstrate thatintegrating RMA early in the system design process as a keyto success by providing a fundamental decision metricsupporting design selection.
The RMA analysis methodology presented in this paperand applied to the avionics architectures enhances the usualway of predicting the need for redundancy based on failurerates or subject matter expert opinion. Using the REDs andthe minimal cut sets, along with the Fussell-Vesely (FV)factors, importance measures are calculated for eachfunctional element in the architectures [I]. This paperpresents an application of the FV importance measures andpresents an improved methodology for using importancemeasures in success space (instead of failure space) tocompare architectures. These importance measures are usedto determine which functional element would be most likely tocause a system failure, thus, quickly identifying the path toincrease the overall system reliability by either procuring morereliable functional elements or adding redundancy [2].
This application of the RMA analysis methodology, usingRBD analysis, cut set analysis, and the importance measureanalysis, allows the avionics design team to better understandand compare the vulnerabilities in each of the architectures,enabling them to address the deficiencies in the designarchitectures more efficiently, while balancing the need todesign for optimum weight and space allocations.
1 INTRODUCTION
A trade study was performed to evaluate various avionicscomputing architectures from the perspectives of reliability,mass, power, data integrity, software implementation, andhardware and software integration for future NASA programs.A set of RBD models were developed to analyze the reliability
of and rank the various computing system architectures.These reliability analysis modules allowed for ease andconsistency in calculating reliability, cut sets, and importancemeasures.
First the RED modules were created, and then cut setanalysis was performed to determine those functional elementsmost likely to cause a failure within the architecture, i.e.,which functional elements had the largest unreliability.Finally, FV importance measures were calculated for eachfunctional element in each of the architectures. Then identicalfunctional elements were grouped to allow for comparisonbetween the architectures and provide the understanding ofwhich functional elements had the most significant impact onsystem reliability.
2 SCOPE
This paper documents the reliability engineeringmethodology developed for the RBD comparison, cut setanalysis, importance analysis, and improvementrecommendations for the architectures for future NASAlaunch vehicles.
3 ASSUMPTIONS
To ensure that the RBD modules for each of thearchitectures were comparable, repeatable, and auditable,various assumptions were documented, including functionalelement failure rates, fault tolerance, mission duration, andcable and connector assumptions.
3.1 Functional element Failure Rates
The failure rates for the functional elements III thearchitectures were estimated based on the existing avionicssystem reliability databases. To facilitate comparison, thesame failure rates were assumed for the same functionalelements, interconnects, and topologies for the variousarchitectures. All functional elements were assumed to havean exponential failure rate distribution. Due to the proprietarynature of these failure rates, they will not be listed in thispaper.
The functional element failure rates were based onexisting avionics architectures used aircraft, and a failure rateenvironmental conversion was made to the prediction (to SFenvironment). The conversions were made in accordance with
the System Reliability Center (SRC) environmental matrix [3].
3.2 Fault Tolerance
Avionics systems have evolved over time to incorporatefault tolerance within the system architecture. The capabilityto survive a functional element fault has driven multipleavionics system configurations [4]. In the Delta family oflaunch vehicles, the avionics systems have evolved over timebased on reliability and fault tolerance [5]. Several examplesof various avionic system architectures are plausible. TheNASA avionic architecture team selected the systems to beevaluated based on fault tolerance capability.
The reliability analysis for the selected avionic systems tobe studied assumed one-fault tolerance for each functionelement, i.e., more than one failure in any single functionalelement was deemed to be a failure. The configuration of thefunctional elements provided the fault tolerance capability.For example, more than one of the three Inertial NavigationUnits (INU) would result in a system failure. In addition, onlyhard or non-recoverable failures of the functional elementswere considered in the analysis. The impact of a functionalelement operating in a degraded stated was not taken intoconsideration.
For a self-checking pair (SCP) functional elementconfiguration, it was assumed that, for the flight computers,switches, or buses, the self-checking pair consists of two flightcomputers or two switches or two buses, which needed to havedata agreement to be successful. Therefore, the SCPfunctional elements were in a series configuration forreliability calculations (2-of-2 in agreement for success).
For a triplex voter (TV), the functional unit configurationwas assumed to consist of three functional units plus majorityvoting logic, with the functional elements in a parallelconfiguration for reliability calculations (2-of-3 in agreementfor success).
3.3 Channelized and Fully-Cross Strapped Configurations
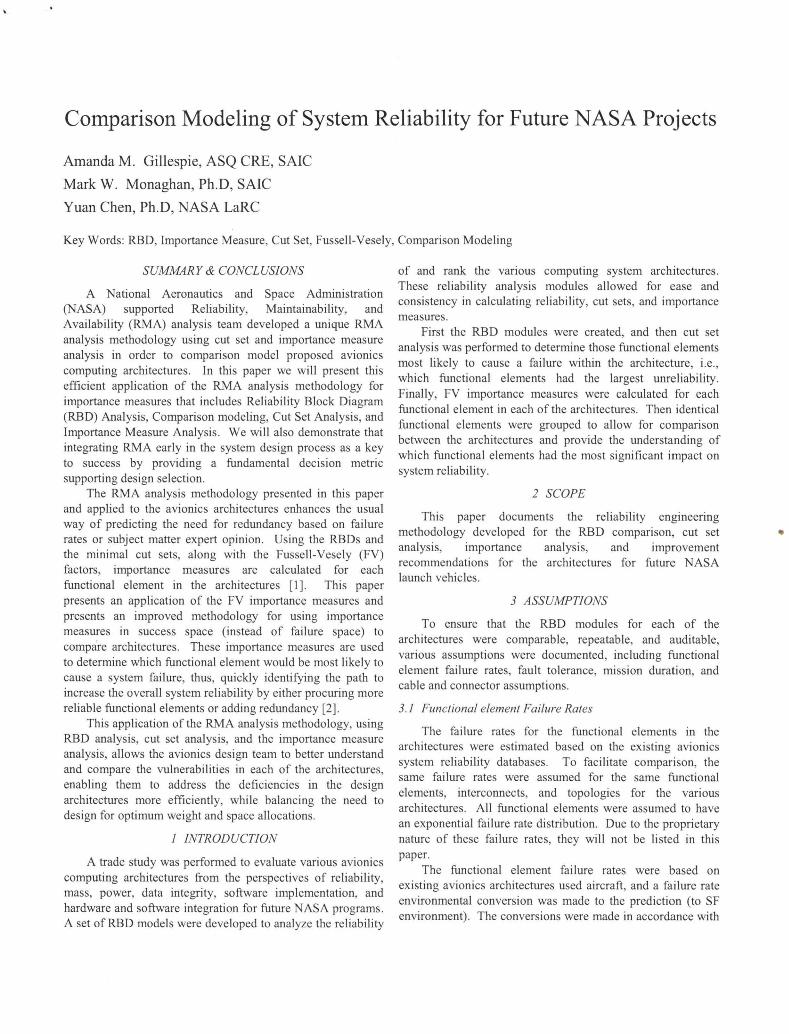
A channelized configuration was assumed to be such thatonly functional elements of the same channel could share data,i.e., Flight Computer-l (FC-l) only shared data with switch-l(SW-l), and SW-l could only share data with DataAcquisition Unit-l (DAU-I), Main Propulsion System-l(MPS-l), etc. Figure 1 shows the RED configuration of thechannelized architecture.
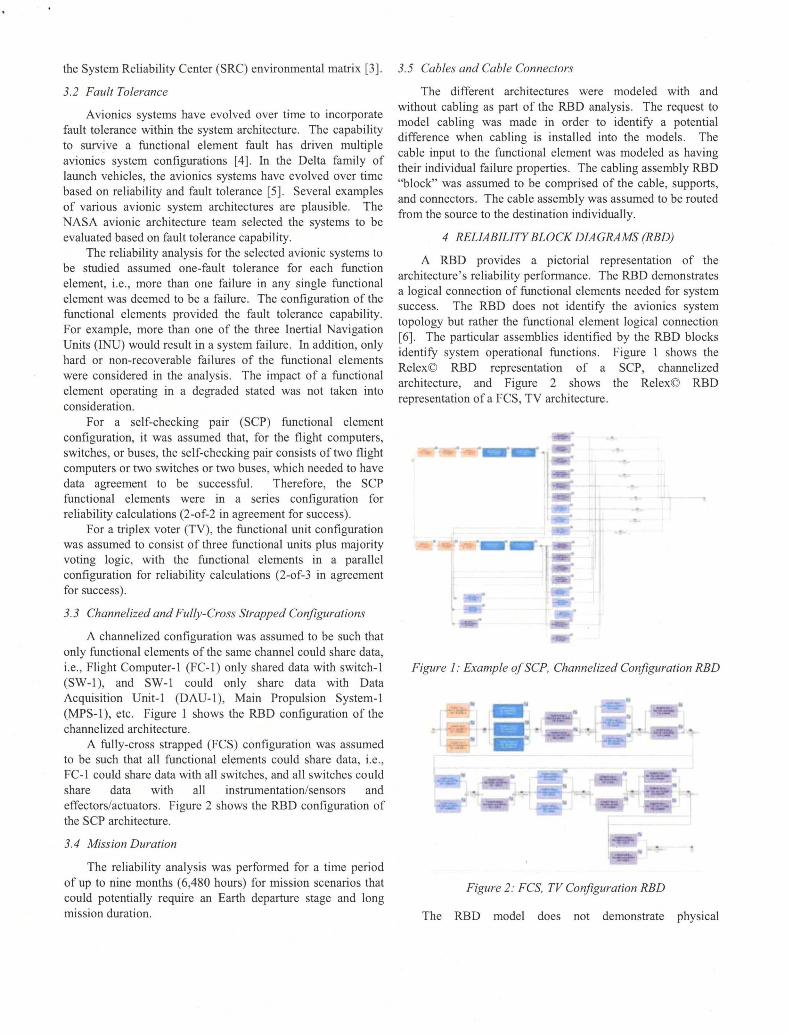
A fully-cross strapped (FCS) configuration was assumedto be such that all functional elements could share data, i.e.,FC-I could share data with all switches, and all switches couldshare data with all instrumentation/sensors andeffectors/actuators. Figure 2 shows the RED configuration ofthe SCP architecture.
3.4 Mission Duration
The reliability analysis was performed for a time periodof up to nine months (6,480 hours) for mission scenarios thatcould potentially require an Earth departure stage and longmission duration.
3.5 Cables and Cable Connectors
The different architectures were modeled with andwithout cabling as part of the RED analysis. The request tomodel cabling was made in order to identify a potentialdifference when cabling is installed into the models. Thecable input to the functional element was modeled as havingtheir individual failure properties. The cabling assembly RED"block" was assumed to be comprised of the cable, supports,and connectors. The cable assembly was assumed to be routedfrom the source to the destination individually.
4 RELIABILITYBLOCK DIAGRAMS (RED)
A RED provides a pictorial representation of thearchitecture's reliability performance. The RED demonstratesa logical connection of functional elements needed for systemsuccess. The RED does not identify the avionics systemtopology but rather the functional element logical connection[6]. The particular assemblies identified by the RED blocksidentify system operational functions. Figure 1 shows theRelex© RED representation of a SCP, channelizedarchitecture, and Figure 2 shows the Relex© REDrepresentation of a FCS, TV architecture.
Figure 1: Example ofSCP, Channelized Configuration RED
Figure 2: FCS, TV Configuration RED
The RED model does not demonstrate physical
configuration, cannot predict mass, does not estimate powerconsumption, and cannot guarantee the reliability valuesdemonstrated are capable of being achieved. However, whenREDs from different architectures or systems have the sameassumptions (failure rates, fault tolerance, etc), the REDs canprovide the ability to rank architectures by order of magnitudecomparison, in which case the design engineer can determinethe most reliable system architecture [7].
The architecture RED calculations take into account theobjectives and related engineering defined aspects of eachsystem configuration from an assessment of operationalsuccess. The RED is assembled in a success path for thesystem. The series representation indicates a system in whicheach block is dependent upon the success of the system.Parallel block configurations indicate a group of blocks thatprovide active redundancy or standby redundancy.
RELEX© was used as the primary reliability modelingtool. The various architectures were modeled into differentRED configurations using the failure rates as identified inTable 1. By using the same failure rates, the only variance inresults would be due to the RED configurations identifying thevariant in configuration of the architectures. This allows for anormalized comparison of the architectures.
In the RELEX© model the operation simulation (OpSim)model was used to depict the REDs. Results were calculatedusing both analytical and Monte-Carlo Simulation calculationswith 1,000,000 iterations. For the Monte-Carlo Simulations,the confidence level was set at 95%.
5 RED ANALYSIS AND RELIABILITY RESULTS
The various avionic architectures were evaluated; thequantity of functional elements included in each, and theredundancy configuration for each, and the architecture faulttolerance are listed below:
1. Fully Cross-Strapped Switched Triplex Voter(FCSSTV)
2. Partially Cross-Strapped Switched Triplex Voter(PCSSTV)
3. Channelized Bussed Triplex Voter (CBTV)4. Fully Cross-Strapped Self-Checking (FCSSC)5. Fully Cross-Strapped Bussed Self-Checking
(FCSBSC)6. Channelized Bussed Self-Checking (CBSC)
5.1 Architecture RED Reliability Results Summary
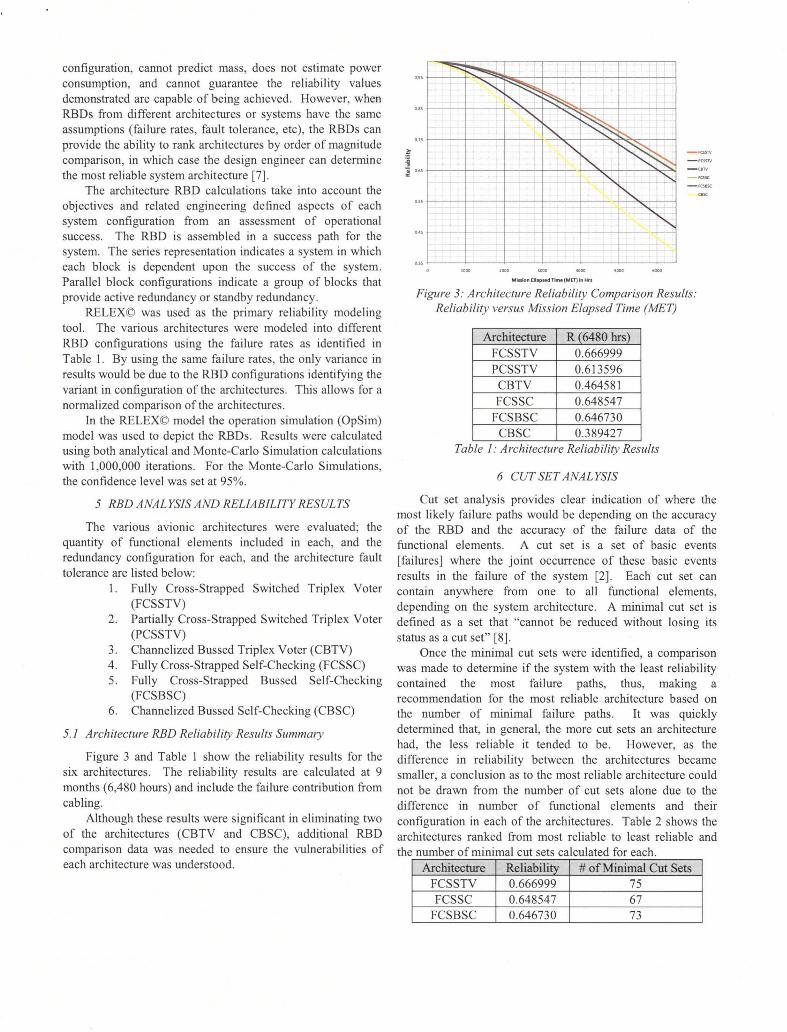
Figure 3 and Table 1 show the reliability results for thesix architectures. The reliability results are calculated at 9months (6,480 hours) and include the failure contribution fromcabling.
Although these results were significant in eliminating twoof the architectures (CBTV and CBSC), additional REDcomparison data was needed to ensure the vulnerabilities ofeach architecture was understood.
MIssion Ellapsed rime (MET) In Hrs
Figure 3: Architecture Reliability Comparison Results:Reliability versus Mission Elapsed Time (MET)
Architecture R (6480 hrs)FCSSTV 0.666999PCSSTV 0.613596
CBTV 0.464581FCSSC 0.648547
FCSBSC 0.646730CBSC 0.389427
Table 1: Architecture Reliability Results
6 CUT SET ANALYSIS
Cut set analysis provides clear indication of where themost likely failure paths would be depending on the accuracyof the RED and the accuracy of the failure data of thefunctional elements. A cut set is a set of basic events[failures] where the joint occurrence of these basic eventsresults in the failure of the system [2]. Each cut set cancontain anywhere from one to all functional elements,depending on the system architecture. A minimal cut set isdefined as a set that "cannot be reduced without losing itsstatus as a cut set" [8].
Once the minimal cut sets were identified, a comparisonwas made to determine if the system with the least reliabilitycontained the most failure paths, thus, making arecommendation for the most reliable architecture based onthe number of minimal failure paths. It was quicklydetennined that, in general, the more cut sets an architecturehad, the less reliable it tended to be. However, as thedifference in reliability between the architectures becamesmaller, a conclusion as to the most reliable architecture couldnot be drawn from the number of cut sets alone due to thedifference in number of functional elements and theirconfiguration in each of the architectures. Table 2 shows thearchitectures ranked from most reliable to least reliable andthe number of minimal cut sets calculated for each
Architecture Reliability # of Minimal Cut SetsFCSSTV 0.666999 75FCSSC 0.648547 67
FCSBSC 0.646730 73

Architecture Reliability # of Minimal Cut SetsPCSSTV 0.613596 195
CBTV 0.464581 267CBSC 0.389427 304
Table 2: Architecture Ranking and Number ofMinimal CutSets
7 IMPORTANCE MEASURES IN SUCCESS SPACE
Part of the decision analysis in selecting a specificarchitecture includes determining which of the functionalelements can lead to high risk scenarios. In order to assess theimportance of functional elements in the architecture or thesensitivity of the architecture reliability to changes in thefunctional element's input failure rates, several importance (orsensitivity) measures are available [2]. "Importance measuresquantify the criticality of a particular functional elementwithin a system design. They have been widely used as toolsfor identifying system weakness, and to prioritize reliabilityimprovement activities." [9]
The various measures are based on slightly differentinterpretations of the concept of functional elementimportance. Intuitively, the functional element importanceshould depend on the location of the functional element in thesystem, the reliability of the functional element in question,and the uncertainty in the estimate of functional elementreliability [10].
Typically, importance measures are used in failure space,or for Fault Tree Analysis (FTA). However, these importancefactors can be defined in success space (RBD Analysis) bycalculating the measures based on the total success of thesystem instead of the total risk. Some importance factors donot preserve their meaning in success space; therefore, theyfail to rank the functional elements appropriately. However,all importance measures provide one with a single number foreach functional element that can be used as part of acomparative analysis.
There are five importance measures generally acceptedfor use: Birnbaum, Criticality, Fussell-Vesely (FV), RiskReduction Worth (RRW), and Risk Achievement Worth(RAW) [11]. The Birnbaum measure depends on the systemconfiguration and is typically used to determine the degree ofredundancy and appropriateness of the system's logic. TheCriticality measure is a weighted version of the Birnbaum,which takes into account the ratio of functional element failureprobability and system reliability. The FV is the fractionalcontribution of risk to the system of all scenarios containingthat specified functional element versus the contribution of allfailure scenarios in a system. The RAW is the ratio of theconditional system unreliability if the functional element is notpresent (always failed) with the actual system unreliability.The RRW is the ratio of the actual system unreliability withthe (conditional system unreliability if the functional elementis replaced by a perfect functional element (never fails) [10].
Due to the limitation of the Relex© software program incalculating importance measures in success space, allimportance measures had to be calculated by hand. The
Birnbaum, Criticality, RAW, and RRW measures provedsignificantly time consuming, as the conditional reliabilitycalculations had to be made by performing multiple runs inRelex© to obtain values (20 or more runs per architecture).However, Relex© calculations quickly provided minimal cutset unreliability values that could then be used to calculate theFV for all functional elements.
Figure 4, Table 3, and Table 4 show the comparison ofthe Birnbaum, Criticality, FV, RRW, and RAW results for thefunctional elements in a single architecture. The Birnbaumand Criticality measures yielded nearly identical results andrankings when compared to each other. The FV measuresdiffered slightly from the Birnbaum and Criticality measures,but the primary contributor to the unreliability of thearchitecture (over 21 % of the unreliability in all threemeasures) remained the same. The RRW and RAW measuresseemed to provide little value added when applied to the cutsets in success space, with all functional elements havingsimilar contributions to the overall unreliability of thearchitecture, appearing to be based on failure rate data alone.Thus, making the RRW and RAW importance measuresseemingly unsuitable for use in success space.
When weighing the time needed to perform theimportance measure analysis versus the benefits that were tobe achieved, the FV was chosen in order to efficiently obtainthe quantitative importance measures for each functionalelement for a comparative analysis.
Figure 4: Comparison of Various Importance MeasureResults
Birnbaum Criticality FVFC 21.93% FC 21.32% FC 27.38%
INU 14.07% INU 14.92% PIC 18.54%RGA 14.07% RGA 14.92% ECU 13.63%PIC 12.62% PIC 11.01% HCU 12.62%ECU 10.59% ECU 9.74% INU 10.74%HCU 10.15% HCU 9.45% RGA 10.74%DAU 4.36% DAU 4.72% DAU 2.54%SW 3.97% SW 4.63% RCS 1.47%RCS 3.30% RCS 3.67% MPS 1.47%MPS 3.30% MPS 3.67% SW 0.76%
RRW RAW FV
FC 12.03% FC 13.42% FC 27.38%INU 11.00% INU 11.97% PIC 18.54%RGA 11.00% RGA 11.97% ECU 13.63%SW 10.45% SW 9.65% RCU 12.62%
TVC 10.41% TVC 9.04% INU 10.74%PIC 8.32% PIC 8.22% RGA 10.74%ECU 7.88% ECU 7.94% DAU 2.54%RCU 7.79% RCU 7.87% RCS 1.47%DAU 7.09% DAU 6.80% MPS 1.47%RCS 7.02% RCS 6.56% SW 0.76%MPS 7.02% MPS 6.56% TVC 0.12%
Table 4: Comparison ofRRW, RA W, and FV ImportanceMeasure Results
7.1 Fussell- Vesely (FV)Importance for Functional Elements
The FV is the probability that at least one minimal cut setthat contains the functional element (i) has failed at time (t),given that the system is failed at time (t) [10]. In other words,the functional element FV is the sum of the unreliability of theminimal cut sets containing the functional element, divided bythe sum of the unreliability of all of the system's minimal cutsets.
The functional element FV can be expressed aspercentage contribution to unreliability of the overall system(so that all functional element importance measures add to100% of the system unreliability). The functional element FVwas divided by the sum of all functional element FVs to obtainthe percentage contribution. The FV reflects how muchrelative improvement may be available from improvingperformance of a specific functional element. Change in thefailure rates of the functional elements (or adding redundancyto account for the high failure rate) with the highest FVpercent contribution will have the most significant effect onincreasing system reliability.
Once the functional element FV percent contributionswere calculated for all functional elements and allarchitectures, a comparison of functional element importancebetween the various architectures can be made. Theimplementation of the FV to compare functional elementswithin the different architectures proved somewhat moreinvolved than first anticipated. Most architectures containedredundancy with two or more of the same functional elementfunctions within each; however, there was not a one-to-onecorrespondence. For example, the TV architectures(FCSSTV, PCSSTV, and CBTV) contained three FCs, whilethe SCP architectures (FCSSC, FCSBSC, and CBSC)contained four FCs. Therefore, the functional elementfunctions were grouped for comparison by summing thecontributions of all like-functional elements in thearchitecture. Table 5 shows the example of how this was done
for FCsArchitecture FC-# FV% FC FV%
FC-l 9.12%FCSSTV FC-2 9.12% FC 27.36%
FC-3 9.12%
FC-I 6.66%PCSSTV FC-2 6.66% FC 19.98%
FC-3 6.66%
FC-I 15.83%CBTV FC-2 7.63% FC 39.29%
FC-3 15.83%
FC-IA 8.35%
FCSSCFC-IB 8.35%
FC 33.39%FC-2A 8.35%FC-2B 8.35%
FC-IA 8.51%
FCSBSCFC-IB 8.51%
FC 34.04%FC-2A 8.51%FC-2B 8.51%
FC-IA 11.08%
CBSCFC-IB 11.08%
FC 44.33%FC-2A 11.08%FC-2B 11.08%
Table 5: Example ofFunctIOnal element groupmgforImportance Measure Comparison
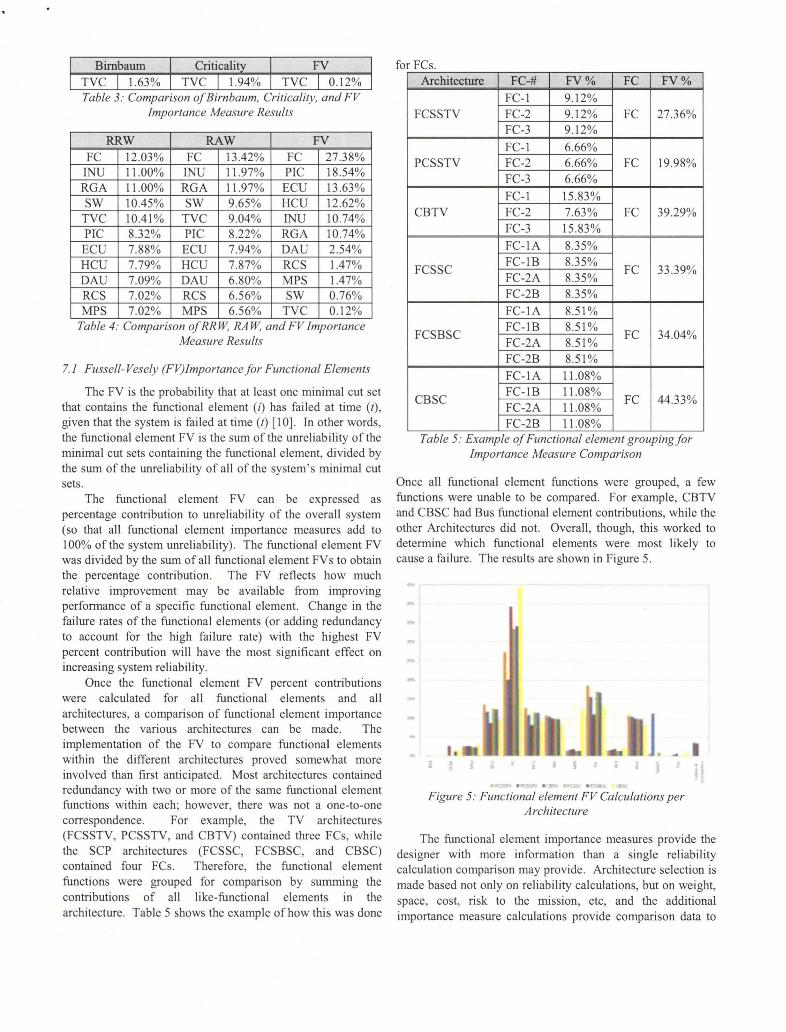
Once all functional element functions were grouped, a fewfunctions were unable to be compared. For example, CBTVand CBSC had Bus functional element contributions, while theother Architectures did not. Overall, though, this worked todetermine which functional elements were most likely tocause a failure. The results are shown in Figure 5.
Figure 5: Functional element FV Calculations perArchitecture
The functional element importance measures provide thedesigner with more information than a single reliabilitycalculation comparison may provide. Architecture selection ismade based not only on reliability calculations, but on weight,space, cost, risk to the mission, etc, and the additionalimportance measure calculations provide comparison data to
allow the designer to make more informed trade decisions in amore efficient and effective manner. The difference invulnerabilities of the architectures can easily be comparedusing the importance measure analysis.
Different distributions of the functional failurecontributions indicate different reliability improvement pathsfor the architectures. Intermediate states can be modeled toinclude the impact of failure data integrity on the reliabilityand integrity of the architectures. These results can be usednot only to determine the most efficient and cost-effective wayto increase reliability of the architecture.
REFERENCES
1. W.S. Gough, J. Riley, J.M. Koren, "A New Approach tothe Analysis of Reliability Block Diagrams," Proc. Ann.Reliability & Maintainability Symp. (Jan.) 1990, pp. 456464.
2. B.M. Ayyub, Risk Analysis in Engineering andEconomics, New York, Chapman & Hall/CRC, 2003.
3. D. Nicholls ed., System Reliability Toolkit, Reliabilityinformation Analysis Center (RAIC), 2005.
4. R. Hammett, "Design by Extrapolation: An Evaluation ofFault Tolerant Avionics," IEEE AESS Systems Magazine,(April) 2002.
5. J.M. Palsulich, BJ. Schinnerer, Launch VehiclesforLow-Cost Planetary Missions, Elsevier Science Ltd.,2002.
6. P.D.T. O'Connor, Practical Reliability Engineering, 4th
Edition, Wiley, 2006.7. M.L.O. e'Souza, T.R. de Carvalho, The Fault Avoidance
and The Fault Tolerance Approaches for Increasing theReliability ofAerospace and Automotive Systems, Societyof Automotive Engineers Inc., 2005.
8. W.R. Blischke, D.N. Prabhakar Murthy, Reliability:Modeling, Prediction, and Optimization, Wiley, 2000.
9. J.E. Ramierez-Marquez, D.W. Coit, "CompositeImportance Measures for Multi-State Systems with MultiState Functional elements," IEEE Transactions onReliability, vol. 54, (Sept) 2005, p.5l7.
10. M. Rausand, A. Hoyland, System Reliability Theory:Models, Statistical Methods, and Applications, 2nd
Edition, Wiley, 2003.11. 1. Apt, "Human Spaceflight Risk Management,"
Encyclopedia ofAerospace Engineering, Wiley, 2010.
ACKNOWLEDGMENTS
The authors would like to thank Glen (Spence) Hatfield,Duane H. Pettit, Joseph M. Schuh and Dr. Robert Hodson,who contributed to the development and review of the RMAanalysis methodology described in this paper.
BIOGRAPHIES
Amanda M. Gillespie, ASQ CRESAlC-LX-2Operations & Checkout Bldg, M7-0355Kennedy Space Center, FL 32899 USA
e-mail: [email protected]
Amanda M. Gillespie is a Reliability Engineer with SAIC atNASA KSC, FL. At KSC, Amanda has performed RMAanalysis for various NASA projects and programs. As a partof the KSC RMA team, along with Dr. Monaghan, Amandaworks with multiple engineering teams to evaluate andincrease the operational and inherent availability of thesystems. Amanda received her BS in Applied Mathematicsfrom the Georgia Institute of Technology in 2000. Amanda isa member of the American Society for Quality (ASQ)Reliability and Statistics Societies. Amanda received her ASQCertified Reliability Engineer (CRE) certification in January2011.
Mark W. Monaghan, Ph.DSAlC-LX-2Operations & Checkout Bldg, M7-0355Kennedy Space Center, FL 32899 USA
e-mail: [email protected]
Mark W. Monaghan received his Ph.D in Applied DecisionScience from Walden University in 2008. Mark is aReliability Engineer with SAlC at NASA KSC, FL. At KSC,Dr. Monaghan has performed RMA analysis for variousNASA projects and programs. As a part of the KSC RMAteam, along with Amanda Gillespie, Dr. Monaghan workswith multiple engineering teams to evaluate and increase theoperational and inherent availability of the systems. He is asenior member of Institute of Electrical and ElectronicEngineers (IEEE) Industrial Application Society (lAS). He isalso a member of American Institute of Aeronautics andAstronautics (AIAA) and the ASQ Reliability Societies.
Yuan Chen, PhDNASA LaRCElectronic Systems Branch5 N. Dryden Street, MS 488Hampton, VA 23681 USA
e-mail: [email protected]
Yuan Chen received her Ph.D. Reliability Engineering fromthe University of Maryland at College Park, Maryland, in1998, with a Graduate Fellowship from the National Instituteof Standards and Technologies. She is currently a seniormember of technical staff with the Electronic Systems Branch,NASA Langley Research Center, Hampton, Virginia. Dr.Chen's research area has been focused on the development ofand reliability methodologies on microelectronicdevices/systems for space applications. She has authored andco-authored over 40 technical papers, and is a senior memberofIEEE and AlAA.