Embed Size (px)
Citation preview

COMPARISON BETWEEN DUCTILE TEARING ANALYSIS AND
LINEAR ELASTIC FRACTURE MECHANICS ANALYSIS
COMPARISON BETWEEN DUCTILE TEARING ANALYSIS
AND LINEAR ELASTIC FRACTURE MECHANICS
ANALYSIS
Mr. Quinton Rowson
Consultant – Structural Integrity, Quest Integrity NZL Ltd., New Zealand
Mr. Michael Rock
Engineering Project Manager, Mighty River Power Ltd., New Zealand
THEME
Structural analysis: durability, fatigue and fracture
KEYWORDS
Ductile tearing, catastrophic failure, geothermal power station, J-integral tearing resistance curve, fracture toughness, 3D crack mesh, fracture mechanics, Charpy V-notch, LEFM, finite element analysis, FEACrackTM, Abaqus
SUMMARY
This is a case study of a failure which occurred in a reinjection (pressurised hot water) pipe of a geothermal power station. During the daily plant walk-around (not during planned inspection or shutdown), an operator noticed water dripping from the pipe cladding. Upon removal of the cladding and insulation, a crack was found in the pipe, which was operating at an elevated pressure and temperature. If catastrophic failure had occurred, considerable damage would have been done to the immediate area of the plant (including potential under-mining of foundations), requiring a plant shutdown and extended outage for repairs.
An initial fracture mechanics assessment was performed on the pipe using lower bound material property where known, and using conservative estimates for properties which were unknown such as fracture toughness. This assessment employed a Linear Elastic Fracture Mechanics (LEFM) model of a cylinder with a longitudinal through-wall crack. An iterative algorithm was used to calculate the critical crack length using tabulated stress intensity values generated from thousands of finite element analysis (FEA) runs. The identified
COMPARISON BETWEEN DUCTILE TEARING ANALYSIS AND
LINEAR ELASTIC FRACTURE MECHANICS ANALYSIS
crack was considered to be too close to the critical crack length even though there was known conservatism in the analysis. Given the plant’s tight operational time frame and the risks involved, the decision was made to replace an approximately one-half metre long section of pipe on either side of the support where the damaged pipe was situated.
After the damaged pipe was replaced, mechanical testing was performed on samples cut from the damaged sections of the pipe. The purpose of the mechanical testing was for a refined fracture mechanics assessment to be performed, and for the operator to obtain a better understanding of the operating limits to prevent future catastrophic failure.
Testing included Charpy V-notch impact, high cycle fatigue, J-R tearing resistance testing, and tensile and residual stress measurements.
The J-integral tear resistance curve was employed in a tearing analysis employing a finite element analysis of the crack geometry. This allowed for a far more accurate reassessment of the critical through-wall crack length in order to avoid unstable crack growth that could cause a catastrophic failure. The tearing analysis conducted using custom meshed crack was compared with a tearing assessment following the guidance given for a Level 3 tearing analysis in BS7910:2005.
This refined calculation showed an increase in the critical crack length over the original LEFM assessment. The advantage of this analysis is the continual update of the stress increase at the crack tip as the crack grows, which is specific to each problem. This allows the point of crack instability to be more accurately determined. This updated reassessment information was then used in the geothermal power station to develop life management planning for future inspection.
1: INTRODUCTION
This is a case study of a failure which employs various fracture mechanics models (Rowson, 2010). These models are described in various fracture mechanics text (Anderson, 2005). On Monday, 31st of May 2010 a longitudinal crack at a support in a reinjection pipe with a diameter of 254mm and wall thickness of 9.3mm was discovered. The crack was estimated to be 63mm and through-wall, as fluid was coming out of the crack (Figure 1). There was uncertainty in this measurement and was later found through a failure investigation (Lim, 2010) to be 65.6mm.

COMPARISON BETWEEN DUCTILE TEARING ANALYSIS AND
LINEAR ELASTIC FRACTURE MECHANICS ANALYSIS
Figure 1: Photo of initial estimated crack length in situ at support of the
reinjection pipe on a brine line.
The pipe design pressure and temperature were 32 Bar and 240ºC respectively. The operating pressure and temperature were 26 Bar and 230ºC respectively. Hydrostatic test pressure was 48 Bar. The pipe material was ASTM A53 Gr B manufactured by electric resistance welding.
At the time, it was determined that the critical crack size was highly sensitive to welding residual stresses and that, in the worst case scenario, when the welding residual stresses were equal to the yield stress of the pipe material, the critical crack size was 58mm long. Therefore, due to the number of uncertainties with regard to the material properties and crack length, a decision was made to remove and replace a one-metre section on either side of the crack. Material testing was performed on the removed section of pipe to accurately determine the crack length and shape, tensile material properties, fracture toughness and residual stress of the material for a more refined assessment to be performed.
This refined critical defect assessment reviews a previous LEFM assessment with a standardised tearing analysis for a Level 3 BS7910:2005 assessment (British Standards, 2005), and a custom meshed crack generated in FEACrackTM (Quest Integrity Group, 2010) and calculated in Abaqus (Dassault, 2010) and assessed with elastic-plastic fracture mechanics theory.

COMPARISON BETWEEN DUCTILE TEARING ANALYSIS AND
LINEAR ELASTIC FRACTURE MECHANICS ANALYSIS
The importance of this work was to ensure an accurate determination of the through-wall crack size which would cause catastrophic failure.
2: BACKGROUND
The Rotokawa geothermal field is located in the Taupo Volcanic Zone, New Zealand, roughly 13km northeast of Taupo Township. This resource is a high-temperature geothermal field with down-hole temperatures of up to 320°C. Rotokawa Geothermal Power Station generates 33 MW, and is one of two electricity generating power stations on this field. It is a combined-cycle plant with a back-pressure topping steam turbine and binary Organic Rankine Cycle bottoming and brine units. Two-Phase geothermal fluid is piped from the production wells to a centrifugal type separator where the steam and brine phases are separated. The steam phase is used to power the turbine (and subsequently the bottoming units). The brine phase is piped directly to a separate brine binary unit. The cooled brine is then mixed with the condensed steam from the bottoming units. The resultant fluid is then injected back into the ground.
3: MATERIAL TESTING RESULTS
The results of the ASTM A53 material testing revealed the properties summarised in Table 1, which were used for the assessment.
Quantity Value
Yield strength at operating temperature, (MPa) 335
Ultimate tensile strength at operating temperature, (MPa) 435
Young’s modulus at operating temperature, (GPa) 194
Fracture toughness (MPa√m) 141.1
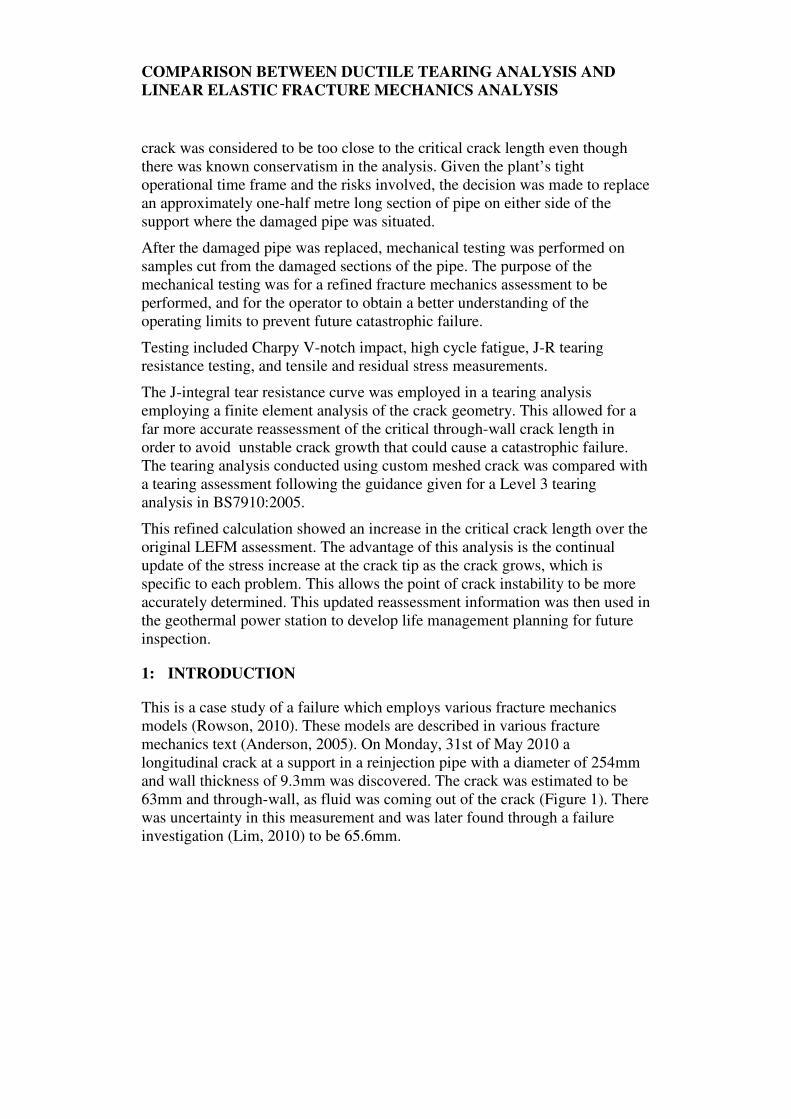
J-integral material resistance, (N/mm) See Figure 2 below
Secondary residual bending stress, (MPa) 49.3 Table 1: Summary of material properties from testing results used for assessment
COMPARISON BETWEEN DUCTILE TEARING ANALYSIS AND
LINEAR ELASTIC FRACTURE MECHANICS ANALYSIS
Figure 2: Fracture toughness J-R test results at room temperature for ASTM A53
tested to ASTM E1820.
4: METHODOLOGIES
4.1: Linear Elastic Fracture Mechanics Model (BS7910 Level 2 FAD)
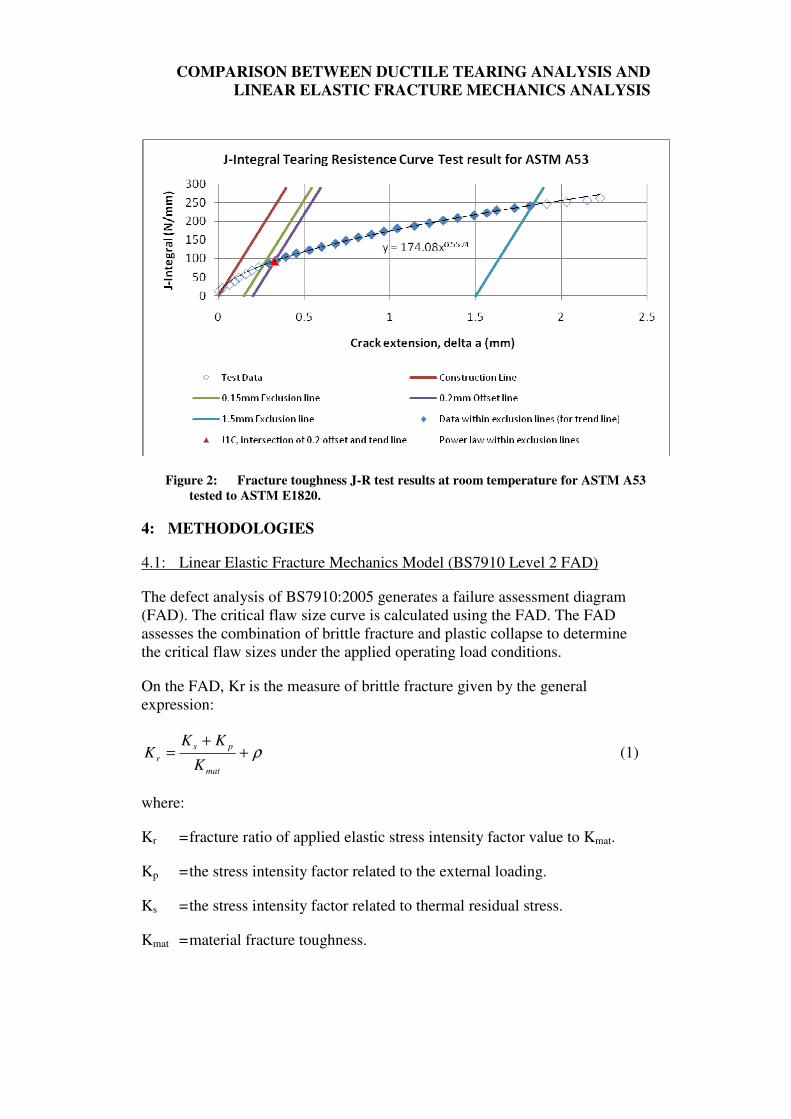
The defect analysis of BS7910:2005 generates a failure assessment diagram (FAD). The critical flaw size curve is calculated using the FAD. The FAD assesses the combination of brittle fracture and plastic collapse to determine the critical flaw sizes under the applied operating load conditions.
On the FAD, Kr is the measure of brittle fracture given by the general expression:
ρ++
=mat
ps
rK
KKK (1)
where:
Kr = fracture ratio of applied elastic stress intensity factor value to Kmat.
Kp = the stress intensity factor related to the external loading.
Ks = the stress intensity factor related to thermal residual stress.
Kmat = material fracture toughness.

COMPARISON BETWEEN DUCTILE TEARING ANALYSIS AND
LINEAR ELASTIC FRACTURE MECHANICS ANALYSIS
ρ = plasticity correction factor.
The parameter for plastic collapse Lr appears as the abscissa on the FAD. For a Level 2 assessment, this is given by:
y
ref
rLσ
σ= (2)
Where:
Lr = the ratio of applied load to yield load.
σref = the reference stress is determined in accordance with API 579 (American Petroleum Institute, 2007).
σy = the 0.2% proof stress or the lower yield stress of the material.
The principle of the assessment is to calculate the values of Kr and Lr which are then plotted on the FAD as the ‘assessment point’. This is done for a series of increasing values of flaw sizes. As the defect size increases, the assessment point will approach the boundary from within the FAD. When the assessment point reaches the boundary, the defect size is taken as the maximum tolerable flaw size.
4.2: Ductile Tearing Elastic-Plastic Fracture Mechanics Model for Determining Critical Crack Size (BS7910 Level 3 FAD)
The defect analysis generates a FAD. A locus of assessment points is plotted. If any of the points along the locus lie within the FAD curve, the flaw is considered acceptable. If not, the flaw is considered unacceptable. The general principles of the analysis are similar to a Level 2 assessment. For this ductile tearing analysis, the fracture toughness is required in the form of the J-integral resistance curve.
The results of the J-integral resistance curve produced by testing can be plotted on the FAD. The results of the locus of points plotted on the Level 3 FAD can be interpreted as the critical flaw size allowable is indicated as ductile instability when just one point along the locus line touches the FAD line. These calculations were automated through the use of SignalTM FFS software (Quest Integrity Group, 2010).

COMPARISON BETWEEN DUCTILE TEARING ANALYSIS AND
LINEAR ELASTIC FRACTURE MECHANICS ANALYSIS
4.3: Elastic–Plastic Fracture Mechanics Theory and Use of Finite Element Analysis Custom Crack Mesh to Calculate the J-integral
Calculation of J-integral values requires custom 3D crack meshes. The crack meshes are quarter symmetric with appropriate symmetry constraints, internal pressure and axial loads. Secondary residual stresses were not included.
FEACrackTM software was used to quickly generate the needed crack meshes. The crack front uses the typical focused mesh pattern needed to support the J-integral contour calculations shown in Figure 3. This method is explained in more detail in (Thorwald, 2011).
Figure 3: Example of 3D crack mesh used for the 65mm long half crack length, c.
Eleven crack mesh geometries were created of half crack lengths, c, ranging from 65mm to 300mm long, to ensure sufficient resolution to capture the intersection of the applied tearing modulus curve with the tearing resistance curve on the plot of tearing modulus versus J-integral.
The tearing modulus, T, is a non-dimensional value defined in Equation (3).

COMPARISON BETWEEN DUCTILE TEARING ANALYSIS AND
LINEAR ELASTIC FRACTURE MECHANICS ANALYSIS
da
dJET
20σ
= (3)
Where ‘E’ is modulus of elasticity, ‘σ0’ is the yield strength, and ‘da
dJ’ the
derivative of a J-integral curve. The tearing modulus is calculated for both the material resistance and crack front curves. The J-R material curve power-law curve-fit equation is described in Equation (4).
( ) ( ) 5574.0001 08.1742 aaaaCJ
C
R −=−= (4)
The tearing resistance, TR, described by a power-law curve-fit equation (Figure 2) from the J-R material curve can then be expressed as shown in Equation (5).
( )0
220 aa
JCET R
R −=
σ (5)
Where C2 is a material constant determined from the material testing for this material, C2 equals 0.5574. The applied tearing modulus, Tapp, is calculated from the crack front J versus crack length FEA mesh results, which used simple differences, ∆J/∆c, to calculate the derivative of J. This method is explained in more detail in (Thorwald, 2011).
5: RESULTS
The results of the LEFM analysis using a single toughness value revealed that the maximum through-wall longitudinal crack length that could be tolerated was 124mm as shown in Figure 4. When this is compared with the results of the analysis using the elastic-plastic fracture mechanics (EPFM) theory, there is a significant advantage in obtaining J-integral resistance curve data as shown in Figure 2. This leads to a far less conservative prediction of critical crack size as seen in Figure 5, where the EPFM theory predicts a critical crack size of 252mm, which is double the LEFM prediction.

COMPARISON BETWEEN DUCTILE TEARING ANALYSIS AND
LINEAR ELASTIC FRACTURE MECHANICS ANALYSIS
Figure 4: Critical through-wall crack length of 124mm for ASTM A53 using Level
2 assessment procedure with a single toughness value.
Figure 5: Critical through-wall crack length of 252mm for ASTM A53 using Level
3 assessment procedure using the J-R material resistance.

COMPARISON BETWEEN DUCTILE TEARING ANALYSIS AND
LINEAR ELASTIC FRACTURE MECHANICS ANALYSIS
Figure 6 shows the material resistance tearing modulus, TR, and the tearing modulus due to the applied load, Tapp, plotted with respect to the J-integral. All Tapp points which are below the TR curve are stable, where the intersection of Tapp and TR represents the maximum J-integral for which the crack is still stable. These are the results of the 11 crack mesh geometries created.
Figure 6: Critical J-integral for ductile instability of 803 N/mm where TR and Tapp
tearing modulus curves intersect.
Once the critical J-integral has been determined, the critical crack length of 248mm can be inferred as shown in Figure 7, where the maximum J-integral of the driving force is tangent with the J-integral of the material resistance curve. The crack length to initiate the unstable ductile tearing 2c0 is 218 mm.

COMPARISON BETWEEN DUCTILE TEARING ANALYSIS AND
LINEAR ELASTIC FRACTURE MECHANICS ANALYSIS
Figure 7: Applied J-integral and material resistance J-integral curves versus half
crack length.
6: CONCLUSIONS
This analysis has shown that there was good agreement in the critical crack length calculated using the J-integrals from the FEA 3D crack meshes and a Level 3 BS7910 assessment. The FEA 3D crack mesh approach calculated a critical through-wall crack length of 248mm. The Level 3 BS7910 assessment approach was calculated at critical through-wall crack length of 252mm. One of the key aspects for the accuracy of the critical through-wall length was the material testing for obtaining the J-integral material resistance curve. Without this, the fall back position is to use LEFM with the use of a single material fracture toughness value, which leads to conservative results for the critical crack length. This was shown with the Level 2 BS7910 assessment which calculated a critical crack length of 124mm. This case study also highlights the importance of other fracture mechanics model inputs such as accurate load information. The original assessment calculated a critical crack length of 58mm due to the uncertainties of the level of secondary residual stresses in the pipe.
The advantage of the FEA 3D crack mesh approach is that the engineer is not limited to standard published solutions. In addition, the J-integrals may not exist for specific complex geometry. This, combined with reliable J-integral material resistance curves from fracture toughness tests, enable more precise assessments to be performed.
COMPARISON BETWEEN DUCTILE TEARING ANALYSIS AND
LINEAR ELASTIC FRACTURE MECHANICS ANALYSIS
REFERENCES
ROWSON, Q., 2010. Refined Critical Flaw Size Assessment of Line 10-BR-
055-K-P at Rotokawa Power Station. [project report 100571.02, issued October 2010].
ANDERSON, T. L., 2005. Fracture Mechanics: Fundamentals and
Applications. 3rd ed. Boca Raton, FL: CRC Press, Taylor & Francis Group.
LIM, E., 2010. Failure Analysis of Reinjection Pipe at Rotokawa. [project report 100571.03, issued October 2010].
BRITISH STANDARD, 2005. BS7910:2005, Guide to methods for assessing
the acceptability of flaws in metallic structures.
QUEST INTEGRITY GROUP, 2010. FEACrackTM
User’s Manual, version
3.2. Available at: <http://www.questintegrity.com/products/feacrack/> [Accessed 7 December 2010].
DASSAULT SYSTÈMES, 2010. ABAQUS/Standard 6.10-1. 166 Valley St., Providence, RI, www.abaqus.com.
AMERICAN PETROLEUM INSTITUTE, 2007. The American Society of
Mechanical Engineers, API579-1/ASME FFS-1, Fitness-for-Service, 2nd Ed.
QUEST INTEGRITY GROUP, 2010. SignalTM
FFS (Fitness-for-Service)
commercial software version 3.0.113. 2465 Central Ave, Suite 110 Boulder, CO, www.questintegrity.com
THORWALD, G., 2011. Ductile Tearing Analysis Of A Custom Pipe-To-
Flange Nozzle Using 3D Crack Meshes. 2011 NAFEMS Conference, Boston, May 25-26.