Embed Size (px)
Citation preview

, , • /:.._ _ _ i _, > :' }£_i}:_:!_17_
N AS A / TM- 1998-208428
Analysis of Buckling and Stable Tearing inThin-Sheet Materials
B. R. Seshadri and J. C. Newman, Jr.
Langley Research Center, Hampton, Virginia
National Aeronautics and
Space Administration
Langley Research Center
Hampton, Virginia 23681-2199
May 1998
Available from the following:
NASA Center for AeroSpace Information (CASI)7121 Standard Drive
Hanover, MD 21076-1320
(301) 621-0390
National Technical Information Service (NTIS)
5285 Port Royal Road
Springfield, VA 22161-2171(703) 487-4650

'i_ ¸_ ,'_, _ : !"%::i_?,_
ANALYSES OF BUCKLING AND STABLE
IN THIN-SHEET MATERIALS
B. R. Seshadri and J. C. Newman, Jr.
NASA Langley Research Center
Hampton, VirginiaUSA
TEARING
ABSTRACT
This paper was to verify the STAGS (general shell, geometric and material nonlinear)
code and the critical crack-tip-opening angle (CTOA) fracture criterion for predicting
stable tearing in cracked panels that fail with severe out-of-plane buckling. Materials
considered ranged from brittle to ductile behavior. Test data used in this study are
reported elsewhere. The STAGS code was used to model stable tearing using a critical
CTOA value that was determined from a cracked panel that was "restrained" from
buckling. The analysis methodology was then used to predict the influence of buckling on
stable tearing and failure loads. Parameters like crack-length to-specimen-width ratio,
crack configuration, thickness, and material tensile properties had a significant influence on
the buckling behavior of cracked thin-sheet materials. Experimental and predicted results
showed a varied buckling response for different crack-length-to-sheet-thickness ratios
because different buckling modes were activated. Effects of material tensile properties and
fracture toughness on buckling response were presented. The STAGS code and the CTOA
fracture criterion were able to predict the influence of buckling on stable tearing behavior
and failure loads on a variety of materials and crack configurations.
NOMENCLATURE
B
ci
d
E
Specimen thickness, mm
Initial half-length of crack, mm
Minimum element size along crack line, mm
Young's modulus, GPa
National Research Council Resident Research Associate, NASA Langley Research
Center, MS 188E, Hampton, VA 23681
Fb
Pb
Pnob
S
Sk
Sf
W
W
x,y,z
Ac
V
t_xx
_c
Buckling response ratio (Pb/Pnob)
Peak load when sheet allowed to buckle, N
Peak load when sheet restrained from buckling, N
Applied stress, MPa
Peak stress during crack linkup (k = 1 to 3), MPa
Failure stress, MPa
Out-of-plane displacement in z-direction, mm
Specimen half-width, mm
Cartesian coordinates
Crack extension, mm
Poisson's ratio
Normal stress in x-direction
Critical crack-tip opening angle, degrees
Critical opening angle for sawcut at crack initiation, degrees
INTRODUCTION
Stably tearing cracks in fuselage structures are subjected to complex loading
conditions (pressure, biaxial, and shear) and cracks in fuselages are subjected to mixed-
mode and out-of-plane deformations. In the framework of the NASA Airframe Structural
Integrity Program, the FRANC3D/STAGS codes are being developed to predict the
behavior of these cracks under complex fuselage loading with the critical crack-tip-
opening angle (CTOA) fracture criterion [1]. In developing the residual strength methods,
the ability of STAGS to predict the influence of bulging or buckling on stable tearing
behavior, in the presence of multiple-site and discrete source damage, needed to be
verified on laboratory tests and on structural test articles. Development of these residual
strength analysis methodologies for complex loading are essential to ensure the continued
safe operation of the aging commercial transport fleet and aircraft for the next generation.
2

Severalfracturecriteriahavebeenproposedto predicttheresidualstrengthof
crackedspecimensor structuresusingthefinite-elementmethod.Thecrack-tipstressor
strain,crack-tip-openingangle(CTOA),crack-tip-openingdisplacement(CTOD),crack-
tip force,strain-energy-releaserate,andtheJ-integralhavebeenemployedto predictthe
stablecrackgrowthbehaviorundermonotonicloading. Of these,theCTOA or CTOD
criterionhadbeenshownto bewell suitedfor modelingthestablecrackgrowthprocess
andinstabilityduringfracture[2-4]. Experimentalmeasurementsof thecritical CTOA
duringthefractureprocessfor thin-sheetaluminumalloys[5] haveshownthatCTOA
remainsnearlyconstantduringstablecrackgrowthafterasmallamountof crack
extension(aboutonethickness).
Becausecracksin fuselagestructuresaresubjectedto out-of-planedeformations,the
influenceof bulgingor bucklingonstabletearingmustbeaccountedfor in theanalysis.
By addressinga simplercrackproblem,suchasthefracturebehaviorof middle-crack
tensionM(T) specimensunderbucklingconditions,anassessmentof thecapabilityof the
STAGScodeandthecritical CTOAcriterioncanbemade.
In 1962,KuhnandFigge [6]developedanexpressionto determinethebuckling
responseratio Fb (ratioof bucklingloadto failure loadof restrainedM(T) specimenswith
anti-bucklingguides)asafunctionof theinitial crack-length-to-thickness(ci/B) ratio.
Later,Forman[7] carriedoutaseriesof experimentsto determinetheeffectsof buckling
andspecimendimensionsonresidualstrengthof thin-sheetaluminumalloysandsteels.At
leasttwoM(T) specimensweretestedwith guideplateslightly clampedagainstthepanels
to preventbuckling andonespecimenwastestedwithoutguideplatesto allowbucklingto
occur. Thetestprogramshowedthat therewasaconsiderablereductionin residual
strengthof crackedsheetswhichwereallowedto buckle. From theseresultsthelinear
relationshipgivenby KuhnandFigge,to definethebucklingresponseratio,couldnot be
generalizedfor mostmaterials.Thislackof uniquenessin representingthebuckling
responseratiowith thicknessfor differentmaterials,andtheneedto verify theSTAGS
codeandtheCTOA fracturecriterion,promptedthisstudy.
3
Theobjectiveof this studywasto analyzecrackedpanelsthatfail with severeout-of-
planebucklingusingSTAGS(STructuralAnalysisof GeneralShells)code[8,9]andthe
CTOA fracturecriterion. Materialswith fracturebehaviorrangingfrom brittle to ductile
wereconsidered.TheSTAGScodewasusedto modelstabletearingusingacritical
CTOA valuethatwasdeterminedfrom acrackedpanelthatwas"restrained"from
buckling. TheSTAGScodeandthecritical CTOAvaluewerethenusedto predictthe
influenceof bucklingonfailure loads. Theinfluenceof crack-length-to-specimen-width
ratio, thickness,crackconfigurationandmaterialtensilepropertieson thebuckling
behavioron severalthin-sheetaluminumalloysanda steelwerestudied.Thesematerials
covereda widerangein fracturetoughnessbehaviorandhadcritical CTOA valuesranging
from avery low valueof 1.9degreesto avalueof 4.6degrees.Experimentaltestdataused
hereinarereportedelsewhere.A hypotheticalmaterialwith a 10degreecritical CTOA
valuewasalsoconsideredto studythebucklingbehaviorof specimensmadeof an
extremelyhigh toughnessmaterial. Comparisonsaremadebetweenthemeasuredand
predictedappliedstressagainstcrackextension,in-planecrack-openingdisplacement
(COD)andcrackout-of-planedisplacement(COPD)for 2024-T3specimenstestedwith
andwithoutbucklingguides.Theinfluenceof variousbucklingmodesandtheinitial
crack-length-to-thicknessratio (ci/B) onfailure loadswerestudied.Theeffectsof material
tensilepropertiesandfracturetoughnessonbucklingresponsearepresentedanddiscussed.
Theinfluenceof multiple-site-damage(MSD) onthebucklingresponsewerealsostudied
for somepreviouslyconductedtestson 2024-T3panels. (MSD is thepresenceof a large
numberof smallfatiguecracksneara largeprimaryleadcrack,suchasfatiguecracksalong
arivet row in alap-splicejoint in afuselage.)Theability of theSTAGSshellcodeandthe
CTOAfracturecriterionto predictthe influenceof bucklingon stabletearingbehaviorand
residualstrengthof thin-sheetmaterialswereinvestigated.
MATERIALS AND SPECIMEN CONFIGURATIONS
Analyseswereconductedonmiddle-cracktensionM(T) specimensandonmultiple-
sitedamage(MSD) specimenssubjectedto remotetension. Thematerialsstudiedwere
2024-T3,2219-T87and7075-T6aluminumalloysandanAM355CRT steel.These

materialscoverawiderangein fracturebehaviorfrom brittle to ductile. In general,the
initial crack-length-to-half-width(ci/w)ratio of 1/3wasconsideredbut, in addition,the
2219-T87materialwasanalyzedwith ci/w ratiosof 0.2,0.4,0.6 and0.8 to studythe
effectsof cracklengthon residualstrength.As shownin Table1,thematerialsstress-
strainbehaviorwereapproximatedbypiece-wise-linearcurves.
FINITE ELEMENT ANALYSES
In the M(T) specimen, the normal stress, tYxx parallel to the crack surface is
compressive, as shown in Figure 1. If the specimen is not restrained, then the crack flanks
will deform out-of-plane (buckle) and this behavior will greatly reduce the load carrying
capacity. The STAGS code and the CTOA fracture criterion will be used to study stable
tearing and buckling interactions in this specimen type.
Figure 1.
S
Y
T(_XX = -S
---C3--
2c
j ..,,...._
2w
$
X
Middle-crack tension, M(T), specimen.

_ _ _: _:_i_iS_!_ •
STAGS is a finite element program for the analysis of general shell-type structures [8,
9]. The program has several types of analysis capabilities (static, dynamic, buckling, crack
extension, material nonlinear and geometric nonlinear behavior). STAGS has crack
extension capability based on the critical crack-tip-opening angle or displacement (CTOA
or CTOD) criterion and the traditional KR-curve. Its finite element library includes, two-
node beam elements, triangular shell, quadrilateral shell and transitional elements to
connect triangular and quadrilateral elements (see refs. 8 and 9 for more details). In the
current study, quadrilateral shell elements with 6 degrees-of-freedom per node (three
displacements and three rotations) were used. The quadrilateral shell element was under
"plane-stress" conditions. Elastic-plastic material behavior was approximated by multi-
linear stress-strain curves (see Table 1). The White-Besseling plasticity theory with a form
of kinematic hardening was used to account for yielding and reverse yielding during
unloading [9].
The specimen configuration and typical mesh pattern are shown in Figures 1 and 2,
respectively. Because the configuration and loading were symmetric, only a quarter of the
sheet was modeled, as shown in Figure 2. The minimum crack-tip element size (d) of 1
ram, along the line of crack extension, was chosen to be the same for all meshes generated
for different case studies. From previous parametric and convergence studies, it was
found that a minimum crack-tip element size of 1 mm (linear-strain element) was sufficient
to model stable tearing under elastic-plastic conditions [10]. Crack growth was governed
by monitoring the critical CTOA (_c) at one element distance (1 mm) behind the crack tip.
In general, the critical value (gtc) was determined by matching the average failure load
measured on several tests of M(T) specimens (restrained from buckling), as will be
discussed later.
A critical CTOA (gtc) was used to evaluate the onset of crack growth. This criterion
is equivalent to a critical CTOD (_c) value at a specified distance behind the crack tip. At
each load increment, the CTOA was calculated and compared to a critical value gt c.
When the CTOA exceeded the critical value, the crack-tip node was released and the

crack was advanced to the next node. This process was continued until crack growth
became unstable under load control or until the desired crack length had been reached
under displacement control.
Y
I I I IIIIIIII
IIIllilllIIIIIIII]lllllII11111
[ I I I I I,'llllllll ......IIIIII.... IIIII ....Jill ......... II
IIIIIIIII,,,, .... 11IIIllllllllllll
::::::::::::::::::::::::::::::::::::::::::::::::::::::::::
Figure 2. A typical finite-element model of one-quarter of an M(T) specimen.
The aerospace industry frequently uses sawcuts to approximate fatigue cracks
because they are less costly to manufacture and they can be placed more accurately in
complex structural test articles than an actual fatigue crack. To approximate the use of
sawcuts, the sawcut was assumed to undergo a deformation at the sawcut tip before a
crack would initiate. In order to simulate the sawcut effects, a critical sawcut angle, _i,
was selected to model the deformations that take place at the sawcut tip before a crack
would initiate. Again this value was selected to match the load required to initiate a crack
at the sawcut. In the analysis, once the critical sawcut angle was reached, the node at the
tip of the sawcut was released and the crack advanced to the adjacent node (1 mm
7
spacing). Thus, the crack extension at initiation was 1 mm. After a crack had initiated,
the critical tearing CTOA, _c, was used to grow the crack. The tearing angle, _c, and
sawcut angle, _i, for the different materials considered in the present analyses are listed
in Table 2.
In order to simulate buckling in the STAGS numerical analyses, a concentrated load
of a very small magnitude was gradually applied in small steps in the transverse or out-of-
plane (z) direction. The concentrated load was applied at the center of the crack (x = 0).
A trial-and-error procedure was used to find the small load that was sufficient to induce
buckling. The out-of-plane load was gradually reduced as the external loading was
applied.
RESULTS AND DISCUSSIONS
In the following sections, the results of the numerical analyses are compared with the
experimental observations and discussed in detail. To begin with, stable crack growth test
results, measured crack opening displacements (COD) and measured crack out-of-plane
displacements (COPD) are compared with numerical results from fracture simulations.
Later, the sawcut simulation capability in STAGS is discussed and analyses are compared
with some test results. Finally, the effects of buckling on stable tearing and the influence
of multiple-site damage (MSD) cracking on crack growth behavior with buckling are
presented.
Fracture Simulations with Fatigue Cracks
The numerical analyses of M(T) specimens with and without buckling and the
corresponding test data are plotted as applied stress against crack extension in Figure 3.
Square and circular symbols represent the tests conducted with guides to prevent buckling
and the triangles show data where guides were not used and the sheet was allowed to
buckle [11]. An angle of _t c = 4.6 degrees was used to fit the average of the experimental
failure loads corresponding to the specimens with anti-buckling guides (restrained). The
dashed curve corresponds to the fracture simulation of the specimens where out-of-plane
displacements were restrained. Later, the analysis was repeated with the same angle but
buckling was allowed. The solid curve represents the numerical results when out-of-plane
8

deformations were permitted (unrestrained). Both the tests and numerical results indicate
a significant influence of buckling on stable tearing. The residual strength was drastically
reduced when the sheet was allowed to buckle. The experimental and numerical results
agreed well near the maximum applied stress but both analyses predicted more crack
extension in the early stages of crack growth than in the tests. This discrepancy has been
traced to severe crack tunneling [4], since crack extension was measured at the free
surface, and to the plane-stress behavior assumed in the analysis [5, 12]. However, these
results demonstrate that STAGS and the CTOA criterion can model the influence of
buckling on failure loads for cracks in thin-sheet aluminum alloys.
F175 I O
_z_/ 2024-T3 (LT)S T;/_ B = 2.3 mm
MPa 100_ 2w-- 610ram
75 _[ 2ci = 203 mm
5O
[][]
25
Test [11]:
[] o Restrained
zx Unrestrained
I I I
10 20 30
A
0 I
0 70
Analysis: _c = 4.6 deg.
Restrained
-- Unrestrained
I I I
40 50 60
Crack extension, AC, mm
Figure 3. Measured and predicted stable crack growth in M(T) specimens using CTOA.
Comparison of Measured and Predicted COD--A comparison of applied stress against
crack-opening displacement (COD) from the test (symbols) and the STAGS analysis is
shown in Figure 4. The crack-opening displacements in the y-direction were measured at
the centerline of the crack. Only test results with anti-buckling guides were available for
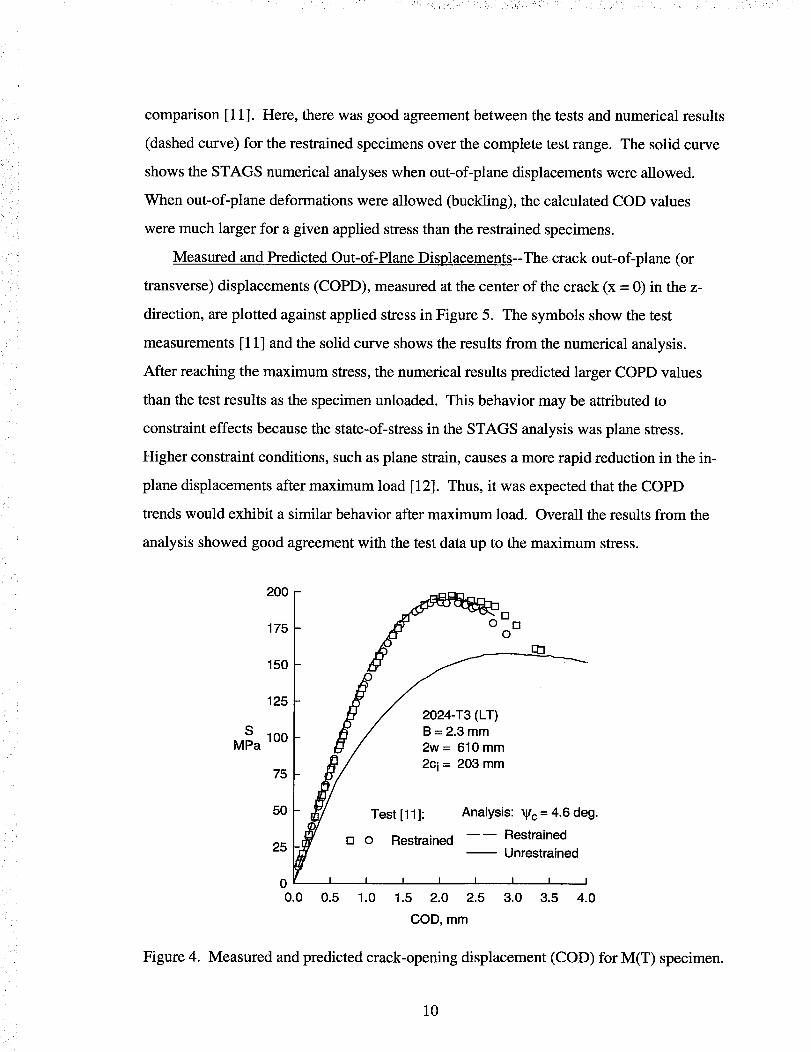
comparison[11]. Here,therewasgoodagreementbetweenthetestsandnumericalresults
(dashedcurve)for the restrainedspecimensoverthecompletetestrange. Thesolid curve
showstheSTAGSnumericalanalyseswhenout-of-planedisplacementswereallowed.
Whenout-of-planedeformationswereallowed(buckling),thecalculatedCODvalues
weremuchlargerfor a givenappliedstressthantherestrainedspecimens.
Measured and Predicted Out-of-Plane Displacements--The crack out-of-plane (or
transverse) displacements (COPD), measured at the center of the crack (x = 0) in the z-
direction, are plotted against applied stress in Figure 5. The symbols show the test
measurements [11] and the solid curve shows the results from the numerical analysis.
After reaching the maximum stress, the numerical results predicted larger COPD values
than the test results as the specimen unloaded. This behavior may be attributed to
constraint effects because the state-of-stress in the STAGS analysis was plane stress.
Higher constraint conditions, such as plane strain, causes a more rapid reduction in the in-
plane displacements after maximum load [12]. Thus, it was expected that the COPD
trends would exhibit a similar behavior after maximum load. Overall the results from the
analysis showed good agreement with the test data up to the maximum stress.
200
175
150
125
Mla 100
75
50
25
00.0
E / a=z3mm/ 2w = 610 mm
I/,,_// Test [11]: Analysis." Vc = 4.6 deg.M3/
i_ / I_ o Restrained Restrained
- Unrestrained
I I I I I I I I
0.5 1.0 1.5 2.0 2.5 3.0 3.5 4.0
COD, mm
Figure 4. Measured and predicted crack-opening displacement (COD) for M(T) specimen.
10

'!: ._::_i-(i"i_', ¸I¸:_,,_,_:_ ":/_: ':" : i:, ??:,, :, ,. . :_ _ _
175
SMPa
15O
125
100
75
2024-T3 (LT)B = 2.3 mm2w = 610 mm
2c i = 203 mm
%O
o
50
25
Test [11]: Analysis: _c = 4.6 deg.
o Unrestrained Unrestrained
0 I I I I I
0 5 10 15 20 25
COPD, mm
Figure 5. Measured and predicted crack out-of-plane displacement (COPD)
for M(T) specimen.
Fracture Simulations with Sawcuts
Comparison of experimental and numerical applied stress against crack extension for
an M(T) specimen with a sawcut are shown in Figure 6. The test results (symbols) are
from a restrained M(T) specimen with a sawcut (1.8 mm wide sawcut blade). As
previously mentioned, the behavior of sawcuts are quite different from that of a fatigue
crack. The sawcut had a blunt tip and required much higher applied stresses to initiate a
tearing crack. In order to simulate sawcut effects, a critical sawcut angle, _i, was
selected to match the applied stress required to initiate a crack at the tip of the sawcut,
similar to that developed in reference 10. Once a crack had initiated, the critical tearing
angle, Vc, was used to grow the crack.
Several types of fracture analyses were performed with STAGS. First, a tearing crack
was analyzed with a critical angle of 4.6 degrees (dash curve). Then analyses were
conducted to find, by trial-and-error, the critical sawcut angle. A sawcut angle of _i = 15
11

degreeswasfound from theseanalyses.ThesolidcurveshowstheSTAGSanalysiswith
thesawcutangleto initiate acrackandacritical angleof _c = 4.6 degreesto tearthe
crack. Thefit to theexperimentalresultswasreasonable.As wasevidentfrom Figure6,
themaximumappliedstresswasnotgreatlyaffectedby havingeitherasawcutor crack.
But therewasasignificantdifference(about100%)in theinitial appliedstressrequiredto
initiateacrackatthe sawcutandtheappliedstressrequiredto initiate atearingfatigue
crack(seecurvesatAc = 0 in theFig. 6).
2OO
175
150
125
S 100MPa
75
50
Figure 6.
O_ f 2024-T3 (LT)f-
//
//
/+( O Test (restrained with sawcut)
B = 1.6 mm2w = 610 mm2c: = 254 mm
I
25
0 10 50
Analysis:
Sawcut (_i = 15.0 deg.; _c = 4.6 deg.)
m_ Crack (_c = 4.6 deg.)
I I I
20 30 40
Crack extension, AC, mm
Comparison of measured and calculated stable crack growth
in M(T) specimen with sawcut or crack using CTOA.
Effects of Buckling on Stable Tearing
Earlier experimental studies [6, 7] have shown that parameters like crack-length-to-
width ratio (ci/w), thickness (B), and material tensile properties have a significant
influence on the buckling behavior of M(T) specimens. In order to understand the
influence of these parameters, a wide range of materials were considered in the present
study (2024-T3, 2219-T87, 7075-T6 aluminum alloys and AM355CRT steel). These
12

materialshavecritical CTOA valuesfrom 1.9to 4.6degrees.A hypotheticalmaterialwith
a 10degreecritical anglewasalsoconsideredin theanalysesto studythebuckling
behaviorof specimensmadeof averyductilematerial.
Residual Strength of Ductile Materials-- In Figure 7, the buckling ratio (F b = Pb/Pnob)
from both experiments and numerical analyses are plotted against the initial crack length-
to-thickness (ci/B) ratios. Fb is the ratio of the peak load (Pb) when the thin sheet was
allowed to buckle to the load (Pnob) when all out-of-plane displacements are restrained.
The results shown in Figure 7 were tested with specimens that had the same crack-length-
to-width ratio, ci/w = 1/3. The specimen widths (2w) ranged from 75 to 305 mm for the
1.5-mm thick aluminum alloy and steels [7] and ranged from 75 to 610 mm for the 2.3-
mm thick aluminum alloy [11]. For larger values of the ci/B ratio, the buckling ratio
decreased and tended to level off at about 0.7. Both the aluminum alloys and steels
exhibited nearly the same behavior.
Pb
Pnob
0.8
w 0.6
0.4
0.2
2024 -T3 (_c = 4.6 deg.)
m.. AM355CRT (_c = 4.4 deg.)
........ .................
V V
Tests: c i I w = 1/3
0 2024 -T3 B = 2.3 mm [11]
[] 2024 -T3 B = 1.5 mm [7]
zx AMa50CFIT B = 0.5 mm [7]
v AM355CRT B = 0.5 mm [7]
0.0 I I I I0 50 100 150 200
Crack length / Thickness, ci / B
Figure 7. Measured and predicted results for 2024-T3 aluminum alloy and
AM355CRT steel.
13

, .......... L • ! __ _:,_!_L, _i'!_"ii'_; ii i'_i•
For comparison, the linear approximation from Kuhn and Figge [6] was shown as the
dashed line. The experimental results from the tests [7, 11 ] for both materials lie on either
side of the linear approximation. Thus, the linear relationship can only be considered as a
first approximation to the buckling response. Actually, the experimental results show that
the behavior was nonlinear.
The STAGS numerical results are shown by solid and dash-dot curves for the
aluminum alloy 2024-T3 and AM355CRT steel, respectively. Here the fracture analyses
were conducted at various ci/B ratios by varying B with ci/w as constant (ci/w = 1/3).
Numerical results compared well with the experimental trends. Both the aluminum alloy
and steel predictions show similar buckling response. Their corresponding critical angles
(_c) were 4.6 and 4.4, respectively. With an increase in the ci/B ratio from 0 to 50, the
buckling ratio dropped linearly from unity to about 0.8. For ci/B ratios greater than 50,
the buckling ratio decreased slowly and approached a value of about 0.7, but the buckling
ratio oscillated. This nonlinear behavior was suspected to be due to the buckling response
shifting from one buckling mode to another. In the initial stage, the buckling response was
in the first buckling mode. With an increase in ci/B, the sheet reached a critical position
and the response shifts into the second buckling mode. This change from the first mode to
a higher buckling mode provide an increased resistance to buckling and causes the ratio to
decrease at a slower rate. For a ci/B ratio of 200, the sheet exhibited severe out-of-plane
deformations both parallel and perpendicular to the crack surfaces.
In an effort to study the influence of the shift from one buckling mode to another on
residual strength, the STAGS/CTOA analysis was conducted on panels with ci/B ratios
less than 50, greater than 50 and much larger than 50. The initial crack length was the
same for all analyses. The magnitude and direction of the initial out-of-plane load to
initiate buckling was the same in all cases. The out-of-plane W-displacement (at the peak
stress) is plotted against the x/w value in Figure 8. The results at the smallest ci/B value
14

showsthefirst modeof buckling. For larger ci/B values, the second and third mode of
buckling developed.
Residual Strength of Brittle Materials--Forman [7] also conducted fracture tests on
various specimens made of 7075-T6 aluminum alloy (2w ranged from 38 to 305 mm) with
and without buckling guides. The buckling ratio (Pb/Pnob) from these tests are shown as
symbols in Figure 9 as function ci/B. For the small specimen widths tested, the buckling
ratio was, surprisingly, greater than unity on several test series. The reason for this
behavior may be specimen scatter because this material is quite brittle in comparison to the
2024-T3 alloy. Again, the dashed line is the simple buckling equation proposed by Kuhn
and Figge [6]. Here the Kuhn-Figge expression was in good agreement with the test data.
20
15
10
s
o
-5
-10
2024-T3 (LT)
_, \,, 2w = 610 mm
_". \_ 2c i = 203 mm\ \
'.k_, _'c = 4.6 deg.,,\
"'_\ - ci/B=44.4_\ - c i / B = 66.7
"._L\ - ci/B=133.3
I': ci/w //_-'1 _'_
/,0.0 /0.2 0.4 0.6 0.8 1.0
_ / x/w/
/J
Figure 8. Predicted out-of-plane buckling mode shapes along crack line
for 2024-T3 aluminum alloy M(T) specimens.
An analysis with the STAGS code on the restrained 7075-T6 specimens with the
largest width produced a critical angle of 1.9 degrees. When the buckling analyses were
15

repeated with the 7075-T6 alloy, the buckling response was also linear in the range of 0 <
ci/B < 100, as shown in Figure 9, but the slope was quite different than that for the 2024-
T3 alloy and steel, as shown in Figure 7. This material exhibited very small amounts of
stable tearing and had very little plastic deformation at the crack tip before fracture.
However, there was good correlation between the test results and the numerical analyses
with the CTOA concept. These results demonstrate that the buckling response is a strong
function of the fracture toughness of the material.
Pb
Pnob
1.2
1.0
0.8
0.6
0.4
0.2
7075-T6
Tests: c i / w = 1/3
o B = 1.6 mm [7]
-- Analysis (_c = 1.9 deg.)
Kuhn-Figge [6]
0.0 i i i i0 50 100 150 200
Crack length / Thickness, ci/ B
Figure 9. Measured and predicted behavior for 7075-T6 aluminum alloy.
Residual Strength of Hypothetical (Very_ Ductile ) Material--To further study the
influence of toughness on the residual strength during buckling, a 2024-T3 aluminum alloy
with a hypothetical critical angle, _c, of 10 degrees was analyzed. These results are
shown in Figure 10. As previously mentioned, this angle was selected to study the effect
on buckling when the size of the plastic zone becomes very large compared to the
specimen width. For comparison, the residual strength for the same material with a critical
16

angle(_c) of 4.6degreesis alsoshown. Theanalysesshowedthatbucklinghadmuchless
influenceon thefailure loadsfor theveryductilealloybecausethematerialwasfailing
undernet-sectionyieldingconditions.Thedropin thebucklingratiooverthewiderange
of ci/B ratiosanalyzedwasonly about10percent.
Pb
Pnob
1.2
1.0
0.8
0.6
0.4
0.2
F
2024-T3
Tests: ci / w = 1/3
O B = 2.3 mm [11]
[] B=l.5mm[7]
Analysis (_c = 10.0 deg.)
-- Analysis (_c = 4.6 deg.)
0.0 t i r t0 50 100 150 200
Crack length / Thickness, Ci / B
Figure 10. Measured and predicted behavior for two critical CTOA values.
Effect of CTOA on Residual Strength--From Figure 10, it was found that the residual
strength of the 2024-T3 aluminum alloy was much less when the critical angle _c was 4.6
degrees instead of 10 degrees. In order to study the tearing-buckling behavior as a
function of the critical angle, the buckling response of the 2024-T3 alloy was analyzed
with various critical angles from 2 to 10 degrees with a ci/B ratio of 200. These results
are shown in Figure 11. At high angles, the material fails by net-section yielding and
buckling had a small influence failure loads (about 10 %). At the lower angles, the
material had low fracture toughness and failure was brittle in nature and, again, buckling
had a small influence failure loads. However, for CTOA values between these two
17

/ _ '_,i?_" • • : _ / / _ i "!/_ '_i_':_:
extreme cases (3 to 5 degs.), buckling effects on stable tearing and failure loads were
significant. These analyses indicate that buckling response is a strong function of fracture
toughness or critical angle.
1.2
Pb
Pnob
1.0
0.8
m 0.6
0.4
0.2
2024-T3
2w = 610 mm
ci/w = 1/3
ci/B = 200
0.0 i i t i i0 2 4 6 8 10
CTOA (_c), degrees
Figure 11. Variation in buckling response ratio with CTOA.
Effect of Crack Length, Width, and Thickness on Residual Strength--In this section,
the influence of various crack lengths, widths, and thicknesses on buckling response is
presented and discussed. Earlier, the buckling response for 2024-T3 material was
obtained at various values of ci/B by varying B and keeping ci/w as constant (Fig. 7). In
the present case, the thickness B was held constant (1.9 mm) and both ci and w were
varied while maintaining ci/w = 1/3. The results from these analyses are presented in
Figure 12. For low ci/B ratios, the buckling response was nearly the same by varying
either B or w. But the differences in the buckling response are significant in specimens
with ci/B ratios greater than 50. These results suggest that larger panels tend to buckle
more and produce lower failure loads than smaller width panels at the same ci/B ratio.
18

Pb
Pnob
Figure 12.
1.2
1.0
0.8
0.6
0.4
0.2 --
---- _c = 4.6 deg.; Variable B
-- _c = 4.6 deg.; Variables c and w
2024-Ta
Tests: c i I w = 1/3
0 B=2.amm[11]
[] B --1.5 mm [7]
I I I0.0 I0 50 1O0 150 200
Crack length / Thickness, ci / B
Buckling response ratio in large panels for various thicknesses,
crack lengths and widths.
Effect of Crack-Length-to-Width Ratio on Residual Strength--The effects of varying
the crack-length-to-width ratio, ci/w, on buckling response is shown in Figure 13. Three
510-mm wide (2w) panels with various crack lengths were analyzed with buckling to
determine the critical angle of 3.6 degrees (unpublished data from Royce Forman, NASA
Johnson Space Center). The 2219-T87 aluminum alloy was then analyzed with STAGS
using the critical angle of 3.6 degrees for ci/w ratios of 0.2, 0.4, 0.6 and 0.8 with 2w =
510 mm. There were no corresponding test data for the influence of ci/w on buckling
response. The numerical results show that the buckling response was a slight function of
ci/w with variations of about 10 percent for the various ci/w ratios analyzed. Also, the
analyses indicate that the activation of the higher buckling modes, as shown by the
oscillatory nature of the buckling response, was weakly dependent upon the ci/w ratios.
19

1.2
Pb
Pnob
1.0
0.8
0.6
0.4
0,2 -
_.._ ......... -_
2219-T87
B = 2.5 mm
2w = 510 mm
• c = 3.6 deg.
c i/w
0.2
m._ 0.4
---0.6
-- 0.8
I I I0.0 I0 50 1O0 150 200
Crack length / Thickness, ci / B
Figure 13. Buckling response ratio as a function of initial crack-length-to-widthratio for 2219-T87 material.
Influence of MSD Cracking on Stable Tearing and Buckling
Small multiple-site-damage (MSD) cracking at adjacent structural details, such as in a
riveted fuselage structure, have a strong influence on residual strength, see Swirl [14]. In
the previous sections, the effects of buckling on stable tearing in the presence of a single
large crack was presented and discussed for various materials. Previously, Newman et al.
[13, 15] studied the influence of MSD on stable crack growth behavior in 2024-T3 panels.
In order to study the influence of buckling on MSD crack behavior, a STAGS analysis was
carried out on 2024-T3 MSD panels which had a single large lead
crack with two-symmetric MSD cracks on either side of the lead crack (crack number 3),
as shown in Figure 14.
Broek et al. [16] conducted fracture tests on 508-mm wide M(T) and MSD
specimens made of 2024-T3 Alclad material. Sawcuts were used instead of fatigue
cracks. The M(T) specimens with a single sawcut were tested with initial sawcut lengths
20

of 50.8, 88.9 and 140 mm. Experimental data on applied stress, S, against measured crack
extension is shown in Figure 15. The critical tearing angle _c, and the sawcut angle _i,
required in the analysis of the MSD panels were determined from an analysis of these
specimens and tests on sawcuts reported in reference 10. From the STAGS analyses, a
sawcut angle of 8.2 degrees and a critical tearing angle of 4.8 degrees were determined to
best fit these data.
From the MSD test [16], the only information reported was the applied stress, S,
against crack-opening displacement at the centerline of the lead crack (crack number 3 in
Fig. 14). From these results, three peak stresses, S1, $2 and $3, were identified as the first
crack link up, second crack link up and final failure stress, respectively. The maximum
stress Sf corresponded to the second peak stress. As these peak stresses could not be
related to any particular crack length, they are represented by horizontal lines in the Figure
16. All these test results corresponds to a panel where out-of-plane deformations were
prevented with guide plates.
AY S
Crack
1 2 3 4 5
2w
x
S
Figure 14. Multiple-site damage (MSD) crack configuration.
21

250 2024-T3 Alclad
I B = 1.0 mm2w = 508 mm
2oo j15O
MPa
100//__Test [16]: STAGS:
50 IL [] ci = 50.8 mm _i = 8.2 deg.; _c = 4.8 deg.
/ z_ c i=88.9 mm -- Sawcut
0 ci= 140 mm ---- Crack
0 i i i a t i0 5 10 15 20 25 30
Crack extension, Ac, mm
Figure 15. Comparison of measured and calculated stable crack growth
in 2024-T3 Alclad aluminum alloy specimens.
In the STAGS analysis of the MSD panel configuration shown in Figure 14, the
sawcut and tearing angles determined in the previous section were used. All sawcut tips
had the same sawcut and tearing angles. The STAGS analysis was able to predict the
three peak stresses quite accurately, as shown in Figure 16.. For comparison, the results
from the analysis of a panel with only a lead crack was also shown. The presence of the
MSD cracks reduced the residual strength of the panel by 30 percent. When the STAGS
analysis was repeated but allowing out-of-plane deformations (buckling), the stress levels
at which the cracks link up due to ligament breakage decreased and there was a further
reduction (10 percent) in the residual strength of the MSD panel. These analyses indicate
that small MSD cracks combined with buckling can significantly reduce the residual
strength of MSD panels.
22

" ' ' • ¸¸¸¸¸¸7
200
150
S100
MPa
50
2024-T3 Alclad [16]B = 1.0 mm2w = 508 mm
Lead crack: ci = 96.5 mm
_ - _" ------.. _.
_ .
/" Test: S 2 = Sf _./
.......... .s..3....-....... j\
Analyses:
• i = 8.2 deg.; _c = 4.8 deg.
---- Lead crack only
MSD; sawcut; restrainedMSD; sawcut; unrestrained
0 I I I I I I I I I
0 10 20 30 40 50 60 70 80 90
Lead Crack Half-length Extension, mm
Figure 16. Measured and predicted crack link-up for an MSD panel.
CONCLUDING REMARKS
Results from the analyses of buckling and stable tearing in thin-sheet materials were
presented and discussed. Finite-element fracture simulations using the STAGS shell code
with the critical crack-tip-opening angle (CTOA) fracture criterion produced quite
accurate results when compared with experimental measurements of crack extension and
failure loads. The numerical analyses indicated that sheet thickness (B), crack-length-to-
width (ci/w) ratio, crack configuration, and material fracture toughness had a strong
influence on the buckling response. The importance of sawcut simulation in predicting
the residual strength of the panels with single sawcuts and multiple-site-damage cracking
was highlighted. The STAGS analyses predicted a significant influence of multiple-site
damage (MSD) cracking on residual strength. There was a further reduction in residual
strength when the MSD panels were allowed to buckle. Finally, the STAGS code and the
CTOA fracture criterion may serve as an analysis tool for predicting the residual strength
of built-up structures subjected to complex loading conditions.
23

ACKNOWLEDGMENT
This work was performed while the first author was a National Research Council
Research Associate at the NASA Langley Research Center.
Table 1. Material stress-strain properties.
2024-T3 (LT) 7075-T6 2219-T87 AM355CRT
E = 71.5 GPa E = 71.5 GPa E = 76 GPa E = 207 GPa
v=0.3 v=0.3 v=0.3 v=0.3
e t_, MPa _ t_, MPa e c, MPa e _, MPa
0.00483 345 0.00676 484 0.00455 346 0.0074 1534
0.015 390 0.01 518 0.0074 378 0.18 1666
0.04 432 0.02 539 0.0183 411 0.25 1693
0.1 473 0.04 560 0.0423 453
0.16 491 0.08 574 0.066 464
0.14 587 0.12 464
0.2 588
Table 2. Critical crack-tip-opening angles for different materials.
Material Thickness Tearing CTOA, _c
B, mm degrees
2024-T3 (LT) 2.3 4.6
2024-T3 Alclad (TL) 1.0 4.8
7075-T6 1.6 1.9
2219-T87 2.5 3.6
AM355CRT 0.5 4.4
Sawcut CTOA, _i
degrees
15.0
8.2
REFERENCES
[1]
[2]
Harris, C. E. and Heyman, J. S., "Overview of NASA Research Related to the Aging
Commercial Transport Fleet", Journal of Aircraft, Vol. 30, No. 1, 1993, pp. 64- 68.
Kanninen, M. F., Rybicki, E. F., Stonesifer, R. B., Broek, D., Rosenfield, A. R.,
Marschall, C. W. and Hahn, G. T., "Elastic-Plastic Fracture Mechanics for Two-
Dimensional Stable Crack Growth and Instability Problems," Elastic-Plastic
Fracture, ASTM STP 668, J. D. Landes, J. A. Begley and G. A. Clarke, Eds.,
American Society for Testing and Materials, Philadelphia, PA, 1979, pp. 121-150.
24

• _i ¸ /. _:_-',>_;;? j , ' .... _ : / ii: •• ,
[3]
[4]
[5]
[6]
[7]
[8]
[9]
[10]
[11]
[12]
[13]
Newman, J. C., Jr., "An Elastic-Plastic Finite-Element Analysis of Crack Initiation,
Stable Crack Growth, and Instability," Fracture Mechanics - Fifteenth Symposium,
ASTM STP 833, R. J. Sanford, Ed., American Society for Testing and Materials,
Philadelphia, PA, 1984, pp. 93-117.
Newman, J. C. Jr., Dawicke, D. S. and Bigelow, C.A., "Finite-Element Analyses and
Fracture Simulation in Thin-Sheet Aluminum Alloys", Durability of Metal Aircraft
Structures, S. N. Atluri et al., Eds., Atlanta, Georgia, 1992, pp. 167-186.
Dawicke, D. S., Sutton, M. A., Newman, J. C., Jr. and Bigelow, C. A.,
"Measurement and Analysis of Critical CTOA for an Aluminum Alloy Sheet",
Fracture Mechanics: 25th Volume, ASTM STP 1220, F. Erdogan, Ed., American
Society for Testing and Materials, Philadelphia, PA, 1995, pp. 358-379.
Kuhn, P and Figge, I.E., "Unified Notch-Strength Analysis for Wrought Aluminum
Alloys", NASA TN D-1259, 1962.
Forman, R. G., "Experimental Program to Determine Effect of Crack Buckling and
Specimen Dimensions on Fracture Toughness of Thin Materials", Technical Report
AFFDL-TR-65-146, January 1966.
Brogan, F. A., Rankin, C. C. and Cabiness, H. D., "STAGS Users Manual",
Lockheed Palo Alto Research Laboratory, Report LMSC P032594, 1994.
Almroth, B. O., Brogan, F. A. and Stanley, G. M., "User's Manual for STAGS,
Volume I: Theory, NASA CR 165670, March 1978.
Dawicke, D. S. and Newman, J. C., Jr., "Residual Strength Predictions for Multiple-
Site Damage Cracking using a CTOA Criterion," Fatigue and Fracture Mechanics:
29th Volume, ASTM STP 1332, T. L. Panontin and S. D. Sheppard, Eds., American
Society for Testing and Materials, Philadelphia, PA, 1998.
Dawicke, D. S., "Fracture Tests on 0.09 Inch Thick 2024-T3 Aluminum Alloy",
NASA TM 112869, National Aeronautics and Space Administration, 1997.
Newman, J. C., Jr., Booth, B. C. and Shivakumar, K. N., "An Elastic-Plastic Finite-
Element Analysis of the J-Resistance Curve using a CTOD Criterion", Fracture
Mechanics: Eighteenth Symposium, ASTM STP 945, D. T. Read and R. P. Reed,
Eds., American Society for Testing and Materials, Philadelphia, PA, 1988, pp. 665-685.
Newman, J. C., Jr.; Dawicke, D. S.; Sutton, M. A. and Bigelow, C. A., "A Fracture
Criterion for Widespread Cracking in Thin-Sheet Aluminum Alloys", Durability
and Structural Integrity of Airframes, Vol. I, A. F. Blom, Ed., 1993, pp. 443-468.
25

[14]
[15]
[16]
Swift, T., "DamageTolerancein PressurizedFuselages,"New Materials and
Fatigue Resistant Aircraft Design, 14th Symposium of the International Committee
on Aeronautical Fatigue (ICAF), Ottawa, Canada, June 1987.
Newman, J. C. Jr. and Dawicke, D. S., "Fracture Analysis of Stiffened Panels under
Biaxial Loading with Widespread Cracking", Widespread Fatigue Damage in
Military Aircraft, AGARD CP-568, 1995, pp. 3.1-3.16.
Broek, D., Thomson, D. and Jeong, D. Y., "Testing and Analysis of Flat and Curved
Panels with Multiple Cracks," NASA Conference Publication 3274, Part II,
September 1994, pp. 963-984.
26


Form ApprovedREPORT DOCUMENTATION PAGE OMBNo.0704-0188
Public reporting burden for this collection of information is estimated to average I hour per response, including the time for reviewing instructions, searching existing data sources,
gathering and maintaining] the data needed, and completing and reviewing the cctlection of information. Send comments regarding this burden estimate or any other aspect of this
collection of mformatton, mcludmg suggestions for reducing this burden, to Washington Headquarters Services, Directorate for Information Operations and Reports, 1215 Jefferson
Davis Highway, Suite 1204, Arlington, VA 222.02-4302, and to the Office of Management and Budget, Paperwork Reduction Project (0704-0188), Washington, DC 20503.
1. AGENCY USE ONLY (Leave blank) 2. REPORT DATE 3. REPORT TYPE AND DATES COVERED
Marc 1998 Technical Memorandum4. TITLE AND SUBTITLE 5. FUNDING NUMBERS
Analysis of Buckling and Stable Tearing in Thin-Sheet Materials
6. AUTHOR(S)
B. R. Seshadri and J. C. Newman, Jr.
7. PERFORMINGORGANIZATIONNAME(S)ANDADDRESS(ES)
NASA Langley Research Center
Hampton, VA 23681-2199
9. SPONSORING/MONITORING AGENCY NAME(S) AND ADDRESS(ES)
National Aeronautics and Space Administration
Washington, DC 20546-0001
WU 538-02-10-01
8. PERFORMING ORGANIZATIONREPORT NUMBER
L-17747
10. SPONSORING/MONITORINGAGENCY REPORT NUMBER
NASA/TM- 1998-208428
11. SUPPLEMENTARY NOTES
Paper published in Fatigue and Fracture Mechanics: 29th Volume, ASTM STP 1332, T. L. Panontin and S. D.
Sheppard, Eds., American society for Testing and materials, Philadelphia, PA, 1998.
12a. DISTRIBUTION/AVAILABILITY STATEMENT 12b. DISTRIBUTION CODE
Unclassified-Unlimited
Subject Category 39 Distribution: Standard
Availability: NASA CASI (301) 621-0390
13. ABSTRACT (Maximum 200 words)
This paper was to verify the STAGS (general shell, geometric and material nonlinear) code and the critical crack-
tip-opening angle (CTOA) fracture criterion for predicting stable tearing in cracked panels that fail with severe
out-of-plane buckling. Materials considered ranged from brittle to ductile behavior. Test data used in this study
are reported elsewhere. The STAGS code was used to model stable tearing using a critical CTOA value that was
determined from a cracked panel that was "reslralned" from buckling. The analysis methodology was then used to
predict the influence of buckling on stable tearing and failure loads. Parameters like crack-length to-specimen-
width ratio, crack configuration, thickness, and material tensile properties had a significant influence on the
buckling behavior of cracked thin-sheet materials. Experimental and predicted results showed a varied buckling
response for different crack-length-to-sheet-thickness ratios because different buckling modes were activated.
Effects of material tensile properties and fracture toughness on buckling response were presented. The STAGS
code and the CTOA fracture criterion were able to predict the influence of buckling on stable tearing behavior and
failure loads on a variety of materials and crack configurations.
14. SUBJECT TERMS
Cracks, Crack growth, Crack-tip-opening angle (CTOA), Buckling, Multiple-site
damage cracking, STAGS shell code
17. SECURITY CLASSIRCATICIN 18. SECURITY CLASSIRCATION 19. SECURITY CLASSIFICATIONOF REPORT OF THIS PAGE OF ABSTRACT
Unclassified Unclassified Unclassified
NSN 7540-01-280-5500
15. NUMBER OF PAGES
3116. PRICE CODE
A0320. LIMITATION
OF ABSTRACT
Standard Form 298 (Rev. 2-89)Prescribed by ANSI Std. Z-39-18
298-102