Embed Size (px)
Citation preview

Chemosphere 84 (2011) 1452–1460
Contents lists available at ScienceDirect
Chemosphere
journal homepage: www.elsevier .com/locate /chemosphere
Comparision of the waterborne and dietary routes of exposure on the effectsof Benzo(a)pyrene on biotransformation pathways in Nile tilapia(Oreochromis niloticus)
Joana Costa a,b,⇑, Marta Ferreira a, Ledicia Rey-Salgueiro a, Maria Armanda Reis-Henriques a
a CIIMAR/CIMAR – Interdisciplinary Centre of Marine and Environmental Research, Laboratory of Environmental Toxicology, University of Porto, Rua dos Bragas,289, 4050-123, Porto, Portugalb ICBAS/UP – Institute of Biomedical Sciences Abel Salazar, University of Porto, Largo Professor Abel Salazar, 2, 4099-003 Porto, Portugal
a r t i c l e i n f o
Article history:Received 1 February 2011Received in revised form 6 April 2011Accepted 17 April 2011Available online 11 May 2011
Keywords:Benzo(a)pyreneBiomarkersTilapiaERODGSTBile metabolites
0045-6535/$ - see front matter � 2011 Elsevier Ltd. Adoi:10.1016/j.chemosphere.2011.04.046
⇑ Corresponding author at: CIIMAR/CIMAR – Interdand Environmental Research, Laboratory of EnvironmePorto, Rua dos Bragas, 289, 4050-123, Porto, Portugal+351 223 390 608.
E-mail address: [email protected] (J. Costa).
a b s t r a c t
BaP is one of the most studied PAH, due to its ubiquitous presence in aquatic environments and toxicityto aquatic organisms. The main goal of this study was to assess BaP effects in Nile Tilapia after water-borne and dietary exposures, through the evaluation of EROD and GST activities in liver, gills and intes-tine, and BaP metabolites in bile; and also to evaluate the usefulness of these commonly used biomarkersafter two different routes of exposure. Waterborne exposure to BaP led to a significant induction of ERODin all tissues analyzed (644%, 1640% and 2880% in relation to solvent in liver, gill and intestine respec-tively) while in dietary exposures EROD was induced only in intestine (3143%) after exposure to highBaP concentrations. GST activities with CDNB were slightly induced in liver (40%) and in gill (66%) afterwater exposure to BaP, and in intestine after dietary exposure to low BaP concentrations (182%). BaPmetabolites in bile increased after both exposure routes, and were highly correlated with EROD activityafter water exposure. In summary, this work has shown that the effects of BaP on biotransformation path-ways depend on the route of exposure. Moreover, barrier tissues like gills and intestine also have animportant role in the first-pass metabolism of BaP, reducing the amount of parent compound that reachesthe liver to be metabolized. For that reason, EROD activity as a biomarker of exposure should also beapplied in extrahepatic organs, like gills and intestine, in monitoring studies. Biliary BaP type metabolitesare good reflectors of contamination levels under both exposure routes, while GST activity with CDNB assubstrate, as a phase II enzyme, does not seem a reliable biomarker of exposure to BaP regardless theroute of exposure.
� 2011 Elsevier Ltd. All rights reserved.
1. Introduction
Polycyclic aromatic hydrocarbons (PAHs) are prevalent environ-mental contaminants commonly found in aquatic sediments andwaters associated with urbanized estuarine and coastal areas(Meador et al., 1995). Although these contaminants can arise fromnatural sources, such as oil seeps, volcanoes and forest fires,anthropogenic sources as vehicle exhaust, power generation andoil pollution are the main causes for environmental PAH contami-nation (Latimer and Zheng, 2003). In aquatic organisms, the uptakeof pollutants can occur through the contact of contaminated food,water and sediments (Bruggeman et al., 1984; Hendricks et al.,
ll rights reserved.
isciplinary Centre of Marinental Toxicology, University of
. Tel.: +351 223 401 800; fax:
1985), and the degree of toxicity can be influenced by the route,by the dose and by the duration of exposure (Grimmer et al.,1988; Driver et al., 1991; Bloomquist, 1992). One of the most com-mon and toxic PAH in the aquatic environments is Benzo(a)pyrene(BaP) and its carcinogenic and mutagenic properties are widelystudied (Buhler and Williams, 1989; Tsukatani et al., 2003). Thegreat majority of the studies focusing on BaP effects in the detox-ification mechanisms in aquatic organisms have used intraperito-neal injections (Van Der Weiden et al., 1994; Pacheco and Santos,1998; Nacci et al., 2002; Wang et al., 2006; Wang et al., 2008;Nahrgang et al., 2009) as the route of exposure. Some studies haveinvestigated the effects on the detoxification mechanisms of BaPafter dietary (Hendricks et al., 1985; Wolkers et al., 1996; Reynoldset al., 2003), and waterborne exposure routes (Levine and Oris,1999; Wu et al., 2007; Ortiz-Delgado et al., 2008; Wang et al.,2008) which are two of the most important routes of pollutantsuptake in aquatic organisms. However, to our knowledge, there isstill a lack of studies that directly compare the biochemical effects
J. Costa et al. / Chemosphere 84 (2011) 1452–1460 1453
of different concentrations of the same contaminant after bothexposures routes in the same species.
In fish, as in other vertebrates, exposure to PAHs results in theinduction of enzymatic systems involved in the metabolism ofthe xenobiotic compound, for the detoxification of the organism(Black and Coon, 1987; Buhler and Williams, 1989) due to ahigh-affinity of these pollutants to bind the aryl-hydrocarbonreceptor (AhR). Studies in mammals have shown that the activa-tion of the AhR-dependent signal transduction pathway controlsthe expression of several genes, including cytochrome P4501A(CYP1A) and some glutathione-S-transferase (GST) genes (George,1994; Hankinson, 1995; Schmidt and Bradfield, 1996). Like inmammals, in fish these genes are believed to be primarily involvedin hepatic biotransformation of pollutants, like PAHs (reviewed invan der Oost et al., 2003). The measurement of phase I and phase IIbiotransformation enzymes hepatic activities, have been widelyapplied as biomarkers of biochemical effects, and as a complementto chemical analysis (Richardson et al., 2001; Ferreira et al., 2006,2008; Jönsson et al., 2009; Nahrgang et al., 2009; Reis-Henriqueset al., 2009). However, despite the fact that the liver is consideredto be the main site of CYP1A expression, its expression and induc-tion has been observed in other tissues as well, including those indirect contact to the environment, such as gills (Jönsson et al.,2004, 2006; Nahrgang et al., 2010a,b) and intestine (McElroy andKleinow, 1992; James et al., 1997). Nevertheless, the relativeimportance of branchial and intestinal uptake route to the overallexposure remains poorly understood. After PAH metabolism in theliver, their metabolites are secreted into the bile, stored in the gallbladder and excreted to the intestinal tract (Au et al., 1999). There-fore, due to their high metabolism rate in fish (Meador et al., 1995),PAHs tend not to bioaccumulate in tissues, and the direct quantifi-cation of these compounds in fish tissues may not yield an accurateestimation of contaminant exposure and uptake. As a result, themeasurement of PAHs metabolites in fish bile is considered a reli-able method for assessing the degree of exposure of the organismsto these type of pollutants (Krahn et al., 1986). In this study, Niletilapia (Oreochromis niloticus) was used as model species. Besidesbeing an economically important cultured species, namely in Asiaand Africa, Nile tilapia is also a well established model in manytoxicological studies (Almeida et al., 2001; Straus, 2003; Coimbraet al., 2005, 2007; Figueiredo-Fernandes et al., 2006).
The main objectives of the present work were to evaluate differ-ences in the detoxification mechanisms in juvenile Nile tilapia,after waterborne and dietary exposure routes to BaP. Biochemicaleffects of BaP were assessed, by means of 7-ethoxyresorufin O-deethylase (EROD) and glutathione-S-transferase (GST) activitiesas a measure of phases I and II of the biotransformation mecha-nism, in liver, gills and intestine. Additionally, fixed wavelengthfluorescence (FF) was used to quantify BaP type metabolites asfluorescent aromatic compounds (FACs) in bile.
2. Materials and methods
2.1. Chemicals
Benzo(a)pyrene (99% purity), resorufin sodium salt, 7-ethoxy-resorufin, ß-NADPH (95% purity), BSA (99% purity), 1-chloro-2,4-dinitrobenzene (CDNB, 97% purity), a-Dithiothreitol (99% purity),GSH (99% purity) were purchased from Sigma Aldrich, Germany.All the other chemicals were of analytical grade, and were pur-chased from local companies.
2.2. Animals
All animals used in this study were born and raised in the lab-oratory (CIIMAR, Porto, Portugal). The corresponding breeders
stock was obtained from the Aquaculture Station of UTAD (Univer-sidade de Trás-os-Montes, Portugal). Fish used in all assays werejuveniles, and therefore not sexually mature, as confirmed by mac-roscopic analysis of the gonads when animals were sacrificed. Untilthe start of the exposure assays, fish were kept in 60 L aquaria sup-plied with biological filtration. Prior to the experiments, animalswere randomly distributed in the experimental aquaria (30 L),and submitted to an acclimatation period of one week. All tankswere supplied with continuous aeration to maintain dissolved oxy-gen near saturation. Dechlorinated tap water was used at a tem-perature of 20 ± 2 �C, with a 12 h:12 h (light:dark) photoperiod,and fish were fed commercial food pellets (Aquasoja, Portugal) un-til satiation, once a day.
2.3. Stock solutions of BaP and preparation of contaminated food
For the waterborne exposures, stock solutions of BaP were pre-pared in acetone (0.5, 1.25, 2.5 and 5 g L�1) and were administereddirectly in the experimental aquaria. The percentage of solventadded in the experimental aquariums was 0.002%. For the dietaryexposures stock solutions of BaP with concentrations of 0.1 and40 g L�1 were prepared, respectively for the first and second assays.The contaminated diets were prepared by immersion of food pel-lets in BaP stock solutions diluted in acetone, in a proportion of0.32 mL g�1 of food. For control groups, nothing was added to thefood pellets, and for solvent control groups only acetone was addedto the food pellets. Acetone was evaporated under air current for24 h, until the pellets were completely dry, and diets were storedat �20 �C until further use.
2.4. Xenobiotic exposures
For the water exposure, juvenile Nile tilapia (N = 116, averageweight of 14.2 ± 0.6 g, average length of 9.30 ± 0.14 cm) were ex-posed to nominal water concentrations of 10, 25, 50 or 100 lg ofBaP/L for 14 d. Also, a control group and a solvent control group(only solvent was added) were maintained. All treatments wereperformed in duplicate, with two exposure tanks per concentra-tion. Waterborne exposures were conducted in semi-static condi-tions in 30 L aquaria. Daily, 80% of the water was renewed,followed by the addition of fresh BaP solution or solvent to eachone of the treatment groups. Animals were fed to satiation every2 d, with the exception of the day before sampling. Sampling wasperformed prior to the first BaP addition, and 7 and 14 d afterthe contaminant addition.
For dietary exposures two experiments were conducted, andfish were maintained in 30 L aquaria in continuous water flow con-ditions, which assured 100% of water renewal per day. In the firstassay, juvenile tilapia (N = 72, average weight of 11.21 ± 1.00 g,average length of 8.47 ± 0.27 cm) were exposed to 1 and 10 lg ofBaP g�1 of food for 14 d. In the second dietary assay, fish(N = 129; average weight: 11.15 ± 0.42 g, average length of8.49 ± 0.09 cm) were exposed to 100 and 200 lg of BaP g�1 of foodfor 21 d. Fish were sampled before the addition of BaP contami-nated diets, and at days 7, 14 and 21 (only in the second experi-ment). In both assays a control (uncontaminated food) and asolvent control group (acetone alone) were maintained, and dupli-cates were made for each treatment, with two exposure tanks perconcentration. Fish were fed daily at a rate of 3% of body weight.After feeding, animals were observed, to assure that the total ofthe food was consumed in 2 to 3 min. After every sampling point,animals were weighted in order to recalculate the amount of foodnecessary for each tank, to maintain the percentage of feeding at3% body weight.

1454 J. Costa et al. / Chemosphere 84 (2011) 1452–1460
2.5. Sampling
Fish were anesthetized on ice cold water and sacrificed bydecapitation, and body weight and length were recorded for subse-quent calculation of condition factor (CF = body weight (g) � 100/body length3 (cm)). Liver, gills and intestine were excised fromthe animal, and bile was collected from the gall bladder with a1 mL syringe. Liver weight was recorded for the calculation of he-patic somatic index (HSI = liver weight (g)/body weight (g) �100).Liver, gills, intestine, and bile were immediately frozen in liquidnitrogen, and stored at �80 �C until further use. CF and HSI priorto the beginning of the water assay were 1.66 ± 0.04 and1.33 ± 0.11, respectively. Before the dietary exposures, CF and HSIwere 1.62 ± 0.07 and 1.21 ± 0.07 for the first assay, and1.68 ± 0.03 and 1.95 ± 0.05 for the second assay, respectively. Nosignificant differences were seen in these parameters during thecourse of the experiments, indicating that the overall conditionof the animals was maintained during the experimental periods(Ricker, 1975; Grant and Brown, 1999).
2.6. BaP determination in water and food samples
To determine the real concentration of BaP in the water of theexperimental aquaria, BaP was extracted from water samplesaccording to the method described by Cheikyula et al. (2008),and assessed by the method of Rey-Salgueiro et al. (2008). Afterthe addition of the contaminant, the real concentrations of BaP inwater samples were 10.49, 22.51, 41.46 and 84.77 lg L�1, respec-tively for the nominal concentrations of 10, 25, 50 and 100 lg L�1.After 24 h, and before the addition of fresh contaminant to theaquaria, the amount of BaP still present in each one of the treat-ment groups was 0.34, 0.69, 12.19 and 25.70 lg L�1. In water col-lected from control and solvent control groups no BaP wasdetected at both times.
Food pellets supplied to the fish in dietary exposures were alsoanalyzed in terms of BaP concentration, according to the methoddescribed by Rey-Salgueiro et al. (2009). The real BaP concentra-tions in the food pellets were 0.06, 0.07, 0.42, 3.99, 36.24 and92.70 lg g�1, respectively for control, solvent, 1, 10, 100 and200 lg g�1.
2.7. Biochemical analysis
EROD activity was measured according to Ferreira et al. (2008)in the microsomal fraction of liver, gills and the first one-third ofthe intestine. Briefly, tissues were homogenized in ice cold buffer(50 mM Tris–HCl, 0.15 M KCl, pH 7.4), and microsomes were ob-tained by centrifugation of the 9000g supernatant at 36 000g for90 min at 4 �C. The pellet was then ressuspended in buffer(50 mM Tris–HCl, 1 mM Na2EDTA, 1 mM dithiothreitol, 20% v/vglycerol pH 7.4) and spun down at 36 000g for 120 min (Bucheliand Fent, 1995). Microsomes were suspended in EDTA-free resus-pension buffer and stored at �80 �C until use. Microsomal suspen-sion (20 lL), with average protein concentration of3.01 ± 0.20 mg mL�1, was incubated with ethoxyresorufin (2 lMin 50 mM Tris–HCl, 1 mM dithiothreitol, 0.15 M KCl, pH 8.0) for1 min, and the enzymatic reaction was initiated by the additionof NADPH 4.5 lM. EROD activity was measured for 5 min atkex530 nm and kem585 nm, by fluorometry, and determined bycomparison to a resorufin standard curve (concentrations rangefrom 3 to 100 nM). Hepatic EROD activity was expressed inpmol min�1 mg�1 protein. During the procedure of microsomesisolation, an aliquot of the cytosolic fraction (obtained after the9000g centrifugation) was separated for the analysis of GST activ-ity. GST was determined according to the method of Habig et al.(1974), adapted to microplates as described in Ferreira et al.
(2008), using glutathione (GSH) 10 mM in phosphate buffer0.1 M, pH 6.5, CDNB 60 mM in ethanol prepared just before the as-say. The reaction mixture was composed by 1.5 mM GSH and1.5 mM CDNB in phosphate buffer. In the microplate, 0.2 mL ofthe reaction mixture was added to 0.1 mL of sample, correspondingto 0.3 mg of protein, with a final concentration of 1 mM GSH and1 mM CDNB in the assay. The GST activity was measured immedi-ately every 20 s, at 340 nm, during the first 5 min, and calculated inthe period of linear change of the absorbance. GST activity was ex-pressed in nmol min�1 mg�1 protein. In each treatment group,EROD and GST activities were analysed in 4–10 individuals,depending on the tissue. Protein content in all assays was deter-mined by Lowry method (Lowry et al., 1951), in the correspondentfraction.
2.8. BaP metabolites in fish bile
BaP metabolites in the bile were determined through fixedwavelength fluorescence (FF). Bile samples from control and sol-vent control of water exposed animals, and from food exposedgroups were diluted 1:1000 in ethanol 48%. Bile from water ex-posed animals was further diluted to 1:10000 (10 and 25 lg L�1)and 1:100000 (50 and 100 lg L�1). FF was performed at the excita-tion/emission wavelength pair 380/430 nm, since BaP metabolitesare more efficiently detected at these wavelengths (Krahn et al.,1993; Lin et al., 1996). Measurements were performed on a BIOTEKSFM25 fluorimeter. The FF values were expressed as arbitrary fluo-rescence units (a.f.u.) after subtracting the signal levels of the sol-vent. The bile pigment biliverdin was measured at 380 nm in allsamples to estimate bile density, and BaP metabolites fluorescencewas normalised to biliverdin, to check if differences in fluorescenceintensity could result from differences in bile densities. BaP metab-olites were analysed in bile of 4–10 individuals of each treatmentgroup.
2.9. Statistical analysis
Exposure time and treatment effects were evaluated by meansof a one-way ANOVA for each one of the mentioned factors, fol-lowed by a multiple comparison test (Tukey’s test) at a 5% signifi-cance level. Some data had to be log transformed in order to fitANOVA assumptions. Correlations and all the tests were performedusing the software Statistica 7 (Statsoft, Inc., 2004). No differenceswere observed between replicates of the same treatment, nor incontrol treatments between days, nor between control and solventcontrol during the exposure time. Therefore, in all biomarkers ana-lysed, results were presented as percentage in relation to solventcontrol only. Results were shown as mean ± standard error.
2.10. Ethics statement
The animals used in the research that is described in this paperwere treated in accordance with the Portuguese Animals and Wel-fare Law (Decreto-Lei n� 197/96) approved by the Portuguese Par-liament in 1996.
3. Results
Mean control values of EROD activity in all assays were38.09 ± 3.85, 2.09 ± 0.23 and 1.10 ± 0.10 pmol min�1 mg�1 of pro-tein, respectively for liver, gill and intestine. GST had mean activi-ties in control groups of 120.79 ± 4.46, 63.96 ± 3.51 and49.16 ± 3.73 nmol min�1 mg�1 of protein, in liver, gill and intes-tine, respectively. BaP metabolites in bile were 4584 ± 410 a.f.u.in control animals.

J. Costa et al. / Chemosphere 84 (2011) 1452–1460 1455
3.1. Water exposure
Biomarkers evaluated after waterborne exposure to BaP areshown in Fig. 1 (EROD activity), 2 (GST activity) and 3a (BaP metab-olites in bile).
Results show that water exposure caused BaP dose-related in-creases of EROD activity in liver (Fig. 1a), gills (Fig. 1b) and intes-tine (Fig. 1c). Moreover, EROD activity was, in most of thetreatments, significantly different from solvent control (p < 0.05)in all three tissues. Exceptions were exposure to 10 and 25 lg L�1
at day 14 in liver, and in intestine exposure to 10 lg L�1 (at days 7and 14) and 25 lg L�1 (at day 7). Regarding the effects of time ofexposure, a significant increase between days 7 and 14 was seenin gills and intestine after exposure to 25 lg L�1 of BaP. When com-paring the extent of EROD activity increase over the solvent con-
Fig. 1. EROD activities in liver (a), gill (b) and intestine (c) of Nile Tilapia afterwaterborne exposure to BaP (Solvent, 10, 25, 50 and 100 lg L�1). Values areexpressed in percent of activity (pmol min�1 mg�1 of protein) in relation to solventset to 100%, and are shown as mean ± standard error. Asterisks (⁄) denotesignificant differences (p < 0.05) in comparison to solvent. Capital letters denotesignificant differences (p < 0.05) between days within the same treatment. n = 4–10.
trol, maximum increases were seen in intestine (from 105% to2876% increase, Fig. 1c), followed by gills (from 544% to 1639% in-crease, Fig. 1b) and liver (from 70% to 644% increase, Fig. 1a).
Regarding phase II enzyme, GST, its activity, increased signifi-cantly (p < 0.05) in liver (after 14 d of exposure – Fig. 2a) and gills(after 7 d of exposure – Fig. 2b) upon exposure to 100 lg L�1 of BaP(39 and 66% increases respectively). At day 7 no differences wereseen in GST intestine activity, but after 14 of exposure its activitydecreased significantly (p < 0.05) after exposure to 50 and100 lg L�1, achieving a maximum decrease over solvent controlof 64% after exposure to 100 lg L�1 of BaP (Fig. 2c).
BaP metabolites in bile of exposed animals (10, 25, 50 and100 lg L�1) were always significantly higher than the levels re-corded in solvent, and increased with the concentration of the con-taminant and with the time of exposure, with the exception of
Fig. 2. GST activities in liver (a), gill (b) and intestine (c) of Nile Tilapia afterwaterborne exposure to BaP (Solvent, 10, 25, 50 and 100 lg L�1). Values areexpressed in percent of activity (nmol min�1 mg�1 of protein) in relation to solventset to 100%, and are shown as mean ± standard error. Asterisks (⁄) denotesignificant differences (p < 0.05) in comparison to solvent. Capital letters denotesignificant differences (p < 0.05) between days within the same treatment. n = 4–10.
1456 J. Costa et al. / Chemosphere 84 (2011) 1452–1460
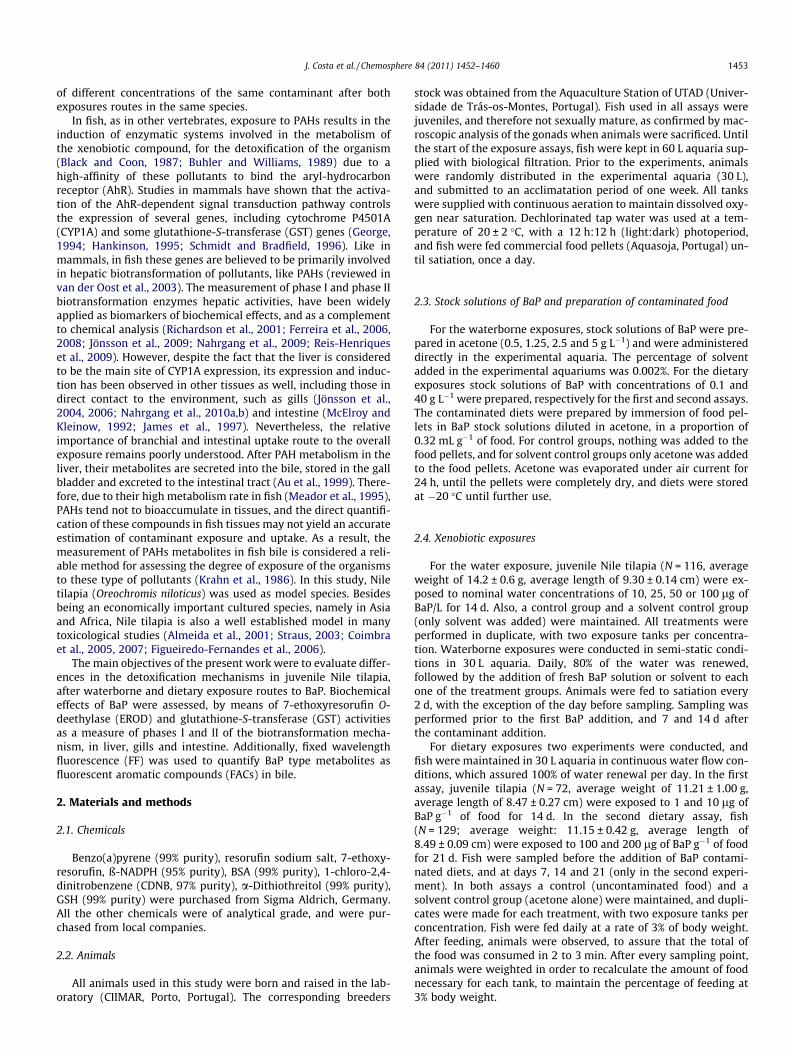
100 lg L�1 at day 14 (Fig. 3a). Results showed that after 7 d ofexposure to 10 lg L�1, BaP type metabolites were 83 times higherwhen comparing to the solvent (8256% increase), and the maxi-mum levels were seen after 14 d of exposure to 50 lg L�1, with a356 fold increase (35 590%). Moreover, BaP metabolites showedsignificant positive correlations (p < 0.05) with EROD activity in li-ver (r = 0.92), gills (r = 0.89) and intestine (r = 0.65).
3.2. Diet exposure
Results of EROD and GST activities in Nile tilapia after dietaryexposure to 1 and 10 lg of BaP g�1 of food are shown in Figs. 4and 5, respectively.
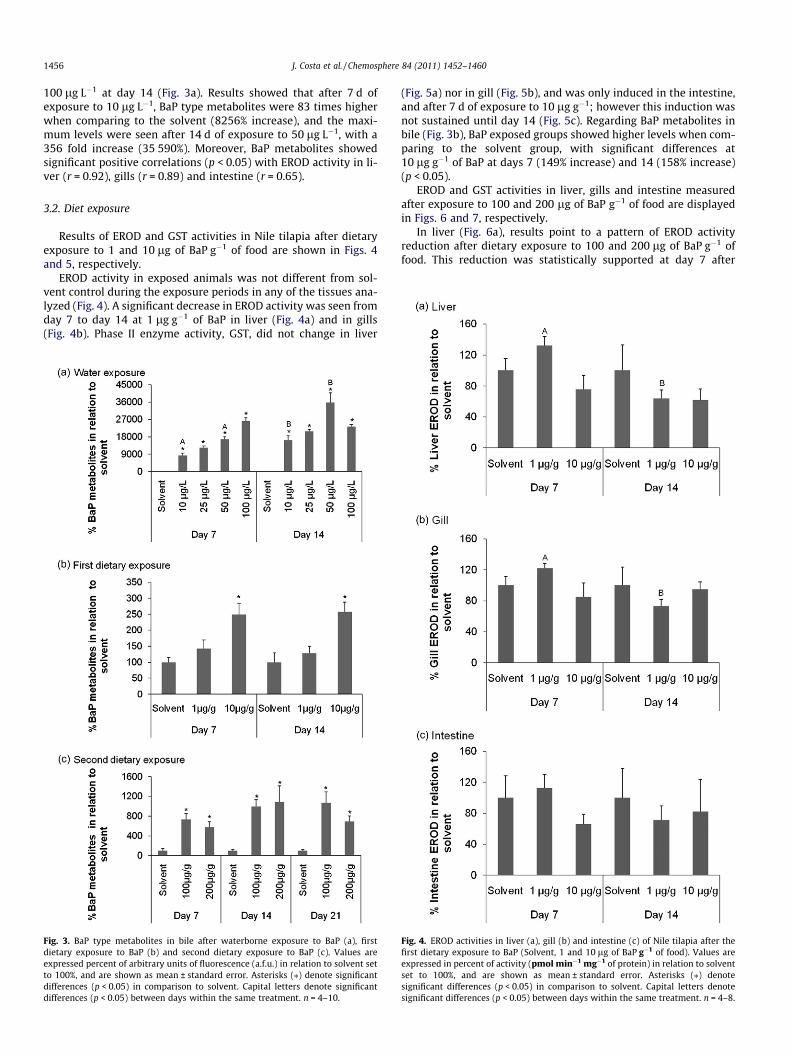
EROD activity in exposed animals was not different from sol-vent control during the exposure periods in any of the tissues ana-lyzed (Fig. 4). A significant decrease in EROD activity was seen fromday 7 to day 14 at 1 lg g�1 of BaP in liver (Fig. 4a) and in gills(Fig. 4b). Phase II enzyme activity, GST, did not change in liver
Fig. 3. BaP type metabolites in bile after waterborne exposure to BaP (a), firstdietary exposure to BaP (b) and second dietary exposure to BaP (c). Values areexpressed percent of arbitrary units of fluorescence (a.f.u.) in relation to solvent setto 100%, and are shown as mean ± standard error. Asterisks (⁄) denote significantdifferences (p < 0.05) in comparison to solvent. Capital letters denote significantdifferences (p < 0.05) between days within the same treatment. n = 4–10.
(Fig. 5a) nor in gill (Fig. 5b), and was only induced in the intestine,and after 7 d of exposure to 10 lg g�1; however this induction wasnot sustained until day 14 (Fig. 5c). Regarding BaP metabolites inbile (Fig. 3b), BaP exposed groups showed higher levels when com-paring to the solvent group, with significant differences at10 lg g�1 of BaP at days 7 (149% increase) and 14 (158% increase)(p < 0.05).
EROD and GST activities in liver, gills and intestine measuredafter exposure to 100 and 200 lg of BaP g�1 of food are displayedin Figs. 6 and 7, respectively.
In liver (Fig. 6a), results point to a pattern of EROD activityreduction after dietary exposure to 100 and 200 lg of BaP g�1 offood. This reduction was statistically supported at day 7 after
Fig. 4. EROD activities in liver (a), gill (b) and intestine (c) of Nile tilapia after thefirst dietary exposure to BaP (Solvent, 1 and 10 lg of BaP g�1 of food). Values areexpressed in percent of activity (pmol min�1 mg�1 of protein) in relation to solventset to 100%, and are shown as mean ± standard error. Asterisks (⁄) denotesignificant differences (p < 0.05) in comparison to solvent. Capital letters denotesignificant differences (p < 0.05) between days within the same treatment. n = 4–8.
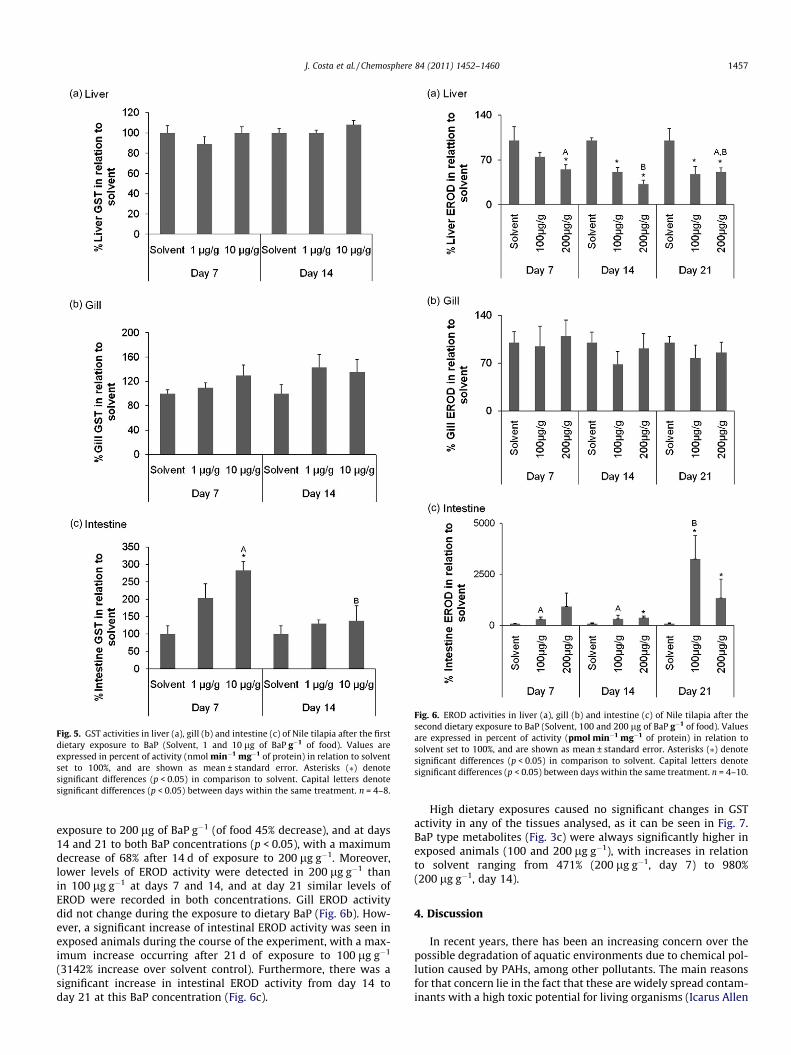
Fig. 5. GST activities in liver (a), gill (b) and intestine (c) of Nile tilapia after the firstdietary exposure to BaP (Solvent, 1 and 10 lg of BaP g�1 of food). Values areexpressed in percent of activity (nmol min�1 mg�1 of protein) in relation to solventset to 100%, and are shown as mean ± standard error. Asterisks (⁄) denotesignificant differences (p < 0.05) in comparison to solvent. Capital letters denotesignificant differences (p < 0.05) between days within the same treatment. n = 4–8.
Fig. 6. EROD activities in liver (a), gill (b) and intestine (c) of Nile tilapia after thesecond dietary exposure to BaP (Solvent, 100 and 200 lg of BaP g�1 of food). Valuesare expressed in percent of activity (pmol min�1 mg�1 of protein) in relation tosolvent set to 100%, and are shown as mean ± standard error. Asterisks (⁄) denotesignificant differences (p < 0.05) in comparison to solvent. Capital letters denotesignificant differences (p < 0.05) between days within the same treatment. n = 4–10.
J. Costa et al. / Chemosphere 84 (2011) 1452–1460 1457
exposure to 200 lg of BaP g�1 (of food 45% decrease), and at days14 and 21 to both BaP concentrations (p < 0.05), with a maximumdecrease of 68% after 14 d of exposure to 200 lg g�1. Moreover,lower levels of EROD activity were detected in 200 lg g�1 thanin 100 lg g�1 at days 7 and 14, and at day 21 similar levels ofEROD were recorded in both concentrations. Gill EROD activitydid not change during the exposure to dietary BaP (Fig. 6b). How-ever, a significant increase of intestinal EROD activity was seen inexposed animals during the course of the experiment, with a max-imum increase occurring after 21 d of exposure to 100 lg g�1
(3142% increase over solvent control). Furthermore, there was asignificant increase in intestinal EROD activity from day 14 today 21 at this BaP concentration (Fig. 6c).
High dietary exposures caused no significant changes in GSTactivity in any of the tissues analysed, as it can be seen in Fig. 7.BaP type metabolites (Fig. 3c) were always significantly higher inexposed animals (100 and 200 lg g�1), with increases in relationto solvent ranging from 471% (200 lg g�1, day 7) to 980%(200 lg g�1, day 14).
4. Discussion
In recent years, there has been an increasing concern over thepossible degradation of aquatic environments due to chemical pol-lution caused by PAHs, among other pollutants. The main reasonsfor that concern lie in the fact that these are widely spread contam-inants with a high toxic potential for living organisms (Icarus Allen

Fig. 7. GST activities in liver (a), gill (b) and intestine (c) of Nile tilapia after thesecond dietary exposure to BaP (Solvent, 100 and 200 lg of BaP g�1 of food). Valuesare expressed in percent of activity (nmol min�1 mg�1 of protein) in relation tosolvent set to 100%, and are shown as mean ± standard error. Asterisks (⁄) denotesignificant differences (p < 0.05) in comparison to solvent. Capital letters denotesignificant differences (p < 0.05) between days within the same treatment. n = 4–9.
1458 J. Costa et al. / Chemosphere 84 (2011) 1452–1460
and Moore, 2004). As a result, increased efforts have been made inorder to understand the causal relationships between contaminantexposure and measurable biological and biochemical effects inaquatic organisms, with the integrated use of biomarkers of expo-sure. In the present study we aimed to achieve a deeper under-standing of the effects of BaP in Nile tilapia, after two routes ofexposure, waterborne and dietary exposures, and also to assessthe usefulness of widely used biomarkers in monitoring studies.
After water exposure to BaP, EROD activity in liver (Fig. 1a), gills(Fig. 1b) and intestine (Fig. 1c) increased during the exposure per-iod. These results show that waterborne exposure led to BaPmetabolism in liver and also in extrahepatic tissues, as gills andintestine. Liver is considered to be the main metabolizing organin fish, having larger amounts of CYP1A enzymes than other tissues(as gills and intestine) (Hinton et al., 2008), and induction of hepa-tic EROD activity upon exposure to PAHs has been described in
other studies (Whyte et al., 2000; van der Oost et al., 2003; Or-tiz-Delgado et al., 2008; Kopecka-Pilarczyk and Correia, 2009). Thisis in agreement with our study since hepatic EROD was strongly in-duced after exposure to waterborne BaP, and the levels of ERODactivity were considerably higher in liver than in gill or intestine.The strong gill EROD induction observed after waterborne expo-sure to BaP, also indicates that a rapid absorption of this compoundoccurs in this tissue, and supports the idea that gills work in thefirst-pass metabolism of BaP. Similar results, with gill EROD induc-tion following BaP exposure, were obtained in other fish species aspolar cod (Nahrgang et al., 2010a) and rainbow trout (Jönssonet al., 2006). EROD induction observed in the intestine of BaP ex-posed animals was due to ingested contaminated water, that wasmetabolized by intestine CYP1A enzymes, before reaching the li-ver. Although Nile tilapia is a freshwater specie, and therefore aspecie who does not drink water in large quantities, there is alwayssome ingestion of water during feeding and breathing behaviours.Furthermore, our results are in agreement with immunohisto-chemical studies that compared the cellular expression of CYP1Ain different tissues, and that showed that exposure to waterborneBaP resulted in high staining in gill pillar cells and hepatocytes andmildly staining in gut mucosal epithelium (Van Veld et al., 1997).
Some authors have shown that gill EROD activity turned out tobe more sensitive than the liver in terms of CYP1A induction towaterborne BaP (Jönsson et al., 2006). The same happened in ourstudy, with gill and intestine showing to be more sensitive than li-ver to the presence of BaP, which strengthens the idea that it be-comes useful to measure EROD activity in extrahepatic tissues,that are involved in the first-pass metabolism of this compound(Levine and Oris, 1999).
After dietary exposures to BaP, the most significant result wasthe induction of EROD activity in the intestine, after exposure tothe highest BaP concentrations (Fig. 6c). This type of response, withinduction of intestinal but not hepatic EROD activity, have alsobeen shown in other studies in liver (Van Veld et al., 1987; Rey-nolds et al., 2003) and intestine (Van Veld et al., 1987; McElroyand Kleinow, 1992; James et al., 1997) of fish exposed to dietaryPAHs. Also, immunohistochemical studies showed that exposureto dietary BaP resulted in moderate CYP1A staining in liver buthigh intensity staining in gut mucosal epithelium (Van Veldet al., 1997; Ortiz-Delgado et al., 2005). We believe that, in ourstudy, the absence of hepatic EROD induction following dietaryexposures maybe directly related to partial BaP biotransformationin the intestine (by CYP1A enzymes), limiting the amount of parentcompound that reaches the liver for hepatic metabolism, as con-firmed by the induced intestinal EROD activity of these animals.However, in the second dietary assay, a reduction of hepatic ERODactivity was seen after exposure to high BaP concentrations(Fig. 6a), being statiscally significant at both concentrations atday 21. This situation could have been a result of protein degrada-tion caused by the high concentrations of BaP used (reviewed inWhyte et al., 2000), or due to suppression of CYP1A at a post-tran-scriptional level mediated through a down regulation of the CYP1Aprotein (Schlezinger and Stegeman, 2001). On the other hand, it iswell known that BaP biotransformation can originate more toxicmetabolites (Bauer et al., 1995; Kim et al., 1998; Morthy et al.,2003), and it is possible that part of this metabolites (formedmostly after intestinal CYP1A metabolism) could have entered sys-temic circulation (Kleinow et al., 1998), causing toxic effects at he-patic level that may have reflected in the lower EROD activities ofthis tissue. However, although the decrease of hepatic EROD activ-ity was statistically significant, it was relatively weak, leading us toalso consider the hypothesis of not being physiologically relevant.
BaP type metabolites measured in bile, increased after waterexposure to BaP (Fig. 3a), and were highly correlated with liver(r = 0.92; p < 0.05), gill (r = 0.89; p < 0.05) and intestine (r = 0.65;
J. Costa et al. / Chemosphere 84 (2011) 1452–1460 1459
p < 0.05) EROD activities. The liver correlation corroborates the factthat exposure of fish to waterborne BaP, leads to a pathway of highhepatic metabolism by CYP1A enzymes. Moreover, correlations be-tween EROD and bile metabolites in extrahepatic tissues also sug-gest that the majority of BaP metabolites formed in gill andintestine are reabsorbed into the blood stream and then releasedin the gall bladder. Regarding BaP type metabolites in the dietaryexperiments, an increase was also seen in BaP exposed animals(Fig. 3b and c), that was correlated with intestinal EROD activity(r = 0.62, p > 0.05), but not with hepatic EROD activity. Taken to-gether these results indicate that, probably, dietary BaP metabo-lites formed in the intestine were reabsorbed into the blood forenterohepatic circulation and then excreted in the bile, as shownby Kleinow et al., 1998. Although we cannot compare the realamount of BaP that is metabolized under each one of the routesof exposure, it seems also important to highlight the fact that, lev-els of BaP metabolites were much more elevated after water expo-sure (achieving a fold increase of 356 times over solvent) than afterdietary exposures (achieving a fold increase of 10 times over thesolvent), despite the very high levels of BaP used after both expo-sures routes. These results suggest that, in field studies, the levelsof biliary metabolites may give an indication of the main route ofexposure to the contaminant.
Results obtained for phase II enzyme GST were not very clear,since in the case of changes in activity after BaP exposure, onlyslight variations were seen. The data available in the literatureregarding GST use as a biomarker of exposure to pollutants is notvery consistent, since some authors reported increases in this en-zyme activity, while others did not observe any changes or even re-ported considerable reductions in its activity after exposure to PAHcontaminants (reviewed in van der Oost et al., 2003). Induction ofGST activity was reported after waterborne exposure to BaP of P.microps (Vieira et al., 2008) and S. marmoratus (Wu et al., 2007).When it comes to dietary exposures to contaminants, someauthors reported inductions of intestinal GST activities, but noinduction of hepatic GST (Van Veld et al., 1991; James et al.,1997), suggesting a complementary role with phase I EROD in bio-transformation of contaminants. Our findings corroborate the ideathat phase II enzyme GST with CDNB as substrate has low sensibil-ity to the presence of BaP, and should not be applied per se, as abiomarker of exposure to this pollutant. However, on the basis ofsubstrate specificity, immunological cross reactivity and proteinsequence data, mammalian citosolic GSTs have been grouped intoseven classes: Alpha, Mu, Pi, Theta, Sigma, Omega and Zeta (Hayeset al., 2005) and previous publications have considered that theGST isoforms have distinct affinities towards the substrate CDNB(Martinez-Lara et al., 1996; Hoarau et al., 2002). Moreover, somestudies have shown that, in fish, different responses are seen inGST isoforms after exposure to xenobiotics (Martinez-Lara et al.,1996; Pérez-Lopez et al., 2002; Kim et al., 2010), with some show-ing inducing patterns, while others do not. Therefore it is possiblethat, if some isoforms were upregulated and others downregulateddue to BaP exposure, the net result could be no change on total GSTactivity, which can possibly mean that the lack of changes in GSTactivity after BaP exposure does not necessarily indicate that thiscompound had no effect on GST activity.
In conclusion, this study has shown that the disposition and ef-fects of BaP in biotransformation pathways in Nile tilapia dependon the route of exposure to the contaminant. Waterborne exposureto BaP resulted in an induction of phase I enzyme EROD in liver, gilland intestine, while in dietary exposure route induction of ERODwas only seen in intestine, and after exposure to the highest con-centrations of the pollutant. Therefore, EROD activity is a reliablebiomarker of exposure to BaP in Nile tilapia and, besides liver, bar-rier tissues, like gills and intestine, should also be considered inbiomonitoring studies. BaP metabolites are good reflectors of expo-
sure to BaP, despite the route of exposure, and the levels of metab-olites can also be indicative of the route of exposure, since waterexposure leads to much higher levels of the metabolites than die-tary exposure. The activity of phase II enzyme GST with CDNB doesnot seem as a reliable biomarker of exposure to BaP regardless theroute of exposure.
Acknowledgements
The authors thank to Carlos Rosa and Hugo Santos for the tech-nical assistance provided during the experimental assays. Thisstudy was funded by the Portuguese Science and Technology Foun-dation (FCT) through a fellowship to J. Costa (SFRH/BD/40237/2007), M. Ferreira (SFRH/BPD/26708/2006) and L. Rey-Salgueiro(SFRH/BPD/47011/2008).
References
Almeida, J.A., Novelli, E.L.B., Dal Pai Silva, M., Alves Júnior, R., 2001. Environmentalcadmium exposure and metabolic responses of the Nile tilapia, Oreochromisniloticus. Environ. Pollut. 114, 169–175.
Au, D.W.T., Wu, R.S.S., Zhou, B.S., Lam, P.K.S., 1999. Relationship betweenultrastructural changes and EROD activities in liver of fish exposed tobenzo[a]pyrene. Environ. Pollut. 104, 235–247.
Bauer, E., Guo, Z., Ueng, Y.-F., Bell, L.C., Zeldin, D., Guengerich, F.P., 1995. Oxidationof benzo[a]pyrene by recombinant human cytochrome P450 enzymes. Chem.Res. Toxicol. 8, 136–142.
Black, S.D., Coon, M.J., 1987. P-450 cytochromes: structure and function. Adv.Enzymol. Relat. Areas Mol. Biol. 60, 35–87.
Bloomquist, J.R., 1992. Intrinsic lethality of chloride-channel-directed insecticidesand convulsants in mammals. Toxicol. Lett. 60, 289–298.
Bruggeman, W.A., Opperhuizen, A., Wijbenga, A., Hutzinger, O., 1984.Bioaccumulation of super-lipophilic chemicals in fish. Toxicol. Environ. Chem.7, 173–189.
Bucheli, T.D., Fent, K., 1995. Induction of cytochrome P450 as a biomarker forenvironmental contamination in aquatic ecosystems. Crit. Rev. Environ. Sci.Technol. 25, 201–268.
Buhler, D.R., Williams, D.E., 1989. Enzymes involved in metabolism of PAH by fishand other aquatic animals: oxidative enzymes (or phase I enzymes). In:Varanasi, U. (Ed.), Metabolism of Polyciclic Aromatic Hidrocarbons in theAquatic Environment. CRC Press, Boca Raton, pp. 151–184.
Cheikyula, J.O., Koyama, J., Uno, S., 2008. Comparative study of bioconcentration andEROD activity induction in the japanese flounder, red sea bream, and javamedaka exposed to polycyclic aromatic hydrocarbons. Environ. Toxicol. 23,354–362.
Coimbra, A.M., Reis-Henriques, M.A., Darras, V.M., 2005. Circulating thyroidhormone levels and iodothyronine deiodinase activities in Nile tilapia(Oreochromis niloticus) following dietary exposure to endosulfan and aroclor1254. Comp. Biochem. Physiol. Part C. 141, 8–14.
Coimbra, A.M., Figueiredo-Fernandes, A., Reis-Henriques, M.A., 2007. Nile tilapia(Oreochromis niloticus), liver morphology, CYP1A activity and thyroid hormonesafter endosulfan dietary exposure. Pestic. Biochem. Physiol. 89, 230–236.
Driver, C.J., Ligotke, M.W., Van Voris, P., McVeety, B.D., Greenspan, B.J., Drown, D.B.,1991. Routes of uptake and their relative contribution to the toxicologicresponse of northern bobwhite (Colinus virginianus) to an organophosphatepesticide. Environ. Toxicol. Chem. 10, 21–33.
Ferreira, M., Moradas-Ferreira, P., Reis-Henriques, M.A., 2006. The effect of long-term depuration on phase I and phase II biotransformation in mullets (Mugilcephalus) chronically exposed to pollutants in river Douro estuary. Portugal.Mar. Environ. Res. 61, 326–338.
Ferreira, M., Antunes, P., Costa, J., Amado, J., Gil, O., Pousão-Ferreira, P., Vale, C., Reis-Henriques, M.A., 2008. Organochlorine bioaccumulation and biomarkers levelsin culture and wild white seabream (Diplodus sargus). Chemosphere 73, 1669–1674.
Figueiredo-Fernandes, A., Fontaínhas-Fernandes, A., Peixoto, F., Rocha, E., Reis-Henriques, M.A., 2006. Effects of gender and temperature on oxidative stressenzymes in Nile tilapia Oreochromis niloticus exposed to paraquat. Pestic.Biochem. Physiol. 85, 97–103.
George, S.G., 1994. Enzymology and molecular biology of phase II xenobiotic-conjugating enzymes in fish. In: Malins, D.C., Ostrander, G.K. (Eds.), AquaticToxicology; Molecular, Biochemical and Cellular perspectives. Lewis Publishers,CRC press, pp. 37/85.
Grant, S.M., Brown, J.A., 1999. Variation in condition of coastal New found land 0-group Atlantic cod (Gadus morhua): field and laboratory studies using simplecondition indices. Mar. Biol. 133, 611–620.
Grimmer, G., Brune, H., Dettbarn, G., Heinrich, U., Jacob, J., Mohtashamipur, E.,Norpoth, K., Pott, F., Wenzel-Hartung, R., 1988. Urinary and faecal excretion ofchrysene and chrysene metabolites by rats after oral, intraperitoneal,intratracheal or intrapulmonary application. Arch. Toxicol. 62, 401–405.
Habig, W.H., Pabst, M.J., Jakoby, W.B., 1974. Glutathione s-transferases the firstenzymatic step in mercapturic acid formation. J. Biol. Chem. 249, 7130–7139.
1460 J. Costa et al. / Chemosphere 84 (2011) 1452–1460
Hankinson, O., 1995. The aryl hydrocarbon receptor complex. Annu. Rev. Pharmacol.Toxicol. 35, 307–340.
Hayes, J.D., Flanagan, J.U., Jowsey, I.R., 2005. Glutathione Transferases. Annu. Rev.Pharmacol. Toxicol. 45, 51–88.
Hendricks, J.D., Meyers, T.R., Shelton, D.W., Casteel, J.L., Bailey, G.S., 1985.Hepatocarcinogenicity of benzo[a]pyrene to rainbow trout by dietaryexposure and intraperitoneal injection. J. Natl. Cancer Inst. 74, 839–851.
Hinton, D.E., Segner, H., Au, D.W.T., Kullman, S.W., Hardman, R.C., 2008. Livertoxicity. In: Di Giulio, R.T., Hinton, D.E. (Eds.), The Toxicology of Fishes. CRCPress, Taylor & Francis Group, pp. 327–400.
Hoarau, P., Garello, G., Gnassia-Barelli, M., Romeo, M., Girard, J., 2002. Purificationand partial characterization of seven glutathione S- transferase isoforms fromthe clam Ruditapes decussatus. Eur. J. Biochem. 269, 4359–4366.
Icarus Allen, J., Moore, M.N., 2004. Environmental prognostics: Is the current use ofbiomarkers appropriate for environmental risk evaluation? Mar. Environ. Res.58, 227–232.
James, M.O.A., Morris, A.H., Kleinow, K.M., Tong, Z., 1997. Dietary modulation ofphase 1 and phase 2 activities with benzo(a)pyrene and related compounds inthe intestine but not the liver of the channel catfish, Ictalurus punctatus. DrugMetab. Dispos. 25, 346–354.
Jönsson, M.E., Brunström, B., Ingebrigtsen, K., Brandt, I., 2004. Cell-specific CYP1Aexpression and benzo[a]pyrene adduct formation in gills of rainbow trout(Oncorhynchus mykiss) following CYP1A induction in the laboratory and in thefield. Environ. Toxicol. Chem. 23, 874–882.
Jönsson, E.M., Abrahamson, A., Brunström, B., Brandt, I., 2006. Cytochrome P4501Ainduction in rainbow trout gills and liver following exposure to waterborneindigo, benzo[a]pyrene and 3, 3’, 4, 4’, 5-pentachlorobiphenyl. Aquat. Toxicol.79, 226–232.
Jönsson, M.E., Brunström, B., Brandt, I., 2009. The zebrafish gill model: Induction ofCYP1A, EROD and PAH adduct formation. Aquat. Toxicol. 91, 62–70.
Kim, J., Stansbury, K.H., Walker, N.J., Trush, M.A., Strickland, P.T., Sutter, T.R., 1998.Metabolism of benzo[a]pyrene and benzo[a]pyrene-7, 8-diol by humancytochrome P450 1B1. Carcinogenesis 19, 1847–1853.
Kim, J., Dahms, H., Rhee, J., Lee, Y., Han, K., Lee, J., 2010. Expression profiles of sevenglutathione S-transferase (GST) genes in cadmium-exposed river pufferfish(Takifugu obscurus). Comp. Biochem. Physiol., Part C. 151, 99–106.
Kleinow, K.M., James, M.O., Tong, Z., Venugopalan, C.S., 1998. Bioavailability andbiotransformation of benzo(a)pyrene in an isolated perfused in situ catfishintestinal preparation. Environ. Health Perspect. 106, 155–166.
Kopecka-Pilarczyk, J., Correia, A.D., 2009. Biochemical response in giltheadseabream (Sparus aurata) to in vivo exposure to a mix of selected PAHs.Ecotoxicol. Environ. Saf. 72, 1296–1302.
Krahn, M.M., Kittle Jr, L.J., MacLeod Jr, W.D., 1986. Evidence for exposure of fish tooil spilled into the Columbia river. Mar. Environ. Res. 20, 291–298.
Krahn, M.M., Ylitalo, G.M., Buzitis, J., Bolton, J.L., Wigren, C.A., Chan, S.-L., Varanasi,U., 1993. Analyses for petroleum-related contaminants in marine fish andsediments following the Gulf oil spill. Mar. Pollut. Bull. 27, 285–292.
Latimer, J.S., Zheng J., 2003. The sources, transport, and fate of PAHs in the marineenvironment. In: Peter, E.T.D. (Ed.), Pahs: An Ecotoxicological Perspective, pp.7–33.
Levine, S.L., Oris, J.T., 1999. CYP1A expression in liver and gill of rainbow troutfollowing waterborne exposure: Implications for biomarker determination.Aquat. Toxicol. 46, 279–287.
Lin, E.L.C., Cormier, S.M., Torsella, J.A., 1996. Fish biliary polycyclic aromatichydrocarbon metabolites estimated by fixed-wavelength fluorescence.Comparison with HPLC-fluorescent detection. Ecotoxicol. Environ. Saf. 35, 16–23.
Lowry, O.H., Rosebrough, N.J., Farr, A.L., Randall, R.J., 1951. Protein measurementwith the folin phenol reagent. J. Biol. Chem. 193, 265–275.
Martínez-Lara, E., Toribio, F., López-Barea, J., Bárcena, J.A., 1996. Glutathione-S-Transferase isoenzyme patterns in the Gilthead Seabream (Spaurus aurata)exposed to environmental contaminants. Comp. Biochem. Physiol. Part C 2,215–220.
McElroy, A.E., Kleinow, K.M., 1992. In vitro metabolism of Benzo(a)pyrene andBenzo(a)pyrene-7,8-dihydrodiol by liver and intestinal mucosa homogenatesfrom the winter flounder (Pseudopleuronectes americanus). Mar. Environ. Res.34, 279–285.
Meador, J.P., Stein, J.E., Reichert, W.L., Varanasi, U., 1995. Bioaccumulation ofpolycyclic aromatic hydrocarbons by marine organisms. Rev. Environ. Contam.Toxicol. 143, 79–165.
Moorthy, B., Miller, K.P., Jiang, W., Williams, E.S., Kondraganti, S.R., Ramos, K.S.,2003. Role of cytochrome P4501B1 in benzo[a]pyrene bioactivation to DNA-binding metabolites in mouse vascular smooth muscle cells: Evidence from32P-postlabeling for formation of 3-hydroxybenzo[a]pyrene and benzo[a]pyrene-3,6-quinone as major proximate genotoxic intermediates. J.Pharmacol. Exp. Ther. 305, 394–401.
Nacci, D.E., Kohan, M., Pelletier, M., George, E., 2002. Effects of benzo[a]pyreneexposure on a fish population resistant to the toxic effects of dioxin-likecompounds. Aquat. Toxicol. 57, 203–215.
Nahrgang, J., Camus, L., Gonzalez, P., Goksøyr, A., Christiansen, J.S., Hop, H., 2009.PAH biomarker responses in polar cod (Boreogadus saida) exposed tobenzo(a)pyrene. Aquat. Toxicol. 94, 309–319.
Nahrgang, J., Camus, L., Gonzalez, P., Jönsson, M., Christiansen, J.S., Hop, H., 2010a.Biomarker responses in polar cod (Boreogadus saida) exposed to dietary crudeoil. Aquat. Toxicol. 96, 77–83.
Nahrgang, J., Jönsson, M., Camus, L., 2010b. EROD activity in liver and gills of polarcod (Boreogadus saida) exposed to waterborne and dietary crude oil. Mar.Environ. Res. 70, 120–123.
Ortiz-Delgado, J.B., Segner, H., Sarasquete, C., 2005. Cellular distribution andinduction of CYP1A following exposure of gilthead seabream, Sparus aurata, towaterborne and dietary benzo(a)pyrene and 2,3,7,8-tetrachlorodibenzo-p-dioxin: an immunohistochemical approach. Aquat. Toxicol. 75, 144–161.
Ortiz-Delgado, J.B., Behrens, A., Segner, H., Sarasquete, C., 2008. Tissue-specificinduction of EROD activity and CYP1A protein in Sparus aurata exposed to B(a)Pand TCDD. Ecotoxicol. Environ. Saf. 69, 80–88.
Pacheco, M., Santos, M.A., 1998. Induction of liver EROD and erythrocytic nuclearabnormalities by cyclophosphamide and PAHs in Anguilla anguilla. Ecotoxicol.Environ. Saf. 40, 71–76.
Pérez-Lopez, M., Nóvoa-Valiñas, M.C., Melgar-Riol, M.J., 2002. Glutathione S-transferase cytosolic isoforms as biomarkers of polychlorinated biphenyl(Arochlor-1254) experimental contamination in rainbow trout. Toxicol. Lett.136, 97–106.
Reis-Henriques, M.A., Ferreira, M., Coimbra, A.M., D’Silva, C., Costa, J., Shailaja, M.S.,2009. Phenanthrene and nitrite effects on juvenile sea bass, Dicentrarchuslabrax, using hepatic biotransformation enzymes, biliary fluorescence andmicronuclei as biomarkers. Ciencias Marinas 35, 29–40.
Reynolds, W.J., Feist, S.W., Jones, G.J., Lyons, B.P., Sheahan, D.A., Stentiford, G.D.,2003. Comparison of biomarker and pathological responses in flounder(Platichthys flesus) induced by ingested polycyclic aromatic hydrocarbon(PAH) contamination. Chemosphere 52, 1135–1145.
Rey-Salgueiro, L., Martínez-Carballo, E., García-Falcón, M.S., Simal-Gándara, J., 2008.Effects of a chemical company fire on the occurrence of polycyclic aromatichydrocarbons in plant foods. Food Chem. 108, 347–353.
Rey-Salgueiro, L., Martínez-Carballo, E., García-Falcón, M.S., González-Barreiro, C.,Simal-Gándara, J., 2009. Occurrence of polycyclic aromatic hydrocarbons andtheir hydroxylated metabolites in infant foods. Food Chem. 115, 814–819.
Richardson, D.M., Davies, I.M., Moffat, C.F., Pollard, P., Stag, R.M., 2001. Biliary PAHmetabolites and EROD activity in flounder (Platichthys flesus) from acontaminated estuarine environment. J. Environ. Monit. 3, 610–615.
Ricker, W.E., 1975. Computation and interpretation of biological statisticsof fish populations. Bull. Fish. Res. Board Can. 191, 1–382.
Schlezinger, J.J., Stegeman, J.J., 2001. Induction and suppression of cytochromeP4501A by 3,30 ,4,40 ,5-pentachlorobiphenyl and its relationship to oxidativestress in the marine fish scup (Stenotomus chrysops). Aquat. Toxicol. 52, 101–115.
Schmidt, J.V., Bradfield, C.A., 1996. Ah receptor signaling pathways. Annu. Rev. CellDev. Biol. 12, 55–89.
Straus, D.L., 2003. The acute toxicity of copper to blue tilapia in dilutions of settledpond water. Aquaculture 219, 233–240.
Tsukatani, H., Tanaka, Y., Sera, N., Shimizu, N., Kitamori, S., Inoue, N., 2003. Validityof mutagenic activity as an indicator of river water pollution. Environ. HealthPrev. Med. 8, 133–138.
van der Oost, R., Beyer, J., Vermeulen, N.P.E., 2003. Fish bioaccumulation andbiomarkers in environmental risk assessment: a review. Environ. Toxicol.Pharmacol. 13, 57–149.
Van Der Weiden, M.E.J., Hanegraaf, F.H.M., Eggens, M.L., Celander, M., Seinen, W.,van den Berg, M., 1994. Temporal induction of cytochrome P4501A in themirror carp (Cyprinus carpio) after administration of several polyciclic aromatichidrocarbons. Environ. Toxicol. Chem. 13, 797–802.
Van Veld, P.A., Vetter, R.D., Lee, R.F., Patton, J.S., 1987. Dietary fat inhibits theintestinal metabolism of the carcinogen benzo(a)pyrene in fish. J. Lipid Res. 28,810–817.
Van Veld, P., Ko, U., Vogelbein, W., Westbrook, D., 1991. Glutathione s-transferasein intestine, liver and hepatic lesions of mummichog (Fundulus heteroclitus)from a creosote-contaminated environment. Fish. Physiol. Biochem. 9, 369–376.
Van Veld, P.A., Vogelbein, W.K., Cochran, M.K., Goksoyr, A., Stegeman, J.J., 1997.Route-specific cellular expression of cytochrome P4501A (CYP1A) in fish(Fundulus heteroclitus) following exposure to aqueous and dietarybenzo[a]pyrene. Toxicol. Appl. Pharmacol. 142, 348–359.
Vieira, L.R., Sousa, A., Frasco, M.F., Lima, I., Morgado, F., Guilhermino, L., 2008. Acuteeffects of benzo[a]pyrene, anthracene and a fuel oil on biomarkers of thecommon goby Pomatoschistus microps (teleostei, gobiidae). Sci. Total Environ.395, 87–100.
Wang, C., Zhao, Y., Zheng, R., Ding, X., Wei, W., Zuo, Z., Chen, Y., 2006. Effects oftributyltin, benzo[a]pyrene, and their mixture on antioxidant defense systemsin Sebastiscus marmoratus. Ecotoxicol. Environ. Saf. 65, 381–387.
Wang, Y., Zheng, R., Zuo, Z., Chen, Y., Wang, C., 2008. Relation of hepatic ERODactivity and cytochrome P4501A level in Sebastiscus marmoratus exposed tobenzo[a]pyrene. J. Environ. Sci. 20, 101–104.
Whyte, J.J., Jung, R.E., Schmitt, C.J., Tillitt, D.E., 2000. Ethoxyresorufin-O-Deethylase(EROD) activity in fish as a biomarker of chemical exposure. Crit. Rev. Toxicol.30, 347–570.
Wolkers, J., Jørgensen, E.H., Nijmeijer, S.M., Witkamp, R.F., 1996. Time-dependentinduction of two distinct hepatic cytochrome P4501A catalytic activities at lowtemperatures in Arctic charr (Salvelinus alpinus) after oral exposure tobenzo(a)pyrene. Aquat. Toxicol. 35, 127–138.
Wu, Y.Q., Wang, C.G., Wang, Y., Zhao, Y., Chen, Y.X., Zuo, Z.H., 2007. Antioxidantresponses to benzo[a]pyrene, tributyltin and their mixture in the spleen ofSebasticus marmoratus. J. Environ. Sci. (China) 19, 1129–1135.


![Biomarkers in Nile Tilapia Oreochromis niloticus niloticus ... · biomarker measurements in Nile tilapia from the river Nile [2,23]. Therefore as a consequence, in this study I present](https://img.pdfslide.us/doc/110x75/5ebc4a0fc30023287c3a7364/biomarkers-in-nile-tilapia-oreochromis-niloticus-niloticus-biomarker-measurements.jpg)