Embed Size (px)
Citation preview
This is the author's preprint of: Botturi, L., Burgos, D., Caeiro, M., Derntl, M., Koper, R., Parrish, P., Sodhi, T., & Tattersall, C. (2008). Comparing Visual Instructional Design Languages: A Case Study. In L. Botturi & T. Stubbs (Eds.). Handbook of Visual Langauges in Instructional Design: Theories and Pratices (pp. 315-343). Hershey, PA: Idea Group. © IGI Global
Comparing Visual Instructional Design Languages: A Case Study Luca Botturi NewMinE Lab, University of Lugano Lugano, Switzerland Daniel Burgos The Open University of the Netherlands The Netherlands Manuel Caeiro University of Vigo Vigo, Spain Michael Derntl Research Lab for Educational Technologies, University of Vienna Vienna, Austria Rob Koper The Open University of the Netherlands The Netherlands Patrick Parrish The COMET® Program/University Corporation for Atmospheric Research Colorado, USA Tim Sodhi The Open University of the Netherlands The Netherlands Colin Tattersal The Open University of the Netherlands The Netherlands
This is the author's preprint of: Botturi, L., Burgos, D., Caeiro, M., Derntl, M., Koper, R., Parrish, P., Sodhi, T., & Tattersall, C. (2008). Comparing Visual Instructional Design Languages: A Case Study. In L. Botturi & T. Stubbs (Eds.). Handbook of Visual Langauges in Instructional Design: Theories and Pratices (pp. 315-343). Hershey, PA: Idea Group. © IGI Global
Comparing Visual Instructional Design Languages: A Case Study
Abstract
This handbook testifies that research on VIDL is lively, and has produced a number of interesting design languages and tools. This chapter wants to support readers in understanding the similarities and differences of some of the VIDL presented in the previous chapters, not in theory, but applying them to a specific instructional design case.
Introduction
The sequence of Chapters in part II of this handbook is the evidence that research in the field of VIDL is lively, and that interested readers have only to choose a language among many in order to apply some of the ideas presented in her/his own professional context. However, how to choose a language is not self-evident. Chapter 3.2 will provide a structured framework for this – but with this chapter we already want to provide a first space for comparing some of the proposed VIDL. The chapter is built around an instructional design case study, which is presented in the next section. The case study was submitted to all authors of chapters in part II of this handbook. Some of them took time to model it with their VIDL, and we collected here the results, which are presented in the following sections. In particular, the focus is on how each single design language contributes to the design, in what stages it intervenes, and what benefits it brings. The languages represented here are narrative-based design (Patrick Parrish, Chapter 2.1 in this handbook), E2ML (Luca Botturi, Chapter 2.2), CoUML (Michael Derntl, Chapter 2.4), POEML (Manuel Caeiro, Chapter 2.5), and IMS Learning Design (Daniel Burgos, Tim Sodhi, Colin Tattersall and Rob Koper, Chapter 2.10). The differences in style among the sections of the chapter are a natural consequence; as such, this is also a good example of international collaboration. Throughout the chapter, comments are kept to a minimum, as the main purpose is illustrative: to let the readers see the languages at work, in order to foster reflection and to provide elements for selection and discussion.
The Case Study
Setting The case study describes a 16-hour course in a blended learning environment. The topic of the course is Introduction to Instructional Design, and it follows a case-based and project-based teaching strategy. The client, who asked for the course, is the Director of a non-profit organization. The target is a group of 15 people, employed in a network of non-profit organizations that organize vocational training programs for dropout students in the age of 14-19. They are all social workers, and want to improve their skills in the design of instructional activities in order to better cope with their daily job. The course is held by single instructor, who can count on the help of a tutor for uploading materials online and for monitoring online discussions.
Learning goals
After the instruction, the course participants will be able to: 1. Plan and manage an instructional design process in their professional environment 2. Define the main roles and task involved in instructional design
This is the author's preprint of: Botturi, L., Burgos, D., Caeiro, M., Derntl, M., Koper, R., Parrish, P., Sodhi, T., & Tattersall, C. (2008). Comparing Visual Instructional Design Languages: A Case Study. In L. Botturi & T. Stubbs (Eds.). Handbook of Visual Langauges in Instructional Design: Theories and Pratices (pp. 315-343). Hershey, PA: Idea Group. © IGI Global
3. Foresee the critical points in instructional design projects 4. Given a design task, effectively apply specific design techniques, namely
a. Conducting a complete instructional analysis b. Properly define learning goals c. Define an instructional strategy d. Design a sound evaluation plan
Instructional strategy
The course must take into account its short duration and at the same time its ambitious learning goals. The main instructional idea is to develop concepts inductively through case studies, and then develop new skills by developing a project. Before the course starts, the instructor worked with the client and identified 4 real ongoing projects with the organization, which will be used as group projects during the course.
Course structure
This 16-hour course is articulated into 5 sessions: the first and the last are face-to-face, while the three in between are online. For all sessions is available a LMS which collects all course materials and supports online communication. In the following is presented the rough course schedule.
SESSION 1: FACE TO FACE INTRODUCTION (Saturday afternoon, 3h) 1. Introduction to the course (learning goals, schedule, evaluation), presentation of participants
(45’) 2. Discussion of some basic concepts, such as “instruction” “training” “education” “design”.
The instructor does this by presenting three case studies through slides and stimulating the discussion among the participants. (1h)
3. Introduction of the main phases of the ADDIE model (with slides, 45’) 4. Division into 4 groups of four people each, assignment of a project to each group (30’).
There is a 1-page project assignment for each group, plus some general written project guidelines.
All the materials used for this face-to-face session are collects in the LMS.
SESSION 2: INSTRUCTIONAL ANALYSIS (from Monday to Friday, 3h over 1 week) 1. Reading. For this session, the students connect to the LMS, and download a reading that
introduces the main elements to be considered in an instructional analysis. After that, they view a Flash presentation of a case study. If they have questions, they can post them to a discussion forum.
2. Group work. After completing the readings, the participants can work in their group forum (supervised by the instructor). Their goal is developing a sound instructional analysis plan. The instructor provides feedback during the work.
3. Submission: on Friday at 5:00 PM, all groups should submit a document presenting their instructional analysis plan.
4. Feedback. By Monday, the instructor reviews the plans and provides both group-specific feedback and general feedback (valid for all groups).
SESSION 3: LEARNING GOALS (from Monday to Friday, 3h over 1 week) 1. Reading. For this session, the students connect to the LMS, and download two readings
a. A reading that introduces the idea of learning goals b. A reading presenting Anderson and Krathwohl’s learning goals classification
table
This is the author's preprint of: Botturi, L., Burgos, D., Caeiro, M., Derntl, M., Koper, R., Parrish, P., Sodhi, T., & Tattersall, C. (2008). Comparing Visual Instructional Design Languages: A Case Study. In L. Botturi & T. Stubbs (Eds.). Handbook of Visual Langauges in Instructional Design: Theories and Pratices (pp. 315-343). Hershey, PA: Idea Group. © IGI Global
2. After that, they view a Flash presentation that presents the learning goals for the case study they already saw in session 2.
3. Group work. After completing the readings, the participants can work in their group forum (supervised by the instructor). Their goal is defining the 4 main learning goals for their project and classifying them on Anderson & Krathwohl’s table. The instructor provides feedback during the work.
4. Submission: on Friday at 5:00 PM, all groups should submit a document presenting their work
5. Feedback. By Monday, the instructor reviews the plans and provides both group-specific feedback and general feedback (valid for all groups).
SESSION 4: INSTRUCTIONAL STRATEGY (from Monday to Friday, 3h over 1 week) 1. Reading. For this session, the students connect to the LMS, and download Merrill’s paper
about 5-stars instruction. 2. After that, they view a Flash presentation that presents 5 case studies, focusing on the
different instructional strategies used in each of them. 3. Group work. After completing the readings, the participants can work in their group forum
(supervised by the instructor). Their goal is developing and instructional strategy. The instructor provides feedback during the work.
4. Submission: on Friday at 5:00 PM, all groups should submit a document presenting their work
5. Feedback. By Monday, the instructor reviews the plans and provides both group-specific feedback and general feedback (valid for all groups).
SESSION 5: FACE TO FACE (4h) 1. Short introduction to the session, and wrap-up of the work so far (15’) 2. Group presentation of each project’s work (1h) 3. Presentation of the key issues in evaluation (with slides, 45’ h) 4. Group work: develop an evaluation plan (1h) 5. Short group presentations (30’) 6. Conclusion and course evaluation (30’)
Evaluation
Formative evaluation is done on the basis of the project work. It has no certification value, but the instructor uses it for writing a report about the course for the client. The overall quality of the course is assessed with a standard paper-based survey provided by the participants’ home organization.
Tools
The course exploits a LMS, where all the learning materials are collected (slides, readings in PDF format, Flash animations with case studies), and which also hosts the main discussion forum and group discussion forums. Notice that the access to group discussion forums are restricted to group members, to the tutor, and the instructor.
Narrative-based approach
ID is always an iterative process, requiring successive levels of detail and revision as the design begins to take shape. The use of a narrative diagram for design deliberations might best begin very early in the design phase of a project, much earlier than the stage at which the case study stands as presented at the start of this chapter. But it can also be introduced at any stage in the
This is the author's preprint of: Botturi, L., Burgos, D., Caeiro, M., Derntl, M., Koper, R., Parrish, P., Sodhi, T., & Tattersall, C. (2008). Comparing Visual Instructional Design Languages: A Case Study. In L. Botturi & T. Stubbs (Eds.). Handbook of Visual Langauges in Instructional Design: Theories and Pratices (pp. 315-343). Hershey, PA: Idea Group. © IGI Global
design process to help evaluate the design for revisions or for adding the necessary detail to flesh it out further.
This example will demonstrate the latter application, how a narrative diagram can be brought into the design phase to evaluate the current status and to help add further details. Perhaps I am a consulting ID being brought in late in the project, or perhaps I am a new instructor asked to teach a course that has already been delivered, and I am working from a course plan passed to me from the previous instructor. At any rate, I’m assuming the logistics are set, and the basic structure of the five sessions is required. My task is to find ways to make sure the course experience will be engaging and effective for students, and so I will be examining its inherent aesthetic and narrative qualities and searching for ways to increase these.
In beginning to consider the qualities of the course, I see many positive aspects already in place that will contribute to creating an aesthetic learning experience. The course has generative goals, with a challenging project and natural conclusion that will unify the experience. All course sessions and the content they offer are included to lead toward this conclusion, which should help students experience a closing consummation more easily than they might without the project focus. The symmetrical structure, with opening and closing face-to-face sessions providing bookends for the three week-long online learning sessions, offers a nice pattern to work with as well, because the bookend sessions offer a grounding experience, a natural “call to adventure” and return to the starting point that may encourage students to reflect upon what has occurred between them, and how they have changed during the course.
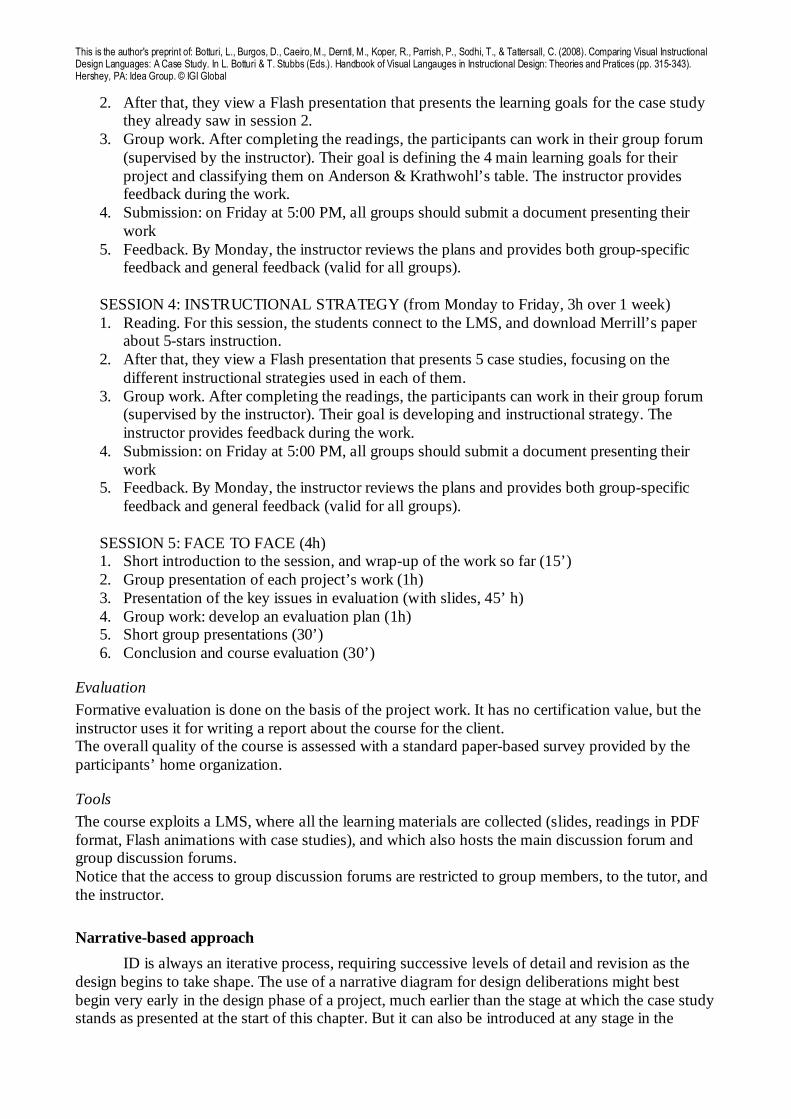
Because I will be looking for opportunities to create a three-act “plot” structure, with a well-formed opening and conclusion and clear “plot points” to help stimulate engagement, this structure is already supportive. But I want to lay it out visually and see what details will be needed to ensure that a good plot structure can be achieved. For example, I want to make sure that early engagement is stimulated and urged to rise, and to make certain that the action of the course rises steadily as well, will limited opportunities for waning engagement. In other words, one of my design goals will be to create a situation in which a student becomes inextricably involved in the course and whole-heartedly committed to see it through. A higher level goal will be to make the experience as meaningful as possible, so I need to look for additional ways to have the ideas and events build upon one another and come to a conclusion that unifies and heightens the course experience. Figure 1 illustrates the ideal plot structure for the experience—my goal, before considering how actual events will map to it.
Figure 1 – The narrative goal of the course experience.
This is the author's preprint of: Botturi, L., Burgos, D., Caeiro, M., Derntl, M., Koper, R., Parrish, P., Sodhi, T., & Tattersall, C. (2008). Comparing Visual Instructional Design Languages: A Case Study. In L. Botturi & T. Stubbs (Eds.). Handbook of Visual Langauges in Instructional Design: Theories and Pratices (pp. 315-343). Hershey, PA: Idea Group. © IGI Global
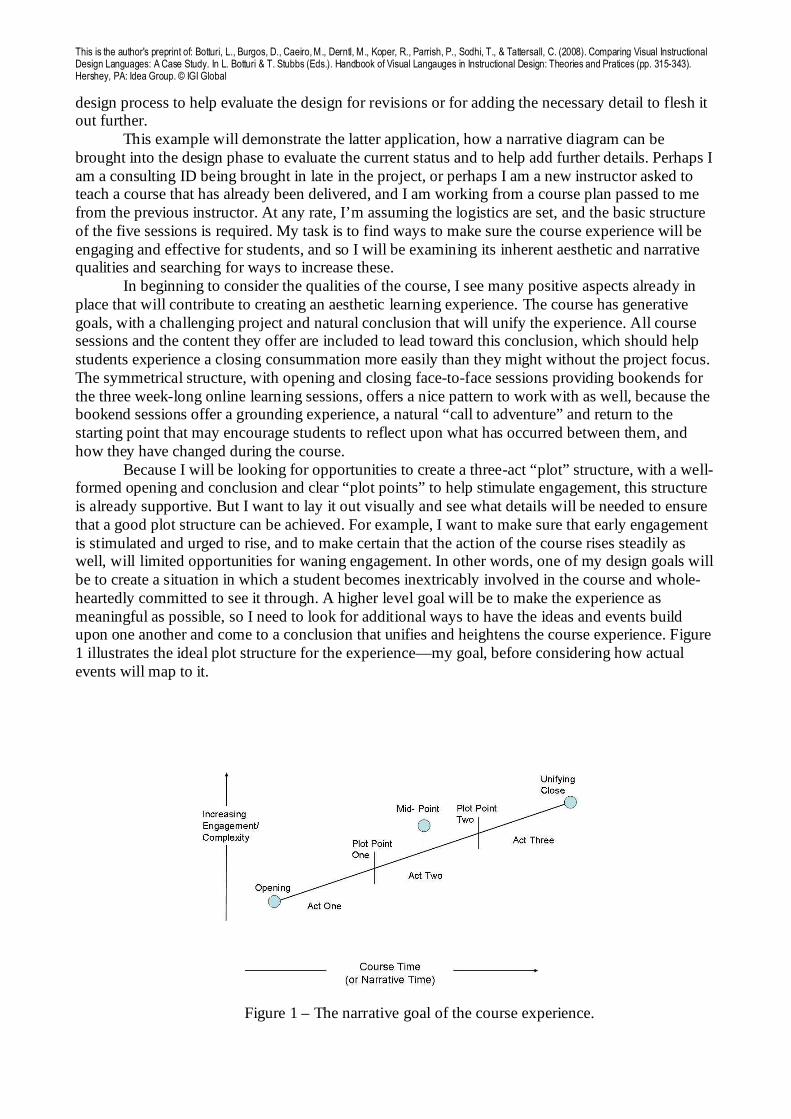
I begin by laying out the temporal axis of narrative diagram, deciding how the five-part structure of course structure can be imposed onto the 3-act structure of the narrative. Which elements will fall into each of the three acts? I decide that the breaks between acts and positions for the plot points will not always be the obvious beginnings or endings of the sessions as defined, but will instead be key points of instructor/student interactions. These are the places where the experience can be enriched and redirected by the instructor, or where deeper reflection on the part of students will create significant growth opportunities and shifts in their own subjective experience. Figure 2 shows my first iteration in laying out the course plot.
Figure 2 – A first iteration, determining the three-act structure of the course.
Looking at Figure 2, you can see that I have designated Act One as including the entire first
two sessions. Even though Session 1 is critical to establishing the course direction, Act One includes Session 2 because the pattern of the course is not set until the first assignments are undertaken. Similarly, Act Three is not merely Session 5, but also the group project work from Session 4 immediately preceding it, because the height of the final session is most likely the presentation of the group projects completed in Session 4. As it turns out, this breakout makes the acts similar in duration, but this was not necessary.
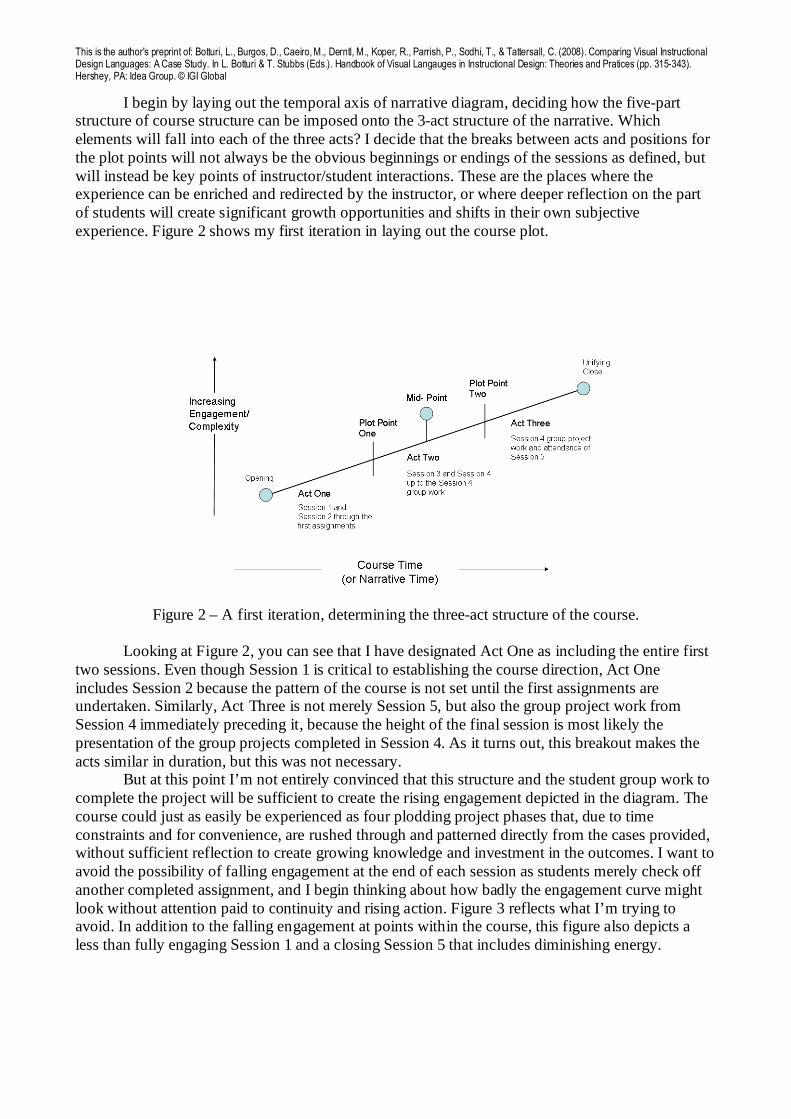
But at this point I’m not entirely convinced that this structure and the student group work to complete the project will be sufficient to create the rising engagement depicted in the diagram. The course could just as easily be experienced as four plodding project phases that, due to time constraints and for convenience, are rushed through and patterned directly from the cases provided, without sufficient reflection to create growing knowledge and investment in the outcomes. I want to avoid the possibility of falling engagement at the end of each session as students merely check off another completed assignment, and I begin thinking about how badly the engagement curve might look without attention paid to continuity and rising action. Figure 3 reflects what I’m trying to avoid. In addition to the falling engagement at points within the course, this figure also depicts a less than fully engaging Session 1 and a closing Session 5 that includes diminishing energy.
This is the author's preprint of: Botturi, L., Burgos, D., Caeiro, M., Derntl, M., Koper, R., Parrish, P., Sodhi, T., & Tattersall, C. (2008). Comparing Visual Instructional Design Languages: A Case Study. In L. Botturi & T. Stubbs (Eds.). Handbook of Visual Langauges in Instructional Design: Theories and Pratices (pp. 315-343). Hershey, PA: Idea Group. © IGI Global
Figure 3 – The engagement curve to avoid in this case.
The opening session should create initial engagement by establishing tension or a
problematic situation, as well as the promise of resolution. The closing session should sustain or even amplify the engagement by bringing the entire enterprise to a consummation that unifies all the activities that came before. Along the way, the plot points and mid-point should both reinvigorate engagement and stimulate reflection by doing one or more of the following:
� Bringing to light new, significant knowledge that causes the learner to see the situation from a new perspective (enriching the plot)
� Establishing new complications or complexities that reestablish the opening tension (adding plot complications)
� Creating a reversal by revealing a fallacy or inadequacy of previous thinking about the problems at hand (a peripeteia)
� Bringing a phase to completion, but also revealing new problems that existed, but were not yet apparent in the previous phases (moving the plot forward)
Based on these desired features, I identify several possibilities for the design enhancements I’d like to achieve.
� In the opening session, I will use an activity that gets students talking about their roles as designers of instruction, even if they hadn’t thought much about that role before. This will help establish the problematic situation the course is meant to address, their novice status as IDs, and may help personalize the course, generating goals students will embrace throughout.
� In the opening session, I will choose cases that are related to the kinds of projects this group may be involved with on the job, and ask learners to discern distinctions in the cases. I will choose cases that demonstrate differing levels of complexity in regards to the instructional situation, the learning goals, and the instructional strategy applied. I will also consider including a case that can be classified as a failure to give urgency to the projects and to allow later reflection about the reasons for the failure.
� In the opening session, I will avoid excessive “exposition” and, rather than a lecture about the ADDIE model, use Socratic Method to allow learners to discover the logic of the model. This will create ownership of the method that may carry through the course.
This is the author's preprint of: Botturi, L., Burgos, D., Caeiro, M., Derntl, M., Koper, R., Parrish, P., Sodhi, T., & Tattersall, C. (2008). Comparing Visual Instructional Design Languages: A Case Study. In L. Botturi & T. Stubbs (Eds.). Handbook of Visual Langauges in Instructional Design: Theories and Pratices (pp. 315-343). Hershey, PA: Idea Group. © IGI Global
� I will have the project groups submit all assignments in a place where all other students have access. This not only creates a pool of additional examples, but increases the urgency of project decisions.
� Plot Point One will be the feedback provided by the instructor for the first group assignment to do an instructional analysis. The instructor should be supportive, but find ways to challenge the groups to look more deeply into the instructional situation. The instructor should set an expectation that the additional assignments should be based on this deeper instructional analysis plan. Because it is unlikely that students can actually perform the instructional analysis, they will need to be asked to generate a set of expected, or possible, analysis data (as an author might generate a backstory).
� The mid-point will be a similar feedback provided for the second group assignment. The instructor should find ways to make students think more deeply about the learning goals and objectives, for example, making sure they have adequately addressed both cognitive and affective goals, and that these goals are well connected to the instructional analysis.
� Plot Point Two will be an instructor intervention on the weekend prior to the final group assignment. Students will be told that (a) a representative of the client management will attend the final course session to listen to and comment on final project reports, and (b) student groups must choose one additional instructional strategy to apply to the learning goals, and write a one-page description of how this strategy will address them, suggesting strengths and weaknesses over the primary strategy receiving a fuller treatment.
� The closing session, especially with a client representative in attendance, provides natural closure and intensity. But in addition, the instructor should, as much as possible, point out where the groups did or did not make strong connections to their previous steps in the project.
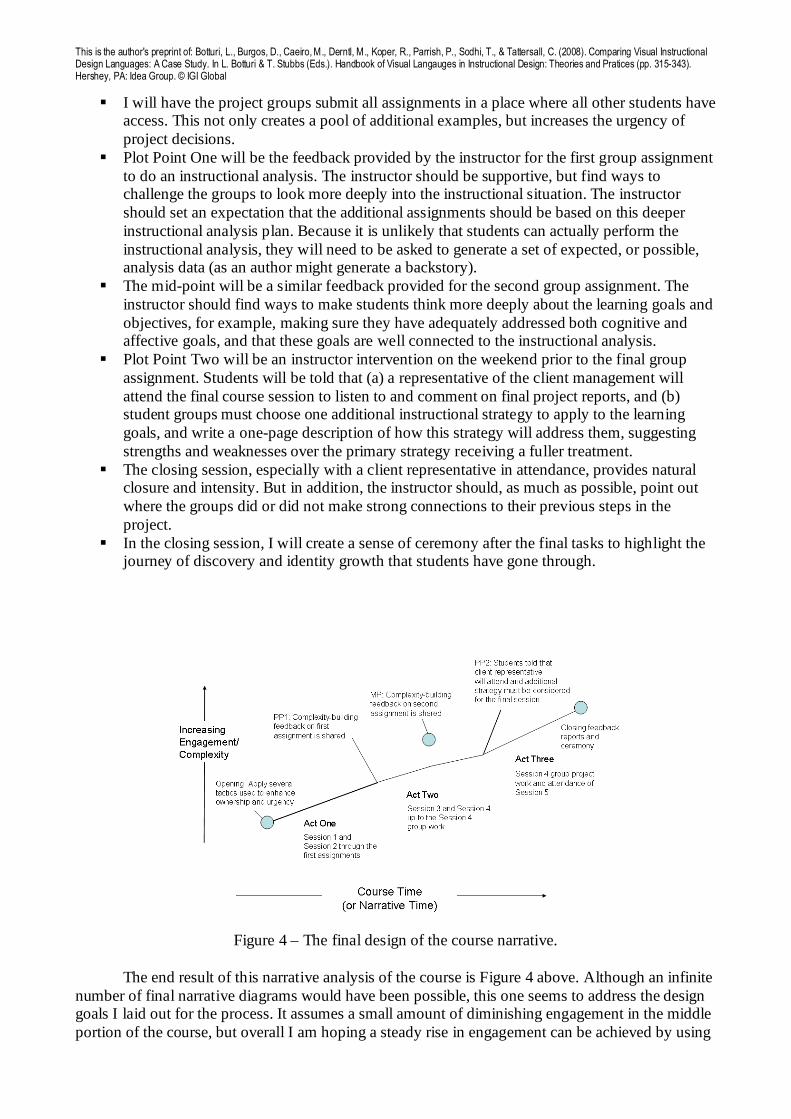
� In the closing session, I will create a sense of ceremony after the final tasks to highlight the journey of discovery and identity growth that students have gone through.
Figure 4 – The final design of the course narrative.
The end result of this narrative analysis of the course is Figure 4 above. Although an infinite
number of final narrative diagrams would have been possible, this one seems to address the design goals I laid out for the process. It assumes a small amount of diminishing engagement in the middle portion of the course, but overall I am hoping a steady rise in engagement can be achieved by using
This is the author's preprint of: Botturi, L., Burgos, D., Caeiro, M., Derntl, M., Koper, R., Parrish, P., Sodhi, T., & Tattersall, C. (2008). Comparing Visual Instructional Design Languages: A Case Study. In L. Botturi & T. Stubbs (Eds.). Handbook of Visual Langauges in Instructional Design: Theories and Pratices (pp. 315-343). Hershey, PA: Idea Group. © IGI Global
this design. The costs of performing the narrative analysis and creating the diagrams have been on the order of a few hours additional design time, especially if the diagrams were simply sketched on paper or a white board. However, these hours may have been spread over several days to allow reflection time. If desired, the final diagram might be formalized to document this aspect of the design for others in perhaps one additional hour or less. The benefits of using this process are that it may stimulate the designer or design team to pay closer attention to learner engagement and to create a more highly integrated instructional design.
E2ML
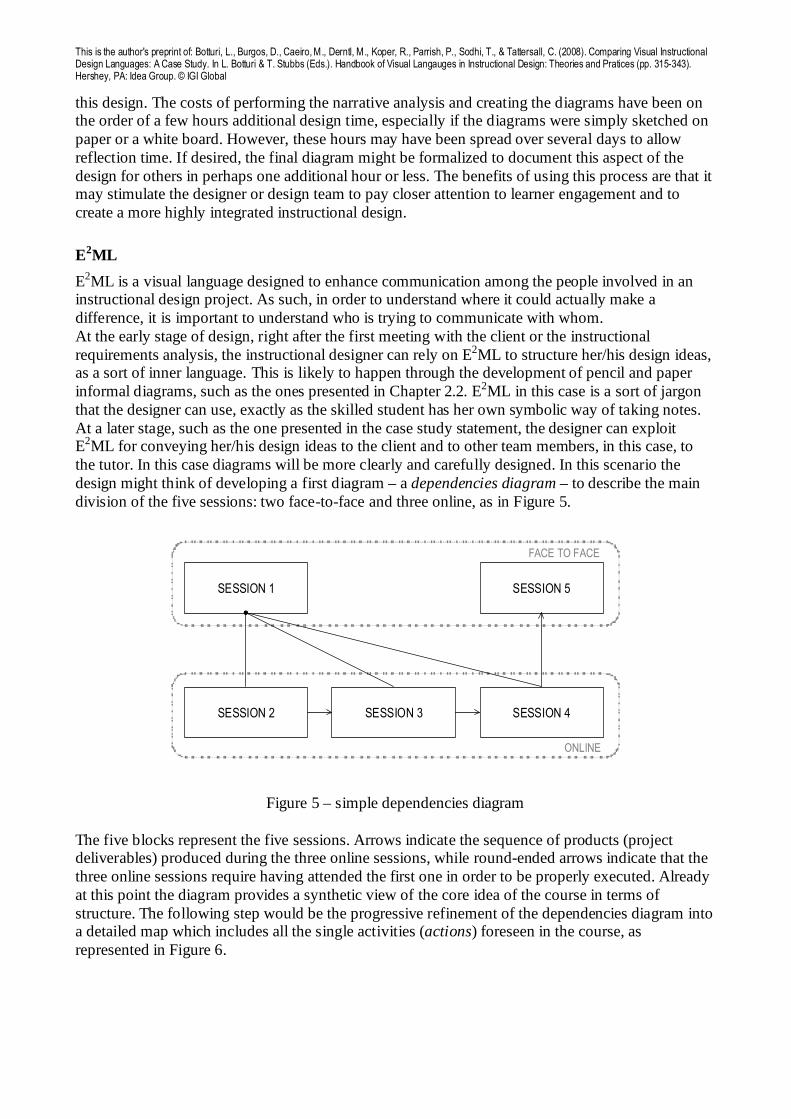
E2ML is a visual language designed to enhance communication among the people involved in an instructional design project. As such, in order to understand where it could actually make a difference, it is important to understand who is trying to communicate with whom. At the early stage of design, right after the first meeting with the client or the instructional requirements analysis, the instructional designer can rely on E2ML to structure her/his design ideas, as a sort of inner language. This is likely to happen through the development of pencil and paper informal diagrams, such as the ones presented in Chapter 2.2. E2ML in this case is a sort of jargon that the designer can use, exactly as the skilled student has her own symbolic way of taking notes. At a later stage, such as the one presented in the case study statement, the designer can exploit E2ML for conveying her/his design ideas to the client and to other team members, in this case, to the tutor. In this case diagrams will be more clearly and carefully designed. In this scenario the design might think of developing a first diagram – a dependencies diagram – to describe the main division of the five sessions: two face-to-face and three online, as in Figure 5.
SESSION 1 SESSION 5
SESSION 2 SESSION 3 SESSION 4
FACE TO FACE
ONLINE
Figure 5 – simple dependencies diagram
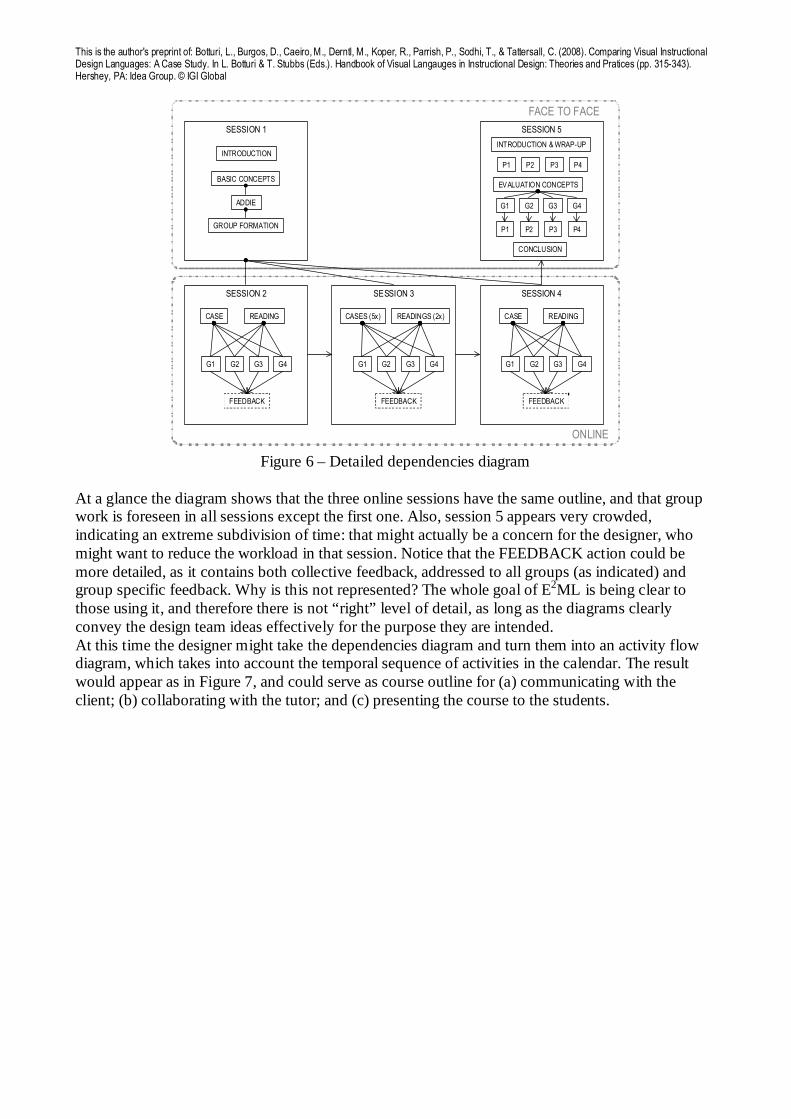
The five blocks represent the five sessions. Arrows indicate the sequence of products (project deliverables) produced during the three online sessions, while round-ended arrows indicate that the three online sessions require having attended the first one in order to be properly executed. Already at this point the diagram provides a synthetic view of the core idea of the course in terms of structure. The following step would be the progressive refinement of the dependencies diagram into a detailed map which includes all the single activities (actions) foreseen in the course, as represented in Figure 6.
This is the author's preprint of: Botturi, L., Burgos, D., Caeiro, M., Derntl, M., Koper, R., Parrish, P., Sodhi, T., & Tattersall, C. (2008). Comparing Visual Instructional Design Languages: A Case Study. In L. Botturi & T. Stubbs (Eds.). Handbook of Visual Langauges in Instructional Design: Theories and Pratices (pp. 315-343). Hershey, PA: Idea Group. © IGI Global
SESSION 1 SESSION 5
SESSION 2 SESSION 3 SESSION 4
FACE TO FACE
ONLINE
INTRODUCTION
BASIC CONCEPTS
ADDIE
GROUP FORMATION
CASES (5x)
G1 G2 G3 G4
FEEDBACK
READINGS (2x)CASE
G1 G2 G3 G4
FEEDBACK
READING CASE
G1 G2 G3 G4
FEEDBACK
READING
INTRODUCTION & WRAP-UP
EVALUATION CONCEPTS
CONCLUSION
P1 P2 P3 P4
G1 G2 G3 G4
P1 P2 P3 P4
Figure 6 – Detailed dependencies diagram
At a glance the diagram shows that the three online sessions have the same outline, and that group work is foreseen in all sessions except the first one. Also, session 5 appears very crowded, indicating an extreme subdivision of time: that might actually be a concern for the designer, who might want to reduce the workload in that session. Notice that the FEEDBACK action could be more detailed, as it contains both collective feedback, addressed to all groups (as indicated) and group specific feedback. Why is this not represented? The whole goal of E2ML is being clear to those using it, and therefore there is not “right” level of detail, as long as the diagrams clearly convey the design team ideas effectively for the purpose they are intended. At this time the designer might take the dependencies diagram and turn them into an activity flow diagram, which takes into account the temporal sequence of activities in the calendar. The result would appear as in Figure 7, and could serve as course outline for (a) communicating with the client; (b) collaborating with the tutor; and (c) presenting the course to the students.

This is the author's preprint of: Botturi, L., Burgos, D., Caeiro, M., Derntl, M., Koper, R., Parrish, P., Sodhi, T., & Tattersall, C. (2008). Comparing Visual Instructional Design Languages: A Case Study. In L. Botturi & T. Stubbs (Eds.). Handbook of Visual Langauges in Instructional Design: Theories and Pratices (pp. 315-343). Hershey, PA: Idea Group. © IGI Global
SESSION 1
SESSION 5
SESSION 2
SESSION 3
SESSION 4
INTRODUCTION
BASIC CONCEPTS
ADDIE
GROUP FORMATION
CASE
G1 G2 G3 G4
FEEDBACK
READING
INTRODUCTION & WRAP-UP
EVALUATION CONCEPTS
CONCLUSION
P1
P2
P3
P4
G1 G2 G3 G4
CASES (x5)
G1 G2 G3 G4
FEEDBACK
READINGS (x2)
CASE
G1 G2 G3 G4
FEEDBACK
READING
P1
P2
P3
P4
Week 1
Week 2
Week 3
Week 4
Week 5
Figure 7 – Activity flow
This is the author's preprint of: Botturi, L., Burgos, D., Caeiro, M., Derntl, M., Koper, R., Parrish, P., Sodhi, T., & Tattersall, C. (2008). Comparing Visual Instructional Design Languages: A Case Study. In L. Botturi & T. Stubbs (Eds.). Handbook of Visual Langauges in Instructional Design: Theories and Pratices (pp. 315-343). Hershey, PA: Idea Group. © IGI Global
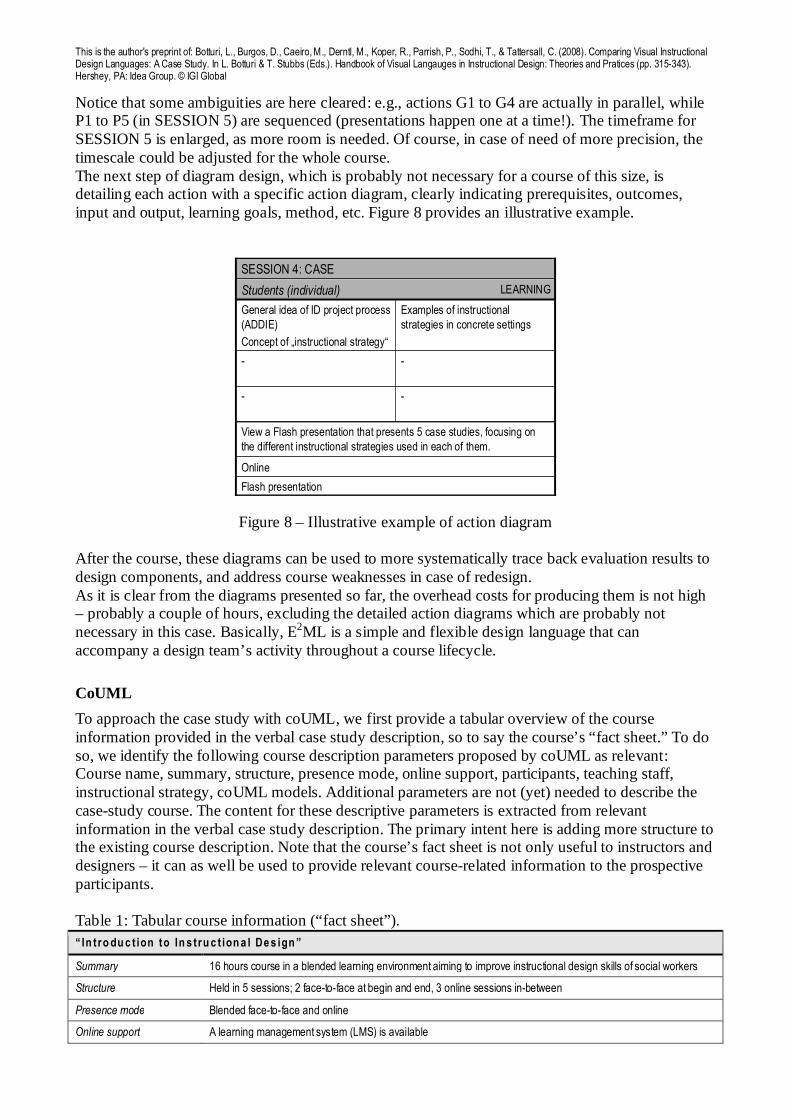
Notice that some ambiguities are here cleared: e.g., actions G1 to G4 are actually in parallel, while P1 to P5 (in SESSION 5) are sequenced (presentations happen one at a time!). The timeframe for SESSION 5 is enlarged, as more room is needed. Of course, in case of need of more precision, the timescale could be adjusted for the whole course. The next step of diagram design, which is probably not necessary for a course of this size, is detailing each action with a specific action diagram, clearly indicating prerequisites, outcomes, input and output, learning goals, method, etc. Figure 8 provides an illustrative example.
SESSION 4: CASE
Flash presentation
Online
View a Flash presentation that presents 5 case studies, focusing on
the different instructional strategies used in each of them.
--
--
Examples of instructional
strategies in concrete settings
General idea of ID project process
(ADDIE)
Concept of „instructional strategy“
Students (individual) LEARNING
Figure 8 – Illustrative example of action diagram
After the course, these diagrams can be used to more systematically trace back evaluation results to design components, and address course weaknesses in case of redesign. As it is clear from the diagrams presented so far, the overhead costs for producing them is not high – probably a couple of hours, excluding the detailed action diagrams which are probably not necessary in this case. Basically, E2ML is a simple and flexible design language that can accompany a design team’s activity throughout a course lifecycle.
CoUML
To approach the case study with coUML, we first provide a tabular overview of the course information provided in the verbal case study description, so to say the course’s “fact sheet.” To do so, we identify the following course description parameters proposed by coUML as relevant: Course name, summary, structure, presence mode, online support, participants, teaching staff, instructional strategy, coUML models. Additional parameters are not (yet) needed to describe the case-study course. The content for these descriptive parameters is extracted from relevant information in the verbal case study description. The primary intent here is adding more structure to the existing course description. Note that the course’s fact sheet is not only useful to instructors and designers – it can as well be used to provide relevant course-related information to the prospective participants. Table 1: Tabular course information (“fact sheet”). “ In tro du c t ion to In s tru c t ion a l De s ign ”
Summary 16 hours course in a blended learning environment aiming to improve instructional design skills of social workers
Structure Held in 5 sessions; 2 face-to-face at begin and end, 3 online sessions in-between
Presence mode Blended face-to-face and online
Online support A learning management system (LMS) is available
This is the author's preprint of: Botturi, L., Burgos, D., Caeiro, M., Derntl, M., Koper, R., Parrish, P., Sodhi, T., & Tattersall, C. (2008). Comparing Visual Instructional Design Languages: A Case Study. In L. Botturi & T. Stubbs (Eds.). Handbook of Visual Langauges in Instructional Design: Theories and Pratices (pp. 315-343). Hershey, PA: Idea Group. © IGI Global
“ In tro du c t ion to In s tru c t ion a l De s ign ”
Participants 15 social workers
Teaching staff 1 instructor, 1 tutor
Instructional strategy Case- and project based learning using a blended learning approach; “integrated” instruction through lecture and hands-on experience
coUML models Course structure, learning goals, documents, detailed course activities
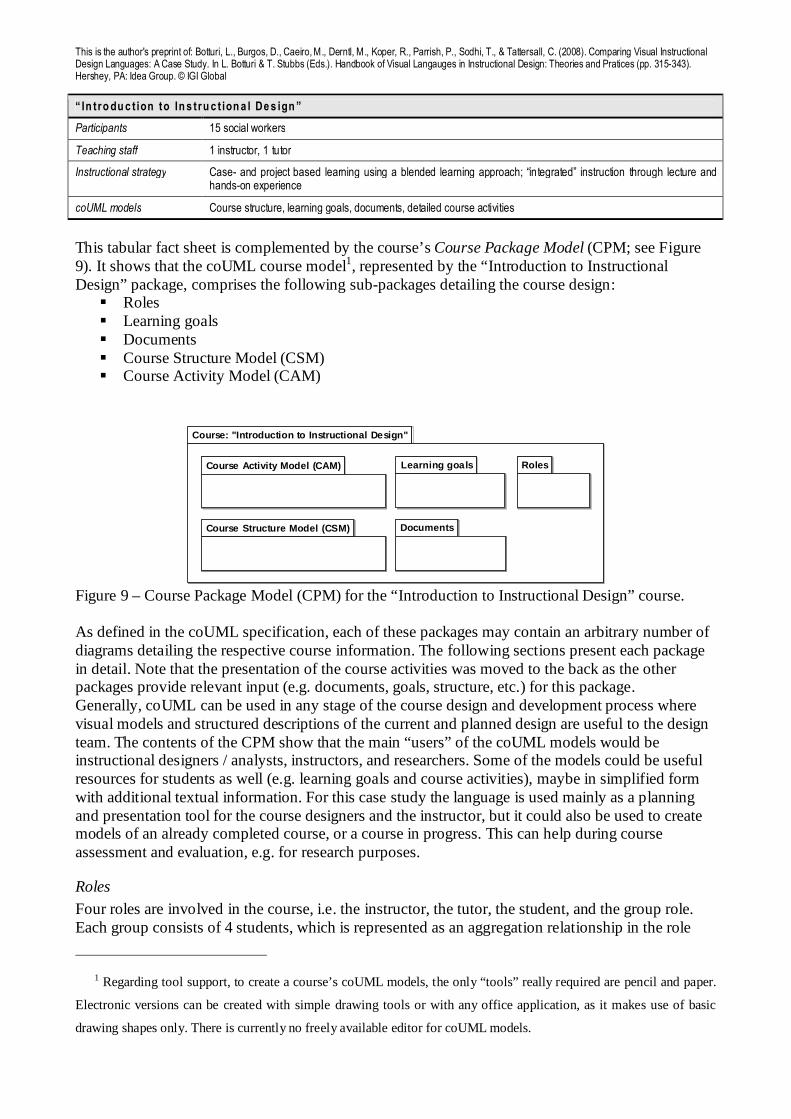
This tabular fact sheet is complemented by the course’s Course Package Model (CPM; see Figure 9). It shows that the coUML course model1, represented by the “Introduction to Instructional Design” package, comprises the following sub-packages detailing the course design:
� Roles � Learning goals � Documents � Course Structure Model (CSM) � Course Activity Model (CAM)
Course: "Introduction to Instructional Design"
Course Activity Model (CAM)
Documents
Learning goals Roles
Course Structure Model (CSM)
Figure 9 – Course Package Model (CPM) for the “Introduction to Instructional Design” course. As defined in the coUML specification, each of these packages may contain an arbitrary number of diagrams detailing the respective course information. The following sections present each package in detail. Note that the presentation of the course activities was moved to the back as the other packages provide relevant input (e.g. documents, goals, structure, etc.) for this package. Generally, coUML can be used in any stage of the course design and development process where visual models and structured descriptions of the current and planned design are useful to the design team. The contents of the CPM show that the main “users” of the coUML models would be instructional designers / analysts, instructors, and researchers. Some of the models could be useful resources for students as well (e.g. learning goals and course activities), maybe in simplified form with additional textual information. For this case study the language is used mainly as a planning and presentation tool for the course designers and the instructor, but it could also be used to create models of an already completed course, or a course in progress. This can help during course assessment and evaluation, e.g. for research purposes.
Roles
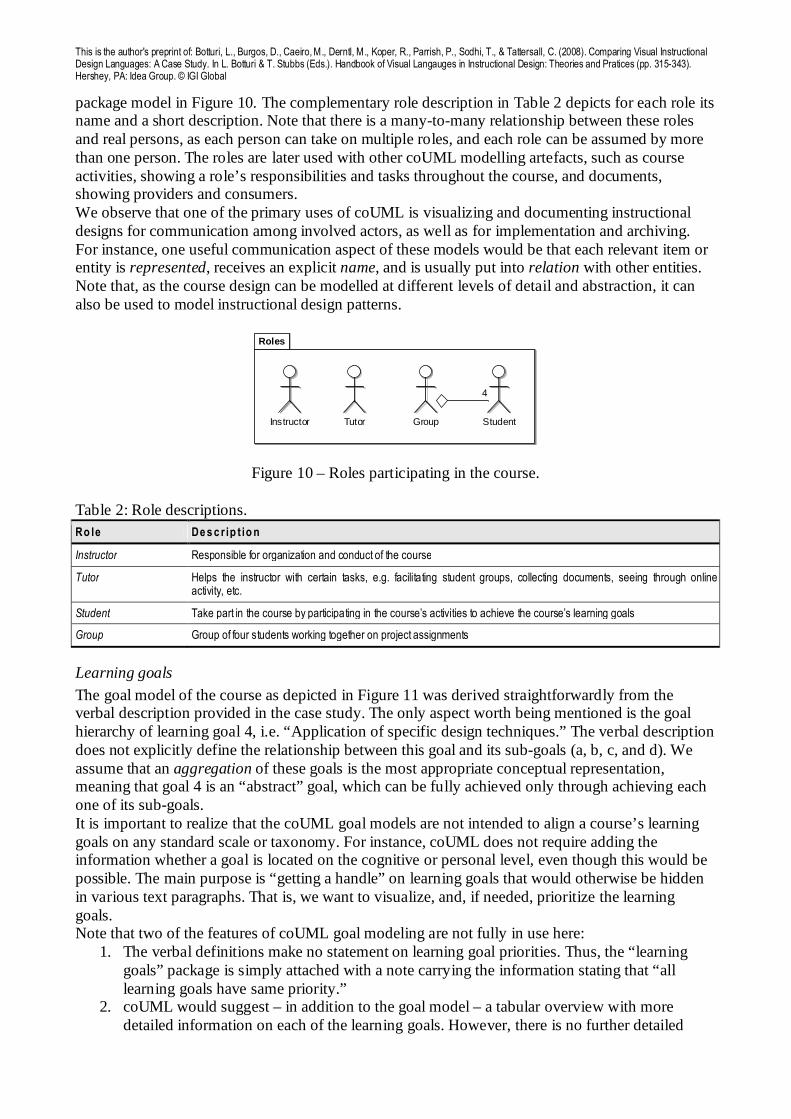
Four roles are involved in the course, i.e. the instructor, the tutor, the student, and the group role. Each group consists of 4 students, which is represented as an aggregation relationship in the role
1 Regarding tool support, to create a course’s coUML models, the only “tools” really required are pencil and paper.
Electronic versions can be created with simple drawing tools or with any office application, as it makes use of basic
drawing shapes only. There is currently no freely available editor for coUML models.
This is the author's preprint of: Botturi, L., Burgos, D., Caeiro, M., Derntl, M., Koper, R., Parrish, P., Sodhi, T., & Tattersall, C. (2008). Comparing Visual Instructional Design Languages: A Case Study. In L. Botturi & T. Stubbs (Eds.). Handbook of Visual Langauges in Instructional Design: Theories and Pratices (pp. 315-343). Hershey, PA: Idea Group. © IGI Global
package model in Figure 10. The complementary role description in Table 2 depicts for each role its name and a short description. Note that there is a many-to-many relationship between these roles and real persons, as each person can take on multiple roles, and each role can be assumed by more than one person. The roles are later used with other coUML modelling artefacts, such as course activities, showing a role’s responsibilities and tasks throughout the course, and documents, showing providers and consumers. We observe that one of the primary uses of coUML is visualizing and documenting instructional designs for communication among involved actors, as well as for implementation and archiving. For instance, one useful communication aspect of these models would be that each relevant item or entity is represented, receives an explicit name, and is usually put into relation with other entities. Note that, as the course design can be modelled at different levels of detail and abstraction, it can also be used to model instructional design patterns.
Roles
Instructor Tutor StudentGroup
4
Figure 10 – Roles participating in the course.
Table 2: Role descriptions. Ro le De s c r ip t io n
Instructor Responsible for organization and conduct of the course
Tutor Helps the instructor with certain tasks, e.g. facilitating student groups, collecting documents, seeing through online activity, etc.
Student Take part in the course by participating in the course’s activities to achieve the course’s learning goals
Group Group of four students working together on project assignments
Learning goals
The goal model of the course as depicted in Figure 11 was derived straightforwardly from the verbal description provided in the case study. The only aspect worth being mentioned is the goal hierarchy of learning goal 4, i.e. “Application of specific design techniques.” The verbal description does not explicitly define the relationship between this goal and its sub-goals (a, b, c, and d). We assume that an aggregation of these goals is the most appropriate conceptual representation, meaning that goal 4 is an “abstract” goal, which can be fully achieved only through achieving each one of its sub-goals. It is important to realize that the coUML goal models are not intended to align a course’s learning goals on any standard scale or taxonomy. For instance, coUML does not require adding the information whether a goal is located on the cognitive or personal level, even though this would be possible. The main purpose is “getting a handle” on learning goals that would otherwise be hidden in various text paragraphs. That is, we want to visualize, and, if needed, prioritize the learning goals. Note that two of the features of coUML goal modeling are not fully in use here:
1. The verbal definitions make no statement on learning goal priorities. Thus, the “learning goals” package is simply attached with a note carrying the information stating that “all learning goals have same priority.”
2. coUML would suggest – in addition to the goal model – a tabular overview with more detailed information on each of the learning goals. However, there is no further detailed

This is the author's preprint of: Botturi, L., Burgos, D., Caeiro, M., Derntl, M., Koper, R., Parrish, P., Sodhi, T., & Tattersall, C. (2008). Comparing Visual Instructional Design Languages: A Case Study. In L. Botturi & T. Stubbs (Eds.). Handbook of Visual Langauges in Instructional Design: Theories and Pratices (pp. 315-343). Hershey, PA: Idea Group. © IGI Global
information available regarding any of the learning goals in the verbal description. Nonetheless, for demonstration purposes we do provide this information in Table 3; note that the goal number in the leftmost column refers to the number indicated in the verbal description and in the goals model for each goal, respectively.
Learning goals
All learning goals
have same priority.«goal»
Plan and manage IDprocess
1
«goal»
Define main roles andtasks
2
«goal»
Foresee critical pointsin ID process
3
«goal»
Application of specificdesign techniques
4
«goal»
Conduct instructionalanalysis
4a
«goal»
Define instructionalstrategy
4c «goal»
Design evaluationplan
4d
«goal»
Define learning goals
4b
Figure 11 – Model of the course’s learning goals.
Table 3: Learning goal descriptions. ID De s c r ip t io n
1 Plan and manage an instructional design process in their professional environment
2 Define the main roles and task involved in instructional design
3 Foresee the critical points in instructional design projects
4 Given a design task, effectively apply specific design techniques
4a Conducting a complete instructional analysis
4b Properly define learning goals
4c Define an instructional strategy
4d Design a sound evaluation plan
Documents
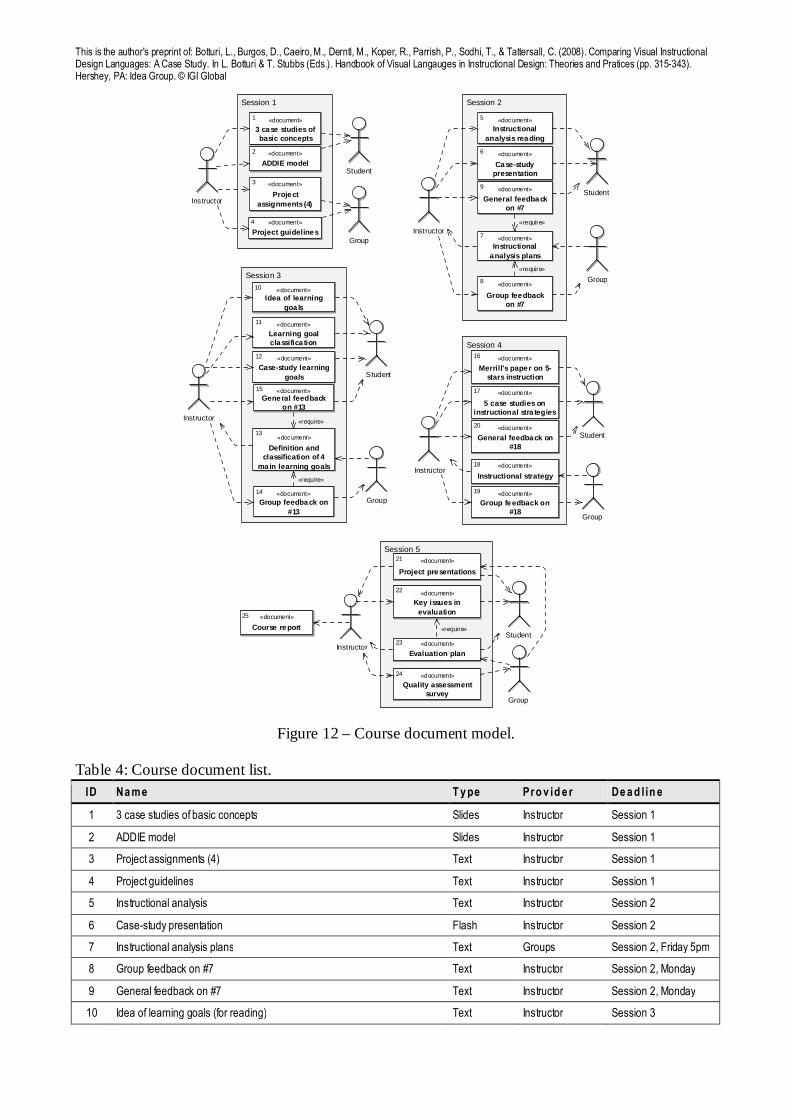
From the part on “course structure” in the case study description we are able to identify the documents modelled in Figure 12. As suggested by coUML, the subsequent Table 4 lists in more detail the documents and their properties. Note that we leave out the “description” property for space reasons and because the document names appear descriptive enough. With the model and the table it is easily possible to answer at any stage the question, “Who must provide which document at what time?” Any identified document can later be used in other models, for instance to demonstrate which course activities support the achievement of some goal. Grouping is used to arrange all documents used in the respective course session. This should make the diagram easier to read, even though it is loaded with 25 documents. As defined by coUML, the roles are represented by actor figures, and the document “flows” are indicated with dashed arrows (i.e. dependencies).
This is the author's preprint of: Botturi, L., Burgos, D., Caeiro, M., Derntl, M., Koper, R., Parrish, P., Sodhi, T., & Tattersall, C. (2008). Comparing Visual Instructional Design Languages: A Case Study. In L. Botturi & T. Stubbs (Eds.). Handbook of Visual Langauges in Instructional Design: Theories and Pratices (pp. 315-343). Hershey, PA: Idea Group. © IGI Global
Session 1 Session 2
Session 3
Session 4
Session 5
«document»
3 case studies ofbasic concepts
1
«document»
General feedbackon #7
9
«document»
Merrill's paper on 5-stars instruction
16
«document»
ADDIE model
2
«document»Idea of learning
goa ls
10
«document»
5 case studies oninstructional stra tegies
17
«document»
Projectassignments (4)
3
«document»
Instructional strategy
18
«document»
Project guidelines4
«document»
Case-study learninggoals
12
«document»
Group feedback on#18
19
«document»Instructional
analysis reading
5
«document»
Learning goalclassifica tion
11
«document»
General feedback on#18
20
«document»Instructional
analysis plans
7
«document»
Definition andclassification of 4
ma in learning goals
13
«document»
Project presentations
21
«document»
Group feedbackon #7
8
«document»General feedback
on #13
15
«document»
Evaluation plan
23
«document»
Quality assessmentsurvey
24
«document»
Case-studypresentation
6
«document»Group feedback on
#13
14
«document»
Key issues inevaluation
22
«document»
Course report
25
Instructor
Instructor
Instructor
Instructor
Instructor
Group
Student
Group
Group
Student
Student
Student
Group
Student
Group
«require»
«require»
«require»
«require»
«require»
Figure 12 – Course document model.
Table 4: Course document list. ID Na me T y pe Pro v id e r De a d l in e
1 3 case studies of basic concepts Slides Instructor Session 1
2 ADDIE model Slides Instructor Session 1
3 Project assignments (4) Text Instructor Session 1
4 Project guidelines Text Instructor Session 1
5 Instructional analysis Text Instructor Session 2
6 Case-study presentation Flash Instructor Session 2
7 Instructional analysis plans Text Groups Session 2, Friday 5pm
8 Group feedback on #7 Text Instructor Session 2, Monday
9 General feedback on #7 Text Instructor Session 2, Monday
10 Idea of learning goals (for reading) Text Instructor Session 3

This is the author's preprint of: Botturi, L., Burgos, D., Caeiro, M., Derntl, M., Koper, R., Parrish, P., Sodhi, T., & Tattersall, C. (2008). Comparing Visual Instructional Design Languages: A Case Study. In L. Botturi & T. Stubbs (Eds.). Handbook of Visual Langauges in Instructional Design: Theories and Pratices (pp. 315-343). Hershey, PA: Idea Group. © IGI Global
ID Na me T y pe Pro v id e r De a d l in e
11 Learning goal classification by Anderson & Krathwohl (for reading) Text Instructor Session 3
12 Case-study learning goals Flash Instructor Session 3
13 Definition and classification of 4 main learning goals Text Groups Session 3, Friday 5pm
14 Group feedback on #13 Text Instructor Session 3, Monday
15 General feedback on #13 Text Instructor Session 3, Monday
16 Merrill’s paper on 5-stars instruction Paper Instructor Session 4
17 5 case studies on instructional strategies Flash Instructor Session 4
18 Instructional strategy Text Groups Session 4, Friday 5pm
19 Group feedback on #18 Text Instructor Session 4, Monday
20 General feedback on #18 Text Instructor Session 4, Monday
21 Project presentations Slides Groups Session 5
22 Key issues in evaluation Slides Instructor Session 5
23 Evaluation plan Text Groups Session 5
24 Quality assessment survey Paper Instructor Session 5
25 Course report Report Instructor (End)
Course Structure Model (CSM)
In this section we approach the core of the coUML models of our course. The CSM in Figure 13 shows that the whole course model consists of one main aggregate activity model (aligning the five sessions; visually emphasized through light-grey fill color), and one detailed activity diagram for each of the sessions 1–5.
Course Structure Model (CSM)
Introduction toInstructiona l Design
Session 1: Introduction
Session 2: Instructionalanalysis
Session 3: Learninggoals
Session 4: Instructionalstrategy
Session 5: Conclusion
Figure 13: The Course Structure Model (CSM).
Course Activity Model (CAM)
From the CSM it is clear that the CAM comprises six models. In this section the CAM is represented by the following four figures:
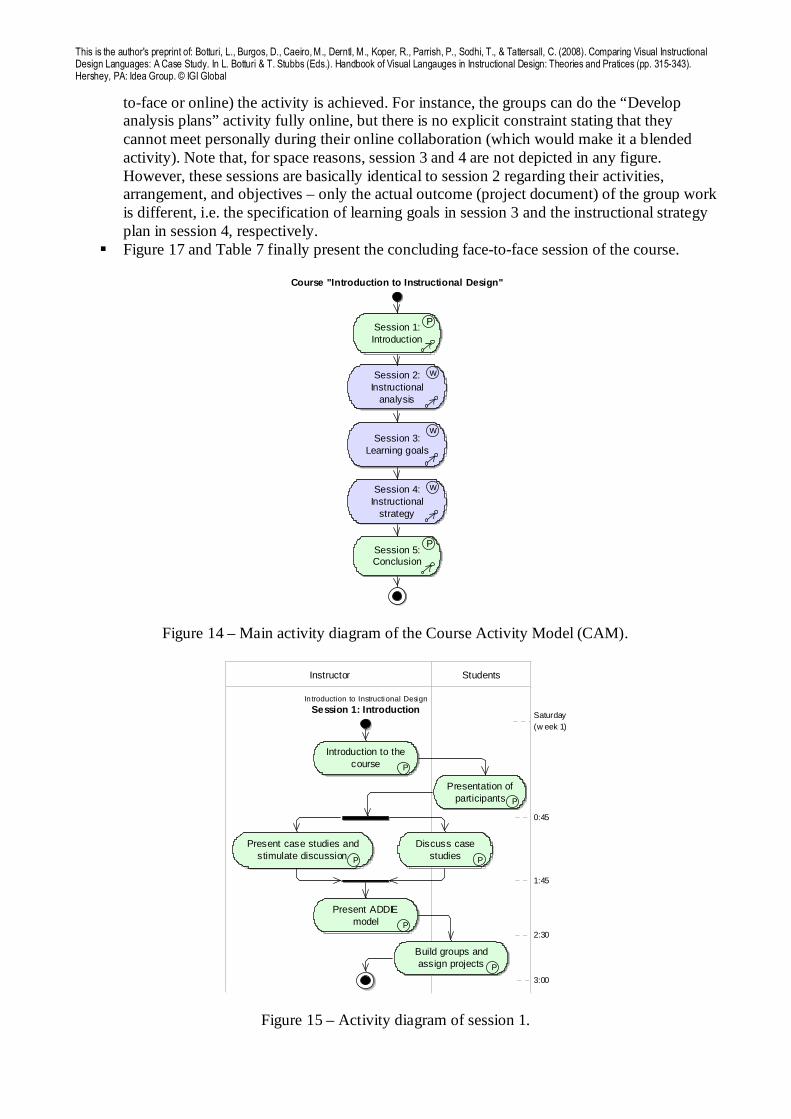
� Figure 14 presents the main activity diagram of the course, aligning the five course sessions in consecutive order.
� Figure 15 shows the first face-to-face session of the course. All activities are marked as presence activities (“P”). Table 5 complements the diagram with more detailed activity descriptions.
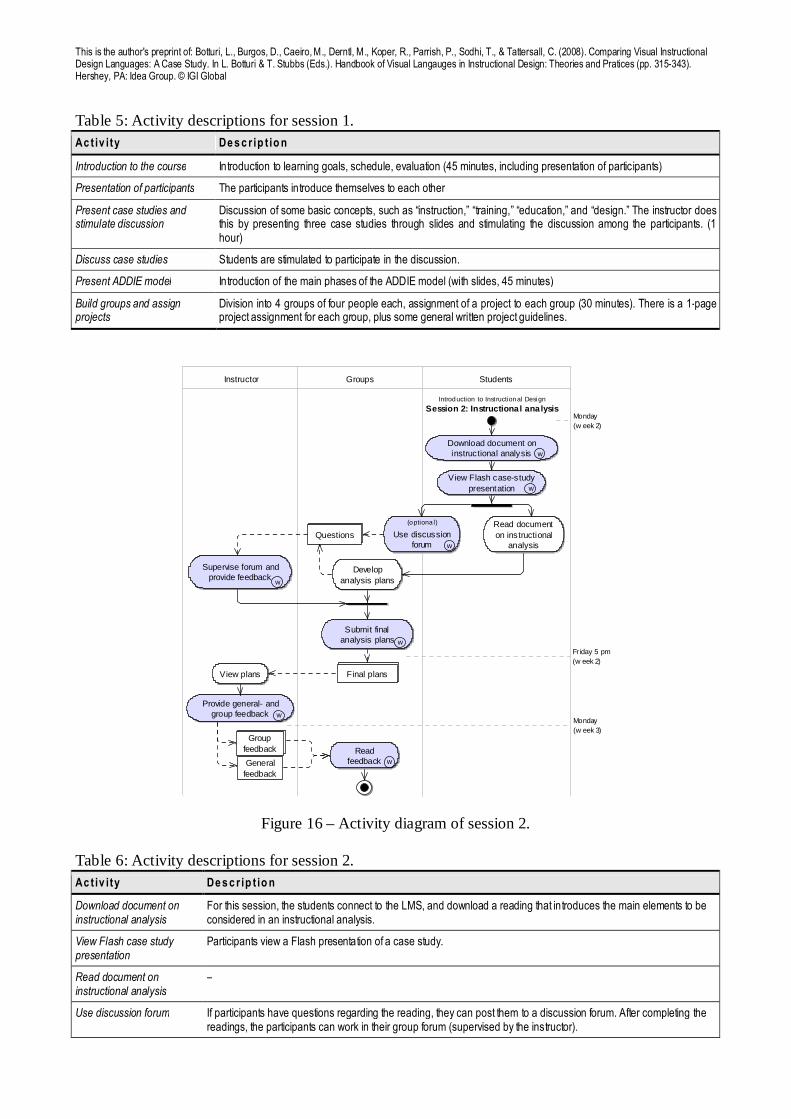
� Figure 16 and Table 6 present session 2, the first online session. Most activities are marked with a “W” standing for a web-based activity. Some activities do not carry any explicit mode of presence, which means that it is not completely determined by which means (face-
This is the author's preprint of: Botturi, L., Burgos, D., Caeiro, M., Derntl, M., Koper, R., Parrish, P., Sodhi, T., & Tattersall, C. (2008). Comparing Visual Instructional Design Languages: A Case Study. In L. Botturi & T. Stubbs (Eds.). Handbook of Visual Langauges in Instructional Design: Theories and Pratices (pp. 315-343). Hershey, PA: Idea Group. © IGI Global
to-face or online) the activity is achieved. For instance, the groups can do the “Develop analysis plans” activity fully online, but there is no explicit constraint stating that they cannot meet personally during their online collaboration (which would make it a blended activity). Note that, for space reasons, session 3 and 4 are not depicted in any figure. However, these sessions are basically identical to session 2 regarding their activities, arrangement, and objectives – only the actual outcome (project document) of the group work is different, i.e. the specification of learning goals in session 3 and the instructional strategy plan in session 4, respectively.
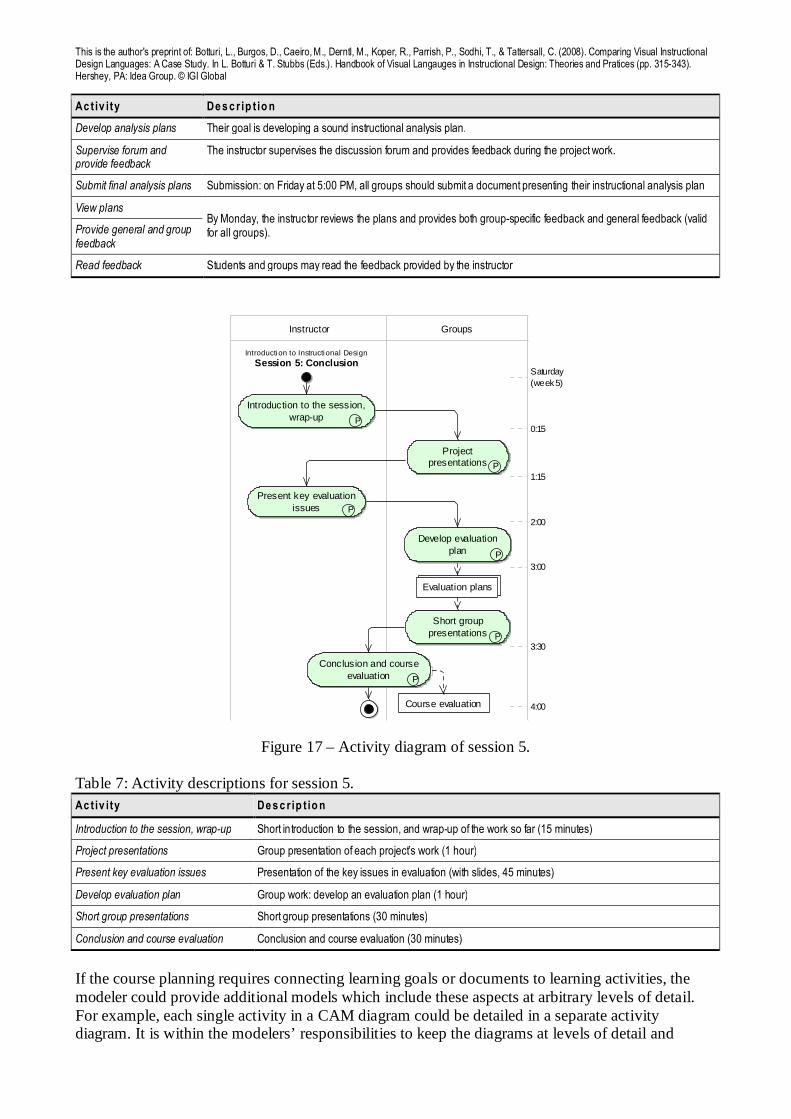
� Figure 17 and Table 7 finally present the concluding face-to-face session of the course.
Course "Introduction to Instructional Design"
Session 1:Introduction
P
Session 5:Conclusion
P
Session 2:Instructional
analysis
w
Session 3:Learning goals
w
Session 4:Instructional
strategy
w
Figure 14 – Main activity diagram of the Course Activity Model (CAM).
Instructor Students
In troduction to Instructional Design
Session 1: Introduction
Introduction to thecourse P
Present case studies andstimulate discussion P
Present ADDIEmodel P
Build groups andassign projects P
Discuss casestudies P
Presentation ofparticipants P
1:45
0:45
2:30
3:00
Saturday(w eek 1)
Figure 15 – Activity diagram of session 1.
This is the author's preprint of: Botturi, L., Burgos, D., Caeiro, M., Derntl, M., Koper, R., Parrish, P., Sodhi, T., & Tattersall, C. (2008). Comparing Visual Instructional Design Languages: A Case Study. In L. Botturi & T. Stubbs (Eds.). Handbook of Visual Langauges in Instructional Design: Theories and Pratices (pp. 315-343). Hershey, PA: Idea Group. © IGI Global
Table 5: Activity descriptions for session 1. Ac t iv i ty De s c r ip t io n
Introduction to the course Introduction to learning goals, schedule, evaluation (45 minutes, including presentation of participants)
Presentation of participants The participants introduce themselves to each other
Present case studies and stimulate discussion
Discussion of some basic concepts, such as “instruction,” “training,” “education,” and “design.” The instructor does this by presenting three case studies through slides and stimulating the discussion among the participants. (1 hour)
Discuss case studies Students are stimulated to participate in the discussion.
Present ADDIE model Introduction of the main phases of the ADDIE model (with slides, 45 minutes)
Build groups and assign projects
Division into 4 groups of four people each, assignment of a project to each group (30 minutes). There is a 1-page project assignment for each group, plus some general written project guidelines.
Instructor StudentsGroups
Introduction to Inst ructional Desi gn
Session 2: Instructiona l ana lysis
Download document oninstructional analysis w
Read documenton instructional
analysis
Developanalysis plans
Submit finalanalysis plans w
View plans
Provide general- andgroup feedback w
Readfeedback w
Supervise forum andprovide feedback
w
View Flash case-studypresentation w
Use discussionforum
(optiona l)
w
Final plans
Questions
Groupfeedback
Generalfeedback
Monday(w eek 2)
Fr iday 5 pm(w eek 2)
Monday(w eek 3)
Figure 16 – Activity diagram of session 2.
Table 6: Activity descriptions for session 2. Ac t iv i ty De s c r ip t io n
Download document on instructional analysis
For this session, the students connect to the LMS, and download a reading that introduces the main elements to be considered in an instructional analysis.
View Flash case study presentation
Participants view a Flash presentation of a case study.
Read document on instructional analysis
–
Use discussion forum If participants have questions regarding the reading, they can post them to a discussion forum. After completing the readings, the participants can work in their group forum (supervised by the instructor).
This is the author's preprint of: Botturi, L., Burgos, D., Caeiro, M., Derntl, M., Koper, R., Parrish, P., Sodhi, T., & Tattersall, C. (2008). Comparing Visual Instructional Design Languages: A Case Study. In L. Botturi & T. Stubbs (Eds.). Handbook of Visual Langauges in Instructional Design: Theories and Pratices (pp. 315-343). Hershey, PA: Idea Group. © IGI Global
Ac t iv i ty De s c r ip t io n
Develop analysis plans Their goal is developing a sound instructional analysis plan.
Supervise forum and provide feedback
The instructor supervises the discussion forum and provides feedback during the project work.
Submit final analysis plans Submission: on Friday at 5:00 PM, all groups should submit a document presenting their instructional analysis plan
View plans By Monday, the instructor reviews the plans and provides both group-specific feedback and general feedback (valid for all groups). Provide general and group
feedback
Read feedback Students and groups may read the feedback provided by the instructor
Instructor Groups
Introduction to Instructional Design
Session 5: Conclusion
Introduction to the session,wrap-up P
Present key evaluationissues P
Short grouppresentations P
Conclusion and courseevaluation P
Develop evaluationplan P
Projectpresentations P
Evaluation plans
Course evaluation
Saturday(week 5)
0:15
1:15
2:00
3:00
3:30
4:00
Figure 17 – Activity diagram of session 5.
Table 7: Activity descriptions for session 5. Ac t iv i ty De s c r ip t io n
Introduction to the session, wrap-up Short introduction to the session, and wrap-up of the work so far (15 minutes)
Project presentations Group presentation of each project’s work (1 hour)
Present key evaluation issues Presentation of the key issues in evaluation (with slides, 45 minutes)
Develop evaluation plan Group work: develop an evaluation plan (1 hour)
Short group presentations Short group presentations (30 minutes)
Conclusion and course evaluation Conclusion and course evaluation (30 minutes)
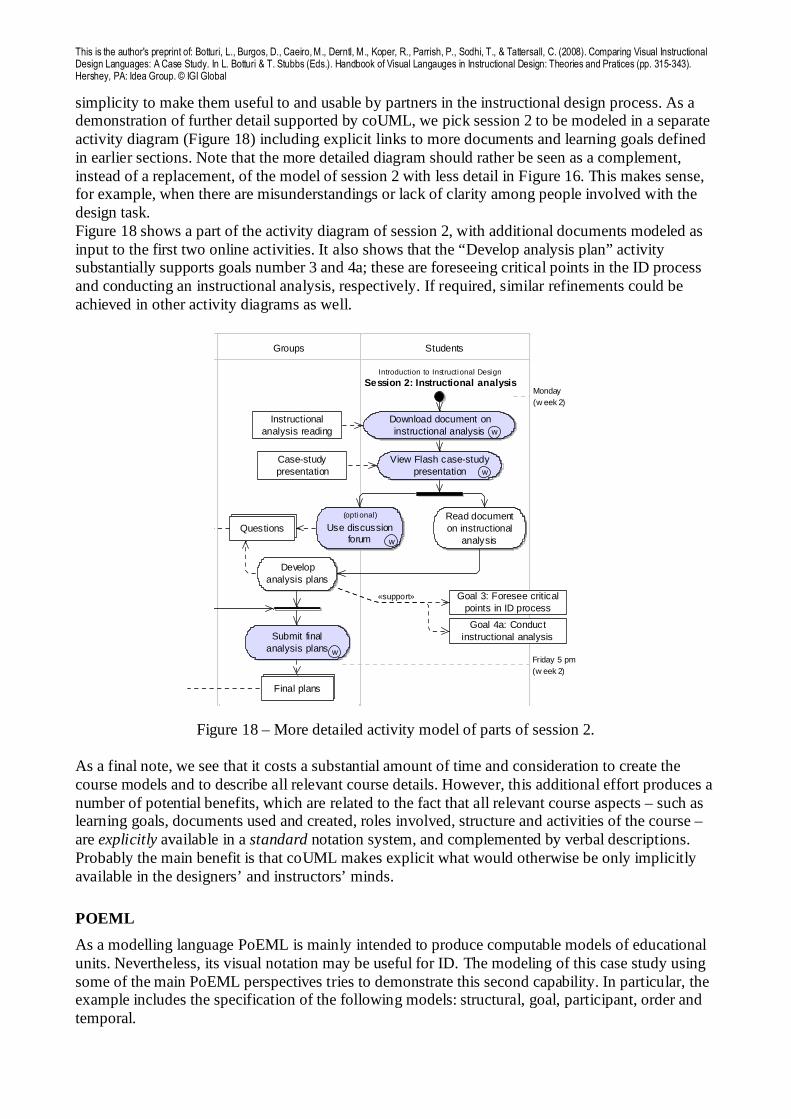
If the course planning requires connecting learning goals or documents to learning activities, the modeler could provide additional models which include these aspects at arbitrary levels of detail. For example, each single activity in a CAM diagram could be detailed in a separate activity diagram. It is within the modelers’ responsibilities to keep the diagrams at levels of detail and
This is the author's preprint of: Botturi, L., Burgos, D., Caeiro, M., Derntl, M., Koper, R., Parrish, P., Sodhi, T., & Tattersall, C. (2008). Comparing Visual Instructional Design Languages: A Case Study. In L. Botturi & T. Stubbs (Eds.). Handbook of Visual Langauges in Instructional Design: Theories and Pratices (pp. 315-343). Hershey, PA: Idea Group. © IGI Global
simplicity to make them useful to and usable by partners in the instructional design process. As a demonstration of further detail supported by coUML, we pick session 2 to be modeled in a separate activity diagram (Figure 18) including explicit links to more documents and learning goals defined in earlier sections. Note that the more detailed diagram should rather be seen as a complement, instead of a replacement, of the model of session 2 with less detail in Figure 16. This makes sense, for example, when there are misunderstandings or lack of clarity among people involved with the design task. Figure 18 shows a part of the activity diagram of session 2, with additional documents modeled as input to the first two online activities. It also shows that the “Develop analysis plan” activity substantially supports goals number 3 and 4a; these are foreseeing critical points in the ID process and conducting an instructional analysis, respectively. If required, similar refinements could be achieved in other activity diagrams as well.
StudentsGroups
Introduction to Instructional Design
Session 2: Instructional analysis
Download document oninstructional analysis w
Read documenton instructional
analysis
Developanalysis plans
Submit finalanalysis plans w
View Flash case-studypresentation w
Use discussionforum
(optional)
w
Final plans
Questions
Instructionalanalysis reading
Case-studypresentation
Goal 3: Foresee criticalpoints in ID process
Goal 4a: Conductinstructional analysis
Monday(w eek 2)
Friday 5 pm(w eek 2)
«support»
Figure 18 – More detailed activity model of parts of session 2.
As a final note, we see that it costs a substantial amount of time and consideration to create the course models and to describe all relevant course details. However, this additional effort produces a number of potential benefits, which are related to the fact that all relevant course aspects – such as learning goals, documents used and created, roles involved, structure and activities of the course – are explicitly available in a standard notation system, and complemented by verbal descriptions. Probably the main benefit is that coUML makes explicit what would otherwise be only implicitly available in the designers’ and instructors’ minds.
POEML
As a modelling language PoEML is mainly intended to produce computable models of educational units. Nevertheless, its visual notation may be useful for ID. The modeling of this case study using some of the main PoEML perspectives tries to demonstrate this second capability. In particular, the example includes the specification of the following models: structural, goal, participant, order and temporal.

This is the author's preprint of: Botturi, L., Burgos, D., Caeiro, M., Derntl, M., Koper, R., Parrish, P., Sodhi, T., & Tattersall, C. (2008). Comparing Visual Instructional Design Languages: A Case Study. In L. Botturi & T. Stubbs (Eds.). Handbook of Visual Langauges in Instructional Design: Theories and Pratices (pp. 315-343). Hershey, PA: Idea Group. © IGI Global
The Structural Model
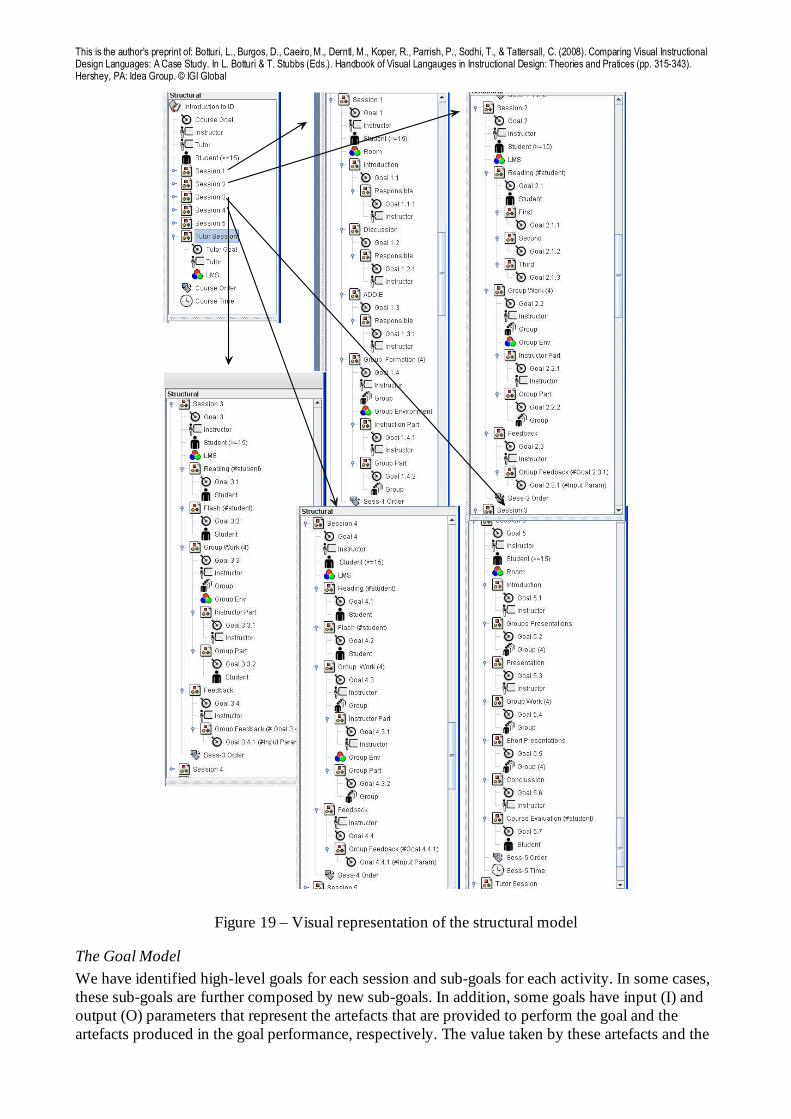
PoEML structural model is concerned with the organization of the elements involved in the educational unit model. This organization is based on the ES element. Each ES may be composed by a set of goals, roles, environments, order specifications, temporal specifications and other ESs. If an ES does not contain any role or environment it uses the roles and environments specified in its parent ES. Some elements may include an indicator of the number of instances to create during runtime. This feature is indicated through a number or expression included within parenthetical marks. Figure 19 shows the structural representation of this model in the tree-view form. The main ES includes one goal and three roles (it is required that the student role is performed by more than 14 persons). Then, it includes 6 ESs: one for each of the 5 sessions and an additional one for the Tutor activities. Regarding to the rest of the model it is worthy to notice that the number of instances of some elements depends on the number of instances of other elements. For example, the number of instances of the Reading ES in Session 2 has to be the same that the number of instances of Student role.
This is the author's preprint of: Botturi, L., Burgos, D., Caeiro, M., Derntl, M., Koper, R., Parrish, P., Sodhi, T., & Tattersall, C. (2008). Comparing Visual Instructional Design Languages: A Case Study. In L. Botturi & T. Stubbs (Eds.). Handbook of Visual Langauges in Instructional Design: Theories and Pratices (pp. 315-343). Hershey, PA: Idea Group. © IGI Global
Figure 19 – Visual representation of the structural model
The Goal Model
We have identified high-level goals for each session and sub-goals for each activity. In some cases, these sub-goals are further composed by new sub-goals. In addition, some goals have input (I) and output (O) parameters that represent the artefacts that are provided to perform the goal and the artefacts produced in the goal performance, respectively. The value taken by these artefacts and the
This is the author's preprint of: Botturi, L., Burgos, D., Caeiro, M., Derntl, M., Koper, R., Parrish, P., Sodhi, T., & Tattersall, C. (2008). Comparing Visual Instructional Design Languages: A Case Study. In L. Botturi & T. Stubbs (Eds.). Handbook of Visual Langauges in Instructional Design: Theories and Pratices (pp. 315-343). Hershey, PA: Idea Group. © IGI Global
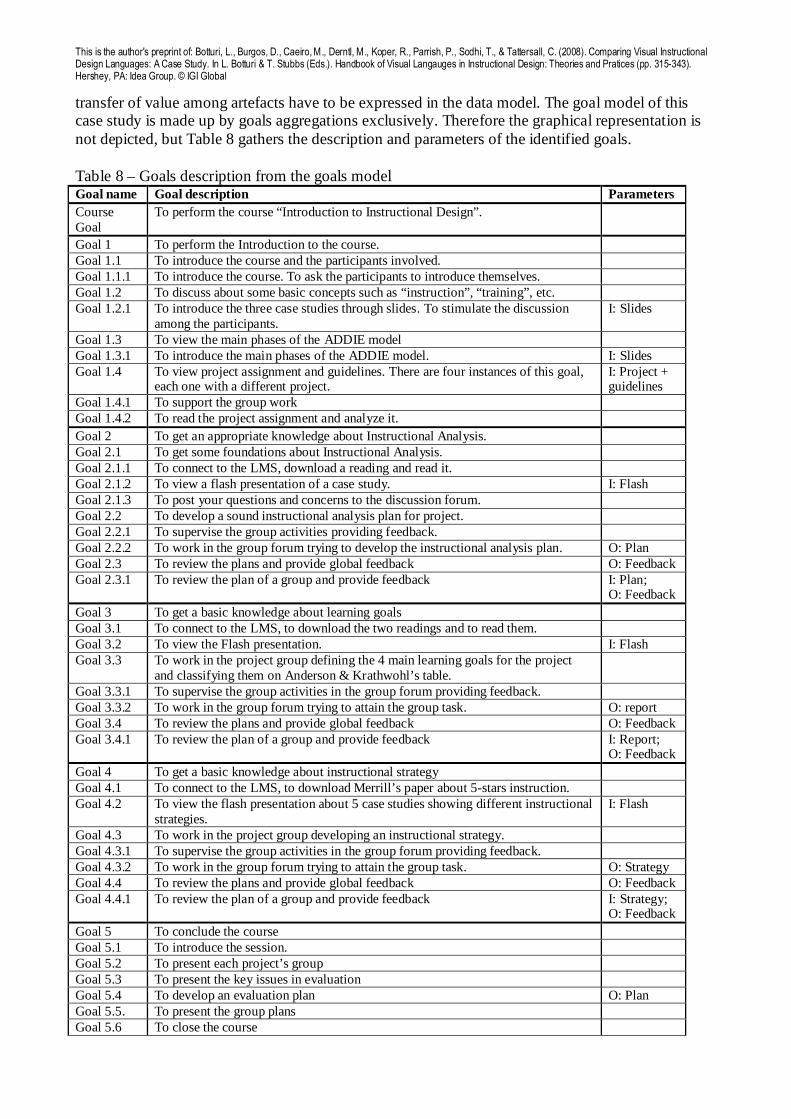
transfer of value among artefacts have to be expressed in the data model. The goal model of this case study is made up by goals aggregations exclusively. Therefore the graphical representation is not depicted, but Table 8 gathers the description and parameters of the identified goals. Table 8 – Goals description from the goals model Goal name Goal description Parameters Course Goal
To perform the course “Introduction to Instructional Design”.
Goal 1 To perform the Introduction to the course. Goal 1.1 To introduce the course and the participants involved. Goal 1.1.1 To introduce the course. To ask the participants to introduce themselves. Goal 1.2 To discuss about some basic concepts such as “instruction”, “training”, etc. Goal 1.2.1 To introduce the three case studies through slides. To stimulate the discussion
among the participants. I: Slides
Goal 1.3 To view the main phases of the ADDIE model Goal 1.3.1 To introduce the main phases of the ADDIE model. I: Slides Goal 1.4 To view project assignment and guidelines. There are four instances of this goal,
each one with a different project. I: Project + guidelines
Goal 1.4.1 To support the group work Goal 1.4.2 To read the project assignment and analyze it. Goal 2 To get an appropriate knowledge about Instructional Analysis. Goal 2.1 To get some foundations about Instructional Analysis. Goal 2.1.1 To connect to the LMS, download a reading and read it. Goal 2.1.2 To view a flash presentation of a case study. I: Flash Goal 2.1.3 To post your questions and concerns to the discussion forum. Goal 2.2 To develop a sound instructional analysis plan for project. Goal 2.2.1 To supervise the group activities providing feedback. Goal 2.2.2 To work in the group forum trying to develop the instructional analysis plan. O: Plan Goal 2.3 To review the plans and provide global feedback O: Feedback Goal 2.3.1 To review the plan of a group and provide feedback I: Plan;
O: Feedback Goal 3 To get a basic knowledge about learning goals Goal 3.1 To connect to the LMS, to download the two readings and to read them. Goal 3.2 To view the Flash presentation. I: Flash Goal 3.3 To work in the project group defining the 4 main learning goals for the project
and classifying them on Anderson & Krathwohl’s table.
Goal 3.3.1 To supervise the group activities in the group forum providing feedback. Goal 3.3.2 To work in the group forum trying to attain the group task. O: report Goal 3.4 To review the plans and provide global feedback O: Feedback Goal 3.4.1 To review the plan of a group and provide feedback I: Report;
O: Feedback Goal 4 To get a basic knowledge about instructional strategy Goal 4.1 To connect to the LMS, to download Merrill’s paper about 5-stars instruction. Goal 4.2 To view the flash presentation about 5 case studies showing different instructional
strategies. I: Flash
Goal 4.3 To work in the project group developing an instructional strategy. Goal 4.3.1 To supervise the group activities in the group forum providing feedback. Goal 4.3.2 To work in the group forum trying to attain the group task. O: Strategy Goal 4.4 To review the plans and provide global feedback O: Feedback Goal 4.4.1 To review the plan of a group and provide feedback I: Strategy;
O: Feedback Goal 5 To conclude the course Goal 5.1 To introduce the session. Goal 5.2 To present each project’s group Goal 5.3 To present the key issues in evaluation Goal 5.4 To develop an evaluation plan O: Plan Goal 5.5. To present the group plans Goal 5.6 To close the course
This is the author's preprint of: Botturi, L., Burgos, D., Caeiro, M., Derntl, M., Koper, R., Parrish, P., Sodhi, T., & Tattersall, C. (2008). Comparing Visual Instructional Design Languages: A Case Study. In L. Botturi & T. Stubbs (Eds.). Handbook of Visual Langauges in Instructional Design: Theories and Pratices (pp. 315-343). Hershey, PA: Idea Group. © IGI Global
Goal 5.7 To fill in the course evaluation I: Evaluation O: Data
Tutor Goal To upload materials on-line and to monitor discussions
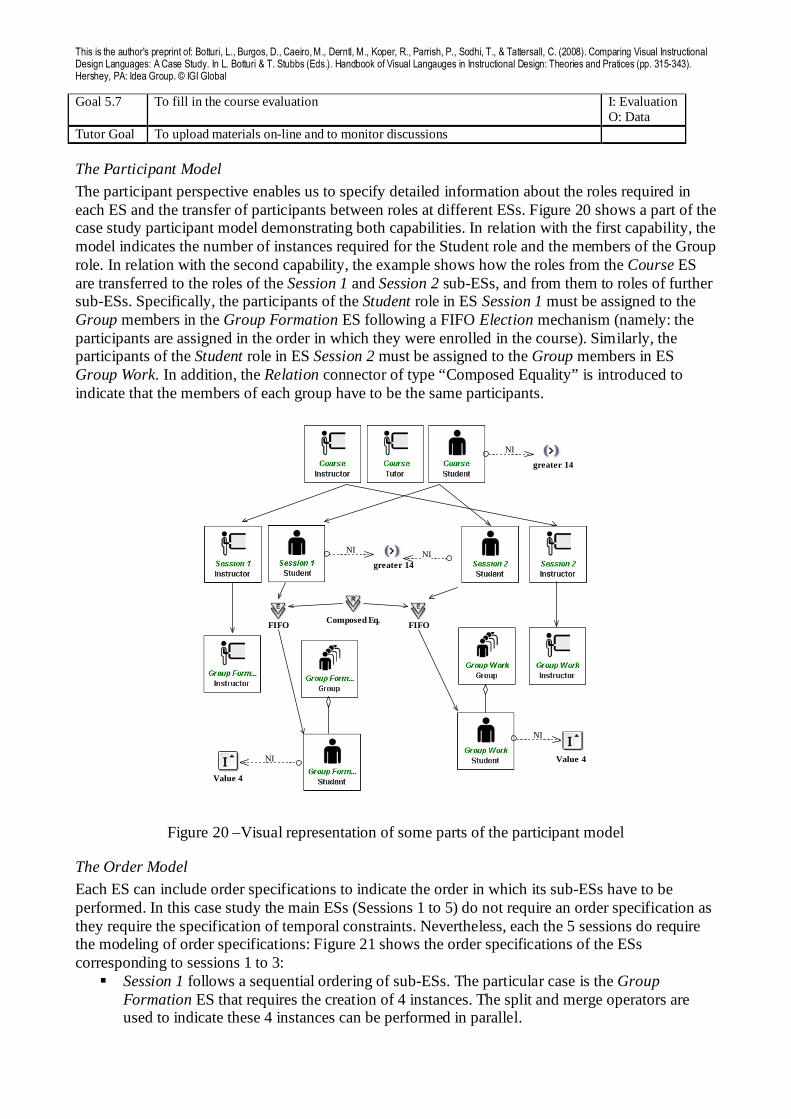
The Participant Model
The participant perspective enables us to specify detailed information about the roles required in each ES and the transfer of participants between roles at different ESs. Figure 20 shows a part of the case study participant model demonstrating both capabilities. In relation with the first capability, the model indicates the number of instances required for the Student role and the members of the Group role. In relation with the second capability, the example shows how the roles from the Course ES are transferred to the roles of the Session 1 and Session 2 sub-ESs, and from them to roles of further sub-ESs. Specifically, the participants of the Student role in ES Session 1 must be assigned to the Group members in the Group Formation ES following a FIFO Election mechanism (namely: the participants are assigned in the order in which they were enrolled in the course). Similarly, the participants of the Student role in ES Session 2 must be assigned to the Group members in ES Group Work. In addition, the Relation connector of type “Composed Equality” is introduced to indicate that the members of each group have to be the same participants.
NI
greater 14
NI
Value 4
NI
greater 14
FIFO
NI
FIFO
NI
Value 4
Composed Eq.
Figure 20 –Visual representation of some parts of the participant model
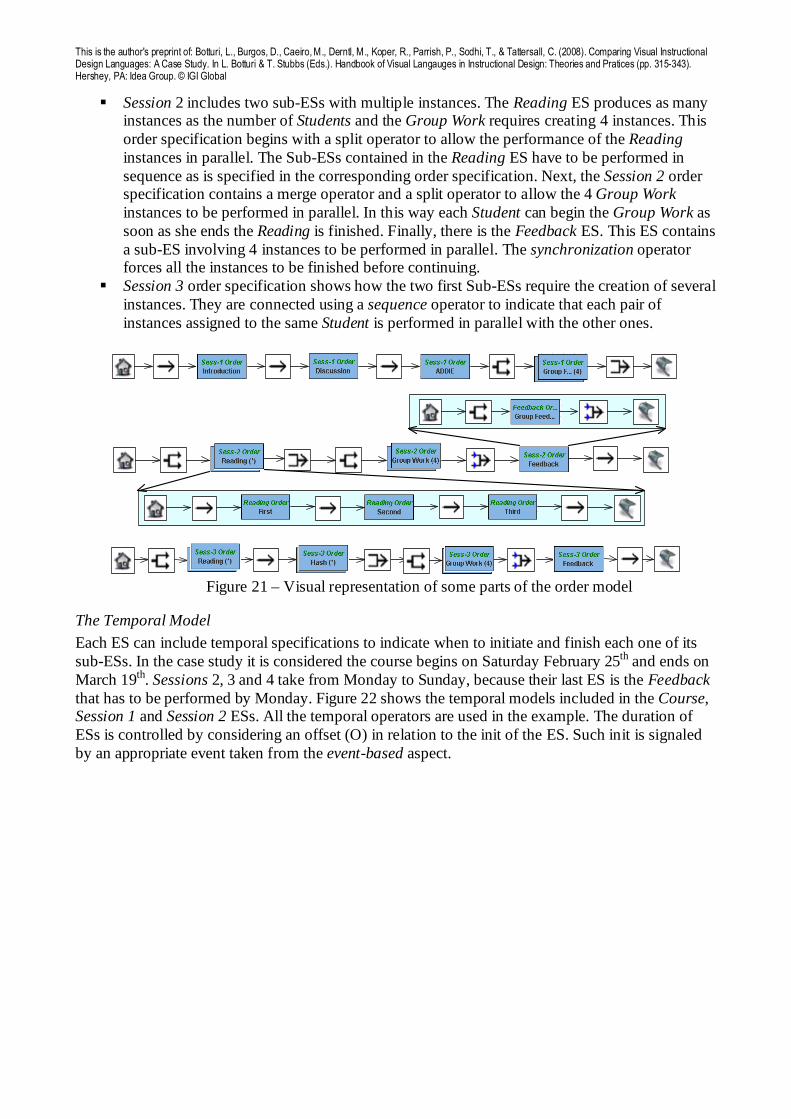
The Order Model
Each ES can include order specifications to indicate the order in which its sub-ESs have to be performed. In this case study the main ESs (Sessions 1 to 5) do not require an order specification as they require the specification of temporal constraints. Nevertheless, each the 5 sessions do require the modeling of order specifications: Figure 21 shows the order specifications of the ESs corresponding to sessions 1 to 3:
� Session 1 follows a sequential ordering of sub-ESs. The particular case is the Group Formation ES that requires the creation of 4 instances. The split and merge operators are used to indicate these 4 instances can be performed in parallel.
This is the author's preprint of: Botturi, L., Burgos, D., Caeiro, M., Derntl, M., Koper, R., Parrish, P., Sodhi, T., & Tattersall, C. (2008). Comparing Visual Instructional Design Languages: A Case Study. In L. Botturi & T. Stubbs (Eds.). Handbook of Visual Langauges in Instructional Design: Theories and Pratices (pp. 315-343). Hershey, PA: Idea Group. © IGI Global
� Session 2 includes two sub-ESs with multiple instances. The Reading ES produces as many instances as the number of Students and the Group Work requires creating 4 instances. This order specification begins with a split operator to allow the performance of the Reading instances in parallel. The Sub-ESs contained in the Reading ES have to be performed in sequence as is specified in the corresponding order specification. Next, the Session 2 order specification contains a merge operator and a split operator to allow the 4 Group Work instances to be performed in parallel. In this way each Student can begin the Group Work as soon as she ends the Reading is finished. Finally, there is the Feedback ES. This ES contains a sub-ES involving 4 instances to be performed in parallel. The synchronization operator forces all the instances to be finished before continuing.
� Session 3 order specification shows how the two first Sub-ESs require the creation of several instances. They are connected using a sequence operator to indicate that each pair of instances assigned to the same Student is performed in parallel with the other ones.
Figure 21 – Visual representation of some parts of the order model
The Temporal Model
Each ES can include temporal specifications to indicate when to initiate and finish each one of its sub-ESs. In the case study it is considered the course begins on Saturday February 25th and ends on March 19th. Sessions 2, 3 and 4 take from Monday to Sunday, because their last ES is the Feedback that has to be performed by Monday. Figure 22 shows the temporal models included in the Course, Session 1 and Session 2 ESs. All the temporal operators are used in the example. The duration of ESs is controlled by considering an offset (O) in relation to the init of the ES. Such init is signaled by an appropriate event taken from the event-based aspect.

This is the author's preprint of: Botturi, L., Burgos, D., Caeiro, M., Derntl, M., Koper, R., Parrish, P., Sodhi, T., & Tattersall, C. (2008). Comparing Visual Instructional Design Languages: A Case Study. In L. Botturi & T. Stubbs (Eds.). Handbook of Visual Langauges in Instructional Design: Theories and Pratices (pp. 315-343). Hershey, PA: Idea Group. © IGI Global
R R
Feb, 25th 15:00
O
3:00
R
Init S1
R
Feb, 27th
R
Mar, 5th
R
Mar, 5th
R
Mar, 12th
R
Mar, 12th
R
Mar, 19th
R R
Mar, 19th 15:00
O
4:00
R
Init S5
Mar, 2th
17:00
R
R
0:45O
R
Init Intro
1:00O
R
Init Disc
0:45O
R
Init ADDIE
0:30O
R
Init Group
R
Mar, 5h
Figure 23 – Visual representation of some parts of the temporal model
IMS Learning Design
IMS Learning Design is designed to model learning flows. Although it is mainly focused on online learning, blended and face to face learning can also be modelled. In the proposed case study “Introduction to Instructional Design” there are two face to face parts (1 and 5) and three online parts (2, 3 and 4). Sessions 1 and 5 need to be modelled in the general learning flow. We suggest to incorporate a summary and a briefing of every face to face session to the general flow, in order to keep a centralized backup of every activity. If these connection is not done they essence of Blended-Learning will be gone and we will have two isolated types of learning, instead of the so looked blended approach, with an actual learning flow between both. Then, we have two types of activities.
Modeling
Furtherone we describe the authoring process with a stress on the key modeling issues. Due to the length paper constraints, and since this book is focused on visual editing tools, and not in players, we only provide some specific basic coding and a few related screenshots on this authoring process. We have used Reload LD Editor and XML Spy for the development of IMS LD Levels A and B. First, we define every single Learning- Activity, Support-Activity and Activity-Structure
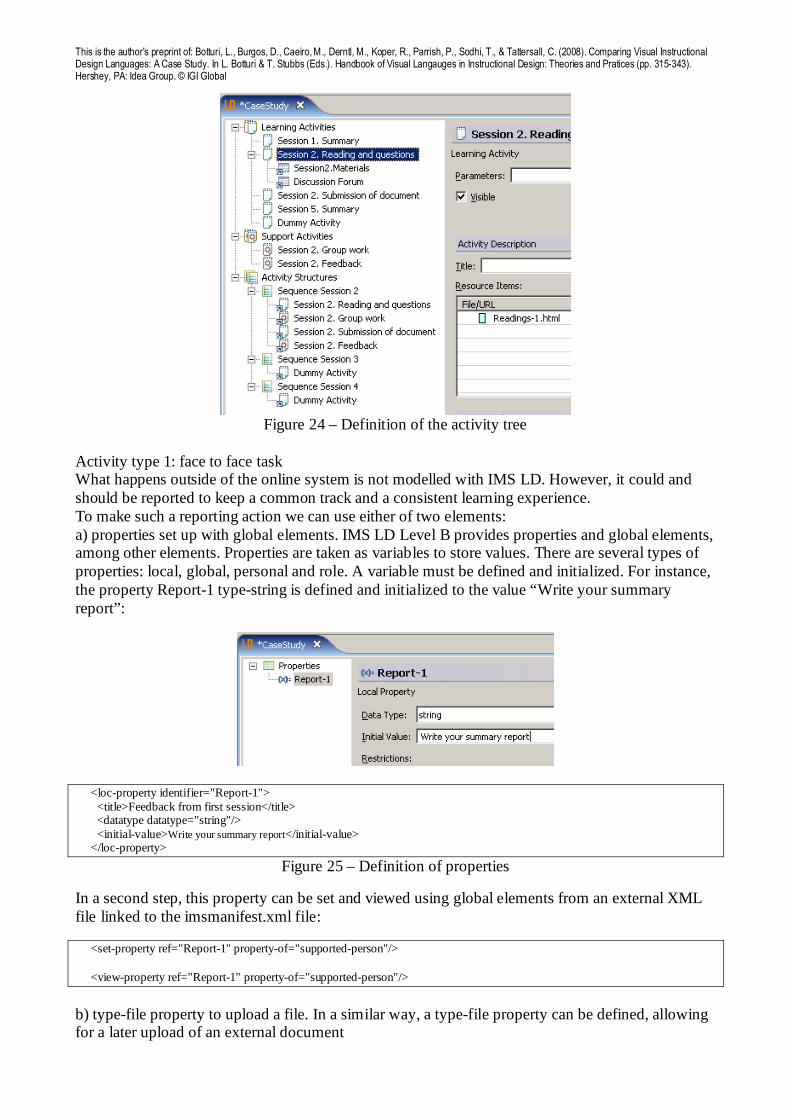
This is the author's preprint of: Botturi, L., Burgos, D., Caeiro, M., Derntl, M., Koper, R., Parrish, P., Sodhi, T., & Tattersall, C. (2008). Comparing Visual Instructional Design Languages: A Case Study. In L. Botturi & T. Stubbs (Eds.). Handbook of Visual Langauges in Instructional Design: Theories and Pratices (pp. 315-343). Hershey, PA: Idea Group. © IGI Global
Figure 24 – Definition of the activity tree
Activity type 1: face to face task What happens outside of the online system is not modelled with IMS LD. However, it could and should be reported to keep a common track and a consistent learning experience. To make such a reporting action we can use either of two elements: a) properties set up with global elements. IMS LD Level B provides properties and global elements, among other elements. Properties are taken as variables to store values. There are several types of properties: local, global, personal and role. A variable must be defined and initialized. For instance, the property Report-1 type-string is defined and initialized to the value “Write your summary report”:
<loc-property identifier="Report-1"> <title>Feedback from first session</title> <datatype datatype="string"/> <initial-value>Write your summary report</initial-value> </loc-property>
Figure 25 – Definition of properties
In a second step, this property can be set and viewed using global elements from an external XML file linked to the imsmanifest.xml file:
<set-property ref="Report-1" property-of="supported-person"/> <view-property ref="Report-1" property-of="supported-person"/>
b) type-file property to upload a file. In a similar way, a type-file property can be defined, allowing for a later upload of an external document

This is the author's preprint of: Botturi, L., Burgos, D., Caeiro, M., Derntl, M., Koper, R., Parrish, P., Sodhi, T., & Tattersall, C. (2008). Comparing Visual Instructional Design Languages: A Case Study. In L. Botturi & T. Stubbs (Eds.). Handbook of Visual Langauges in Instructional Design: Theories and Pratices (pp. 315-343). Hershey, PA: Idea Group. © IGI Global
<global-property identifier="Report-1"> <title>Feedback from first session</title> <datatype datatype="file"/> </global-property>
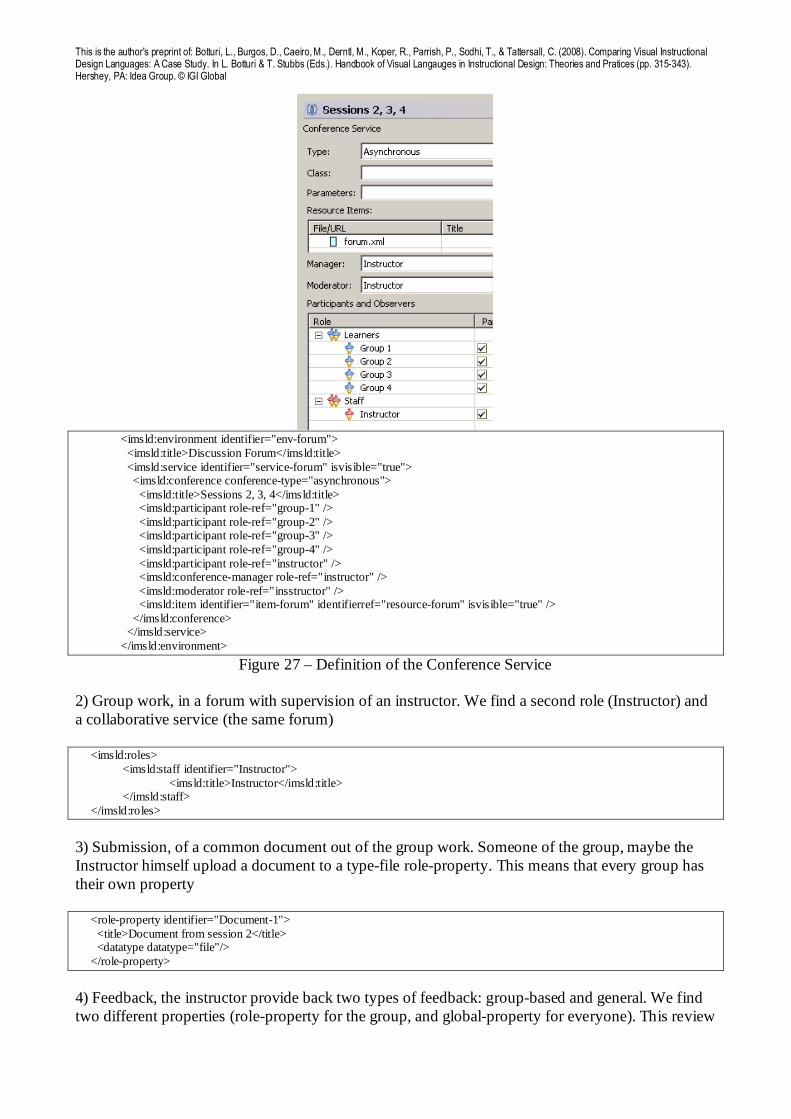
Activity type 2: collaborative online work Sessions 2, 3 and 4 follow the same pattern: 1) Reading, with two actions: reading a paper and feeding a discussion forum. There is a role per group of four participants and a service (conference). As there are four groups, there are four roles, so far. The forum has to be connected from the Environment in a Support-Activity or it can directly linked from the Activity-Description of a Support-Activity (see point 4 further on). Readings can be stored in an environment:
<imsld:roles> <imsld:learner identifier="group-1" min-persons="4" max-persons="4" > <imsld:title>Group 1</imsld:title> </imsld:learner> <imsld:learner identifier="group-2" min-persons="4" max-persons="4" > <imsld:title>Group 2</imsld:title> </imsld:learner> <imsld:learner identifier="group-3" min-persons="4" max-persons="4" > <imsld:title>Group 3</imsld:title> </imsld:learner> <imsld:learner identifier="group-4" min-persons="4" max-persons="4" > <imsld:title>Group 4</imsld:title> </imsld:learner> </imsld:roles>
Figure 26 – Definition of roles
This is the author's preprint of: Botturi, L., Burgos, D., Caeiro, M., Derntl, M., Koper, R., Parrish, P., Sodhi, T., & Tattersall, C. (2008). Comparing Visual Instructional Design Languages: A Case Study. In L. Botturi & T. Stubbs (Eds.). Handbook of Visual Langauges in Instructional Design: Theories and Pratices (pp. 315-343). Hershey, PA: Idea Group. © IGI Global
<imsld:environment identifier="env-forum"> <imsld:title>Discussion Forum</imsld:title> <imsld:service identifier="service-forum" isvisible="true"> <imsld:conference conference-type="asynchronous"> <imsld:title>Sessions 2, 3, 4</imsld:title> <imsld:participant role-ref="group-1" /> <imsld:participant role-ref="group-2" /> <imsld:participant role-ref="group-3" /> <imsld:participant role-ref="group-4" /> <imsld:participant role-ref="instructor" /> <imsld:conference-manager role-ref="instructor" /> <imsld:moderator role-ref="insstructor" /> <imsld:item identifier="item-forum" identifierref="resource-forum" isvisible="true" /> </imsld:conference> </imsld:service> </imsld:environment>
Figure 27 – Definition of the Conference Service 2) Group work, in a forum with supervision of an instructor. We find a second role (Instructor) and a collaborative service (the same forum)
<imsld:roles> <imsld:staff identifier="Instructor"> <imsld:title>Instructor</imsld:title> </imsld:staff> </imsld:roles>
3) Submission, of a common document out of the group work. Someone of the group, maybe the Instructor himself upload a document to a type-file role-property. This means that every group has their own property
<role-property identifier="Document-1"> <title>Document from session 2</title> <datatype datatype="file"/> </role-property>
4) Feedback, the instructor provide back two types of feedback: group-based and general. We find two different properties (role-property for the group, and global-property for everyone). This review

This is the author's preprint of: Botturi, L., Burgos, D., Caeiro, M., Derntl, M., Koper, R., Parrish, P., Sodhi, T., & Tattersall, C. (2008). Comparing Visual Instructional Design Languages: A Case Study. In L. Botturi & T. Stubbs (Eds.). Handbook of Visual Langauges in Instructional Design: Theories and Pratices (pp. 315-343). Hershey, PA: Idea Group. © IGI Global
can be done using a monitoring service in an Environment (like in the forum afore described) and-or the use of global elements in a Support-Activity:
<imsld:support-activity identifier="sa-review" isvisible="true"> <imsld:title>Monitoring the progress</imsld:title> <imsld:role-ref ref="Learner" /> <imsld:activity-description> <imsld:title>Review</imsld:title> <imsld:item identifier="item-review" identifierref="resource-review" isvisible="true" /> </imsld:activity-description> <imsld:complete-activity> <imsld:user-choice /> </imsld:complete-activity> </imsld:support-activity>
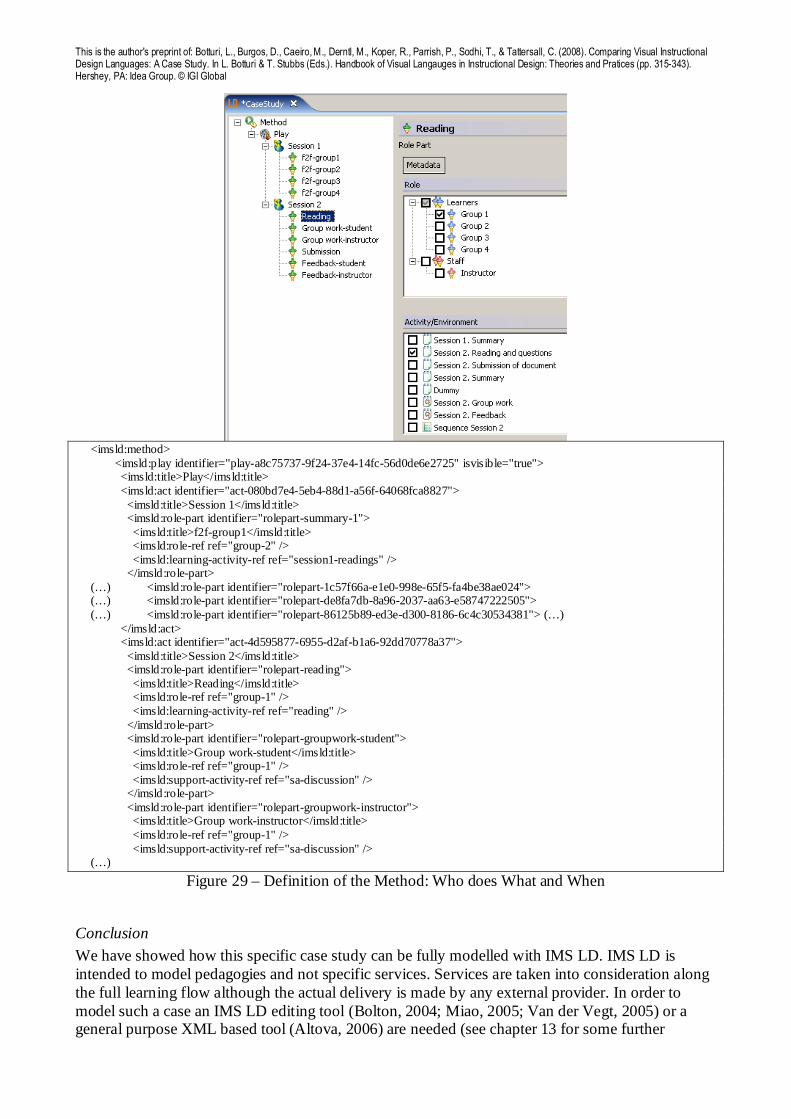
Figure 28 – Integration of the Monitoring Service in the Support-Activity Learning flow: integration of activities As it is stated currently, the learning flow is sequence-based and the integration of every activity doesn t́ need more than a Level A use of the IMS LD structures. In concrete, a nested set of Acts, Activity-Structures, Learning-Activities and Support-Activities is enough to model the course: every session is an Act, every task is a Learning-Activity or a Support-Activity, bundled around an Activity-Structure (see Figure 0). However, we should pay attention to the relation between role-parts inside the same act, since the several activities are in parallel but not every role has always something to do. Furthermore, they have to be run in turn. This definition of the Method specifies Who does What and When:
This is the author's preprint of: Botturi, L., Burgos, D., Caeiro, M., Derntl, M., Koper, R., Parrish, P., Sodhi, T., & Tattersall, C. (2008). Comparing Visual Instructional Design Languages: A Case Study. In L. Botturi & T. Stubbs (Eds.). Handbook of Visual Langauges in Instructional Design: Theories and Pratices (pp. 315-343). Hershey, PA: Idea Group. © IGI Global
<imsld:method> <imsld:play identifier="play-a8c75737-9f24-37e4-14fc-56d0de6e2725" isvisible="true"> <imsld:title>Play</imsld:title> <imsld:act identifier="act-080bd7e4-5eb4-88d1-a56f-64068fca8827"> <imsld:title>Session 1</imsld:title> <imsld:role-part identifier="rolepart-summary-1"> <imsld:title>f2f-group1</imsld:title> <imsld:role-ref ref="group-2" /> <imsld:learning-activity-ref ref="session1-readings" /> </imsld:role-part> (…) <imsld:role-part identifier="rolepart-1c57f66a-e1e0-998e-65f5-fa4be38ae024"> (…) <imsld:role-part identifier="rolepart-de8fa7db-8a96-2037-aa63-e58747222505"> (…) <imsld:role-part identifier="rolepart-86125b89-ed3e-d300-8186-6c4c30534381"> (…) </imsld:act> <imsld:act identifier="act-4d595877-6955-d2af-b1a6-92dd70778a37"> <imsld:title>Session 2</imsld:title> <imsld:role-part identifier="rolepart-reading"> <imsld:title>Reading</imsld:title> <imsld:role-ref ref="group-1" /> <imsld:learning-activity-ref ref="reading" /> </imsld:role-part> <imsld:role-part identifier="rolepart-groupwork-student"> <imsld:title>Group work-student</imsld:title> <imsld:role-ref ref="group-1" /> <imsld:support-activity-ref ref="sa-discussion" /> </imsld:role-part> <imsld:role-part identifier="rolepart-groupwork-instructor"> <imsld:title>Group work-instructor</imsld:title> <imsld:role-ref ref="group-1" /> <imsld:support-activity-ref ref="sa-discussion" /> (…)
Figure 29 – Definition of the Method: Who does What and When
Conclusion
We have showed how this specific case study can be fully modelled with IMS LD. IMS LD is intended to model pedagogies and not specific services. Services are taken into consideration along the full learning flow although the actual delivery is made by any external provider. In order to model such a case an IMS LD editing tool (Bolton, 2004; Miao, 2005; Van der Vegt, 2005) or a general purpose XML based tool (Altova, 2006) are needed (see chapter 13 for some further

This is the author's preprint of: Botturi, L., Burgos, D., Caeiro, M., Derntl, M., Koper, R., Parrish, P., Sodhi, T., & Tattersall, C. (2008). Comparing Visual Instructional Design Languages: A Case Study. In L. Botturi & T. Stubbs (Eds.). Handbook of Visual Langauges in Instructional Design: Theories and Pratices (pp. 315-343). Hershey, PA: Idea Group. © IGI Global
analysis). In addition, an engine and a player capable to run the Unit of Learning are also needed, like CopperCore (Vogten & Martens, 2005), .LRN or Sled (OUUK, 2005). But tools need still a low level knowledge of the specification to come across with this type of results, involving Level B elements. Therefore, the modeling is technically possible but still too difficult for a non-technical user. Editing facilities need to be more accesible to non-technical users in order to develop, implement and reach an easier and further use of this type of case studies in reality. A higher level visual metaphor would help. In this direction, some LD visual editors are currently under development (TENCompetence, 2005; UCM, 2006) but with no actual outcome to be used yet. References Altova. (2006). XML Spy Editor. Retrieved Dec 18th, 2006, from http://www.altova.com Bolton. (2004). Reload Project. Retrieved April 16th, 2006, from www.reload.ac.uk Miao, Y. (2005). Cosmos LD Editor. OUUK. (2005). Sled player. Retrieved April 13th, 2006, from http://sled.open.ac.uk TENCompetence. (2005). TENCompetence Project. Retrieved July 31st, 2006, from
www.tencompetence.org UCM. (2006). Complutense University. <e-Ucm> Research Group. Retrieved December 18th,
2006, from www.e-ucm.es Van der Vegt, W. (2005). CopperAuthor. Retrieved April 13th 2006, from www.copperauthor.org Vogten, H., & Martens, H. (2005). CopperCore 3.0. Retrieved April 13th 2006, from
www.coppercore.org