Embed Size (px)
Citation preview

State funds for this project were matched with Federal funds under the Federal-State Marketing Improvement Program of the
Agricultural Marketing Service, U.S. Department of Agriculture
Comparing the Effect of Country of Origin versus State-Specific
Label on Fresh Tomato Marketing
Yuan Jiang, Graduate Student, Department of Food and Resource Economics,
University of Florida, E-mail: [email protected]
Lisa House, Professor, Department of Food and Resource Economics, University of
Florida, E-mail: [email protected]
Hyeyoung Kim , Assistant Professor, Department of Food and Resource Economics,
University of Florida ,E-mail: [email protected]
Selected Poster prepared for presentation at the Southern Agricultural Economics
Association’s 2016 Annual Meeting, San Antonio, Texas, Feb 7-February 10, 2016
Copyright 2016 by [Jiang, House and Kim]. All rights reserved. Readers may make verbatim copies of
this document for non-commercial purposes by any means, provided that this copyright notice appears
on all such copies.

Abstract:
This study investigates the acceptable price range for Florida fresh tomatoes and
U.S fresh tomatoes using the van Westendrop pricing approach. A significant price
difference was detected between the two types of fresh tomatoes, with Florida’s
higher. Consumers’ knowledge of where was fresh tomatoes produced, and their
perceptions of tomatoes from different locations will significantly influence the
optimal price.
Key Word: Fresh tomatoes, van Westendrop pricing method, COOL

Introduction
Tomatoes is one of the world’s most popular fruit vegetables, and they are good
sources of many important nutrition elements, like vitamins A and C, fiber, and
lycopene. According to the data provided by USDA in 2004, a tomato in average-size
could provide 40% of the U.S recommended Daily Allowance of vitamin C and 20%
of Vitamin A. The lycopene of tomatoes is a carotenoid pigment, which makes the
tomatoes red, and people could only absorb the lycopene through consumption.
Researches in the field of epidemiology indicated that the consumption of lycopene
was negatively related to the development of certain types of cancer. (Agarwal and
Rao, 2000).
Unites States is one of the leading producer of tomatoes in the world, preceding
only by China. In the year of 2012, the United States produced 27.6 million hundred
weight (cwt) fresh tomatoes, valued at $0.86 billion (USDA/NASS, 2013). Florida is
the leading fresh tomato producer (Lucier, 2003; Cao, 2011), account nearly half of
total crop value. What is more, Florida produce almost all the tomatoes to the U.S
domestic market from November to May (USDA 2004).
As Florida is the largest supplier of fresh tomatoes to the U.S domestic market,
it was expected that consumers might be more willing to buy fresh tomatoes produced
in Florida other than U.S tomatoes, and the willing to pay for Florida tomatoes would
be higher. However, a previous research conducted by Cao, and House in 2012, did
not get this result, yet they found that the Florida sticker and “Grown in Florida” sign
does not significantly increase the premium that consumers would to pay for Florida
tomatoes compared the U.S tomatoes.
In this research, a follow-up online survey was conducted to determine
awareness of production location for tomatoes, and consumers’ knowledge and
perception for the tomatoes produced in the state, with the hypothesis that if
consumers are aware that tomatoes are produced in a State, they may be more willing
to pay for them. We also analyzed the effectiveness of the country of origin labeling

versus the state-specific labels on consumers’ optimal price for tomatoes from
different locations.
Previous Studies
In the United States, according to the Farm Security and Rural Investment Act
2002, it is required that retailers, such as grocery stores, supermarkets and club
warehouse stores, to notify consumers of the country of origin for beef, lamb, pork,
fish, poultry, goat, perishable agricultural commodities, macadamia nuts, pecans,
peanuts, and ginseng. In 2005, the country of origin labelling requirement was
implemented for seafood.
In the past few decades, there has been numerous researches investigating the
effects of country-of-origin labelling (COOL) on consumers behaviors towards
agricultural products, and most of these researches has come to the agreement that the
implementation of COOL will influence consumers’ attitudes and preference towards
the food originating from their own country, and increase consumers’ likelihood to
purchase the products from their own country. For example, in 2001, Schupp and
Gillespie employed the mail survey in Louisiana to analyze the effects of country of
origin labeling for beef, and they found that the imposition of the COOL on fresh beef
would likely to increase the demand for domestic beef relative to imported beef.
Alfnes and Rickertsen (2003) used surveys and experimental auctions to examine
Norwegian consumers’ preference for beef from different countries, and the results
indicated that Norwegian consumers preferred beef produced domestically.
When analyzing the effect of COOL information on food market, a highly
researched dependent measurement is consumers’ willingness to pay (WTP). Most of
the previous researches demonstrated that consumers would offer a higher price for
domestic foods than imported food. For example, Mabiso et al. (2005) investigated
that American consumers would pay a premium for fresh apples and tomatoes labeled
“Grown in the U.S”. Loureiro and Umberger (2002) demonstrated that consumers in
Colorado State would like to pay a premium for “U.S Certified” labels in beef.
Similar results were drawn by Lim et al, in 2011, they evaluated the extent that U.S
consumers are receptive to imported steak from various countries, and they found that
U.S consumers were willing to pay significantly less for imported steaks. Xie et al.
(2013) found that U.S consumers’ willingness to pay for domestic organic broccoli is
higher than imported organic broccoli.
At the same time, a large body of research has studies the reasons why country
of origins labelling would impact on consumers’ behaviors. Many researches
indicated that the country of origin labeling is an important tool to signal or suggest a
specific degree of safety or quality. Verlegh and Steenkamp (1999) fount that COOL
has a larger effect on perceived quality than on attitude towards the purchase
intention. Lusk et al (2006) also found that COOL could be a cognitive cue for
consumers. In addition, COOL also has emotional impact on consumers. COOL
would influence consumer’s behavior through consumers’ animosities, patriotism
ethnocentrism, and trust in the certification processes and agencies in the country of
origin. Lusk et al. (2007) indicated that consumer’s ethnocentrism and patriotism is a
main reason why consumers would likely prefer the country of origin labelling on the
product. Verlegh and Steenkamp (1999) summarized that there were three main
effects of COOL: cognitive effect, affective effect and normative effect. The cognitive
effect is that consumers would use the COOL as a signal for the product overall
quality. The affective effect is that the COOL would have an emotional value to
consumers such as enhancing social status. The normative effect is referred to the
consumers’ social and personal norms relating to COOL. For example, consumers
might be more willing to buy domestic products because it is a way to support one’s
own country, while consumers might be refrained from purchasing products from
foreign countries which they hold animosity towards (Klein et al. 1998).
Compared to the research of country of origins, there has also been lots of
researches investigating the effects of region of origins. Some studies have found that
the local-origin labels also influence consumer’s behaviors. Loureiro&Hine (2002)
found that consumers in Colorado were willing to pay a premium for potatoes labeled

“Colorado-grown” than other potatoes with labels indicating organic or no genetic
modification.
Comparatively, according to my knowledge, there has been little work
compared the effect of country of origin labelling (“U.S grown)” with region of origin
labeling (“state grown”) with few exceptions. Howard & Allen(2006) reported the
results of focus-group research and a survey in the Central Coast region of California
to explore the consumers’ most interested labeling, and it turned out that the local
origins are more important than country of origins for consumers. Suri and Thakor
(2013) compared the effects of two types of manufacturing origins: “made in country”
and “made in county” for expensive durable products, and the results indicated that
when consumers were motivated to process information and when quality rating was
high, the local identity effects were elicited. Thus questions remain that for
agricultural products, how consumers make price-value tradeoffs for products with
state of origin labels and country of origins labels, whether the evaluations of state-
specific labels will be significantly different from that for country of origin labels. If
there exists a significant difference, what will be the reasons driven such difference.
It is also noted that most previous researches explored the consumers’
evaluation for the label information and consumers’ willingness to pay used the
method of open-ended contingent valuation method (CVM), an approach which asked
an open-ended question regarding consumers’ willingness to pay for a specific
product. Although this approach has advantages such as the data is easy to collect,
yet, it suffers serious drawbacks. Particularly, it was observed that respondents often
overstate their price sensitivity (Chhabra, 2015). In this research, van Westendorp’s
price sensitivity model will be used to find out the optimal price and also the
acceptable price range for the fresh tomatoes with country of origins and with state of
origins.

Survey Design and Data Collection
An online survey was conducted between September 22 and 23 in 2015. Our
target sample included primary shopper, 18+ living in the northeastern and
southeastern states of the United States. A total of 3,138 respondent initiated the
survey and 1160 respondents completed the survey and met the screening questions.
Since the purpose of this study is to analysis what, if any, is the reasons driven the
difference between the optimal prices for fresh tomatoes with country of origin labels
and fresh tomatoes with state of origin labels, thus the survey consist of four parts.
In the first part, respondents were asked to answer a series of questions
concerning their consumption behavior towards vegetable consumptions, then
tomatoes specifically. In the second part, consumers were asked about their
knowledge and perceptions about Florida fresh tomatoes. In the third part,
respondents were asked to answer a series questions of van Westendorp pricing
sensitivity on fresh tomatoes to find out consumers’ willingness to pay. In the last
part, demographic information was collected.
The research differs from the previous studies is that we use the van
Westendorp pricing sensitivity model to estimate the consumers’ willingness to pay
for Florida fresh tomatoes, and U.S fresh tomatoes. Van Westendrop method is one of
the popular methods in marketing research, trying to figure out the optimal prices for
different products. Like the method of direct open-ended questions for willingness-to-
pay (“How much would you pay for the product”), it is also a direct technique, which
assumes that consumers have prior understanding of what a product is worth and thus
consumers could be explicitly about the price question directly. However, it combined
the open-ended questions with quality and price. The VW approach assumed that
consumers make their decision on how much to pay by balancing value against price,
and there exist an upper and lower bound for the price that the consumer’s willing to
pay for the product.
Different from the open-ended question asking a single question to provide a
point estimate of the price for certain product, van Westendrop questions consists of a

serious of four questions trying to elicit the price from different perspectives: 1. too
expensive: At what price would you consider the one unit of the product to be too
expensive and you would not consider buying them; 2. too cheap: At what price
would you consider one unit product to be too inexpensive that you would doubt the
quality and would not consider buying them; 3. expensive: At what price would you
consider the product to be starting to get expensive, so you would have to give some
thought to buying them; 4. Cheap/bargain: At what price would you consider the
product a bargain-a great buy for your money. Upon completion of the questions, the
cumulative percentage of respondents for each of the four questions against the price
was drawn. The intersection of expensive price curve and the reversed too-cheap price
curve is called the “marginal cheapness”, the intersection point of the reversed cheap
curve with the too-expensive curve is called the “marginal expensiveness”. These two
points are respectively be the lower and upper bound of the acceptable price. The
interval between the upper and lower bound are called the acceptable price range. The
intersection point of too-expensive curve and the reserved too-cheap curve is called
the optimal price.
Paired t-test was employed to analyze the whether there exist a significant
difference between the acceptable price range for Florida fresh tomatoes and U.S
fresh tomatoes. Ordered Logistic models will further be used to explore the possible
reasons that stimulate the consumers’ willingness to pay for these two types of fresh
tomatoes.
Data Analysis and Survey Results
The summary of the demographic characters were displayed in Table 1. As the
respondents were screened to be the primary shopper at home, the sample is not
expected to be the U.S representative. The age range of the participants was 18 years
of age to 89. 79.7% of the respondents are female.
96.21% of the participants indicated that they often purchased fresh tomatoes
from grocery stores, 57.07% purchased tomatoes from farmers’ market. 28.97%

reported that they bought the fresh tomatoes from roadside stands. As for the tomatoes
types, the type that consumers mostly often choose to buy is the regular tomatoes,
26.47% participants just chosen to purchase the regular type with no specific type;
Then, Roma (21.72%), On the vine (20.69%), and beefsteak (10.6%)are the following
popular types. When making decisions to purchase fresh tomatoes, the most important
five factors are the freshness, firmness, color, price and type.
More than half (50.78%) of the participants known that fresh tomatoes are
produced in the State of Florida. 77.67% agreed that Florida fresh tomatoes are in
premium quality, 69.67% agreed that Florida fresh tomatoes are safer than other
tomatoes, 73.36% agreed that Florida fresh tomatoes have better taste, 81.03% agreed
that Florida fresh tomatoes assured a consistent quality. These numbers illustrate that
more than half of the participants in this survey have good images of Florida fresh
tomatoes.
Following the van Westendorp’s method, the participants’ answers to the four
PSM questions were aggregated and yielded four cumulative distributions. Because,
for the four questions with price from low to high, the answers ‘validity were checked
before analyzing the data, only the answers of the four price in the right order ( from
the too cheap to too expensive) were kept. The two questions regarding respondents’
perception of “not expensive” and “too cheap” were reversed. For each of the four
questions, the cumulative frequencies are plotted against the current price on the same
graph. The plot graph for the van Westendrop pricing for U.S tomatoes was displayed
in figure 1, and the plot graph for the van Westendrop pricing for Florida tomatoes
was displayed in figure 2.
In figure 1, the lower bound (The intersection of expensive price curve and the
reversed too-cheap price curve) of the price for Florida fresh tomatoes is approximate
$1 and the upper bound (the intersection point of the reversed cheap curve with the
too-expensive curve) is approximate $1.8. From this graph, we could also get that the
approximate optimal price (the intersection point of too-expensive curve and the
reserved too-cheap curve) for Florida fresh tomatoes is $1.5.
From figure 2, the approximate lower bound price for U.S fresh tomatoes is
$0.9, the upper bound price is $1.7, and the optimal price is around $1.4. It turns to be
a slightly less than the price range of Florida fresh tomatoes. To compare it more
clearly, the curves for both U.S fresh tomatoes and Florida tomatoes are displayed
together in Figure 3.
In figure3, it illustrated the comparisons of all the four price curves for U.S and
Florida fresh tomatoes. Although the difference is slight, yet, it illustrates that the
Florida tomatoes’ expensive curve and too-expensive curves are to the left of those of
U.S tomatoes, and the Florida tomatoes’ reversed cheap and too-cheap curves are to
the right of those of U.S tomatoes. Thus, from this graph, we could find that the
acceptable price range for Florida fresh tomatoes are little bit higher than that of the
U.S fresh tomatoes.
In order to test whether the price differences were significant or not, a paired t
test was employed, and the results are given in table 1 and table 2.
From table 1 and table 2, the price difference between the fresh tomatoes with
Florida origins labelling and U.S. fresh tomatoes are significant from all of the three
perspectives. The optimal price of Florida fresh tomatoes is significantly higher that
of U.S fresh tomatoes; the upper and lower bound price of Florida fresh tomatoes are
also significantly higher than those of U.S fresh tomatoes. Thus it indicated that the
price range of Florida fresh tomatoes are significantly higher than that of U.S fresh
tomatoes.
Model Specification
In this study, an ordered logistic model was employed to find out the possible
factors that cause the difference of consumers’ willingness-to-pay for Florida fresh
tomatoes and U.S fresh tomatoes. To be more specifically, as we want to compare the
effectiveness of state-specific label versus country of origins labels, the dependent
variable will be the optimal price difference of Florida fresh tomatoes versus U.S
fresh tomatoes. The independent variables include consumers’ knowledge and

perception of Florida fresh tomatoes, consumers’ shopping habits towards tomatoes,
consumers shopping habits, and demographic information. The empirical model was
specified as follows:
Difference = F (𝑋𝑖, 𝑆𝑖, 𝑃𝑖, 𝐷𝑖 , 𝑒1) (1)
Where the variable difference is an ordered variable with three categories. If the
Florida fresh tomatoes price is higher than the U.S, the difference equals to 2; if the
Florida fresh tomatoes price is equal to the U.S, the difference equals to 1; if the
Florida fresh tomatoes price is lower than the U.S, the difference equals to 0; D is a
vector of demographic variables (gender, age, education level, income, and
race/ethnicity); X is a vector of variables indicating consumers’ shopping preference
toward tomatoes, and the preference include consumers preference towards tomatoes
‘attributes including size, fresh, smell, brand, type, gmo, firmness, region, and
organic. To reduce the dimension of preference, a factor analysis was employed, and
finally only two summarized underlying attributes were attained: observed attributes ,
which include size, color, type, fresh, brand, firm; and unobserved attributes, which
include gmo, region, and organic. P is a vector, indicating consumers’ knowledge and
perceptions towards Florida fresh tomatoes. S is a vector indicating consumers
shopping habit: where to buy the fresh tomatoes, and what type of tomatoes to buy.
Results and Conclusion
The model results were illustrated in Table 4. Caucasians and Asians are
statistically significant that they would like to pay more for Florida fresh tomatoes
compared to U.S tomatoes. The more consumers known about Florida tomatoes, the
better perceptions that they had on Florida tomatoes, the higher probability that they
would pay more for Florida fresh tomatoes. The tomatoes type also statistically
significant, it indicated that for the type of on the vine, consumers would like to pay
more for tomatoes with “Florida grown” labelling than those with country of origins
labeling. All the other factors are not statistically significant in this model.
Consumer’s knowledge of Florida’s tomatoes, and their perception toward Florida
tomatoes quality are significantly positive related to the price difference.
From this research, by using the van Westendorp Price Sensitivity Analysis, the
acceptable price range for Florida fresh tomatoes and U.S fresh tomatoes were
estimated, and by using this dataset, it turns out that the price range of Florida
tomatoes are statistically higher than that of U.S fresh tomatoes. Concerning the
factors influencing this price difference, Caucasians and Asians seems to be more
likely to pay the premium for Florida fresh tomatoes. Consumers’ awareness of
production location for tomatoes, and consumers’ knowledge and perception for the
tomatoes produced in the state do play an important role. The more consumers knows
about Florida tomatoes, the higher perception, and the more likely they would like to
pay the premium to the Florida tomatoes.
It is implied that the use of “locally made” is a signal of the agricultural food
quality, taste and freshness, and it would allow the consumers to express themselves
with less fear of a quality penalty. The strategy of promoting the fresh tomatoes with
“Florida grown” labelling, consumers’ knowledge and perception about the Florida
fresh tomatoes is the key point.

References
Alfnes, F., & Rickertsen, K. (2003). European consumers' willingness to pay for US
beef in experimental auction markets. American Journal of Agricultural
Economics, 85(2), 396-405.
Chhabra, S. (2015). Determining the Optimal Price Point: Using Van Westendorp’s
Price Sensitivity Meter. In Managing in Recovering Markets(pp. 257-270).
Springer India.
Dentoni, D., Tonsor, G. T., Calantone, R. J., & Peterson, H. C. (2009). The Direct and
Indirect Effects of'Locally Grown'on Consumers' Attitudes towards Agri-Food
Products. Agricultural & Resource Economics Review, 38(3), 384.
Howard, P. H., & Allen, P. (2006). Beyond organic: consumer interest in new labelling
schemes in the Central Coast of California. International Journal of Consumer
Studies, 30(5), 439-451.
Klein, J. G., Ettenson, R., & Morris, M. D. (1998). The animosity model of foreign
product purchase: An empirical test in the People's Republic of China. The
Journal of Marketing, 89-100.
Lim, K. H., Hu, W., Maynard, L. J., & Goddard, E. (2013). US consumers’ preference
and willingness to pay for country‐of‐origin‐labeled beef steak and food safety
enhancements. Canadian Journal of Agricultural Economics/Revue canadienne
d'agroeconomie, 61(1), 93-118.

Loureiro, M. L., & Hine, S. (2002). Discovering niche markets: A comparison of
consumer willingness to pay for local (Colorado grown), organic, and GMO-
free products. Journal of Agricultural and Applied Economics, 34(03), 477-487.
Loureiro, M. L., & Umberger, W. J. (2007). A choice experiment model for beef: What
US consumer responses tell us about relative preferences for food safety,
country-of-origin labeling and traceability. Food policy, 32(4), 496-514.
Lusk, J. L., Brown, J., Mark, T., Proseku, I., Thompson, R., & Welsh, J. (2006).
Consumer behavior, public policy, and country-of-origin labeling.Applied
Economic Perspectives and Policy, 28(2), 284-292.
Mabiso, Athur, James Sterns, Lisa House, and Allen Wysocki. "Estimating consumers’
willingness-to-pay for country-of-origin labels in fresh apples and tomatoes: A
double-hurdle probit analysis of American data using factor scores."
In American Agricultural Economics Association Annual Meeting, Providence,
Rhode Island, pp. 24-27. 2005.
Schupp, A., & Gillespie, J. (2001). Consumer attitudes toward potential country-of-
origin labeling of fresh or frozen beef. Journal of Food Distribution
Research, 32(3), 34-44.
Suri, R., & Thakor, M. V. (2013). “Made in Country” Versus “Made in County”: Effects
of Local Manufacturing Origins on Price Perceptions.Psychology &
Marketing, 30(2), 121-132.

Xie, J., Gao, Z., Swisher, M., & Zhao, X. (2015). Consumers’ preferences for fresh
broccolis: interactive effects between country of origin and organic
labels. Agricultural Economics.
Verlegh, Peeter WJ, and Jan-Benedict EM Steenkamp. "A review and meta-analysis of
country-of-origin research." Journal of economic psychology 20, no. 5 (1999):
521-546.

Figure 1. Van Westendorp Price Sensitivity Analysis for Florida tomatoes
-0.2
0
0.2
0.4
0.6
0.8
1
1.2
0 2 4 6 8 10 12
cum
ula
tive
fre
qu
ency
price
Florida_too expensi Florida_expensive florida_toocheap florida_cheap
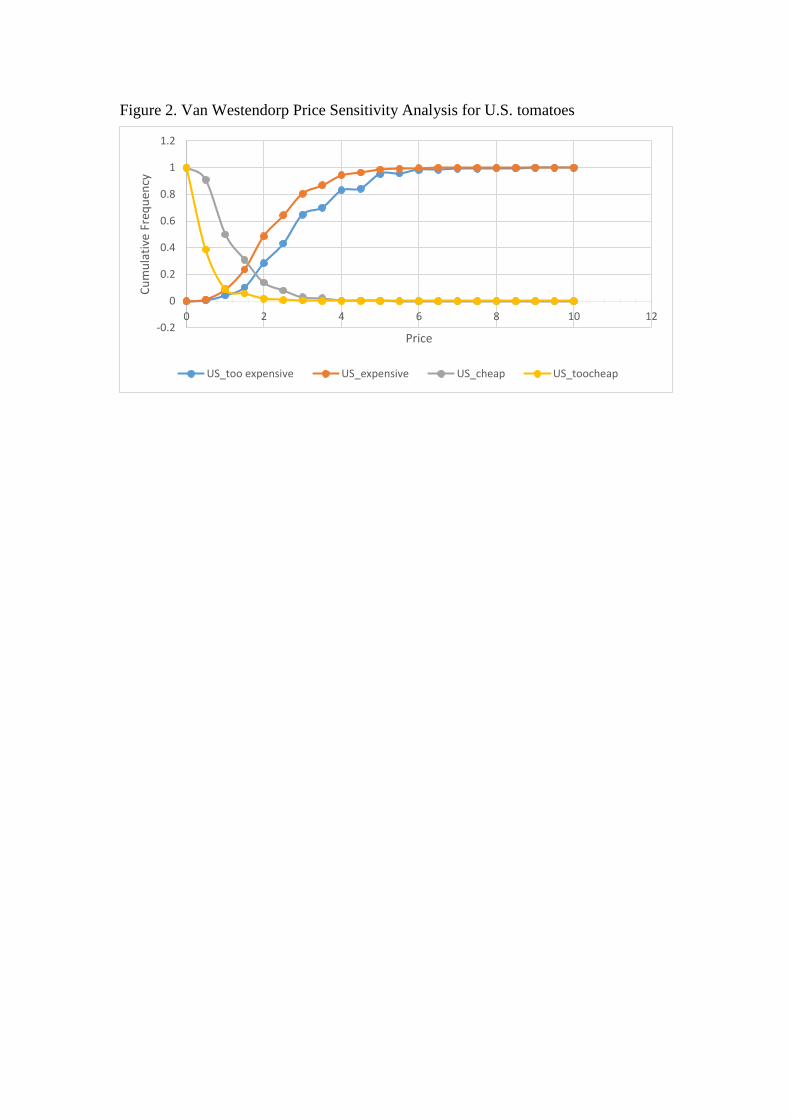
Figure 2. Van Westendorp Price Sensitivity Analysis for U.S. tomatoes
-0.2
0
0.2
0.4
0.6
0.8
1
1.2
0 2 4 6 8 10 12
Cu
mu
lati
ve F
req
uen
cy
Price
US_too expensive US_expensive US_cheap US_toocheap

Figure 3. Comparing the Van Westendorp Price Sensitivity Analysis of Florida
tomatoes and U.S. tomatoes
-0.2
0
0.2
0.4
0.6
0.8
1
1.2
0 2 4 6 8 10 12
cum
ula
tive
fre
qu
ency
price
Florida_too expensi Florida_expensive florida_toocheap
florida_cheap US_too expensive US_expensive
US_cheap US_toocheap

Table 1. Demographics of survey respondents.
Category Percent Category Percent
Percent Female 79.7 Employment Status
Age Full-time 37.1
18-24 4.8 Part-time 12.2
25-34 23.2 Student 2.7
35-49 24.6 Retired 24.3
50-64 34.7 Not employed 23.7
65+ 12.7
Income level
Number of Children in house less than $25,000 15.2
none 56.7 $25,000-$34,999 13.1
1 34.6 $35,000-$49,999 16.3
2 8.1 $50,000-$74,999 24.4
3 or more 0.6 $75,000-$99,999 16.0
$100,000 or more 15.0
Education level Ethnicity
High school graduate or
less
65.77 White/Caucasian 75.95
College and post
graduate
34.23 African American 6.09
Asian 4.73
Hispanic 4.41
Other 11.14

Table 2. Van Westendorp Price for Florida and U.S tomatoes
N Means Std Dev Std Err
Difference of Florida and
U.S Price Lower bound
1184 0.05 0.24 0.26
Difference of Florida and
U.S
Optimal price
1184 0.08 0.31 0.01
Difference of Florida and
U.S Price Lower bound
1184 0.09 0.35 0.38
Table 3. Difference of van Westendrop price of Florida and U.S tomatoes:
Matched Paired T-test
t df Sig. Mean
Difference
Difference in Lower Bound Price 6.34 1183 <0.001 0.05
Difference Optimal price 9.09 1183 <0.001 0.08
Difference in Upper Bound Price 9.04 1183 <0.001 0.09

Table 4 Regression results of Logistic Model for consumers’ willingness to pay
Variable Estimate Standard Error
Intercept1 -2.29 0.60
Intercept2 1.22** 0.59
male 0.07 0.15
education 0.10 0.13
Caucasian 0.76** 0.30
black 0.29 0.36
hispanic 0.27 0.33
asian 0.80** 0.37
roma 0.34* 0.18
grape 0.10 0.28
cherry -0.10 0.24
beefsteak 0.30 0.23
heirloom 0.37 0.30
vine 0.56*** 0.18
Observed_attributes 0.06 0.07
Unobserved_attributes -0.04 0.08
income -0.04 0.03
age -0.01 0.004
grocery 0.43 0.33
farmers 0.01 0.13
convenience 0.33 0.35
roadside 0.23 0.14
upick 0.25 0.35
knowledge 0.23* 0.13
premiumq 0.04 0.04
safer 0.01 0.03
taste 0.04 0.04
Quality 0.10** 0.04
Number of Observations Used: n=1160
“*”: Significant at 10%; “**”: Significant at 5%; “***”: Significant at 1%