Embed Size (px)
Citation preview
1
Comparing the cost-efficiency of CoAP and HTTP in Web of Things
applications
Tapio Levä (Corresponding author)
Aalto University, Department of Communications and Networking
P.O. Box 13000, 00076 AALTO, Finland
Oleksiy Mazhelis
University of Jyväskylä, Department of Computer Science and Information Systems
P.O. Box 35, FIN-40014, Finland
Henna Suomi
Aalto University, Department of Communications and Networking
P.O. Box 13000, 00076 AALTO, Finland
Accepted manuscript. Please cite this article as:
Tapio Levä, Oleksiy Mazhelis, Henna Suomi (2014). Comparing the cost-efficiency of CoAP and
HTTP in Web of Things applications. Decision Support Systems, vol. 63, July 2014, pp. 23-38, DOI:
10.1016/j.dss.2013.09.009.
ABSTRACT: Constrained Application Protocol (CoAP) has been introduced as a simpler alternative to the
Hypertext Transfer Protocol (HTTP) for connecting constrained smart objects to the Web. The adoption of the
protocol depends on its relative advantage, and the cost-benefit associated with the use of the protocol is a
significant factor affecting a protocol adoption decision. This paper aims at deepening the understanding of the
cost-benefits of CoAP and identifies the application scenarios where its use is likely to be economically
justifiable. The paper analyzes the costs of using CoAP and HTTP in the Web of Things (WoT) applications, by
identifying the components of the total cost of ownership (TCO) model for these applications and by studying
the factors affecting individual costs. The use of the model is then demonstrated by means of comparing the
TCO of CoAP and HTTP in an environment monitoring application scenario. The results of the analysis suggest
that the simpler hardware requirements of CoAP smart objects, as well as the lower communication overhead of
the protocol and the resulting reduced power consumption lead to cost advantages in the application scenarios
2
where the smart objects i) are large in volume and/or are deployed in the field, ii) engage in frequent
communications with the Web that are charged for on the basis of the volume of the data being transferred, and
iii) are sleeping between the communication sessions. The obtained results may be utilized both by the decision-
makers considering the adoption of CoAP in specific solutions, as well as by the academics and practitioners
involved in the protocol development.
Keywords: CoAP, HTTP, Web of Things, Total cost of ownership, Adoption
1 Introduction
Proliferation of Internet technologies has resulted in an immense growth of the Web, which in 2012
exceeded 900 million Internet hosts1 and 200 million active web sites2. To date, the growth of the
Web has been predominantly attributed to the increase in the number of conventional static and
dynamic web sites. However, the Web of Things (WoT) vision predicts the future evolution of the
Web towards the state where the everyday objects equipped with computing and communication
capabilities – the smart objects – are interconnected with the Web by applying standard web protocols
[17,18]. Interconnecting such smart objects with the Web promises a number of benefits to the users,
varying from faster and more accurate sensing of our environment to more cost-efficient tracking of
industrial processes [16,37].
One of the main paradigms in the WoT applications is the utilization of the well-established
architectural principles and protocols of the Web in order to seamlessly interconnect smart objects
[17]. These include the Representational State Transfer (REST), defined by Fielding and Taylor [15],
as the primary architectural interaction pattern, and using Hypertext Transfer Protocol (HTTP) as the
application layer protocol [37]. In RESTful WoT applications, a smart object (which is often running
an embedded web server) usually interacts with the counterparts in the Web by exchanging requests
and responses over HTTP. While being a standard and well-known application layer protocol, it may
be too heavy and inefficient for implementation on constrained, battery-powered devices [26].
In order to cope with the limitations of the HTTP in the WoT applications on constrained devices, the
Internet Engineering Task Force (IETF) has introduced the Constrained Application Protocol (CoAP)
– a web transfer protocol optimized for the constrained power and processing capabilities of WoT
smart objects [27]. Compared to HTTP, CoAP offers numerous potentially beneficial features when
implementing WoT applications, among which are a compact binary header, UDP-based transport
with simple reliability provisions, built-in resource discovery, and a push mechanism with
subscriptions to information [7][26]. At the time of writing, CoAP standardization is still being
finalized, and the use of the protocol in industrial products and solutions is still due. Therefore, the
1 http://www.isc.org/solutions/survey
2 http://news.netcraft.com/archives/2012/04/04/april-2012-web-server-survey.html
3
competition is still upcoming between the CoAP-based and other solutions for the position of the new
dominant design in future WoT applications. The economic forces towards cost minimization, along
with social and political forces, will determine whether CoAP will become a part of the new dominant
design for WoT applications [31].
The company’s choice of a technology, including protocols, is justified by the need to support its
value disciplines of operational excellence, product leadership, or customer intimacy [30]. From the
perspective of the WoT applications, the role of CoAP and other protocols is to enable
communication between smart objects and their counterparts in the Web. Given the similar
functionality offered by the protocols, the use of a particular protocol is unlikely to bring an advantage
in terms of product leaderships or customer intimacy. Rather, the protocol choice will contribute to
the operational excellence of the company, and therefore, the attainable cost savings due to the use of
a protocol are crucial for the protocol adoption decisions. This justifies the analysis of the costs of the
WoT applications based on different protocols, in order to identify i) the source of the cost-differences
and ii) the magnitude of the cost savings affected by the choice of the protocol as the key factors
affecting its adoption [19]. Minimizing the total cost of a connected smart object is also one of the
main objectives of CoAP [3] and thus deemed crucial for its successful adoption. However, to the best
knowledge of the authors, no publicly available works have focused on systematically studying the
cost savings attainable through the use of CoAP.
The objective of this paper is to deepen the understanding of the cost advantages of CoAP, and to
investigate scenarios where its application is likely to be economically justifiable. The paper focuses
on the Internet-connected, battery-powered smart objects with constrained communications and
processing capabilities, and limited random access memory (RAM). Further, the analysis in the paper
assumes that openly standardized protocols are the most promising candidates for the future dominant
design position [32]. Therefore, the paper evaluates the cost advantages of using CoAP as compared
with HTTP, which is the state-of-the-art standard for conventional RESTful web services. On the
other hand, the proprietary, domain-specific, and other non-IETF protocol stacks available for
constrained devices, such as Z-Wave, KNX, and ZigBee, are excluded from the analysis. Also, any
other factors than costs that may potentially affect the adoption decisions – such as the security
implications, the architectural choices made, and the organizational policies – are excluded from the
analysis for the sake of simplicity.
The research questions addressed in the paper can be formulated as follows:
• How to compare two or more protocols, such as CoAP and HTTP, in terms of their costs?
• What are the factors determining the cost-efficiency of CoAP vs. HTTP?
• In which WoT application scenarios is the use of CoAP cost-advantageous as compared with
HTTP?
4
The cost analysis in this paper follows an analytical approach. First, a generic total cost of ownership
(TCO) model for WoT applications is created by identifying the individual cost components of TCO.
Then, the created TCO model is used for comparing the cost-efficiency of CoAP and HTTP protocols
in the context of an exemplary environment monitoring application scenario. The values for the
individual cost components and the parameters affecting them are estimated using multiple sources of
information, including academic and trade sources, own measurements, as well as expert interviews.
To mitigate possible inaccuracies of individual estimates, a sensitivity analysis has been performed
and its results are reported in the paper.
The results of the TCO analysis suggest that:
• CoAP is generally more cost-efficient than HTTP for applications with a high number of
smart objects, each engaged in frequent communications sessions, whereas for infrequent
interactions, the cost difference between the protocols is insignificant.
• CoAP is also more cost-efficient in case the smart objects are deployed in the field, thereby
incurring significant costs of battery replacements.
• The use of CoAP allows the cost of the applications to be decreased dramatically in case the
charging for the data communications is volume-based, since the small overhead of the
protocol and its reliance on the UDP enable a manifold reduction in the transferred data
volume.
• Finally, the use of CoAP is found to be economically more beneficial in case the smart
objects are awake only for occasionally initiating the communication sessions (push mode of
communication) as opposite to the case when the smart object is periodically awake in a
listening mode awaiting for incoming communication requests (pull mode).
The paper contributes both to the scientific community and to the community of practitioners. First,
the paper contributes by applying the TCO analysis, typically used for supplier selection, into a new
context of technology selection between alternative technologies. Second, the article makes a
methodological contribution by introducing a generic TCO model that can be used to analyze the
TCO of various WoT application scenarios and technological options not limited to IETF standards.
Arguably, the model is sufficiently generic to be used also outside of WoT applications, as the
architectural elements considered in the model can be identified in a variety of IT systems. Moreover,
whereas the cost components of IT systems have been identified in earlier works, this paper elaborates
on how to estimate these costs. Finally, the paper makes a practical contribution by deepening the
understanding of the factors that make CoAP a more cost-efficient alternative to HTTP in WoT
applications. These results are expected to be advantageous to the CoAP standardization and
deployment, by providing an early feedback about its strong and weak sides, as seen from the cost
perspective.
5
The remainder of the paper is organized as follows: Section 2 describes the constraints of
contemporary smart objects, introduces the CoAP for connecting these objects to the Web, and
discusses the potential benefits of using CoAP as opposite to HTTP in constrained environments.
Section 3 introduces the TCO as an analytical tool employed in the paper for systematically
comparing the costs of the solutions based on CoAP and HTTP. Section 4 identifies the individual
cost components and creates a generic TCO model for WoT applications based on a generic technical
architecture. In Section 5, the individual costs are further elaborated, estimated, and compared for
different application scenarios. The results of the cost comparison are discussed in Section 6. Finally,
Section 7 summarizes the paper and provides the directions for future work.
2 Constrained devices: current evolution phase
The Web of Things is envisioned to bring web services cost-efficiently into smart objects, for which
the benefit of Internet connectivity has earlier been too low, as compared with the investments
needed. Using standard protocols and interfaces, the WoT technologies are expected to reduce the
costs, thereby making some of the business cases profitable. Due to the emphasis on reducing costs, as
well as on minimizing the physical size and enabling an autonomous operation, these smart objects
are often constrained in their computing and communications capabilities. Often these objects employ
batteries as their power source, and are expected to run unattended for many months or years. The
limited power supply places restrictions on the energy consumption, and hence on the computing and
data communication tasks the smart object is capable of executing. Even when the smart objects (e.g.,
white goods) are powered by the electricity grid, the cost-efficiency requirements lead to the use of
microcontrollers with very small code and memory sizes.
2.1 Current state of WoT – proprietary solutions in separate verticals
At present, the WoT technologies are applied in many vertical application domains, varying from
automotive and machinery to home automation and consumer electronics. Traditionally, these
technologies are implemented as a part of industrial in-house solutions based on machine-to-machine
communications and embedded systems. More recently, some products also within the consumer
electronics domain have started to appear in the market, with wellbeing devices (e.g., Withings3) and
smart home solutions (e.g., GreenWave Reality4) being among the most prominent examples. In many
application domains, proprietary standards have been designed to better meet the domain-specific
requirements and the limitations of constrained devices. Examples of these include BACnet,
3 http://withings.com/
4 http://www.greenwavereality.com
6
LonWorks, and KNX for industrial and building automation and Z-Wave and Insteon for home
automation.
The current solutions are thus dominated by a variety of proprietary and standard platforms, protocols,
and interfaces, making the components of solutions provided by different vendors barely compatible,
while keeping the prices of the components high. For instance, Z-Wave – a short range wireless
technology for home automation – represents a vertically integrated protocol stack that only works on
top of Z-Wave proprietary radio. Moreover, it does not specify the interoperability with the Internet
protocols, and thus a dedicated gateway is needed to convert the Z-Wave application protocols into a
convenient presentation format [24]. In a similar manner, the KNX protocols for building automation
specify the layers from the link layer up to the application layer, with a dedicated gateway device
needed to perform the conversion to TCP/IP. The ZigBee protocol stack, running on top of IEEE
802.15.4 radio, takes a notably different approach. The network (originally non-IP) and application
layer protocols are complemented by the so-called public application profiles that enable cross-vendor
interoperability within specific application domains, such as home automation, smart energy, and
healthcare. The universality and flexibility of ZigBee come at the cost of greater complexity, thus
making it less attractive for constrained smart objects (in addition to some other problems, such as
crowded frequency band and compatibility issues5).
2.2 Towards standardization – Constrained Application Protocol (CoAP)
One of the main paradigms of the WoT vision is the utilization of the well-established architectural
principles and protocols of the Web in order to seamlessly interconnect smart objects [18,37]. These
include the Representational State Transfer (REST), defined by Fielding and Taylor [15], as the
primary architectural interaction pattern, and using HTTP as the application layer protocol. In addition
to HTTP, which represents the de facto standard for information transfer in the Web, other protocols
have been designed to deal with specific type of information and/or specific types of applications,
such as the Extensible Messaging and Presence Protocol (XMPP) for instant messaging and presence
information exchange, or the Session Initiation Protocol (SIP) and the Real-time Transport Protocol
(RTP) for audio and video streaming.
Although HTTP is the de facto standard protocol well-suited to RESTful applications, it is considered
as suboptimal for the applications targeting smart objects, especially whenever these objects are
battery-powered. A lengthy header and the implied need to establish TCP connections, as well as the
reliance on the request/response pull as the only interaction model, result in a low power efficiency of
HTTP implementations, while also increasing requirements for the available memory and processing
5 See http://frostdale.wordpress.com/2011/01/06/zigbee-vs-z-wave-part-1/, also http://www.zwavereviews.com/index.php?artid=3&catid=1
7
capabilities of the smart objects’ hardware and thus inflating the related hardware costs. In other
words, the HTTP seems to represent a relatively poor match for the WoT applications when
implemented on constrained devices [26].
In order to address the limitations of the HTTP in the WoT applications on constrained devices, the
IETF established the Constrained RESTful environments (CoRE) Working Group. Its primary goal is
to coordinate the design and specification of the Constrained Application Protocol (CoAP) that
represents an alternative web transfer protocol optimized for the constrained power and processing
capabilities of the WoT smart objects [27]. CoAP specifies a minimal subset of REST requests
including GET, POST, PUT, and DELETE, supports resource caching and built-in resource
discovery, and relies on UDP as a transport protocol while providing reliability with a simple built-in
retransmission mechanism.
As compared with HTTP, CoAP’s characteristics are expected to bring the following benefits when
implementing WoT applications [7,26,33]:
• A more compact binary header of 10-20 bytes in total, along with the UDP-based transport,
reduces the volume of overhead data that needs to be transmitted along with the payload, thus
reducing the delay and minimizing the battery drainage due to data transmission;
• The support for the asynchronous information push (the observe option) enables the smart
objects to send information about the resource only when it changes, thus allowing the objects
to be asleep most of the time and further reducing their power consumption;
• The use of a minimal subset of the REST requests allows the protocol implementations to be
less complex as compared with HTTP, thus lowering the hardware requirements for the smart
objects on which it executes.
Due to the compact header and use of UDP-based transport, the communications overhead of CoAP is
notably smaller as compared with HTTP. As a result, depending on the payload size and the client-
server set-up, the CoAP/UDP transaction may require 8-10 times less bytes to be transferred, as
compared with the same transaction using HTTP/TCP [8,11]. Due to its similarity with HTTP, the
HTTP-CoAP mapping is relatively easy to realize [6].
Although a promising alternative to the proprietary or prohibitively complex WoT protocols, CoAP is
just leaving the research labs and making its way into the industrial products and solutions while the
protocol standardization is still being finalized. The proponents of CoAP, such as Ericsson, INRIA,
Lulea, NXP, Sensinode, SICS, STMicroelectronics, Watteco, and Wisenet, are testing their CoAP
8
implementations and their interoperability6. However, only few reported examples of using the
protocol in commercial products, such as Sensinode’s NanoService, can be found. Therefore, the
competition is still upcoming between the HTTP, CoAP and proprietary solutions for the position of
the new dominant design in future WoT applications. If CoAP provides only minor benefits as
compared with HTTP, requires significant investments that are unlikely to pay off, or is complex to
implement, its adoption and subsequent emergence as a new dominant design is likely to be hindered,
similarly to the failure of the WAP protocol in the past [28].
3 Cost analysis based on the total cost of ownership
The total cost of ownership (TCO) analysis represents a systematic analytical tool for understanding
the total costs associated with acquiring and using goods or services. As opposite to a simplistic costs
analysis based on the acquisition price only, the TCO analysis covers the key cost constituents of pre-
acquisition, acquisition and possession, use, and disposal [12,13]. Multiple approaches exist for
developing an understanding of the costs. The approach followed in this study is known as the
monetary-based approach, where the costs are allocated to different components based on true costs.
Alternatively, the cost-ratio or value-based methods can be applied, in case the monetary costs need to
be combined with qualitative performance information, which is more difficult to express in monetary
terms [5,13].
A number of potential cost constituents are identified in literature [9,14]. According to David et al.
[9], the IT-related cost factors can be categorized into the acquisition, operations, and control costs –
with the latter being optional costs aimed at improving the IT centralization and standardization,
which in turn result in reduced operational costs. The relevance of a particular cost factor depends on
the particular application. For instance, transportation costs may be ignored as minor or absent in the
case of IT services; however, in the case of WoT solutions involving thousands of devices to be
serviced in the field, these costs may be crucial for the analysis.
A significant challenge to the implementation of TCO analysis is the lack of readily available data
[22]. A TCO model requires detailed information about the costs, which may be difficult to find or
estimate. In this paper, the individual cost components, and the parameters affecting them are
estimated using multiple sources of information, including:
(i) Academic and trade literature, e.g., for retrieving the pricing schemes and reference prices
applicable today, as well as technical characteristics of the solution components;
(ii) Own measurements, for estimating the power consumption of the smart objects; and
6 Source: IPSO Alliance, “IPSO Alliance Announces Successful Interoperability Event Along With Industry Firsts”, 18.4.2012,
http://www.watteco.com/index.php/component/content/article/5-news/173-ipsointerop.html
9
(iii) Semi-structured interviews with domain experts focusing especially on the cost factors
that differentiate the solutions based on the CoAP and HTTP protocols.
Further, in order to mitigate the effect of possible inaccuracies of individual estimates and generalize
beyond the specific hardware platform used for assessing the energy footprint of the protocols, a
sensitivity analysis was performed, whereby the effect of the variation in individual cost components
and other parameters on the TCO is studied.
The TCO analysis is further complicated by the fact that the costs are often situation-specific [13] and
may change over time. Consequently, a well-defined TCO model is often more valuable than a very
detailed analysis of a single case, because the model can be re-used for other applications with
different cost values and characteristics. Therefore, this paper focuses more on analyzing the
properties and borderline conditions of the cost model than giving definite answers about the
technology choice in specific application scenarios.
It should be noted that, in some works, the time-value of money is taken into account in the analysis,
by using the net present value (NPV) instead of non-discounted values. This is relevant when the costs
realize at different times during the product lifecycle for different options. Buy or lease decision
exemplified by Walker et al. [34,35] for the cloud computing related decision-making is one of these
cases. In this study, the time-value of money analysis is expected to provide little additional value,
because the compared technical alternatives induce costs at roughly the same time. Therefore, the
NPV analysis has been omitted. Likewise, the other factors potentially affecting the TCO – such as
the declining pricing trends, the quantity discounts, the cost of disposing and the salvage value of the
components, and the control costs – have been excluded from the TCO analysis for the sake of
simplicity.
Because the TCO approach has been developed for purchasing-related decision-making of well-
specified products, it has mainly been used in supplier evaluation and selection at the operational and
tactical level (e.g., [10,22]). To the best of our knowledge, TCO has not been widely applied to
strategic decision-making concerning technology investments with multiple options. NPV-based
techno-economic modeling efforts related to large-scale network investments [23,29] and Multipath
TCP adoption [36] represent the closest match, with the distinction that they also take into account
revenues to calculate the repayment period and profitability of the investments. These studies also
lack the comparison perspective, which is in the core of this paper. Therefore, this paper applies TCO
approach to a new context of technology selection.
4 Total cost of ownership of WoT applications
WoT applications can be realized with different alternative communication technologies. The choice
depends on the suitability of the technology to each application scenario, where suitability can be
10
measured by the net benefit for the relevant stakeholders. This paper focuses on the applications
where both HTTP and CoAP can be used to implement the application without significant difference
in the end-user experience. In other words, the application layer protocol choice has cost impact only.
In these cases, the cost analysis is an integral part of the decision-making process. Calculating TCO
assures fair comparison between different technologies since it covers the costs accumulated through
the entire lifecycle of the application. To formulate a generic TCO model for WoT applications, this
section first specifies the technical architecture and the value network under study, and then identifies
the cost components of the TCO model and the factors affecting their magnitude for the specified
architecture. Finally, the sources for potential cost differences between CoAP and HTTP are
discussed.
4.1 Technical architecture
The paper focuses on WoT applications utilizing Internet-connected, constrained devices, i.e., battery-
powered smart objects with constrained communications and processing capabilities, and limited
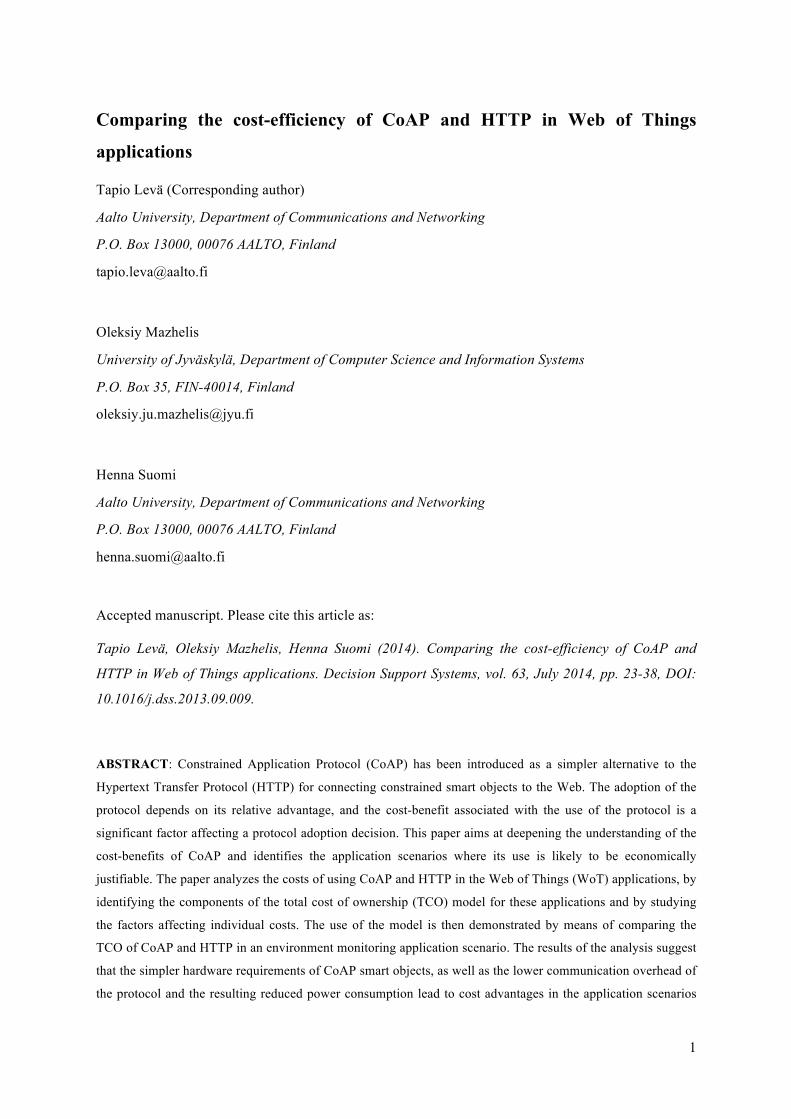
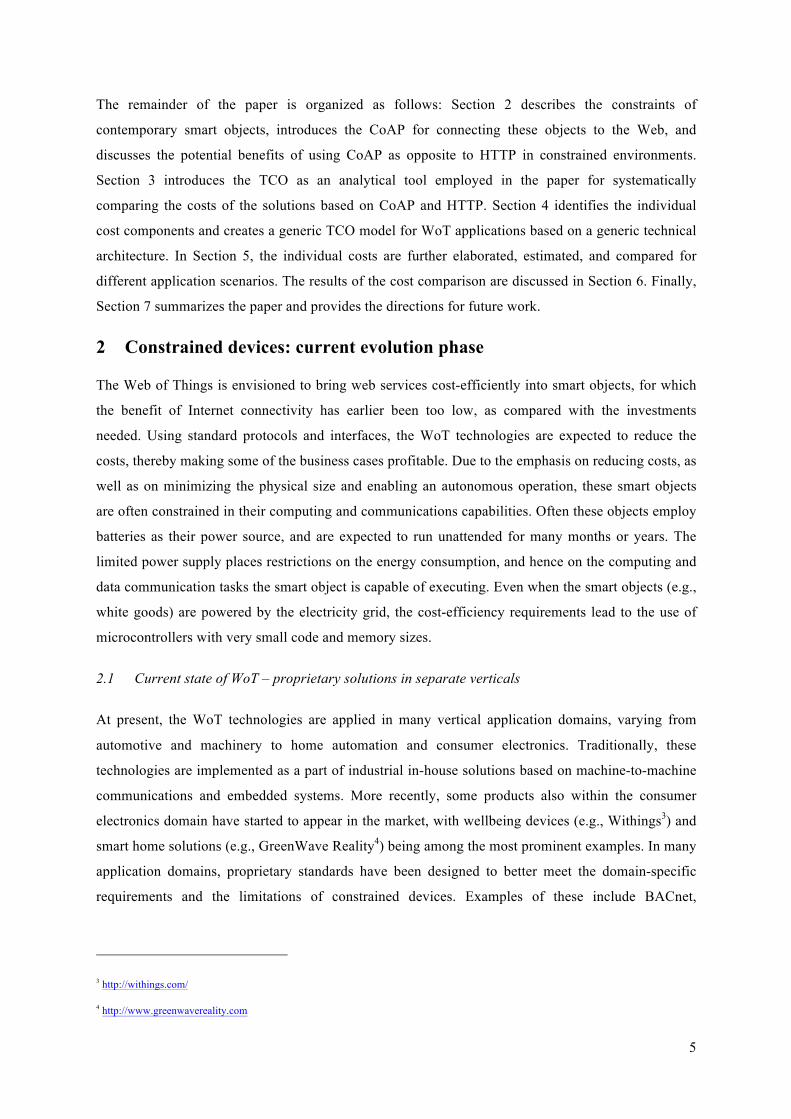
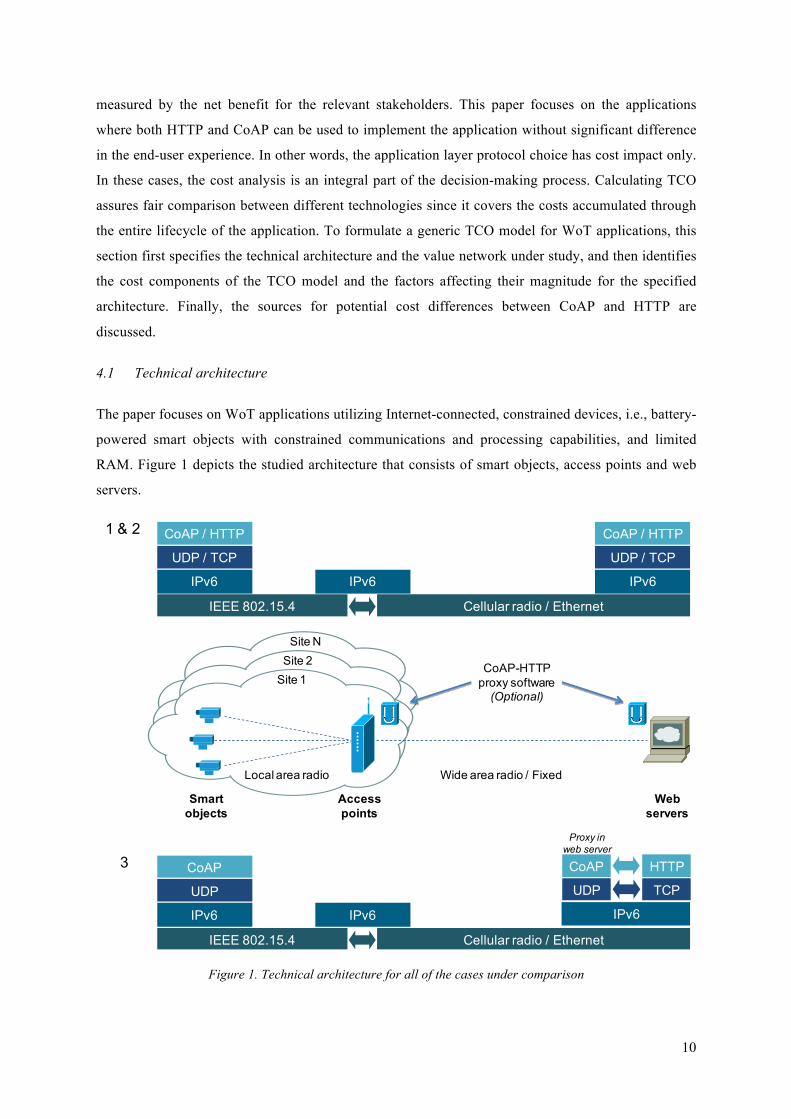
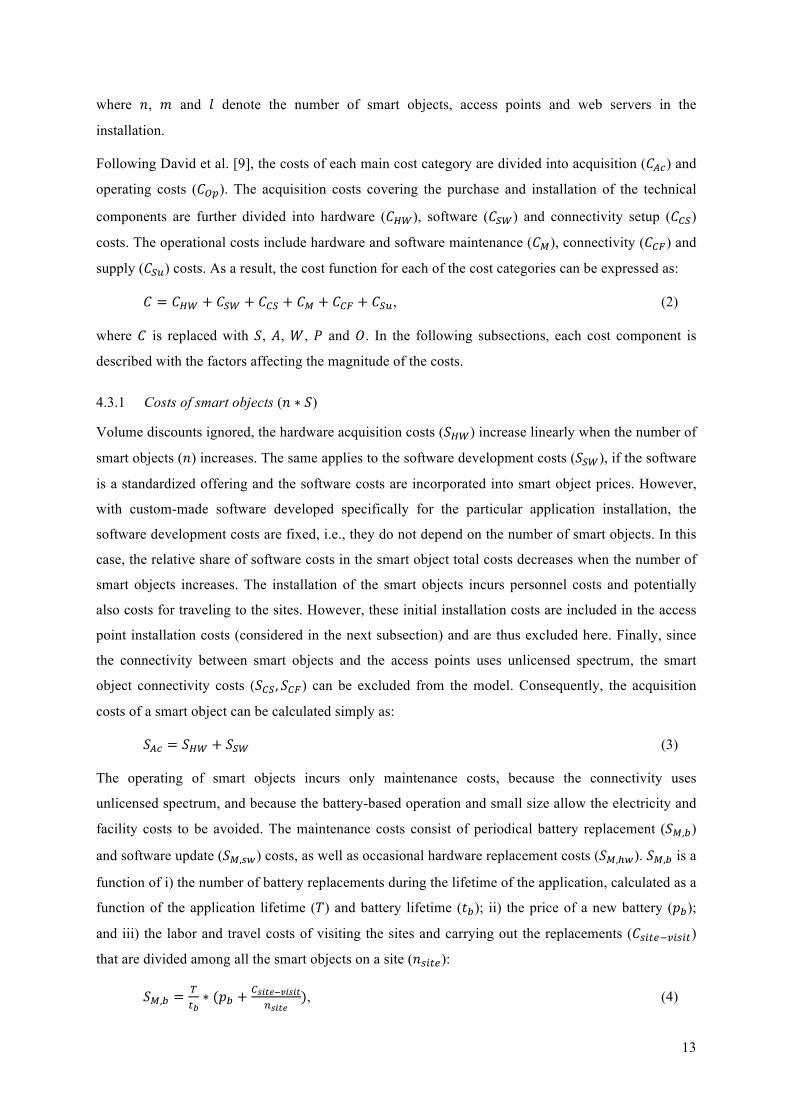
RAM. Figure 1 depicts the studied architecture that consists of smart objects, access points and web
servers.
Figure 1. Technical architecture for all of the cases under comparison
Web servers
CoAP-HTTP proxy software
(Optional)
Smart objects
Access points
Site 1
Site NSite 2
Local area radio Wide area radio / Fixed
CoAP
UDP
IPv6 IPv6
IEEE 802.15.4 Cellular radio / Ethernet
CoAP / HTTP
UDP / TCP
IPv6 IPv6
CoAP / HTTP
UDP / TCP
IPv6
IEEE 802.15.4 Cellular radio / Ethernet
CoAP
UDP
IPv6
HTTP
TCP
1 & 2
3
Proxy in web server
11
Smart objects (sensors or actuators) communicate through access points with web servers residing in
the public Internet. The smart objects are located in the proximity of access points so that they can be
connected using license-free short-range radio technologies, such as IEEE 802.15.4. The access points
are not resource-constrained and they connect to the web server over long-range radio or fixed links.
In some application scenarios, the smart objects are distributed across a wide geographic area, in
which case they form multiple sites with their corresponding access points. A CoAP-HTTP proxy is
an optional software component in the architecture, which can be used to translate between CoAP and
HTTP if the smart objects use CoAP but the server understands only HTTP. Depending on the
architectural choice, the proxy is implemented either in the access points or in the web servers. The
protocol stack in the bottom of Figure 1 assumes the latter approach, but the cost impact of both
options is discussed in Section 4.3.4.
The depicted architecture enables three deployment alternatives using CoAP and HTTP:
1) CoAP end-to-end (CoAP),
2) HTTP end-to-end (HTTP), and
3) CoAP between smart objects and proxy, and HTTP between proxy and web servers (CoAP-
proxy).
The paper further differentiates two modes of communication:
- In the pull mode, a smart object acts as a server awaiting the requests from a remote node,
and responds to the requests with the information required, e.g., by delivering the instant
sensor reading. The smart object is non-sleeping or frequently awaking, as it shall always be
ready to promptly respond to an incoming request.
- In the push mode, a smart object acts as a client and periodically sends the information to a
remote web server. The smart object is mainly sleeping and awakes only when it needs to
(sense and) communicate the information. In addition to periodic communication, CoAP also
provides the Observe option [20] that allows the smart objects to communicate only when a
specified condition is met.
The implementation details may blur the distinction between the two modes. For instance, in the pull
mode, the smart object may be asleep for a portion of time if a short delay in responding is tolerated,
or if a cached response by the proxy is sufficient until the next communication time. Still, for the
analysis in this paper, it is important to distinguish the mode where the smart object is constantly “on
duty” (pull) from the mode where the smart object may be offline for a relatively long period of time
(push), as it impacts the smart objects’ energy consumption and hence their battery lifetime.
The protocol stacks are different between the CoAP and HTTP cases. CoAP uses UDP as the
transport layer protocol, whereas HTTP uses TCP. This has implications for the CoAP-proxy case as
12
well since the protocol translation is required both at the transport and application layers.
Additionally, the communication mode affects the protocol stack implementation on smart objects. In
the push scenario the smart object requires only a client module, whereas in the pull scenario both
client and server modules are needed. The access points and web server have both client and server
modules.
Moreover, the following simplifying assumptions concerning the technical architecture are made:
• The 6lowPan IPv6 header compression format [21] is used to transmit IPv6 packets between
the smart objects and the access points, and the translation to regular IPv6 or IPv4 is
performed by the access points;
• The smart objects connect directly to access points (i.e., no routing over the smart objects);
• The battery-powered smart objects do not harvest energy (i.e., battery replacements are
needed);
• The transmitted messages are short and generally fit into a single IEEE 802.15.4 frame.
4.2 Value network
In order to succeed, the business case of a protocol needs to be positive for each stakeholder of the
value network. In the most challenging cases, the deployment of a WoT application may require
actions from multiple stakeholders. This paper, however, assumes that a single stakeholder – the end-
user (company) of the WoT application – controls the whole WoT application, including all the
components presented in Figure 1. This simplifies the analysis and allows focusing on the total cost of
ownership from the perspective of a single potential adopter.
The potential adopters are not necessarily the ones who choose the protocols; they often just buy what
technology providers sell to them. However, this does not cause problems to the analysis as the
incentives of technology providers and their customers are aligned, and the costs to the technology
providers (plus some margin) are included in the prices paid by the customers.
4.3 Generic TCO model for a WoT application
This section presents a generic TCO model for a WoT application using the introduced technical
architecture and describes the factors that affect the different cost components. The costs are
calculated separately for each group of technical components: smart objects (𝑆), access points (𝐴),
web servers (𝑊), and the optional proxy component (𝑃). System level costs that cannot be naturally
assigned to technical components are listed as other costs (𝑂). The total cost of ownership can be
expressed as the sum of the costs for the separate cost components:
𝑇𝐶𝑂 = 𝑛 ∗ 𝑆 +𝑚 ∗ 𝐴 + 𝑙 ∗𝑊 + 𝑃 + 𝑂, (1)
13
where 𝑛, 𝑚 and 𝑙 denote the number of smart objects, access points and web servers in the
installation.
Following David et al. [9], the costs of each main cost category are divided into acquisition (𝐶!") and
operating costs (𝐶!"). The acquisition costs covering the purchase and installation of the technical
components are further divided into hardware (𝐶!"), software (𝐶!") and connectivity setup (𝐶!")
costs. The operational costs include hardware and software maintenance (𝐶!), connectivity (𝐶!") and
supply (𝐶!") costs. As a result, the cost function for each of the cost categories can be expressed as:
𝐶 = 𝐶!" + 𝐶!" + 𝐶!" + 𝐶! + 𝐶!" + 𝐶!", (2)
where 𝐶 is replaced with 𝑆, 𝐴, 𝑊, 𝑃 and 𝑂. In the following subsections, each cost component is
described with the factors affecting the magnitude of the costs.
4.3.1 Costs of smart objects (𝑛 ∗ 𝑆)
Volume discounts ignored, the hardware acquisition costs (𝑆!") increase linearly when the number of
smart objects (𝑛) increases. The same applies to the software development costs (𝑆!"), if the software
is a standardized offering and the software costs are incorporated into smart object prices. However,
with custom-made software developed specifically for the particular application installation, the
software development costs are fixed, i.e., they do not depend on the number of smart objects. In this
case, the relative share of software costs in the smart object total costs decreases when the number of
smart objects increases. The installation of the smart objects incurs personnel costs and potentially
also costs for traveling to the sites. However, these initial installation costs are included in the access
point installation costs (considered in the next subsection) and are thus excluded here. Finally, since
the connectivity between smart objects and the access points uses unlicensed spectrum, the smart
object connectivity costs (𝑆!", 𝑆!") can be excluded from the model. Consequently, the acquisition
costs of a smart object can be calculated simply as:
𝑆!" = 𝑆!" + 𝑆!" (3)
The operating of smart objects incurs only maintenance costs, because the connectivity uses
unlicensed spectrum, and because the battery-based operation and small size allow the electricity and
facility costs to be avoided. The maintenance costs consist of periodical battery replacement (𝑆!,!)
and software update (𝑆!,!") costs, as well as occasional hardware replacement costs (𝑆!,!!). 𝑆!,! is a
function of i) the number of battery replacements during the lifetime of the application, calculated as a
function of the application lifetime (𝑇) and battery lifetime (𝑡!); ii) the price of a new battery (𝑝!);
and iii) the labor and travel costs of visiting the sites and carrying out the replacements (𝐶!"#$!!"#"$)
that are divided among all the smart objects on a site (𝑛!"#$):
𝑆!,! =!!!∗ (𝑝! +
!!"#$!!"#"$!!"#$
), (4)
14
The battery lifetime depends on the capacity of the battery and the average energy consumption of the
smart object:
𝑡! =!"#$%& !"#$%& !" ! !"##$%&
!"#$%& !"#$%&'()"#= !"#"$%&'∗!"#$%&'
!"#$%= !∗!
!, (5)
where energy consumption depends on the application specific factors, such as the used
communication mode (push vs. pull), communication frequency, complexity of parsing, and
transferred data volume.
The need for occasionally replacing the smart objects due to malfunctioning causes hardware
maintenance costs (𝑆!,!!). These are incorporated in the TCO model by defining the average lifetime
of a smart object (𝑡!,!!). Due to the unpredictable nature of hardware failures, smart object
replacement incurs an additional site visit:
𝑆!,!! = !!!,!!
∗ (𝑆!" + 𝐶!"#$!!"#"$). (6)
Software update costs (𝑆!,!") can be calculated similarly to the hardware maintenance costs by
defining the average time interval for software updates (𝑡!,!"), the development cost of a SW update
(𝑆!,!"!!"#$%&) divided among all the smart objects, and the installation costs (𝑆!,!"!!"#$%&&).
Depending on the application scenario, the software update installation can be either provisioned over
the air, which causes connectivity costs, or by visiting the sites as in the case of hardware
maintenance.
𝑆!,!" = !!!,!"
∗ !!,!"!!"#$%&!
+ 𝑆!,!"!!"#$%&& . (7)
4.3.2 Costs of access points (𝑚 ∗ 𝐴)
The number of access points (𝑚) depends on the number of sites and the number of access points per
site. The number of sites can be calculated as a function of the number of smart objects (𝑛) and the
number of smart objects per site (𝑛!"#$), whereas the number of access points per site depends on the
relation between 𝑛!"#$ and the maximum number of smart objects an access point can support (𝑛!"):
𝑚 = !!!"#$
∗ !!"#$!!"
, (8)
An access point is a wireless router, where the hardware and software costs are bundled into the
access point price (𝐴!"!!"). The initial installation of the access point (and the smart objects
connecting to it) in the sites causes installation costs (𝐴!",!"#$%&&) that consist of the personnel costs
and costs of travel to the site. Additionally, equipping each access point with data subscription causes
connectivity setup costs (𝐴!"). The function for the access point acquisition costs (𝐴!") can be
expressed as:
𝐴!" = 𝐴!"!!" + 𝐴!",!"#$%&& + 𝐴!". (9)
15
Maintenance costs (𝐴!) are calculated similarly as with smart objects as defined in Eq. 6 and Eq. 7:
𝐴!,!! = !!!,!!
∗ (𝐴!" + 𝐶!"#$_!"#"$); (10)
𝐴!,!" = !!!,!"
∗ !!,!"!!"#$%&!
+ 𝐴!,!"!!"#$%&& . (11)
The connectivity costs (𝐴!") depend on the pricing model [4] of the long-range connectivity. Simple,
flat-rated connectivity pricing schemes are common today and deemed important for boosting the
adoption of WoT technologies7. Also, when WoT applications are used in domestic deployments, e.g.,
as a part of a smart home solution, a landline broadband Internet connectivity is usually available, for
which flat-rate is a common charging approach [1]. The cost function for the flat-rate pricing scheme
can be expressed simply as the function of the application lifetime (𝑇) and the monthly price
𝐴!"#,!"#$:
𝐴!",!"#$ = 𝑇 ∗ 𝐴!"#,!"#$. (12)
On the other hand, a wide range of volume-based pricing schemes is also available. Subscriptions of
this type are common in case the smart objects are mobile, potentially even roaming between multiple
cellular networks. In the simplest version of volume-based pricing8, the price per data unit remains
constant irrespective of the transferred data volume. However, some communication service providers
(CSP)9 offer M2M subscriptions where a tiered pricing is applied, with the price per data unit
depending on the data volume, and where pooling data among devices is allowed. With such tiered
schemes, the price is subject to a volume discount and decreases as the transferred data volume grows.
Due to the large variation in the pricing schemes, the exact connectivity cost function needs to be
formulated separately for each application scenario.
Supply costs consist of electricity cost and the rent for premises. The monthly electricity cost is a
simple function of the average monthly power consumption of an access point (𝑃!) and the unit price
of energy (𝑢), whereas the rent for premises (𝐴!",!") is a constant monthly fee. To obtain the total
costs, monthly costs are multiplied with the application lifetime (𝑇):
𝐴!" = 𝑇 ∗ 𝑃! ∗ 𝑢 + 𝐴!",!" . (13)
7 http://www.telefonica.de/news/0/msg/17632/4323/0/o2-data-m2m-flat-first-flat-rate-for-communication-between-machines.html,
http://www.koretelematics.com/press-room/20121010-KORE-Wireless-Group-Partners-with-Optus-to-Expand-Global-Connect-Services-in-
Asia.html
8 http://www.telenor.me/en/Business/Internet/M2M-Machine-2-Machine/,
http://www.o2online.de/business/mittelstand/mobil/m2m/datam2m/
9 http://www.orange-business.com/content/mnc/mobility-tarifs-m2m.pdf,
http://www2.dir.texas.gov/SiteCollectionDocuments/CTS/Wireless%20Contracts/DIR-SDD-1779/DIR-SDD-1779-appendix-c.pdf,
http://m2m.sprint.com/engage-with-us/m2m-pricing
16
4.3.3 Costs of web servers (𝑙 ∗𝑊)
In this model, web servers are assumed to be leased from a hosting provider that charges a monthly
fee (𝑊!!"#$%&) covering all the hardware, connectivity and supply costs. The fee is based on the
features of the leased server and the allowed maximum traffic volume per month. This approach
simplifies the cost function significantly, since only the software acquisition (𝑊!") and update costs
(𝑊!,!") have to be calculated separately. 𝑊!" consists of both the development costs for the protocol
stack and the web application. 𝑊!,!" is calculated by defining the update interval (𝑡!,!") and the
development cost of a single update (𝑊!,!"!!"!"#$) per web server. Consequently, the cost function
of a web server is:
𝑊 = 𝑇 ∗𝑊!!"#$%& +𝑊!" + !!!,!"
∗ !!,!"!!"#$%&
!. (14)
4.3.4 Costs of a CoAP-HTTP proxy (𝑃)
A CoAP-HTTP proxy is an optional software component that allows CoAP smart objects to
communicate with HTTP web server by translating between CoAP and HTTP. The proxy can be
implemented either in the access points or in the web server. Based on the selection between these
two architectural options, the communication over long-range wireless access link uses either CoAP
or HTTP, which may have significant cost impacts, as discussed later in Section 4.4.
For the sake of simplicity, the proxy costs are calculated as additional costs on top of the normal
access point or web server costs. Most importantly, a new software component increases the software
development (𝑃!") and related software update costs (𝑃!,!"). Furthermore, the requirement for more
efficient hardware may increase the hardware acquisition (𝑃!") and related maintenance costs
(𝑃!,!!), especially in case the proxy is implemented in access points. All the other costs remain
unchanged, thus leading to the following cost function for the proxy:
𝑃 = 𝑃!" + 𝑃!" + 𝑃!,!! + 𝑃!,!" (14)
4.3.5 Other costs (𝑂)
Other costs cover the costs related to the acquisition (𝑂!") and the operation (𝑂!") of the WoT
application that cannot be naturally assigned to separate technical components. 𝑂!" include time-
consuming activities, such as searching for components and providers, asking for tenders, and testing
the system, which can partly be outsourced to consultants. 𝑂!" consist of the personnel costs related
to administering the WoT application, training the personnel, and providing support for the users of
the application. Both of these cost components are simply calculated as personnel costs by defining
the required person months (𝑃𝑀!", 𝑃𝑀!") and the average salary of an employee (𝑆𝑎𝑙!", 𝑆𝑎𝑙!"):
𝑂 = 𝑂!" + 𝑂!" = 𝑃𝑀!" ∗ 𝑆𝑎𝑙!" + 𝑃𝑀!" ∗ 𝑆𝑎𝑙!". (15)
17
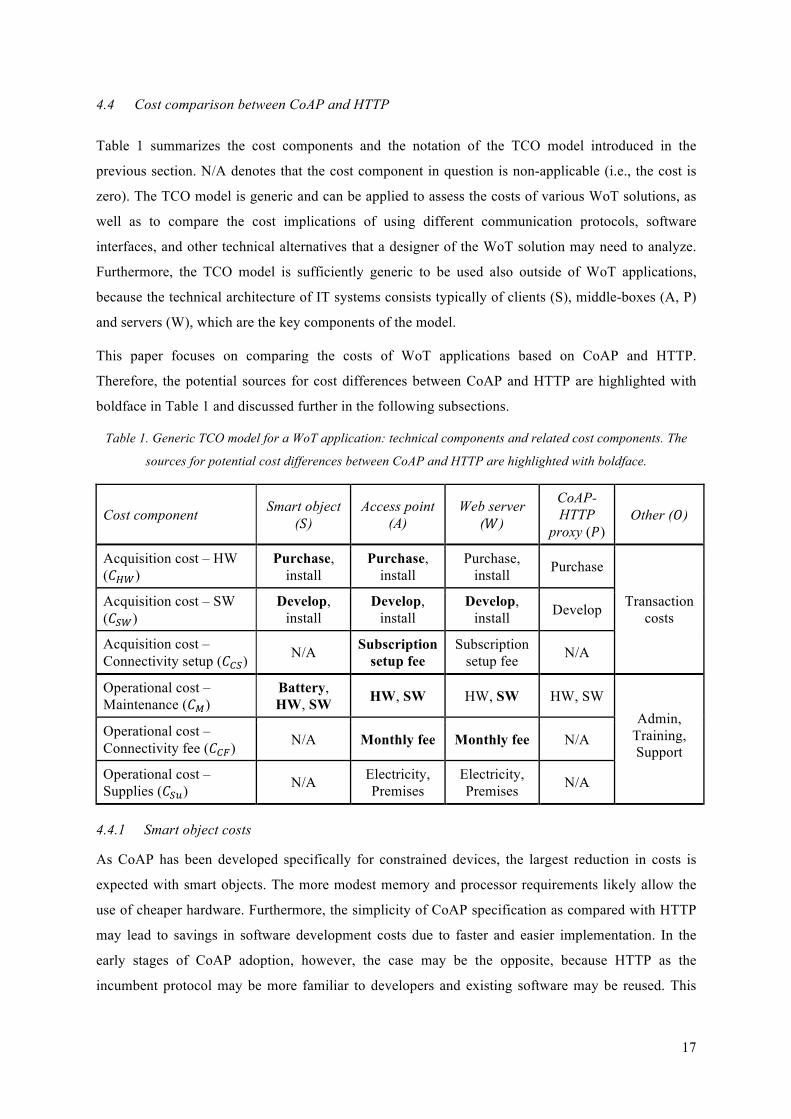
4.4 Cost comparison between CoAP and HTTP
Table 1 summarizes the cost components and the notation of the TCO model introduced in the
previous section. N/A denotes that the cost component in question is non-applicable (i.e., the cost is
zero). The TCO model is generic and can be applied to assess the costs of various WoT solutions, as
well as to compare the cost implications of using different communication protocols, software
interfaces, and other technical alternatives that a designer of the WoT solution may need to analyze.
Furthermore, the TCO model is sufficiently generic to be used also outside of WoT applications,
because the technical architecture of IT systems consists typically of clients (S), middle-boxes (A, P)
and servers (W), which are the key components of the model.
This paper focuses on comparing the costs of WoT applications based on CoAP and HTTP.
Therefore, the potential sources for cost differences between CoAP and HTTP are highlighted with
boldface in Table 1 and discussed further in the following subsections.
Table 1. Generic TCO model for a WoT application: technical components and related cost components. The
sources for potential cost differences between CoAP and HTTP are highlighted with boldface.
Cost component Smart object (𝑆)
Access point (A)
Web server (𝑊)
CoAP-HTTP
proxy (𝑃) Other (𝑂)
Acquisition cost – HW (𝐶!")
Purchase, install
Purchase, install
Purchase, install Purchase
Transaction costs
Acquisition cost – SW (𝐶!")
Develop, install
Develop, install
Develop, install Develop
Acquisition cost – Connectivity setup (𝐶!") N/A Subscription
setup fee Subscription
setup fee N/A
Operational cost –Maintenance (𝐶!)
Battery, HW, SW HW, SW HW, SW HW, SW
Admin, Training, Support
Operational cost –Connectivity fee (𝐶!") N/A Monthly fee Monthly fee N/A
Operational cost –Supplies (𝐶!") N/A Electricity,
Premises Electricity, Premises N/A
4.4.1 Smart object costs
As CoAP has been developed specifically for constrained devices, the largest reduction in costs is
expected with smart objects. The more modest memory and processor requirements likely allow the
use of cheaper hardware. Furthermore, the simplicity of CoAP specification as compared with HTTP
may lead to savings in software development costs due to faster and easier implementation. In the
early stages of CoAP adoption, however, the case may be the opposite, because HTTP as the
incumbent protocol may be more familiar to developers and existing software may be reused. This
18
difference should not be very large, though since CoAP is seen as very “HTTPish” [3]. The
differences in hardware and software acquisition costs may also affect the related maintenance costs.
Due to the smaller number of bits transferred, CoAP smart objects consume less energy than HTTP
smart objects. This difference becomes more evident in the push mode of communication where the
time when the receiver is active can be reduced significantly. As a consequence, the batteries last
longer, resulting in a smaller number of possibly costly battery replacements. Due to its potentially
significant cost impact, the difference in energy consumption and battery lifetime between HTTP and
CoAP is considered in detail in Appendix A for both pull and push modes of communication by
aggregating the available literature sources with the results of our own measurements.
4.4.2 Access point costs
Since access points only route packets between the local area and wide area networks, they do not
care about the application or transport layer protocols used by the smart objects. Therefore, the
selection between CoAP and HTTP does not affect the acquisition costs. However, the protocol stack
of smart objects might affect the number of access points needed, because every bit of traffic makes a
difference in the 802.15.4 networks that are strongly limited in channel capacity. The larger number
of packets due to TCP and larger overhead due to HTTP impede the network scalability as compared
with CoAP + UDP. Consequently, an access point may support a larger number of CoAP than HTTP
smart objects, which matters in those application scenarios where the number of smart objects in the
coverage area of an access point exceeds the number of smart objects that a single access point can
serve. The increase in the number of access points affects also the number of connectivity
subscriptions and replaceable access points.
The selection between CoAP and HTTP may create significant difference in connectivity costs in case
the long-range connectivity is based on transferred data volume, because CoAP uses up to 10 times
fewer bits in communication. Additionally, CoAP can also use SMS as a carrier [2], which may prove
to be cheaper than cellular data in some application scenarios.
4.4.3 Web server costs
Similarly to the smart objects, the development costs of the CoAP protocol stack may be higher than
those of HTTP due to the better availability of software implementations, documentation, and
knowledgeable developers for the latter. On the other hand, CoAP can provide cost savings over
HTTP in the monthly hosting fee due to the significantly smaller data volume, which may allow use
of a cheaper hosting service subscription. Furthermore, a single server may be able to support a larger
number of CoAP smart objects and concurrent UDP communication sessions, as compared with
HTTP + TCP combination.
19
5 Cost-efficiency of CoAP and HTTP in WoT applications
In order to populate the cost-comparison of CoAP and HTTP with actual numbers, a TCO calculation
and comparison model was developed on the basis of the mathematical formulation presented in
Section 4. The use of the developed model is demonstrated by analyzing an environment monitoring
application, where a large number of environmental sensors regularly transmit the measurements of
temperature, humidity, solar radiation, air quality, etc. to the web server. After introducing this
baseline scenario, a sensitivity analysis is conducted where the descriptive parameters of the
application scenario are varied in order to identify the characteristics that make a particular
application scenario more or less attractive for CoAP.
For the purposes of the cost comparison, the values for different parameters and cost components
need to be estimated. When considering the values of the cost components, the Western European and
US markets are taken as the focal market for the WoT application deployment. Other regions, e.g., the
Asia-Pacific countries, also represent a promising market for WoT applications. However, for the
practical reason of the unavailability of pricing information, they were left outside of the scope of this
paper.
Since the paper focuses on comparing the costs of CoAP and HTTP, the attention in the quantitative
analysis is devoted to defining the values for those cost components that are affected by the
application layer protocol. However, the costs that do not differ between CoAP and HTTP are also
included in the TCO model in order to estimate the relative significance of the cost differences. When
defining the values for these cost components, relatively high, though realistic values are chosen, so
that the relative cost difference between CoAP and HTTP would not be over-estimated.
5.1 Baseline scenario
This scenario considers a deployment of autonomous stations for environment monitoring – such as
Adcon Dust Monitoring Stations10 – that regularly transmit the measurements of temperature,
humidity, solar radiation, wind and precipitation, and air quality to the web server. Contemporary
stations are working autonomously, owing to internal batteries. The companies specializing in
environmental sensing may need to operate hundreds or thousands of stations that are spread across a
wide area. Due to this, also the number of sites is high. To limit the number of access points needed,
the smart objects use 2.4 GHz radio with range up to 1 km to connect with access points. The
communication model is push, meaning that the smart objects occasionally wake up from sleep to
conduct measurements and communicate the results, before going to sleep again. In the base setup,
this happens once per minute. Being deployed in a remote place, the access point is assumed to rely
10 See http://www.adcon.at/index.php?option=com_content&view=article&id=10&Itemid=9&lang=en.
20
on cellular network to provide connectivity. The flat-rate pricing scheme is assumed in the baseline
scenario, since the resulting communication costs are likely to be an order of magnitude lower than
the costs accrued by using a typical volume-based pricing. However, the impact of volume-based
pricing schemes is also analyzed.
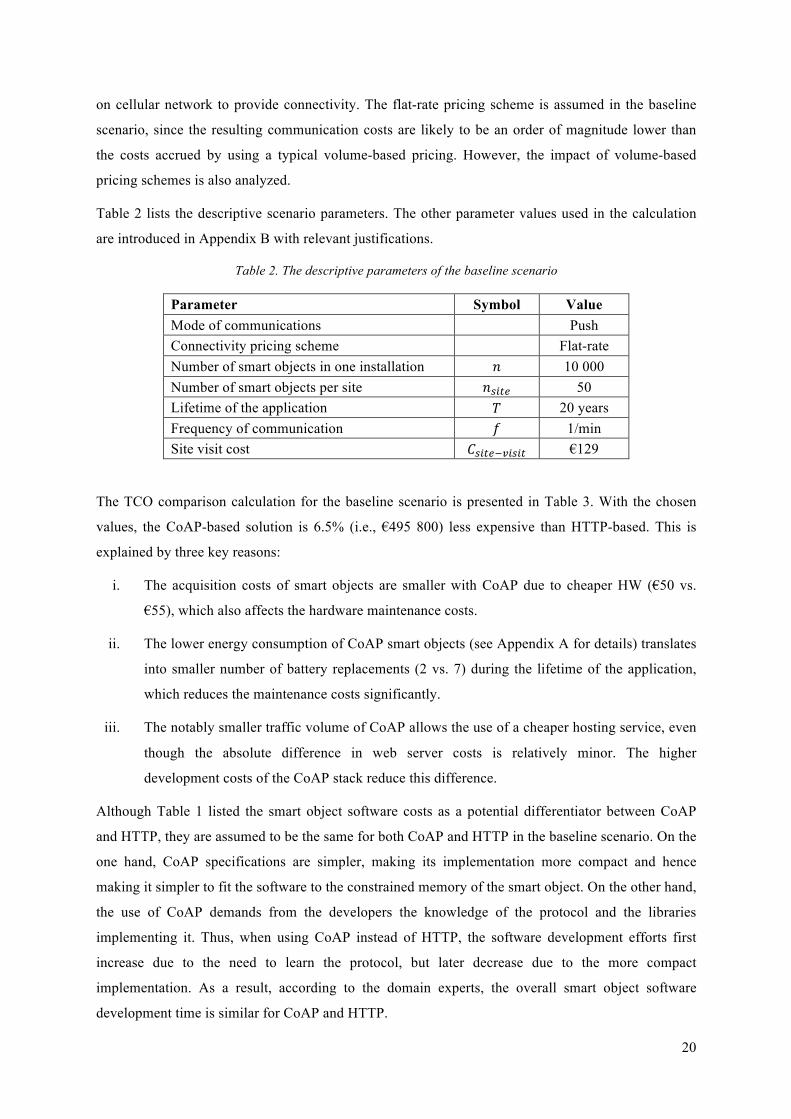
Table 2 lists the descriptive scenario parameters. The other parameter values used in the calculation
are introduced in Appendix B with relevant justifications.
Table 2. The descriptive parameters of the baseline scenario
Parameter Symbol Value Mode of communications Push Connectivity pricing scheme Flat-rate Number of smart objects in one installation 𝑛 10 000 Number of smart objects per site 𝑛!"#$ 50 Lifetime of the application 𝑇 20 years Frequency of communication 𝑓 1/min Site visit cost 𝐶!"#$!!"#"$ €129
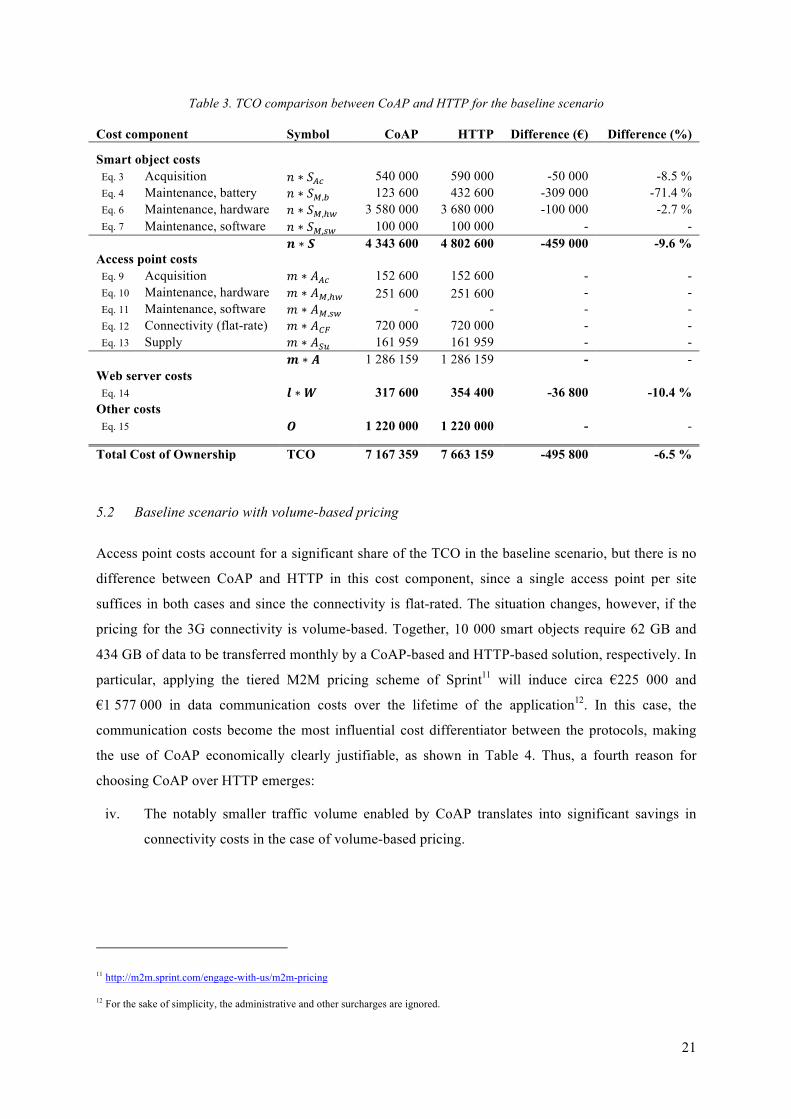
The TCO comparison calculation for the baseline scenario is presented in Table 3. With the chosen
values, the CoAP-based solution is 6.5% (i.e., €495 800) less expensive than HTTP-based. This is
explained by three key reasons:
i. The acquisition costs of smart objects are smaller with CoAP due to cheaper HW (€50 vs.
€55), which also affects the hardware maintenance costs.
ii. The lower energy consumption of CoAP smart objects (see Appendix A for details) translates
into smaller number of battery replacements (2 vs. 7) during the lifetime of the application,
which reduces the maintenance costs significantly.
iii. The notably smaller traffic volume of CoAP allows the use of a cheaper hosting service, even
though the absolute difference in web server costs is relatively minor. The higher
development costs of the CoAP stack reduce this difference.
Although Table 1 listed the smart object software costs as a potential differentiator between CoAP
and HTTP, they are assumed to be the same for both CoAP and HTTP in the baseline scenario. On the
one hand, CoAP specifications are simpler, making its implementation more compact and hence
making it simpler to fit the software to the constrained memory of the smart object. On the other hand,
the use of CoAP demands from the developers the knowledge of the protocol and the libraries
implementing it. Thus, when using CoAP instead of HTTP, the software development efforts first
increase due to the need to learn the protocol, but later decrease due to the more compact
implementation. As a result, according to the domain experts, the overall smart object software
development time is similar for CoAP and HTTP.
21
Table 3. TCO comparison between CoAP and HTTP for the baseline scenario
Cost component Symbol CoAP HTTP Difference (€) Difference (%) Smart object costs Eq. 3 Acquisition 𝑛 ∗ 𝑆!" 540 000 590 000 -50 000 -8.5 % Eq. 4 Maintenance, battery 𝑛 ∗ 𝑆!,! 123 600 432 600 -309 000 -71.4 % Eq. 6 Maintenance, hardware 𝑛 ∗ 𝑆!,!! 3 580 000 3 680 000 -100 000 -2.7 % Eq. 7 Maintenance, software 𝑛 ∗ 𝑆!,!" 100 000 100 000 - - 𝒏 ∗ 𝑺 4 343 600 4 802 600 -459 000 -9.6 % Access point costs Eq. 9 Acquisition 𝑚 ∗ 𝐴!" 152 600 152 600 - - Eq. 10 Maintenance, hardware 𝑚 ∗ 𝐴!,!! 251 600 251 600 - - Eq. 11 Maintenance, software 𝑚 ∗ 𝐴!,!" - - - - Eq. 12 Connectivity (flat-rate) 𝑚 ∗ 𝐴!" 720 000 720 000 - - Eq. 13 Supply 𝑚 ∗ 𝐴!" 161 959 161 959 - - 𝒎 ∗ 𝑨 1 286 159 1 286 159 - - Web server costs Eq. 14 𝒍 ∗𝑾 317 600 354 400 -36 800 -10.4 % Other costs Eq. 15 𝑶 1 220 000 1 220 000 - - Total Cost of Ownership TCO 7 167 359 7 663 159 -495 800 -6.5 %
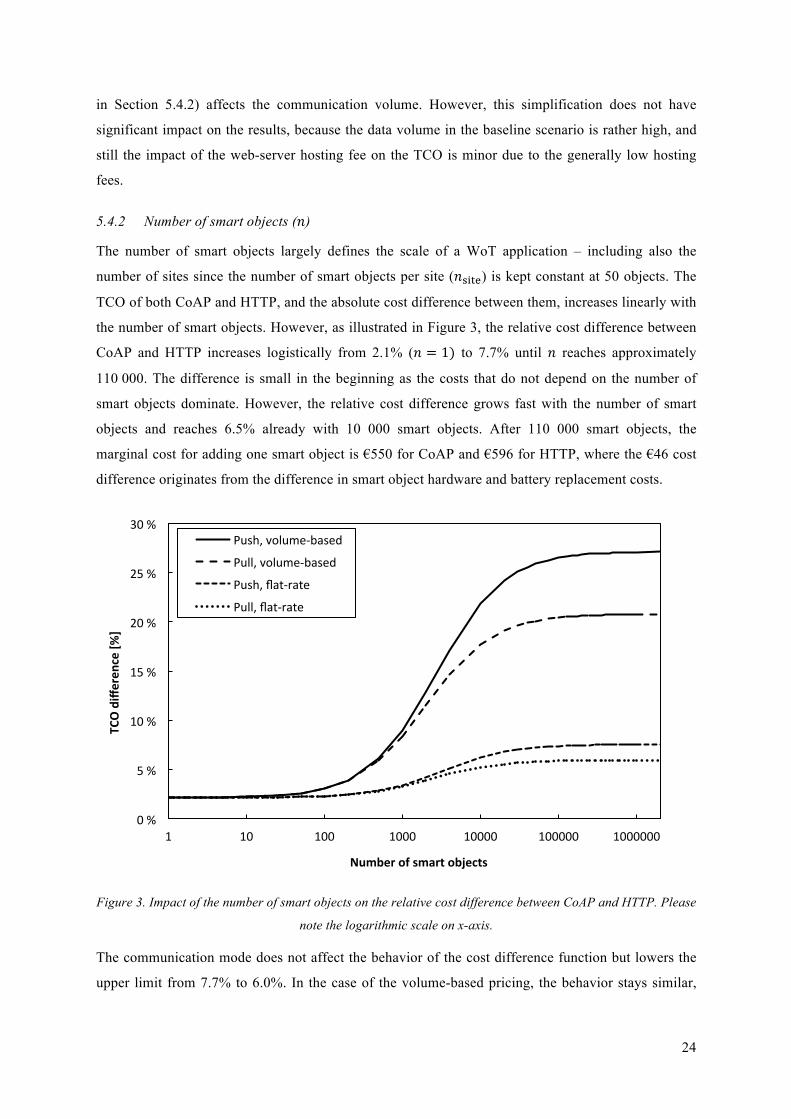
5.2 Baseline scenario with volume-based pricing
Access point costs account for a significant share of the TCO in the baseline scenario, but there is no
difference between CoAP and HTTP in this cost component, since a single access point per site
suffices in both cases and since the connectivity is flat-rated. The situation changes, however, if the
pricing for the 3G connectivity is volume-based. Together, 10 000 smart objects require 62 GB and
434 GB of data to be transferred monthly by a CoAP-based and HTTP-based solution, respectively. In
particular, applying the tiered M2M pricing scheme of Sprint11 will induce circa €225 000 and
€1 577 000 in data communication costs over the lifetime of the application12. In this case, the
communication costs become the most influential cost differentiator between the protocols, making
the use of CoAP economically clearly justifiable, as shown in Table 4. Thus, a fourth reason for
choosing CoAP over HTTP emerges:
iv. The notably smaller traffic volume enabled by CoAP translates into significant savings in
connectivity costs in the case of volume-based pricing.
11 http://m2m.sprint.com/engage-with-us/m2m-pricing
12 For the sake of simplicity, the administrative and other surcharges are ignored.
22
Table 4. Comparison of the flat-rate and volume-based pricing schemes in the baseline scenario
CoAP HTTP Difference (€) Difference (%) Connectivity costs Flat-rate 720 000 720 000 - 0,0 % Volume-based, tiered pricing of Sprint 225 271 1 576 898 -1 351 626 - 85.7 % Total Cost of Ownership Flat-rate 7 167 359 7 663 159 -495 800 -6.5 % Volume-based, tiered pricing of Sprint 6 672 630 8 520 057 -1 847 426 -21.7 %
5.3 The cost impact of CoAP-HTTP proxy
A CoAP-proxy implementation introduces an alternative approach to end-to-end CoAP for realizing
the web server side of the CoAP application. As explained in Section 4.3.4, the smart object side
remains unchanged and the cost difference between CoAP and CoAP-proxy cases depends solely on
the cost ratio between the CoAP server implementation (€20 000) and the combination of HTTP
server (€0) and proxy module implementation (€5000). Even though the proxy implementation should
be favored on the basis of this calculation, the cost difference is minor as compared with the
difference in the TCO. From the cost perspective, the implementation location of the proxy has a
larger cost impact than the implementation itself has. In case the connectivity pricing is volume-
based, the proxy should namely be implemented in the web server in order to benefit from the cost
savings described in Section 5.2. Finally, the end-to-end implementation may provide performance
benefits over the proxy implementation that are not taken into account in the calculation. As a
consequence, the decision between CoAP and CoAP-proxy implementation is likely to be based on
architectural requirements related to, e.g., security, performance or caching, rather than on cost-
efficiency.
5.4 Sensitivity analysis
Typically, a sensitivity analysis is conducted to control the uncertainties related to the estimated
parameter values, with the objective to study how sensitive the results are to the changes in the
estimated values. In this paper, however, the focus is not on the TCO itself, but on the absolute and
relative cost difference between CoAP and HTTP. Therefore, it is more interesting to identify the
characteristics of the more and less attractive application scenarios. In order to accomplish that, the
descriptive parameters of the baseline scenario listed in Table 2 are varied to analyze how the
difference in TCO between the CoAP- and HTTP-based solutions behaves. Generally, CoAP becomes
more attractive when the relative difference (%) increases. The relative difference is calculated by
dividing the absolute difference (€) in the TCO by the TCO of HTTP. It shall be remembered that, if
the TCO is high, even a small relative difference translates into substantial absolute difference. As a
23
consequence, both the absolute and relative cost differences need to be understood for the purpose of
evaluating the attractiveness of CoAP in different application scenarios.
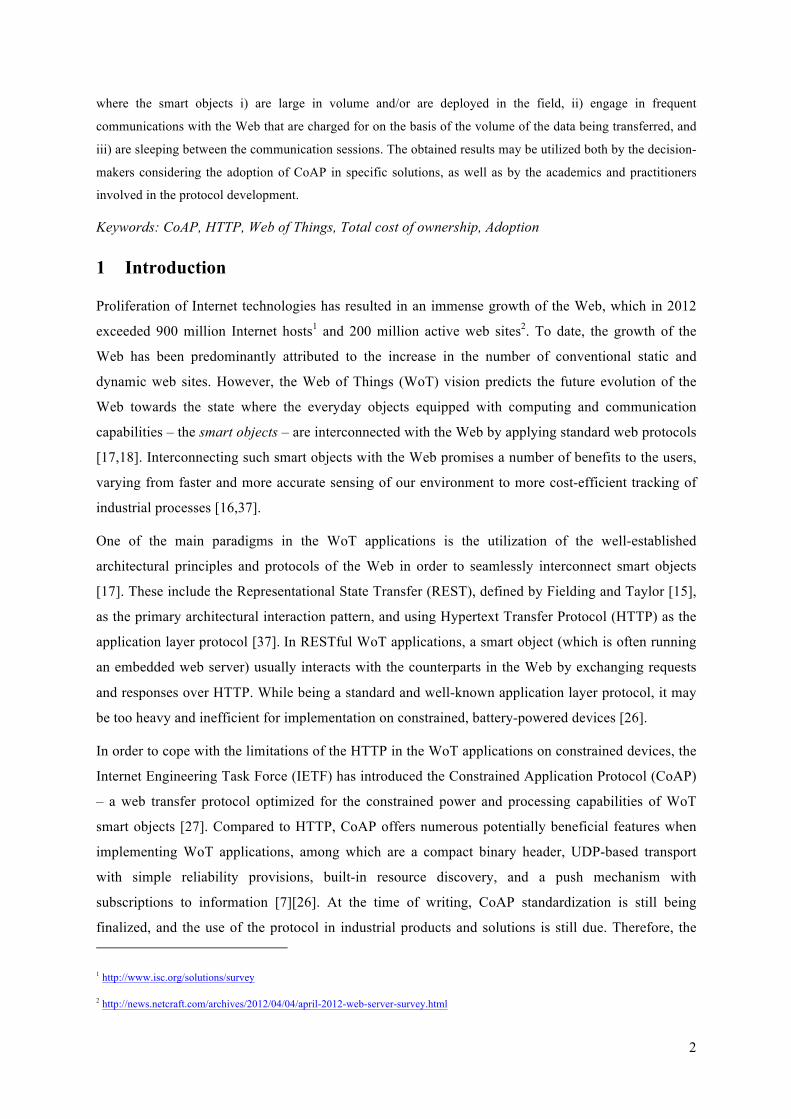
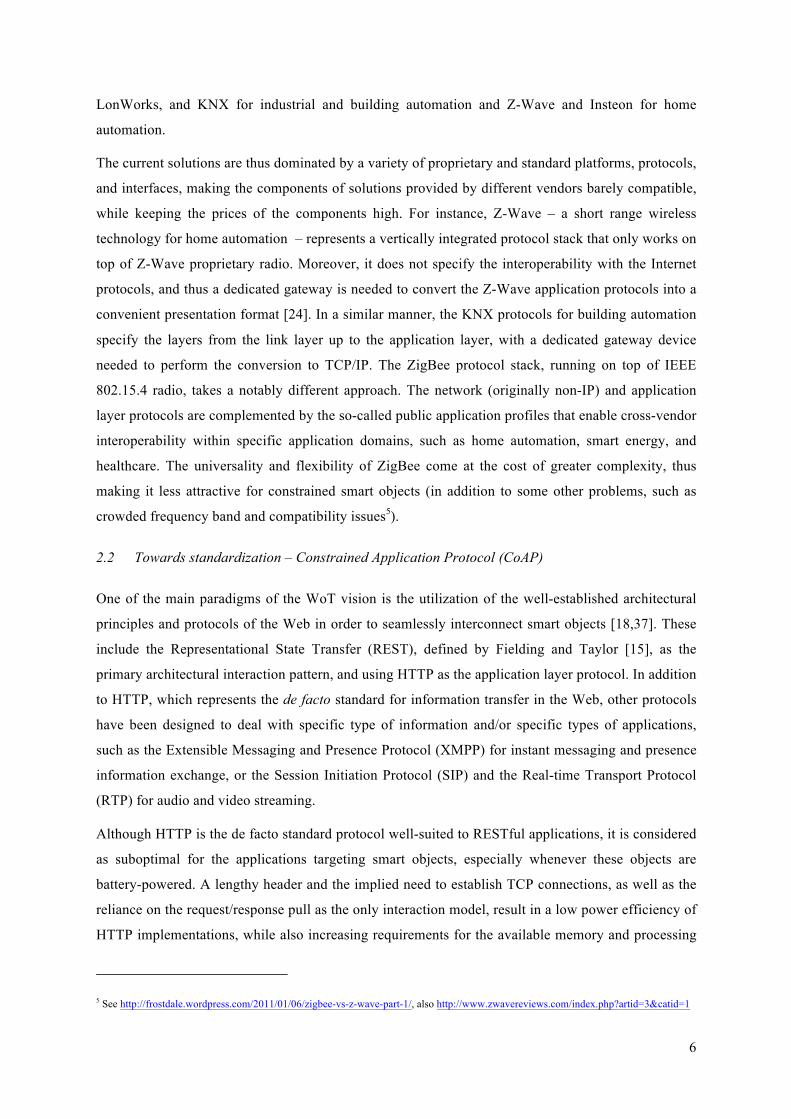
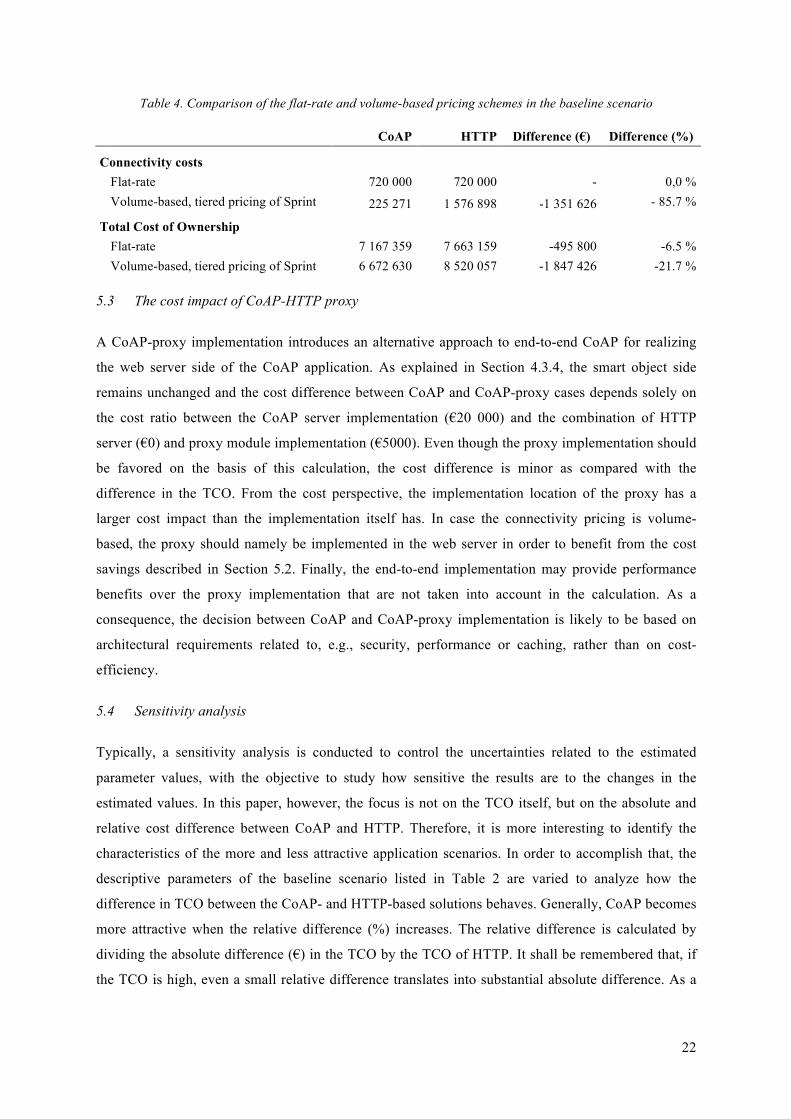
5.4.1 Frequency of communications (𝑓)
In the case of flat-rate connectivity pricing, the communication frequency affects only the energy
consumption of smart objects. With the push mode of communication, the battery lifetime is defined
by self-discharge for both CoAP and HTTP, when the communication frequency is smaller than 25/h.
With values larger than 25/h, the battery replacement costs of CoAP and HTTP start to diverge step-
wise due to additional battery replacements required by HTTP smart objects. The battery replacement
costs of CoAP smart objects remain unchanged until the communication frequency reaches 144/h. As
a result, also the relative cost difference increases, as shown in Figure 2. A similar pattern is visible
with the pull mode of communication, because the difference in the number of battery replacements
between CoAP and HTTP evolves similarly in both the push and pull modes.
In the case of volume-based connectivity pricing, the increasing communication frequency increases
the absolute and relative cost difference between CoAP and HTTP. The step-wise pattern of battery
replacements is still visible, but the volume-based pricing makes CoAP significantly more attractive.
Figure 2. Impact of communication frequency on the relative cost difference between CoAP and HTTP
It should be noted that, for the sake of simplicity, the hosting fee of web servers (𝑊!!"#$%&) is not
modeled as a function of the communication volume. As a consequence, the web server costs remain
unchanged even though the changing frequency (and the changing number of smart objects analyzed
0 %
5 %
10 %
15 %
20 %
25 %
30 %
35 %
40 %
45 %
0 20 40 60 80 100 120 140 160
TCO differen
ce [%
]
Frequency of communica7ons [1/hour]
Push, volume-‐based
Pull, volume-‐based
Push, flat-‐rate
Pull, flat-‐rate
24
in Section 5.4.2) affects the communication volume. However, this simplification does not have
significant impact on the results, because the data volume in the baseline scenario is rather high, and
still the impact of the web-server hosting fee on the TCO is minor due to the generally low hosting
fees.
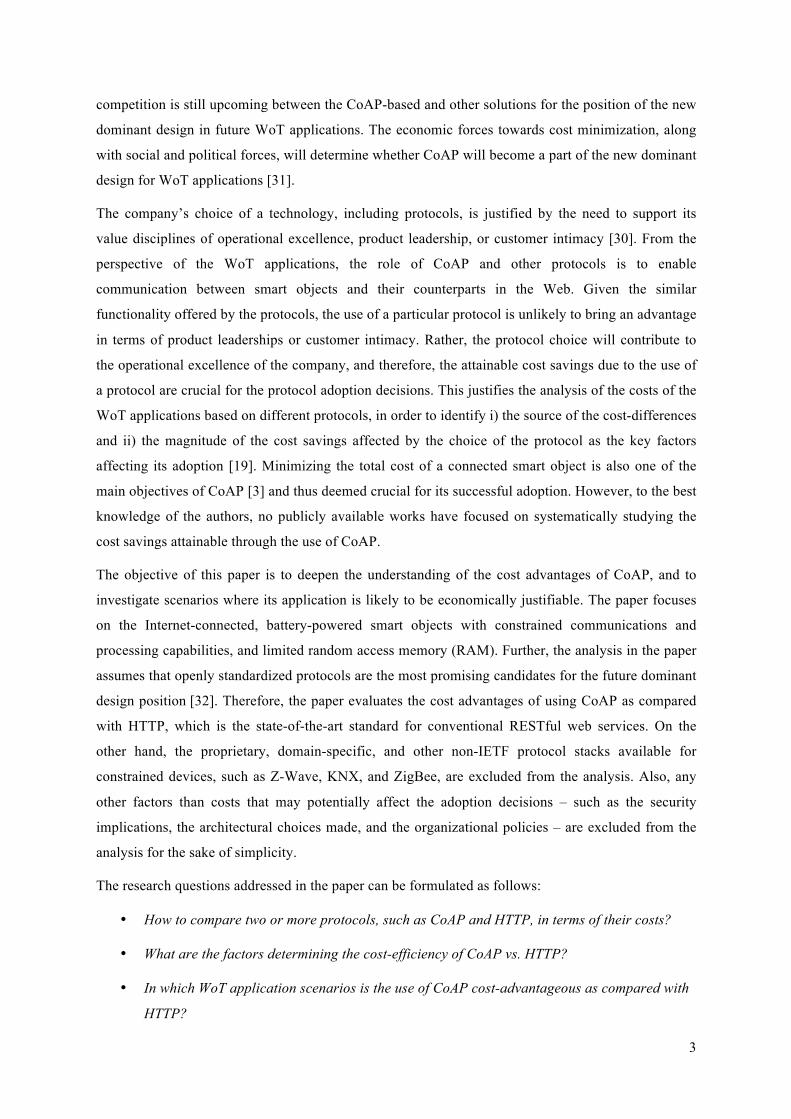
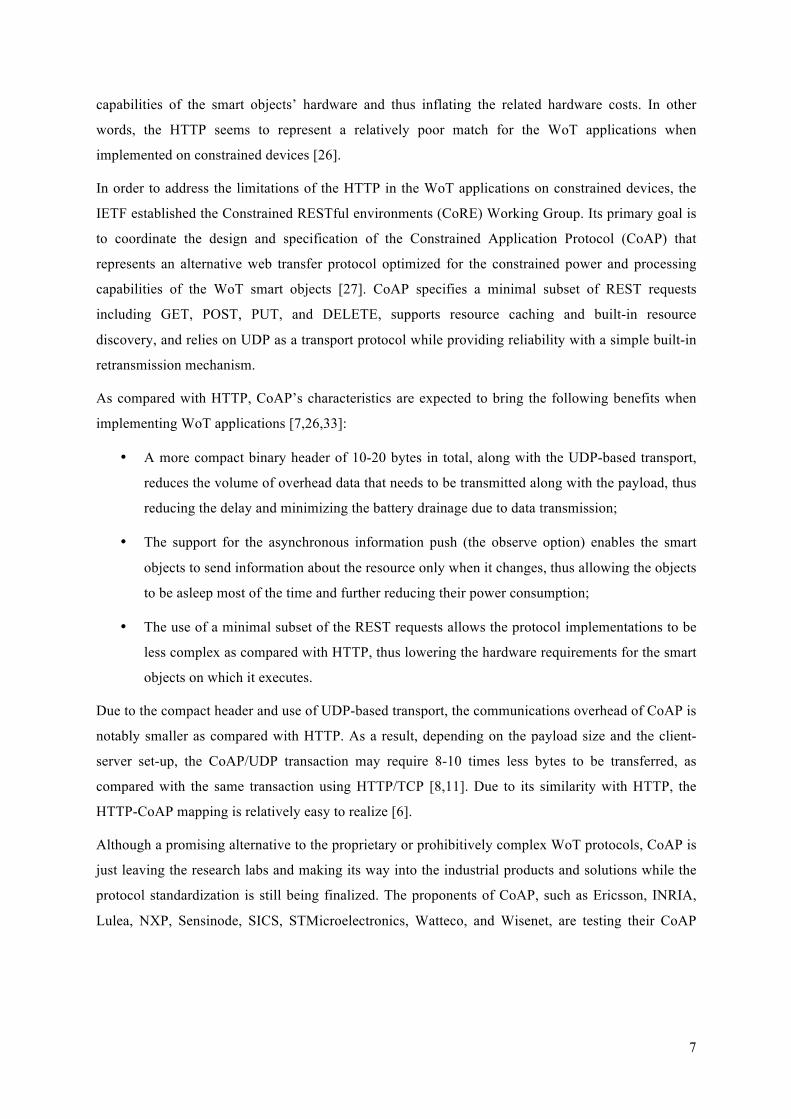
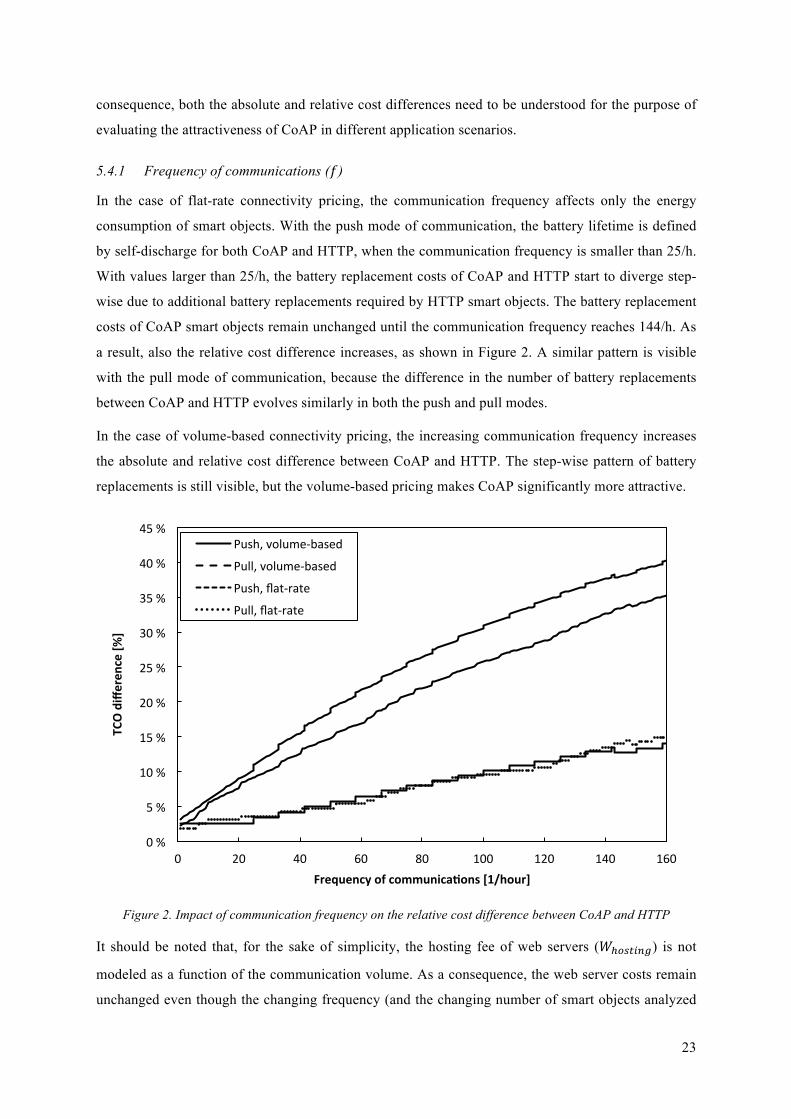
5.4.2 Number of smart objects (𝑛)
The number of smart objects largely defines the scale of a WoT application – including also the
number of sites since the number of smart objects per site (𝑛!"#$) is kept constant at 50 objects. The
TCO of both CoAP and HTTP, and the absolute cost difference between them, increases linearly with
the number of smart objects. However, as illustrated in Figure 3, the relative cost difference between
CoAP and HTTP increases logistically from 2.1% (𝑛 = 1) to 7.7% until 𝑛 reaches approximately
110 000. The difference is small in the beginning as the costs that do not depend on the number of
smart objects dominate. However, the relative cost difference grows fast with the number of smart
objects and reaches 6.5% already with 10 000 smart objects. After 110 000 smart objects, the
marginal cost for adding one smart object is €550 for CoAP and €596 for HTTP, where the €46 cost
difference originates from the difference in smart object hardware and battery replacement costs.
Figure 3. Impact of the number of smart objects on the relative cost difference between CoAP and HTTP. Please
note the logarithmic scale on x-axis.
The communication mode does not affect the behavior of the cost difference function but lowers the
upper limit from 7.7% to 6.0%. In the case of the volume-based pricing, the behavior stays similar,
0 %
5 %
10 %
15 %
20 %
25 %
30 %
1 10 100 1000 10000 100000 1000000
TCO differen
ce [%
]
Number of smart objects
Push, volume-‐based
Pull, volume-‐based
Push, flat-‐rate
Pull, flat-‐rate
25
but the upper limit increases significantly (to 26.6% in push mode, and to 19.5% in pull mode) since
the increasing number of smart objects affects the transferred data volume directly.
It should be noted that, in the TCO model used, the scale of the application does not automatically
affect the level of other costs (𝑂), even though a dependency may exist between them. This limitation,
however, concerns only the cases with a very small number of smart objects, where the potentially
high other costs mask the relative cost difference between CoAP and HTTP. On the other hand, the
other costs may be underestimated with a high number of smart objects; however, even after an order
of magnitude increase they remain negligible as compared with the TCO.
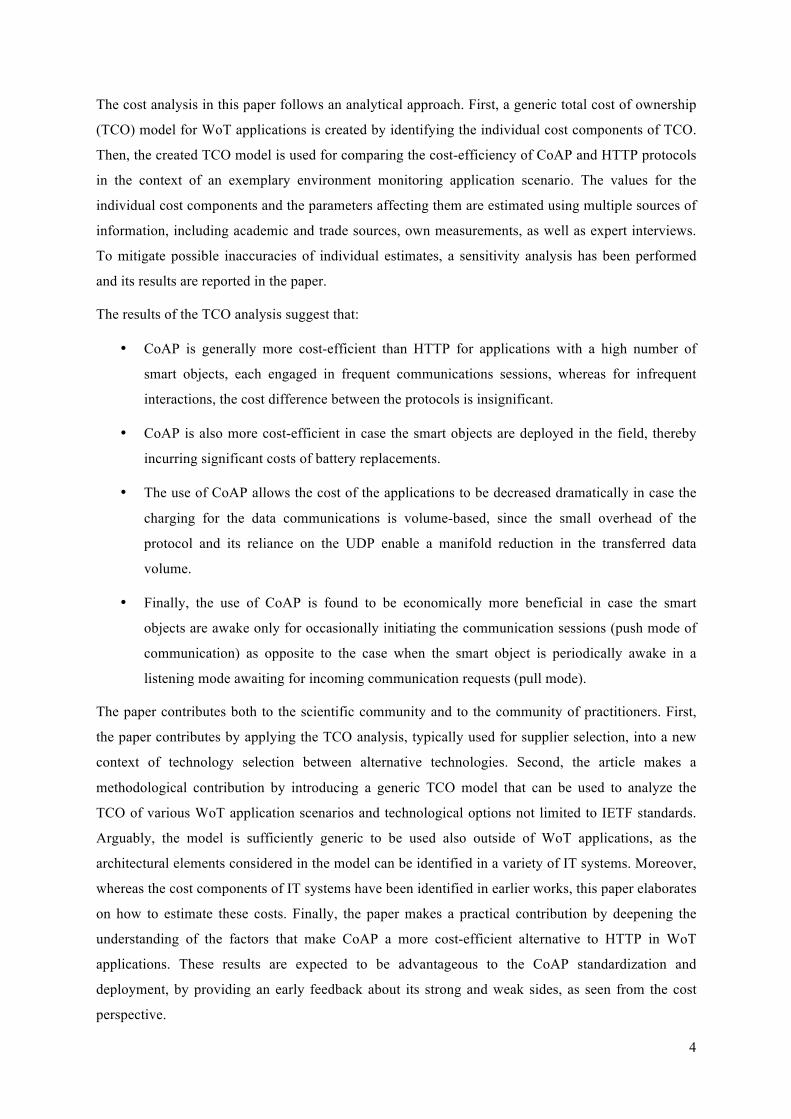
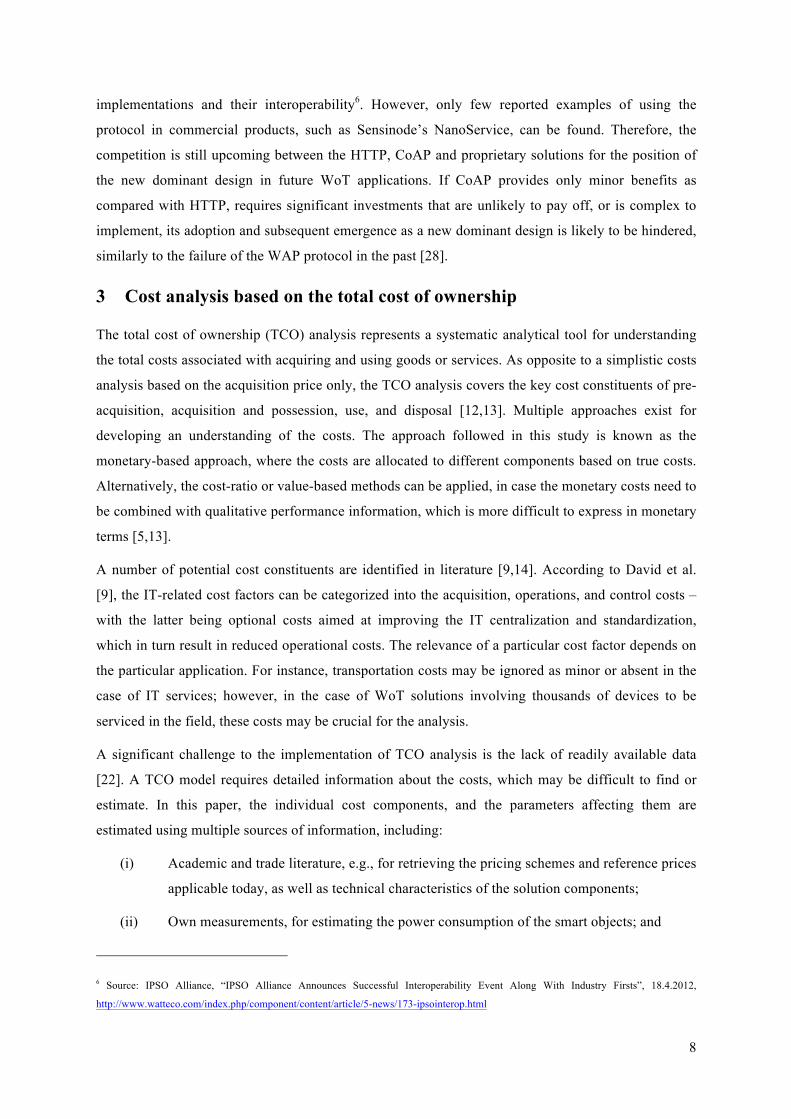
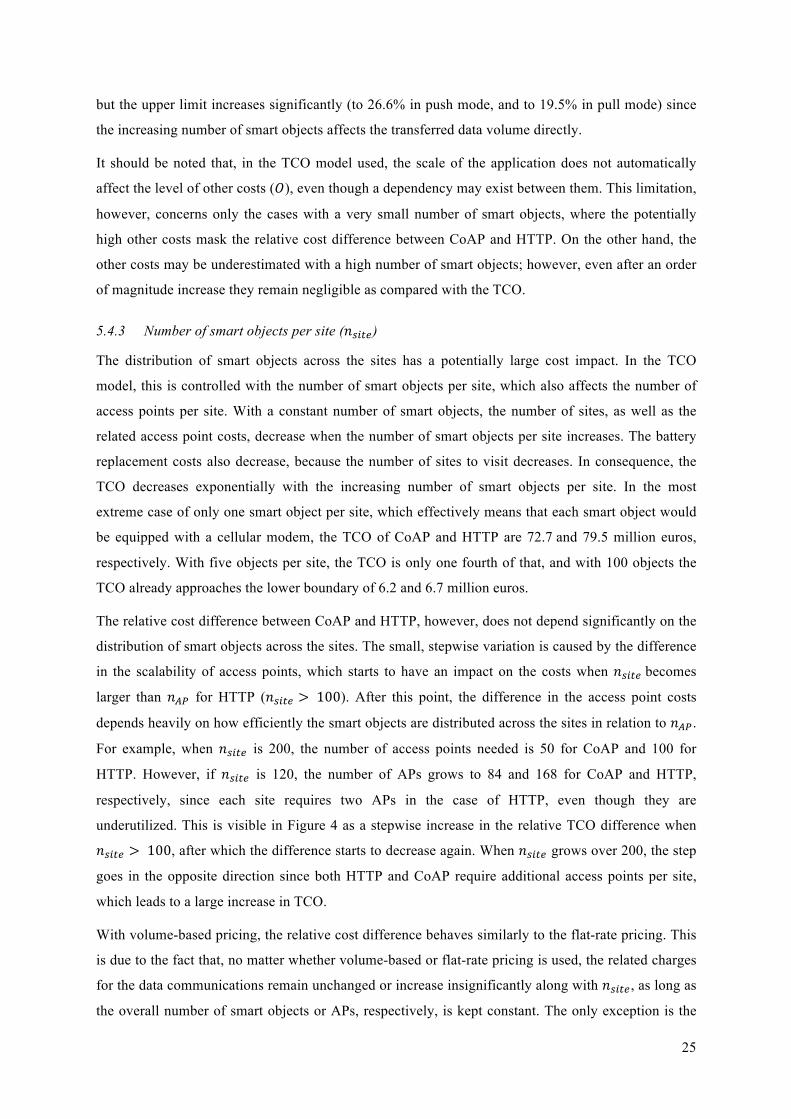
5.4.3 Number of smart objects per site (𝑛!"#$)
The distribution of smart objects across the sites has a potentially large cost impact. In the TCO
model, this is controlled with the number of smart objects per site, which also affects the number of
access points per site. With a constant number of smart objects, the number of sites, as well as the
related access point costs, decrease when the number of smart objects per site increases. The battery
replacement costs also decrease, because the number of sites to visit decreases. In consequence, the
TCO decreases exponentially with the increasing number of smart objects per site. In the most
extreme case of only one smart object per site, which effectively means that each smart object would
be equipped with a cellular modem, the TCO of CoAP and HTTP are 72.7 and 79.5 million euros,
respectively. With five objects per site, the TCO is only one fourth of that, and with 100 objects the
TCO already approaches the lower boundary of 6.2 and 6.7 million euros.
The relative cost difference between CoAP and HTTP, however, does not depend significantly on the
distribution of smart objects across the sites. The small, stepwise variation is caused by the difference
in the scalability of access points, which starts to have an impact on the costs when 𝑛!"#$ becomes
larger than 𝑛!" for HTTP (𝑛!"#$ > 100). After this point, the difference in the access point costs
depends heavily on how efficiently the smart objects are distributed across the sites in relation to 𝑛!".
For example, when 𝑛!"#$ is 200, the number of access points needed is 50 for CoAP and 100 for
HTTP. However, if 𝑛!"#$ is 120, the number of APs grows to 84 and 168 for CoAP and HTTP,
respectively, since each site requires two APs in the case of HTTP, even though they are
underutilized. This is visible in Figure 4 as a stepwise increase in the relative TCO difference when
𝑛!"#$ > 100, after which the difference starts to decrease again. When 𝑛!"#$ grows over 200, the step
goes in the opposite direction since both HTTP and CoAP require additional access points per site,
which leads to a large increase in TCO.
With volume-based pricing, the relative cost difference behaves similarly to the flat-rate pricing. This
is due to the fact that, no matter whether volume-based or flat-rate pricing is used, the related charges
for the data communications remain unchanged or increase insignificantly along with 𝑛!"#$, as long as
the overall number of smart objects or APs, respectively, is kept constant. The only exception is the
26
growth of the relative difference for 𝑛!"#$ < 100. This can be attributed to the rapidly increasing
contribution of CoAP to the reduction in the communication costs in the case of volume-based
pricing, which is especially notable when the number of sites grows.
Figure 4. Impact of the distribution of smart objects across the sites on the relative cost difference between
CoAP and HTTP
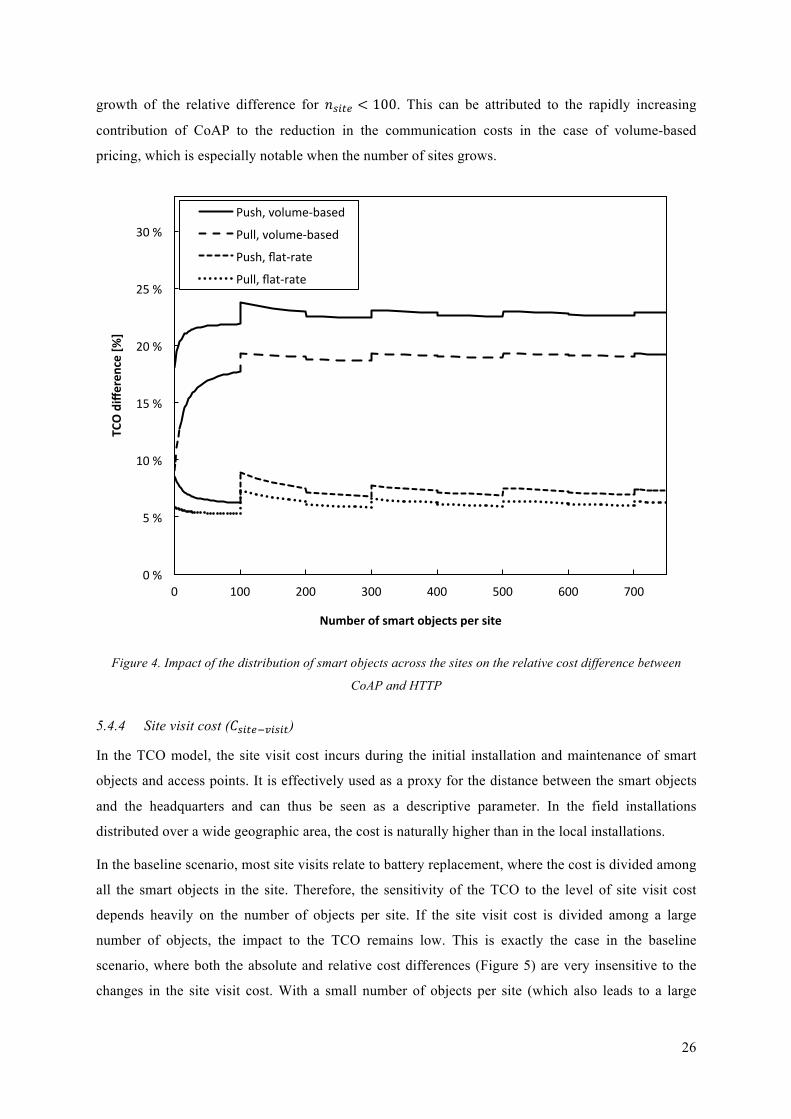
5.4.4 Site visit cost (𝐶!"#$!!"#"$)
In the TCO model, the site visit cost incurs during the initial installation and maintenance of smart
objects and access points. It is effectively used as a proxy for the distance between the smart objects
and the headquarters and can thus be seen as a descriptive parameter. In the field installations
distributed over a wide geographic area, the cost is naturally higher than in the local installations.
In the baseline scenario, most site visits relate to battery replacement, where the cost is divided among
all the smart objects in the site. Therefore, the sensitivity of the TCO to the level of site visit cost
depends heavily on the number of objects per site. If the site visit cost is divided among a large
number of objects, the impact to the TCO remains low. This is exactly the case in the baseline
scenario, where both the absolute and relative cost differences (Figure 5) are very insensitive to the
changes in the site visit cost. With a small number of objects per site (which also leads to a large
0 %
5 %
10 %
15 %
20 %
25 %
30 %
0 100 200 300 400 500 600 700
TCO differen
ce [%
]
Number of smart objects per site
Push, volume-‐based
Pull, volume-‐based
Push, flat-‐rate
Pull, flat-‐rate
27
number of sites), the increase in site visit cost significantly increases the relative cost difference
between CoAP and HTTP. With a higher number of smart objects per site, the impact is the opposite.
Figure 5. Impact of the site visit cost on the relative cost difference between CoAP and HTTP with differing
number of smart objects per site
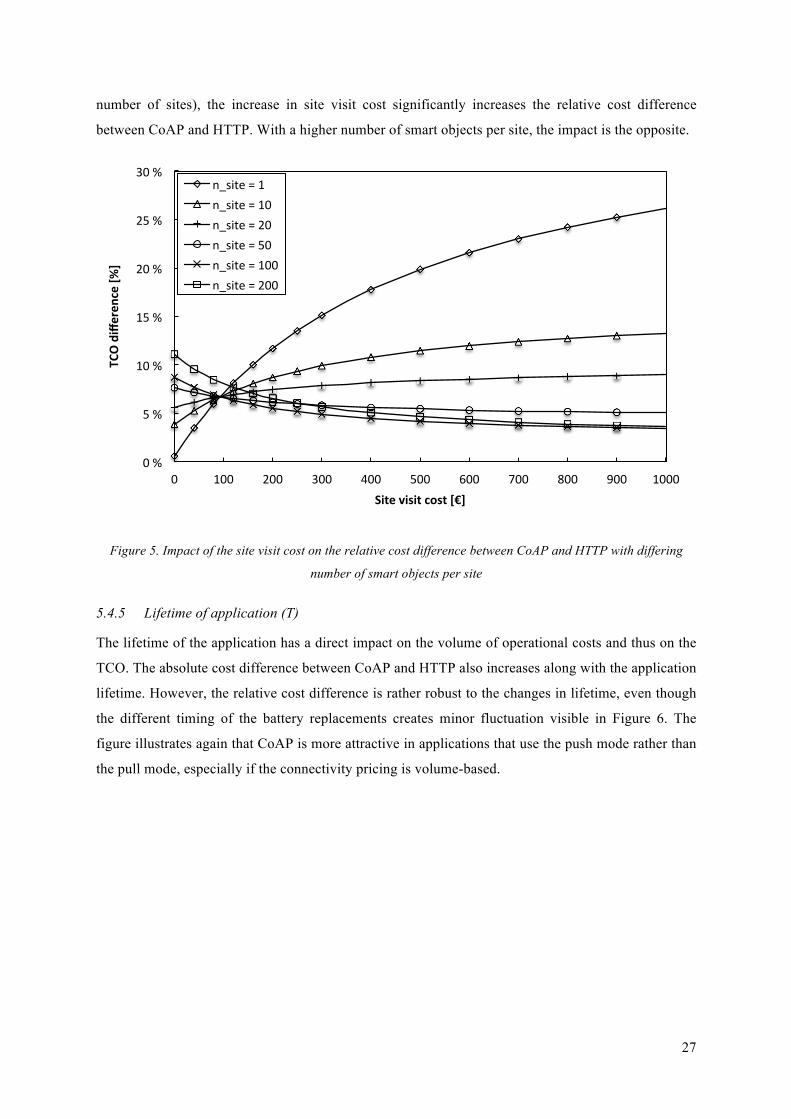
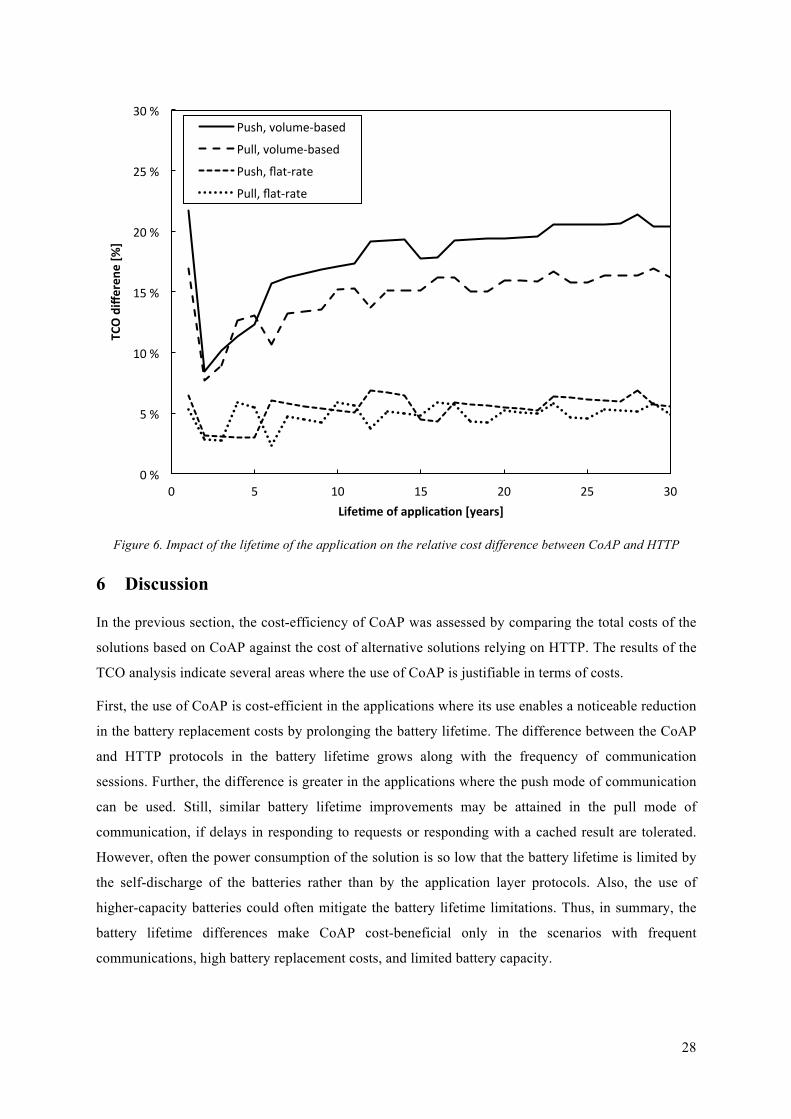
5.4.5 Lifetime of application (T)
The lifetime of the application has a direct impact on the volume of operational costs and thus on the
TCO. The absolute cost difference between CoAP and HTTP also increases along with the application
lifetime. However, the relative cost difference is rather robust to the changes in lifetime, even though
the different timing of the battery replacements creates minor fluctuation visible in Figure 6. The
figure illustrates again that CoAP is more attractive in applications that use the push mode rather than
the pull mode, especially if the connectivity pricing is volume-based.
0 %
5 %
10 %
15 %
20 %
25 %
30 %
0 100 200 300 400 500 600 700 800 900 1000
TCO differen
ce [%
]
Site visit cost [€]
n_site = 1 n_site = 10 n_site = 20 n_site = 50 n_site = 100 n_site = 200
28
Figure 6. Impact of the lifetime of the application on the relative cost difference between CoAP and HTTP
6 Discussion
In the previous section, the cost-efficiency of CoAP was assessed by comparing the total costs of the
solutions based on CoAP against the cost of alternative solutions relying on HTTP. The results of the
TCO analysis indicate several areas where the use of CoAP is justifiable in terms of costs.
First, the use of CoAP is cost-efficient in the applications where its use enables a noticeable reduction
in the battery replacement costs by prolonging the battery lifetime. The difference between the CoAP
and HTTP protocols in the battery lifetime grows along with the frequency of communication
sessions. Further, the difference is greater in the applications where the push mode of communication
can be used. Still, similar battery lifetime improvements may be attained in the pull mode of
communication, if delays in responding to requests or responding with a cached result are tolerated.
However, often the power consumption of the solution is so low that the battery lifetime is limited by
the self-discharge of the batteries rather than by the application layer protocols. Also, the use of
higher-capacity batteries could often mitigate the battery lifetime limitations. Thus, in summary, the
battery lifetime differences make CoAP cost-beneficial only in the scenarios with frequent
communications, high battery replacement costs, and limited battery capacity.
0 %
5 %
10 %
15 %
20 %
25 %
30 %
0 5 10 15 20 25 30
TCO differen
e [%
]
Life7me of applica7on [years]
Push, volume-‐based
Pull, volume-‐based
Push, flat-‐rate
Pull, flat-‐rate
29
Second, the use of CoAP is beneficial cost-wise when the number of smart objects is high, since
simpler and less expensive (class 1) smart objects are sufficient for the CoAP implementations, as
compared with the more powerful and more expensive (class 2) smart objects needed in the HTTP
solutions. While the cost difference of a single object is small in absolute value, the difference in the
total cost of a solution grows quickly along with the number of the smart objects used.
Third, the use of CoAP allows the cost of the applications to be decreased dramatically in case the
charging for the data communications is volume-based, since the small overhead of the protocol and
its reliance on the UDP enable a manifold reduction in the transferred data volume. This impact is
particularly significant when both the communication frequency and the number of smart objects are
high.
Finally, CoAP is expected to bring cost advantages in the scenarios where the number of smart objects
per site is high. This can be attributed to the fact that CoAP relies on UDP as a transport layer
protocol whereas TCP is commonly used with HTTP. UDP transmissions incur lighter load on the
constrained 802.15.4 network as compared with the use of TCP, so a single access point can handle a
larger number of CoAP than HTTP smart objects. As a result, in the application scenarios with a high
number of objects per site and the need for simultaneous communications with them (more likely in
the pull mode of communication), the use of CoAP will allow for the number of access points to be
reduced, resulting in smaller access point costs.
This paper has some limitations that need to be taken into account when interpreting the obtained
results. First, the analysis is limited to comparing only CoAP with HTTP. In future work, proprietary
solutions currently dominating the market could also be included in the comparison. Arguably, in
certain solutions involving highly constrained smart objects, the IETF protocol stack, including IPv6,
UDP, and CoAP, can be seen as too heavy as compared with the proprietary protocols. Second, the
estimates for some of the cost values provided by the experts rely on their knowledge and experience,
and may not be fully accurate. Likewise, the measurements of the protocol energy footprint were
made for a single hardware platform and using a small payload in the transmitted messages.
Therefore, the results should be cautiously generalized to the other constrained platforms and message
sizes. To mitigate the problem of possible inaccuracies in individual estimates, a sensitivity analysis
was conducted. In the future work, it shall be complemented with further field measurements or
expert estimates.
Although the paper has studied the costs of using CoAP vs. HTTP as a factor affecting the adoption of
CoAP, other factors may influence adoption decisions as well. From the technical perspective, HTTP
cannot be used in all application scenarios, because it lacks some functionality (e.g., the subscription
mechanism) provided by CoAP. On the other hand, CoAP has yet to see the attempts at breaking its
security provisions, which may make the security cautious vendors to delay their adoption decisions
30
until they see that the protocol security is mature enough. CoAP may also require some changes in the
vendor or communication service provider infrastructure, such as allowing the UDP traffic, and some
of the companies may be reluctant to do that.
From the economic perspective, a large installed base resulting in higher network effects may cause
inertia in the adoption of an emerging protocol that is technically superior. HTTP is currently well
established in the market, and thus has better availability of tools, platforms and knowledgeable
experts. In this analysis, the network effects have been taken into account by considering the cost of a
proxy and the cost of developing software for CoAP-based solutions. Finally, some of the vendors
may be satisfied with their proprietary systems giving them more control over the ecosystem than
open standards would give. These and other factors shall be taken into account when analyzing the
overall potential of CoAP.
7 Conclusion
CoAP has been recently introduced by the IETF Core working group as a simpler alternative to HTTP
for enabling Web applications to interact with constrained smart objects. The expected adoption of the
protocol depends, among other factors, on its cost advantage as compared with HTTP and other
alternatives. In this paper, the cost-efficiency of CoAP has been studied by introducing a total cost of
ownership (TCO) model for WoT applications, and by comparing the cost differences between CoAP
and HTTP in an exemplary application scenario. In this generic TCO model, the costs were calculated
for each group of technical components – smart objects, access points, web servers, and optional
protocol-translation proxy module – and divided into acquisition and operational costs related to
hardware, software, data communications, electricity and facilities. The important factors affecting the
TCO include the number of technical components, the installation location and distribution of smart
objects, communication mode in use, frequency and data volume of transactions, charging model for
data communications, and lifetime of application.
The results of the analysis indicate several application scenarios where the use of CoAP is more cost-
efficient than HTTP for the purpose of connecting constrained smart objects to the Web. In particular,
using CoAP is more cost-efficient in the applications with high frequency of communications, where
the use of the protocol decreases the power consumption of the smart objects, thus allowing the
operational cost of battery replacement to be reduced. This is especially notable in the applications
where the smart objects are deployed in distant places and thus the cost of replacing the batteries is
relatively high. The use of CoAP was also found to be more cost-efficient in the scenarios where the
smart objects are kept asleep between the communications sessions, as opposed to the applications
where the smart objects need to awake frequently. Further, in case the charging for the data
communications is volume-based, the use of CoAP allows the cost of the applications to be decreased
dramatically, since the small overhead of the protocol and its reliance on the UDP enable a manifold
31
reduction in the transferred data volume. Finally, since less powerful and hence less expensive smart
objects can be used in the CoAP-based solutions, the use of the protocol was found to be more cost-
efficient in the applications involving a large number of smart objects, where the cost difference
becomes significant along with the growing number of smart objects.
The results of the paper aim to support the organizations assessing whether CoAP or HTTP shall be
used as a cost-efficient application layer protocol in their solutions. This is achieved by identifying the
critical factors to be taken into account in the assessment and by explaining the likely effects of these
factors. The analysis in the paper may also benefit the working groups involved in CoAP
standardization activities, by indicating the economic benefits and limitations of the protocol. In
future work, the analysis presented in the paper may be expanded in several ways. Firstly, some of the
cost estimates relying on the expert judgment could be complemented with measurement experiments,
which could include other hardware platforms, patterns of communication, and payload sizes as well.
Secondly, the comparison could be expanded to include also proprietary protocols. Various CoAP
intermediaries, such as proxies, caches and access points, and their functionality, placement, and role
in the total CoAP solution cost could also be investigated. Finally, not only costs but also the expected
benefits, roadblocks, and other factors affecting the adoption of CoAP could be included in the
analysis.
Acknowledgments
The authors wish to thank Heikki Hämmäinen, Lea Heinonen-Eerola, Ari Keränen, Kalevi Kilkki,
Salvatore Loreto, and Zach Shelby for their constructive comments and suggestions. The authors also
thank the anonymous reviewers for their insightful comments and critique.
The research reported in this paper was supported by the Finnish Funding Agency for Technology and
Innovation (TEKES) as part of the Internet of Things program of DIGILE (Finnish Strategic Centre
for Science, Technology and Innovation in the field of ICT and digital business). The work has also
been supported by the Graduate school in Electronics, Telecommunications and Automation (GETA),
and the Future Internet Graduate School (FIGS).
References
[1] B. Anderson, C. Gale, M. Jones, A. McWilliam, Domesticating Broadband – What consumers really do
with flat-rate, always-on and fast Internet access, BT Technology Journal 20 (1) (2002) 103-114.
[2] M. Becker, K. Li, K. Kuladinithi, T. Pötsch, Transport of CoAP over SMS, USSD and GPRS (draft-
becker-core-coap-sms-gprs-04), work in progress. Available at: http://datatracker.ietf.org/doc/draft-
becker-core-coap-sms-gprs, retrieved October 1, 2013.

32
[3] C. Bormann, A. P. Castellani, Z. Shelby, CoAP: An Application Protocol for Billions of Tiny Internet
Nodes, IEEE Internet Comp. 16 (2) (2012) 62-67.
[4] Capgemini, The Price is Right: Pricing Strategies for Mobile Broadband Services, 2012. Available at
http://www.fi.capgemini.com/the-price-is-right-pricing-strategies-for-mobile-broadband-services,
retrieved May 22, 2013.
[5] L. P. Carr, C. D. Ittner, Measuring the Cost of Ownership, J. Cost Manag. 6 (3) (1992) 42-51.
[6] A. Castellani, A. Rahman, T. Fossati, E. Dijk, Best Practices for HTTP-CoAP Mapping
Implementation (draft-castellani-core-http-mapping-07), work in progress. Available at:
https://datatracker.ietf.org/doc/draft-castellani-core-http-mapping, retrieved May 22, 2013.
[7] W. Colitti, K. Steenhaut, N. De Caro, B. Buta, V. Dobrota, Evaluation of constrained application
protocol for wireless sensor networks, Proc. of 18th IEEE Workshop on Local & Metropolitan Area
Networks (LANMAN), 2011, 1-6.
[8] W. Colitti, K. Steenhaut, N. De Caro, Integrating Wireless Sensor Networks with the Web, Proc. of
Extending the Internet to Low power and Lossy Networks (IP+SN 2011), 2011.
[9] J. David, D. Schuff, R. St. Louis, Managing your total IT cost of ownership, Commun. ACM 45 (1)
(2002) 101-106.
[10] Z. Degraeve, F. Roodhooft, Improving the efficiency of the purchasing process using total cost of
ownership information: The case of heating electrodes at Cockerill Sambre S.A., Eur. J. Oper. Res. 112
(1) (1999) 42-53.
[11] A. Dunkels, F. Osterlind, N. Tsiftes, Z. He, Software-based on-line energy estimation for sensor nodes,
Workshop on Embedded networked sensors (EmNets '07), ACM, New York, NY, USA, 2007, 28-32.
[12] L. Ellram, A Framework for Total Cost of Ownership, Int. J. Logist. Manag. 4 (2) (1993) 49 – 60.
[13] L. Ellram, Total cost of ownership: an analysis approach for purchasing, Int. J. Phys. Distrib. & Logist.
Manag. 25 (8) (1995) 4-23.
[14] B. Ferrin, R. Plank, Total Cost of Ownership Models: An Exploratory Study, J. Supply Chain Manag.
38 (3) (2006) 18-29.
[15] R. T. Fielding, R. N. Taylor, Principled design of the modern web architecture. ACM Trans. Internet
Technol. 2 (2) (2002) 115-150.
[16] E. Fleisch, What is the Internet of Things? An Economic Perspective, Auto-ID Labs White Paper, WP-
BIZAPP-053, 2010. Available at: http://www.autoidlabs.org/publications, retrieved May 22, 2013.
[17] D. Guinard, V. Trifa, Towards the Web of Things: Web Mashups for Embedded Devices, International
World Wide Web Conferences, Madrid, Spain, 2009.
[18] D. Guinard, V. Trifa, F. Mattern, E. Wilde, From the Internet of Things to the Web of Things:
Resource-oriented Architecture and Best Practices, in: D. Uckelmann, M. Harrison, F. Michahelles
(Eds.), Architecting the Internet of Things, Springer, 2011, pp. 97-129.
33
[19] B. Hall, B. Khan, Adoption of New Technology, in: D.C. Jones (Ed.), New Economy Handbook,
Academic Press, 2003, pp. 229-249.
[20] K. Hartke, Observing Resources in CoAP, draft-ietf-core-observe-10, work in progress, 2013.
Available at: http://datatracker.ietf.org/doc/draft-ietf-core-observe, retrieved October 1, 2013.
[21] J. Hui, P. Thubert, Compression Format for IPv6 Datagrams over IEEE 802.15.4-Based Networks,
RFC 6282 (Proposed Standard), 2011.
[22] K. Hurkens, W. van der Valk, F. Wynstra, Total Cost of Ownership in the Services Sector: A Case
Study, J. Supply Chain Manag. 42 (1) (2006) 27–37.
[23] D. Katsianis, I. Welling, M. Ylönen, D. Varoutas, T. Sphicopoulos, N. K. Elnegaard, B. T. Olsen, L.
Burdry, The financial perspective of the mobile networks in Europe, IEEE Pers. Commun. 8 (6) (2001)
58-64.
[24] C. Gomez, J. Paradells, Wireless home automation networks: A survey of architectures and
technologies, IEEE Commun. Mag 48 (6) (2010), 92-101.
[25] K. Kuladinithi, O. Bergmann, T. Pötsch, M. Becker, C. Görg, Implementation of CoAP and its
Application in Transport Logistics, Proc. of Extending the Internet to Low power and Lossy Networks
(IP+SN 2011), 2011.
[26] Z. Shelby, Embedded web services, IEEE Wirel. Commun. 17 (6) (2010) 52-57.
[27] Z. Shelby, K. Hartke, C. Bormann, B. Frank, Constrained Application Protocol (CoAP), draft-ietf-core-
coap-18, work in progress. Available at: https://datatracker.ietf.org/doc/draft-ietf-core-coap, retrieved
October 1, 2013.
[28] J. Sigurdson, WAP OFF – Origin, Failure, and Future, Prepared for the Japanese–European
Technology Studies, 2001. Available at: www2.hhs.se/eijswp/135.PDF, retrieved October 1, 2013.
[29] T. Smura, A. Kiiski, H. Hämmäinen, Virtual Operators in the mobile industry: a techno-economic
analysis, Netnomics 8 (1-2) (2008) 25-48.
[30] M. Treacy, F. Wiersema, The Discipline of Market Leaders: Choose Your Customers, Narrow Your
Focus, Dominate Your Market, Perseus, New York, 1997.
[31] M. L. Tushman, J. P. Murmann, Dominant designs, technology cycles, and organizational outcomes,
in: R. Garud, A. Kumaraswamy, R. N. Langlois (Eds.), Managing in the modular age: architectures,
networks, and organizations. Oxford: Blackwell Publishers, 2003, pp. 231-266.
[32] P. Tyrväinen, J. Warsta, V. Seppänen, Evolution of Secondary Software Businesses: Understanding
Industry Dynamics, in: G. Leon, A. Bernardos, J. Casar, K. Kautz, J. DeGross (Eds.), Open IT-based
innovation: moving towards cooperative IT transfer and knowledge diffusion, Springer, Boston, 2008,
pp. 381-401.
34
[33] B.C. Villaverde, D. Pesch, R. de Paz Alberola, S. Fedor, M. Boubekeur, Constrained Application
Protocol for Low Power Embedded Networks: A Survey, Proc. of Innovative Mobile and Internet
Services in Ubiquitous Computing (IMIS), 2012, pp. 702-707.
[34] E. Walker, The Real Cost of a CPU Hour, Computer 42 (4) (2009) 35-41.
[35] E. Walker, W. Brisken, J. Romney, To Lease or Not to Lease from Storage Clouds, Computer 43 (4)
(2010) 44-50.
[36] H. Warma, T. Levä, L. Eggert, H. Hämmäinen, J. Manner, Mobile internet in stereo: an end-to-end
scenario, Incentives, Overlays and Economic Traffic Control, Springer, Berlin, 2010, 64-75.
[37] D. Zeng, S. Guo, Z. Cheng, The Web of Things: A Survey, J. Commun. 6 (6) (2011) 424-438.
Biographies
Tapio Levä received his M.Sc. in communications engineering from Helsinki University of
Technology (TKK), Finland, in 2009 with major in Networking Technology and minors in
Telecommunications Management and Interactive Digital Media. He is currently doing postgraduate
studies in the Department of Communications and Networking at Aalto University. His
researchinterests include techno-economics of Internet architecture evolution, Internet standards
adoption and information-centric networking.
Henna Suomi received her M.Sc. in communications engineering from Helsinki University of
Technology (TKK), Finland, in 2009 with major in Telecommunications Management and minor in
Networking Technology. After working as a visiting researcher at McGill University she started doing
her doctoral studies in the Department of Communications and Networking at Aalto University. Her
current research interests include techno-economics of Internet architecture evolution, adoption of
multipath protocols and economic effects of multihoming.
Oleksiy Mazhelis is a post-doc researcher at the Department of Computer Science and Information
Systems, University of Jyväskylä, Finland. He received a degree of MSc (Specialist) from Kharkov
National University of Radio-Electronics, Ukraine in 1997, and received his licentiate and doctoral
degrees from the University of Jyväskylä in 2004 and 2007, respectively, on the subject of
masquerader detection in mobile phone environment. Starting from 2004, he was working in various
research projects conducted in collaboration with industrial partners. His current research interests
encompass techno-economics, systems analysis, machine learning, and pattern recognition, applied to
the domains of software industry evolution, internet-of-things, telecommunications and cloud
software, as well as intelligent transportation systems.

35
Appendix A – Energy consumption of CoAP vs. HTTP
One of the main promises of the CoAP protocol is the reduced energy footprint of the applications.
The expected reduction in the consumption depends on whether the communication is carried out in
the pull mode (implying a smart object always ready to respond to an incoming request) or in the push
mode (implying a mainly sleeping smart object periodically sending the information to a remote end-
point).
A. Pull mode
As reported by Colitti et al. [7,8] for the pull mode of communication, given the request inter-arrival
time of 𝑡 = 10 s, the use of CoAP allows the energy consumption to be cut roughly by 50%, as
compared with HTTP. However, the energy saving becomes practically negligible as soon as the
inter-arrival interval increases to 𝑡 = 120 s [8]. This is attributed to the fact that, due to the pull mode,
the smart object spends a significant portion of time in the listening mode, in which the energy
consumption is similar for both CoAP and HTTP.
Also, it was found that, already for a 120 s interval, the power consumption of both protocols
stabilizes at the level of circa 0.72-0.75 mW. This can be explained by the radio duty cycling whereby
the radio transmitter and CPU are (periodically) turned on to make the smart object responsive in the
pull mode. Consequently, with the increase of the interval, the constant energy drainage due to
reception 𝐸!" and CPU cycles 𝐸!"# starts to dominate the overall energy consumption profile.
Therefore, it is assumed that for longer intervals (𝑡 ≥ 5 min), the power consumption in pull mode
stays at the level of 0.72 mW, as summarized in Table A.1 based on the findings by Colitti et al. [8].
Table A.1. The power consumption 𝑃 (mW) in pull mode
Interval 𝒕 5 s 10 s 30 s 60 s 120 s ≥ 5 min 𝑃(𝐻𝑇𝑇𝑃), mW 1.9 1.4 0.96 0.81 0.76 0.72 𝑃(𝐶𝑜𝐴𝑃), mW 0.83 0.76 0.71 0.72 0.72 0.72
B. Push mode
In order to estimate the difference in the energy consumption for the push mode, a set of experiments
was carried using Advanticsys CM5000 (Tmote Sky-compatible) motes running Contiki OS as smart
objects. A simple client was implemented on the smart object. The client was sending the lightness
and energy consumption measurements from the embedded sensor to the server every 10, 30, or 120 s
using either the CoAP or HTTP protocol. Thus, in total, six experiment runs were conducted: three for
CoAP and three for HTTP. In each experiment run, 50 measurements and communication sessions
were executed, and the recorded energy measurements were averaged. To reduce the energy
consumption, radio duty cycling was disabled between the communication sessions. The content of
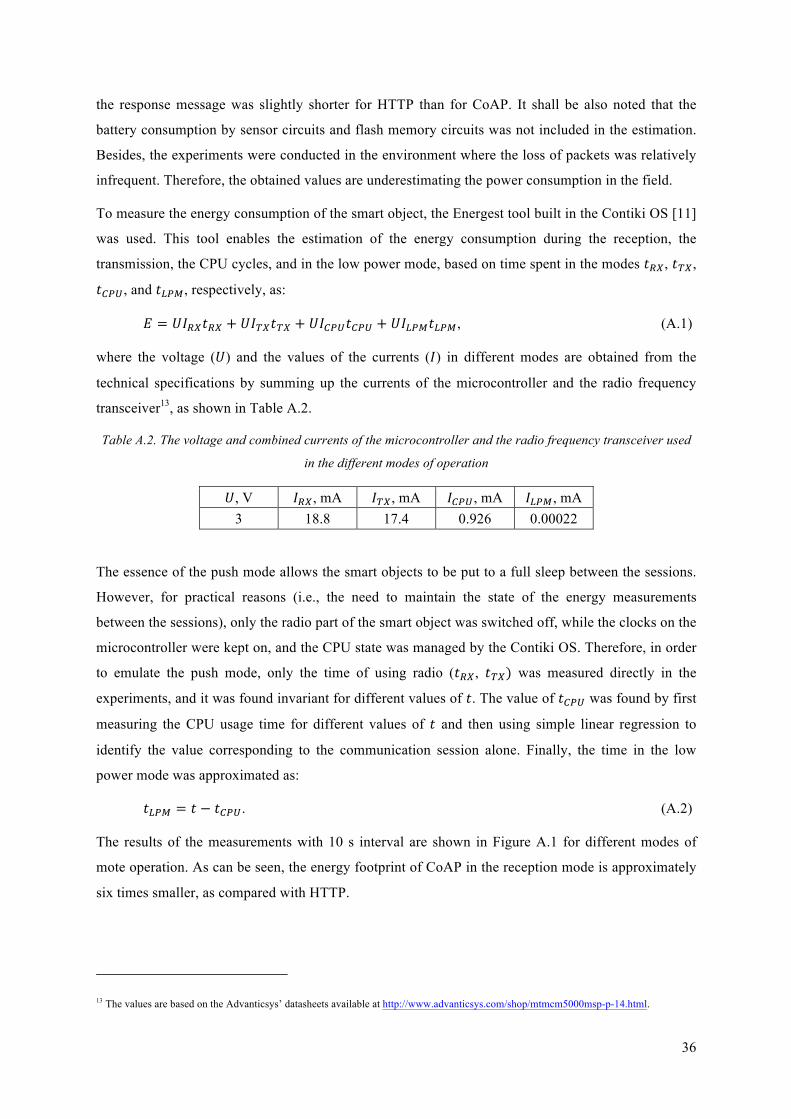
36
the response message was slightly shorter for HTTP than for CoAP. It shall be also noted that the
battery consumption by sensor circuits and flash memory circuits was not included in the estimation.
Besides, the experiments were conducted in the environment where the loss of packets was relatively
infrequent. Therefore, the obtained values are underestimating the power consumption in the field.
To measure the energy consumption of the smart object, the Energest tool built in the Contiki OS [11]
was used. This tool enables the estimation of the energy consumption during the reception, the
transmission, the CPU cycles, and in the low power mode, based on time spent in the modes 𝑡!", 𝑡!",
𝑡!"#, and 𝑡!"#, respectively, as:
𝐸 = 𝑈𝐼!"𝑡!" + 𝑈𝐼!"𝑡!" + 𝑈𝐼!"#𝑡!"# + 𝑈𝐼!"#𝑡!"#, (A.1)
where the voltage (𝑈) and the values of the currents (𝐼) in different modes are obtained from the
technical specifications by summing up the currents of the microcontroller and the radio frequency
transceiver13, as shown in Table A.2.
Table A.2. The voltage and combined currents of the microcontroller and the radio frequency transceiver used
in the different modes of operation
𝑈, V 𝐼!", mA 𝐼!", mA 𝐼!"#, mA 𝐼!"#, mA 3 18.8 17.4 0.926 0.00022
The essence of the push mode allows the smart objects to be put to a full sleep between the sessions.
However, for practical reasons (i.e., the need to maintain the state of the energy measurements
between the sessions), only the radio part of the smart object was switched off, while the clocks on the
microcontroller were kept on, and the CPU state was managed by the Contiki OS. Therefore, in order
to emulate the push mode, only the time of using radio (𝑡!", 𝑡!") was measured directly in the
experiments, and it was found invariant for different values of 𝑡. The value of 𝑡!"# was found by first
measuring the CPU usage time for different values of 𝑡 and then using simple linear regression to
identify the value corresponding to the communication session alone. Finally, the time in the low
power mode was approximated as:
𝑡!"# = 𝑡 − 𝑡!"#. (A.2)
The results of the measurements with 10 s interval are shown in Figure A.1 for different modes of
mote operation. As can be seen, the energy footprint of CoAP in the reception mode is approximately
six times smaller, as compared with HTTP.
13 The values are based on the Advanticsys’ datasheets available at http://www.advanticsys.com/shop/mtmcm5000msp-p-14.html.
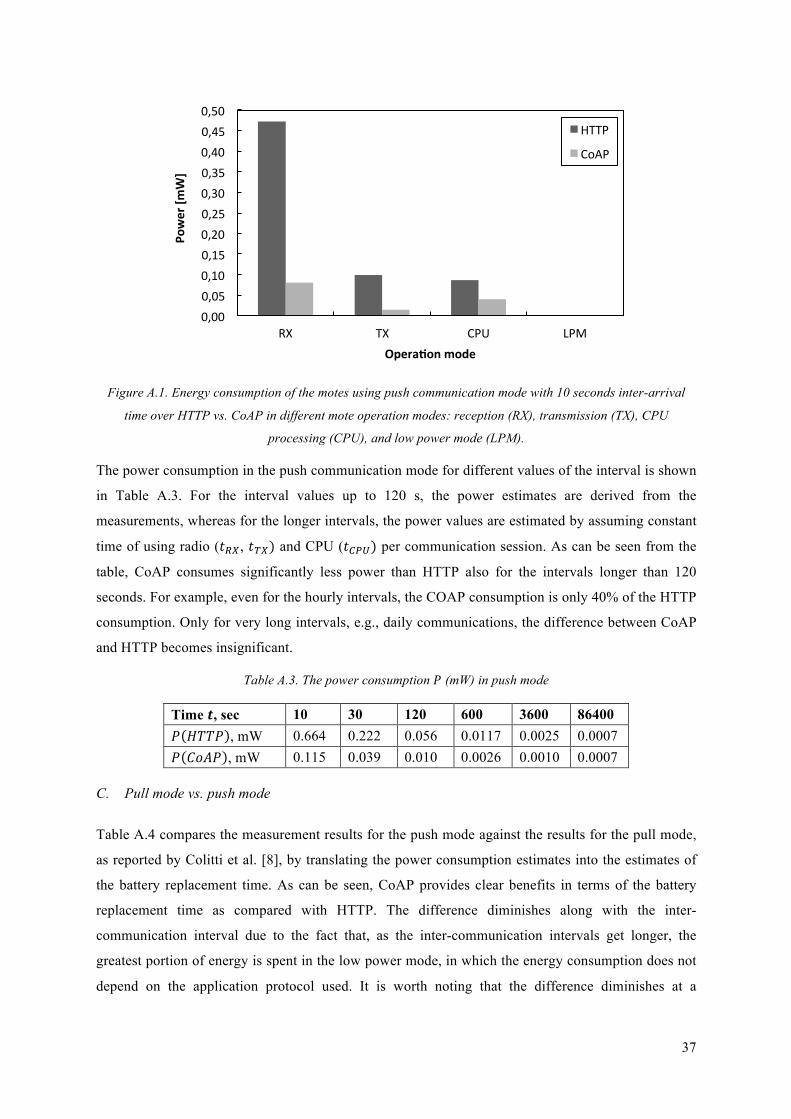
37
Figure A.1. Energy consumption of the motes using push communication mode with 10 seconds inter-arrival
time over HTTP vs. CoAP in different mote operation modes: reception (RX), transmission (TX), CPU
processing (CPU), and low power mode (LPM).
The power consumption in the push communication mode for different values of the interval is shown
in Table A.3. For the interval values up to 120 s, the power estimates are derived from the
measurements, whereas for the longer intervals, the power values are estimated by assuming constant
time of using radio (𝑡!", 𝑡!") and CPU (𝑡!"#) per communication session. As can be seen from the
table, CoAP consumes significantly less power than HTTP also for the intervals longer than 120
seconds. For example, even for the hourly intervals, the COAP consumption is only 40% of the HTTP
consumption. Only for very long intervals, e.g., daily communications, the difference between CoAP
and HTTP becomes insignificant.
Table A.3. The power consumption 𝑃 (mW) in push mode
Time 𝒕, sec 10 30 120 600 3600 86400 𝑃 𝐻𝑇𝑇𝑃 , mW 0.664 0.222 0.056 0.0117 0.0025 0.0007 𝑃 𝐶𝑜𝐴𝑃 , mW 0.115 0.039 0.010 0.0026 0.0010 0.0007
C. Pull mode vs. push mode
Table A.4 compares the measurement results for the push mode against the results for the pull mode,
as reported by Colitti et al. [8], by translating the power consumption estimates into the estimates of
the battery replacement time. As can be seen, CoAP provides clear benefits in terms of the battery
replacement time as compared with HTTP. The difference diminishes along with the inter-
communication interval due to the fact that, as the inter-communication intervals get longer, the
greatest portion of energy is spent in the low power mode, in which the energy consumption does not
depend on the application protocol used. It is worth noting that the difference diminishes at a
0,00 0,05 0,10 0,15 0,20 0,25 0,30 0,35 0,40 0,45 0,50
RX TX CPU LPM
Power [m
W]
Opera7on mode
HTTP
CoAP
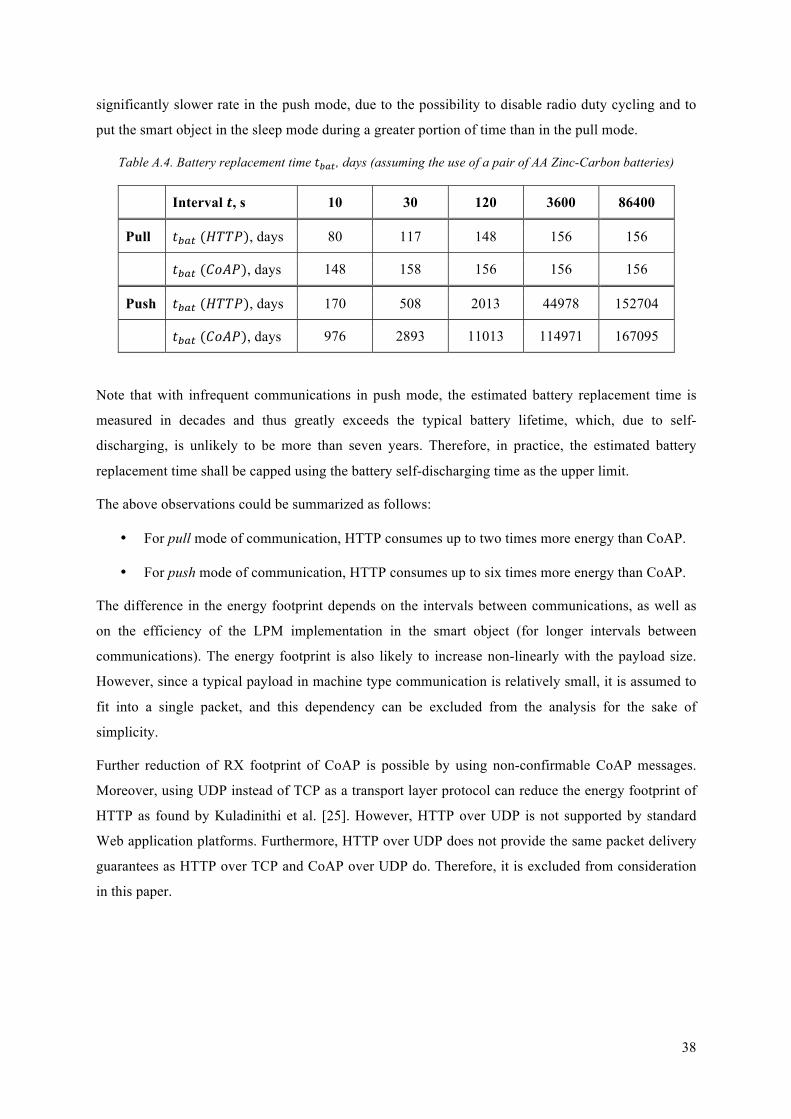
38
significantly slower rate in the push mode, due to the possibility to disable radio duty cycling and to
put the smart object in the sleep mode during a greater portion of time than in the pull mode.
Table A.4. Battery replacement time 𝑡!"#, days (assuming the use of a pair of AA Zinc-Carbon batteries)
Interval 𝒕, s 10 30 120 3600 86400
Pull 𝑡!"# (𝐻𝑇𝑇𝑃), days 80 117 148 156 156
𝑡!"# (𝐶𝑜𝐴𝑃), days 148 158 156 156 156
Push 𝑡!"# (𝐻𝑇𝑇𝑃), days 170 508 2013 44978 152704
𝑡!"# (𝐶𝑜𝐴𝑃), days 976 2893 11013 114971 167095
Note that with infrequent communications in push mode, the estimated battery replacement time is
measured in decades and thus greatly exceeds the typical battery lifetime, which, due to self-
discharging, is unlikely to be more than seven years. Therefore, in practice, the estimated battery
replacement time shall be capped using the battery self-discharging time as the upper limit.
The above observations could be summarized as follows:
• For pull mode of communication, HTTP consumes up to two times more energy than CoAP.
• For push mode of communication, HTTP consumes up to six times more energy than CoAP.
The difference in the energy footprint depends on the intervals between communications, as well as
on the efficiency of the LPM implementation in the smart object (for longer intervals between
communications). The energy footprint is also likely to increase non-linearly with the payload size.
However, since a typical payload in machine type communication is relatively small, it is assumed to
fit into a single packet, and this dependency can be excluded from the analysis for the sake of
simplicity.
Further reduction of RX footprint of CoAP is possible by using non-confirmable CoAP messages.
Moreover, using UDP instead of TCP as a transport layer protocol can reduce the energy footprint of
HTTP as found by Kuladinithi et al. [25]. However, HTTP over UDP is not supported by standard
Web application platforms. Furthermore, HTTP over UDP does not provide the same packet delivery
guarantees as HTTP over TCP and CoAP over UDP do. Therefore, it is excluded from consideration
in this paper.
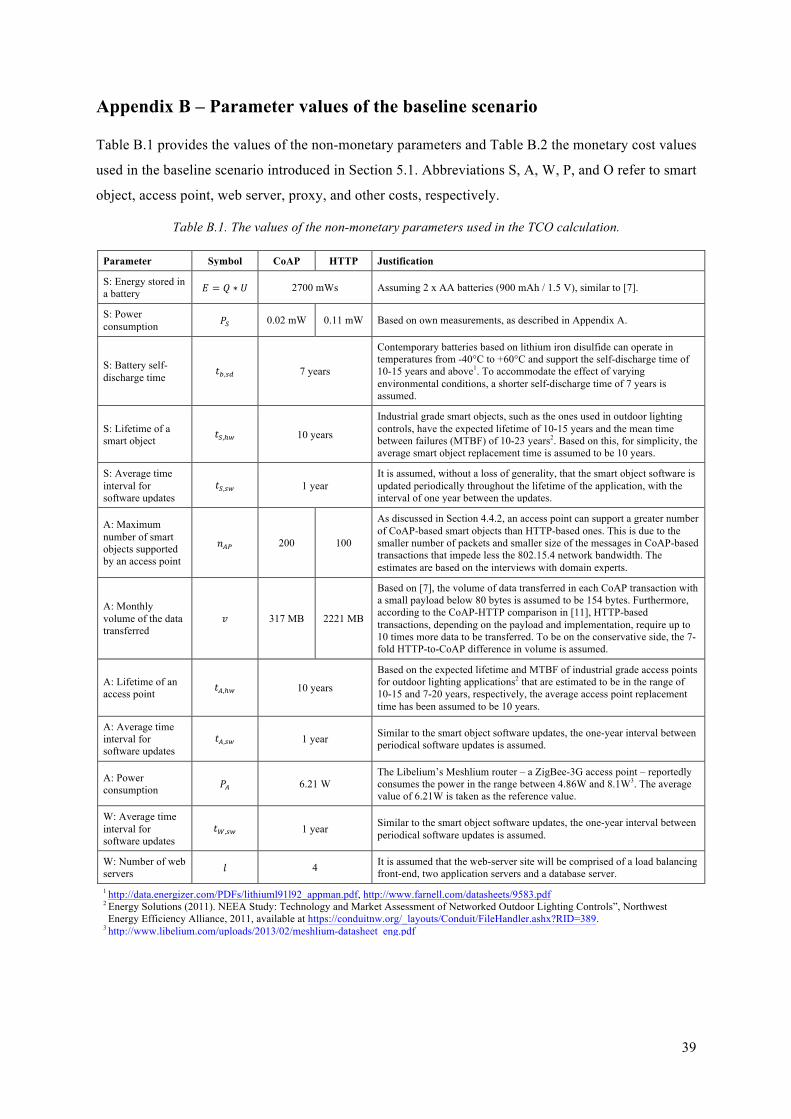
39
Appendix B – Parameter values of the baseline scenario
Table B.1 provides the values of the non-monetary parameters and Table B.2 the monetary cost values
used in the baseline scenario introduced in Section 5.1. Abbreviations S, A, W, P, and O refer to smart
object, access point, web server, proxy, and other costs, respectively.
Table B.1. The values of the non-monetary parameters used in the TCO calculation.
Parameter Symbol CoAP HTTP Justification
S: Energy stored in a battery 𝐸 = 𝑄 ∗ 𝑈 2700 mWs Assuming 2 x AA batteries (900 mAh / 1.5 V), similar to [7].
S: Power consumption 𝑃! 0.02 mW 0.11 mW Based on own measurements, as described in Appendix A.
S: Battery self-discharge time 𝑡!,!" 7 years
Contemporary batteries based on lithium iron disulfide can operate in temperatures from -40°C to +60°C and support the self-discharge time of 10-15 years and above1. To accommodate the effect of varying environmental conditions, a shorter self-discharge time of 7 years is assumed.
S: Lifetime of a smart object 𝑡!,!! 10 years
Industrial grade smart objects, such as the ones used in outdoor lighting controls, have the expected lifetime of 10-15 years and the mean time between failures (MTBF) of 10-23 years2. Based on this, for simplicity, the average smart object replacement time is assumed to be 10 years.
S: Average time interval for software updates
𝑡!,!" 1 year It is assumed, without a loss of generality, that the smart object software is updated periodically throughout the lifetime of the application, with the interval of one year between the updates.
A: Maximum number of smart objects supported by an access point
𝑛!" 200 100
As discussed in Section 4.4.2, an access point can support a greater number of CoAP-based smart objects than HTTP-based ones. This is due to the smaller number of packets and smaller size of the messages in CoAP-based transactions that impede less the 802.15.4 network bandwidth. The estimates are based on the interviews with domain experts.
A: Monthly volume of the data transferred
𝑣 317 MB 2221 MB
Based on [7], the volume of data transferred in each CoAP transaction with a small payload below 80 bytes is assumed to be 154 bytes. Furthermore, according to the CoAP-HTTP comparison in [11], HTTP-based transactions, depending on the payload and implementation, require up to 10 times more data to be transferred. To be on the conservative side, the 7-fold HTTP-to-CoAP difference in volume is assumed.
A: Lifetime of an access point 𝑡!,!! 10 years
Based on the expected lifetime and MTBF of industrial grade access points for outdoor lighting applications2 that are estimated to be in the range of 10-15 and 7-20 years, respectively, the average access point replacement time has been assumed to be 10 years.
A: Average time interval for software updates
𝑡!,!" 1 year Similar to the smart object software updates, the one-year interval between periodical software updates is assumed.
A: Power consumption 𝑃! 6.21 W
The Libelium’s Meshlium router – a ZigBee-3G access point – reportedly consumes the power in the range between 4.86W and 8.1W3. The average value of 6.21W is taken as the reference value.
W: Average time interval for software updates
𝑡! ,!" 1 year Similar to the smart object software updates, the one-year interval between periodical software updates is assumed.
W: Number of web servers 𝑙 4 It is assumed that the web-server site will be comprised of a load balancing
front-end, two application servers and a database server. 1 http://data.energizer.com/PDFs/lithiuml91l92_appman.pdf, http://www.farnell.com/datasheets/9583.pdf 2 Energy Solutions (2011). NEEA Study: Technology and Market Assessment of Networked Outdoor Lighting Controls”, Northwest Energy Efficiency Alliance, 2011, available at https://conduitnw.org/_layouts/Conduit/FileHandler.ashx?RID=389.
3 http://www.libelium.com/uploads/2013/02/meshlium-datasheet_eng.pdf
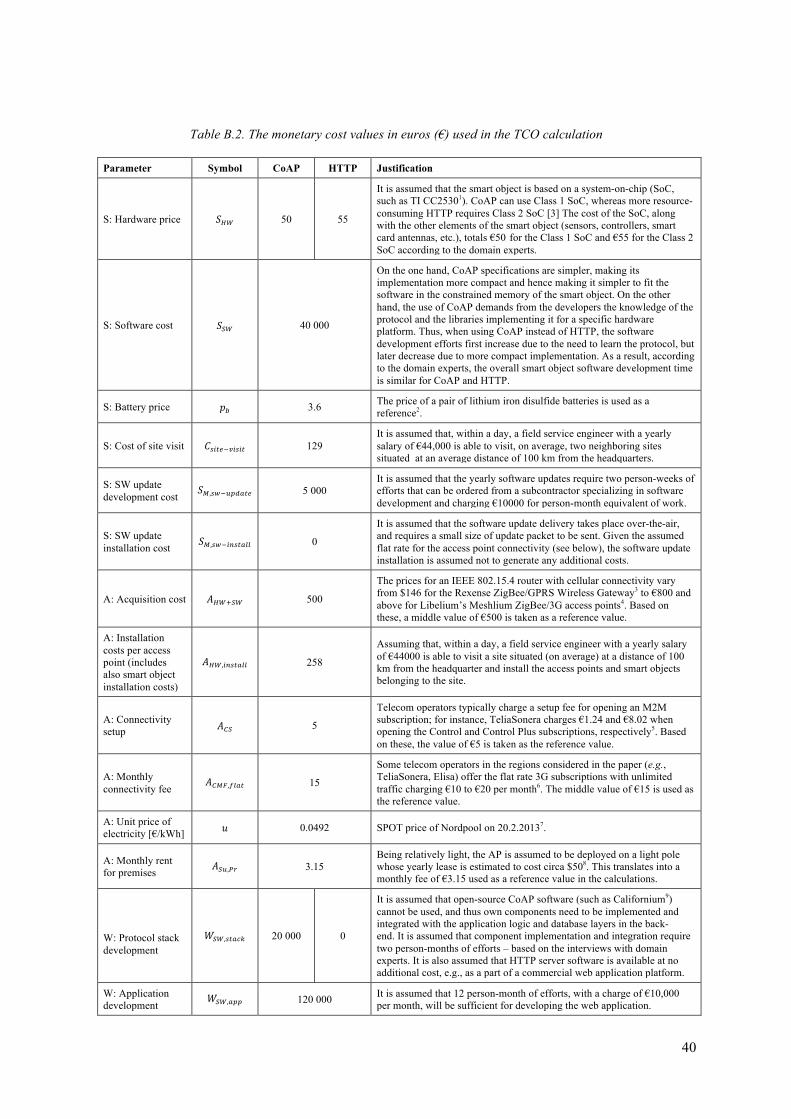
40
Table B.2. The monetary cost values in euros (€) used in the TCO calculation
Parameter Symbol CoAP HTTP Justification
S: Hardware price 𝑆!" 50 55
It is assumed that the smart object is based on a system-on-chip (SoC, such as TI CC25301). CoAP can use Class 1 SoC, whereas more resource-consuming HTTP requires Class 2 SoC [3] The cost of the SoC, along with the other elements of the smart object (sensors, controllers, smart card antennas, etc.), totals €50 for the Class 1 SoC and €55 for the Class 2 SoC according to the domain experts.
S: Software cost 𝑆!" 40 000
On the one hand, CoAP specifications are simpler, making its implementation more compact and hence making it simpler to fit the software in the constrained memory of the smart object. On the other hand, the use of CoAP demands from the developers the knowledge of the protocol and the libraries implementing it for a specific hardware platform. Thus, when using CoAP instead of HTTP, the software development efforts first increase due to the need to learn the protocol, but later decrease due to more compact implementation. As a result, according to the domain experts, the overall smart object software development time is similar for CoAP and HTTP.
S: Battery price 𝑝! 3.6 The price of a pair of lithium iron disulfide batteries is used as a reference2.
S: Cost of site visit 𝐶!"#$!!"#"$ 129 It is assumed that, within a day, a field service engineer with a yearly salary of €44,000 is able to visit, on average, two neighboring sites situated at an average distance of 100 km from the headquarters.
S: SW update development cost
𝑆! ,!"!!"#$%& 5 000 It is assumed that the yearly software updates require two person-weeks of efforts that can be ordered from a subcontractor specializing in software development and charging €10000 for person-month equivalent of work.
S: SW update installation cost 𝑆! ,!"!!"#$%&& 0
It is assumed that the software update delivery takes place over-the-air, and requires a small size of update packet to be sent. Given the assumed flat rate for the access point connectivity (see below), the software update installation is assumed not to generate any additional costs.
A: Acquisition cost 𝐴!"!!" 500
The prices for an IEEE 802.15.4 router with cellular connectivity vary from $146 for the Rexense ZigBee/GPRS Wireless Gateway3 to €800 and above for Libelium’s Meshlium ZigBee/3G access points4. Based on these, a middle value of €500 is taken as a reference value.
A: Installation costs per access point (includes also smart object installation costs)
𝐴!" ,!"#$%&& 258
Assuming that, within a day, a field service engineer with a yearly salary of €44000 is able to visit a site situated (on average) at a distance of 100 km from the headquarter and install the access points and smart objects belonging to the site.
A: Connectivity setup 𝐴!" 5
Telecom operators typically charge a setup fee for opening an M2M subscription; for instance, TeliaSonera charges €1.24 and €8.02 when opening the Control and Control Plus subscriptions, respectively5. Based on these, the value of €5 is taken as the reference value.
A: Monthly connectivity fee
𝐴!"# ,!"#$ 15
Some telecom operators in the regions considered in the paper (e.g., TeliaSonera, Elisa) offer the flat rate 3G subscriptions with unlimited traffic charging €10 to €20 per month6. The middle value of €15 is used as the reference value.
A: Unit price of electricity [€/kWh] 𝑢 0.0492 SPOT price of Nordpool on 20.2.20137.
A: Monthly rent for premises 𝐴!",!" 3.15
Being relatively light, the AP is assumed to be deployed on a light pole whose yearly lease is estimated to cost circa $508. This translates into a monthly fee of €3.15 used as a reference value in the calculations.
W: Protocol stack development
𝑊!" ,!"#$% 20 000 0
It is assumed that open-source CoAP software (such as Californium9) cannot be used, and thus own components need to be implemented and integrated with the application logic and database layers in the back-end. It is assumed that component implementation and integration require two person-months of efforts – based on the interviews with domain experts. It is also assumed that HTTP server software is available at no additional cost, e.g., as a part of a commercial web application platform.
W: Application development
𝑊!" ,!"" 120 000 It is assumed that 12 person-month of efforts, with a charge of €10,000 per month, will be sufficient for developing the web application.
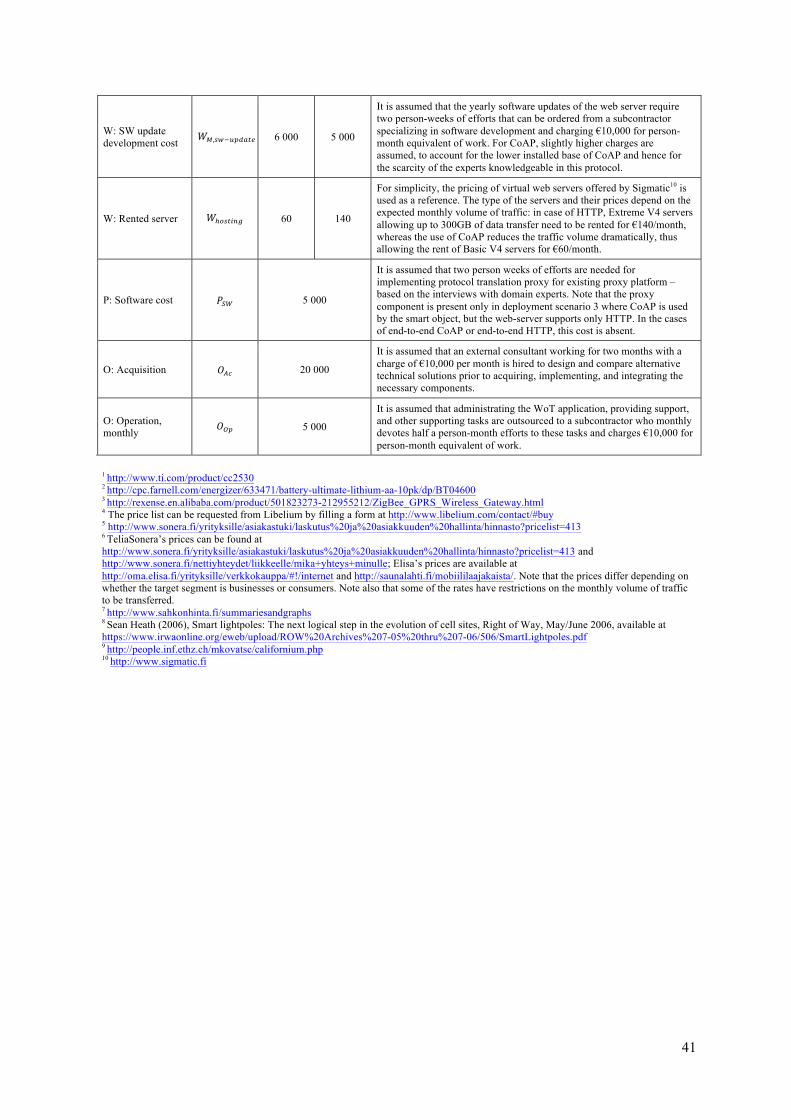
41
W: SW update development cost 𝑊! ,!"!!"#$%& 6 000 5 000
It is assumed that the yearly software updates of the web server require two person-weeks of efforts that can be ordered from a subcontractor specializing in software development and charging €10,000 for person-month equivalent of work. For CoAP, slightly higher charges are assumed, to account for the lower installed base of CoAP and hence for the scarcity of the experts knowledgeable in this protocol.
W: Rented server 𝑊!!"#$%& 60 140
For simplicity, the pricing of virtual web servers offered by Sigmatic10 is used as a reference. The type of the servers and their prices depend on the expected monthly volume of traffic: in case of HTTP, Extreme V4 servers allowing up to 300GB of data transfer need to be rented for €140/month, whereas the use of CoAP reduces the traffic volume dramatically, thus allowing the rent of Basic V4 servers for €60/month.
P: Software cost 𝑃!" 5 000
It is assumed that two person weeks of efforts are needed for implementing protocol translation proxy for existing proxy platform – based on the interviews with domain experts. Note that the proxy component is present only in deployment scenario 3 where CoAP is used by the smart object, but the web-server supports only HTTP. In the cases of end-to-end CoAP or end-to-end HTTP, this cost is absent.
O: Acquisition 𝑂!" 20 000
It is assumed that an external consultant working for two months with a charge of €10,000 per month is hired to design and compare alternative technical solutions prior to acquiring, implementing, and integrating the necessary components.
O: Operation, monthly 𝑂!" 5 000
It is assumed that administrating the WoT application, providing support, and other supporting tasks are outsourced to a subcontractor who monthly devotes half a person-month efforts to these tasks and charges €10,000 for person-month equivalent of work.
1 http://www.ti.com/product/cc2530 2 http://cpc.farnell.com/energizer/633471/battery-ultimate-lithium-aa-10pk/dp/BT04600 3 http://rexense.en.alibaba.com/product/501823273-212955212/ZigBee_GPRS_Wireless_Gateway.html 4 The price list can be requested from Libelium by filling a form at http://www.libelium.com/contact/#buy 5 http://www.sonera.fi/yrityksille/asiakastuki/laskutus%20ja%20asiakkuuden%20hallinta/hinnasto?pricelist=413 6 TeliaSonera’s prices can be found at http://www.sonera.fi/yrityksille/asiakastuki/laskutus%20ja%20asiakkuuden%20hallinta/hinnasto?pricelist=413 and http://www.sonera.fi/nettiyhteydet/liikkeelle/mika+yhteys+minulle; Elisa’s prices are available at http://oma.elisa.fi/yrityksille/verkkokauppa/#!/internet and http://saunalahti.fi/mobiililaajakaista/. Note that the prices differ depending on whether the target segment is businesses or consumers. Note also that some of the rates have restrictions on the monthly volume of traffic to be transferred. 7 http://www.sahkonhinta.fi/summariesandgraphs 8 Sean Heath (2006), Smart lightpoles: The next logical step in the evolution of cell sites, Right of Way, May/June 2006, available at https://www.irwaonline.org/eweb/upload/ROW%20Archives%207-05%20thru%207-06/506/SmartLightpoles.pdf 9 http://people.inf.ethz.ch/mkovatsc/californium.php 10 http://www.sigmatic.fi


![1st CoAP Plug test ; Paris, France ; 24 - 25 March 2012€¦ · [1] Constrained Application Protocol (CoAP); draft-ietf-core-coap-08 [2] CoRE Link Format; draft-ietf-core-link-format-11](https://img.pdfslide.us/doc/110x75/5f093f497e708231d425ecba/1st-coap-plug-test-paris-france-24-25-march-2012-1-constrained-application.jpg)