Embed Size (px)
Citation preview

Comparing Ecological Sensitivity with Stream Flow Rates in the Apalachicola-Chattahoochee-
Flint River Basin
Tony G. Simpson, Jennifer L. Druppel, Marissa C. Watson, Bennett I. Benson, Jeffrey D. Mullen
The University of Georgia
Copyright 2011 by Tony G. Simpson, Jennifer L. Druppel, Marissa C. Watson, Bennett I. Benson, Jeffrey D. Mullen. All rights reserved. Readers may make verbatim copies of this document for non-commercial purposes by any means, provided that this copyright notice appears on all such copies.

Introduction
For people in Georgia, the Apalachicola-Chattahoochee-Flint River Basin fuels a wealth
of resources. Water in the ACF River Basin provides Atlanta residents with recreation
opportunities and peanut farmers in Albany with crop irrigation. When the rivers reach the
ocean, the headwaters create premium oyster habitat for fishermen. All along Western Georgia,
people’s drinking water comes from the ground and surface water belonging to the ACF River
Basin. In addition to human uses, the ACF River Basin also supports a rich network of life. An
ecological hotspot, hundreds of fish, insect and bird species call these three major Southeastern
rivers home.
Literature Review
The challenge for Georgia has been to manage its water use of the ACF River Basin
while sustaining the region’s biological diversity. A U.S. Geological Survey reported that nearly
one-third of all water withdrawn in Georgia in 1990 is taken from the ACF River Basin (Marella,
Fanning, & Motty, 1993). The increasing trend in water use has grown immensely over the last
50 years, since irrigation innovations allowed farmers to grow on more land in Southwest
Georgia. Along with the population centers of Atlanta, Albany, and Columbia, Georgians place
heavy stress on the region’s water supplies. From 1970 to 1990, agricultural water withdrawals
from the Chattahoochee and Flint Rivers grew by 1,320 percent. During the same time period,
surface-water withdrawals grew for public supply by 350 percent (Marella, Fanning, & Motty,
1993). Much of this water withdrawal occurs near the beginning of the ACF River Basin, where
Lake Lanier and the Chattahoochee River provide 4 million Atlanta residents with potable water.
However, a large proportion of this water is returned to the environment. Marella, Fanning, and
Motty (1993) estimated that Georgians consume 21 percent of their total water use, while the
remaining 79 percent is returned for possible reuse. By 2000, Georgia withdrew 6,410 million
gallons of freshwater every day to satisfy its agricultural, public and industrial demand.
Water withdrawals in Georgia are largely driven by farmers. All together, Georgia
farmers irrigate 1,540,000 acres of land, using 1,140 million gallons of water per day.
Agriculture is a $9.9 billion industry in Georgia, and $1.9 billion of the total comes from crops
grown in Southwest Georgia (McKissick, 2004). In 1990, the Chattahoochee and Flint River
Basin accounted for 38 percent of the total harvested cropland in Georgia. Here, farmers use
irrigation to produce a variety of crops, including peanuts, cotton, pecans, wheat, hay and
soybeans. In the Flint River Basin alone, farmers use 90% of total water withdrawn during
April-September growing season (Georgia Department of Natural Resources, 2006). Many of
these Southwest Georgia counties have access to cheap water, which is vital for them to maintain
crop production at a high level.
Balancing human water use and maintaining the health of the ecosystem has become a
major challenge. Richter, Mathews, Harrison, and Wigington (2003) identify the need for
ecologically sustainable water management. Healthy freshwater systems provide people with an
untold number of resources, but mismanagement causes environmental damages. Human
changes to the rivers and streams can adversely affect the diversity and animal life in these
ecosystems. According to Sparks (1995), alteration of a river’s flow regime can affect wildlife
in unknown manners, and proper ecosystem management needs to preserve the integrity of the
entire ecosystem. Proper management of water in lakes and rivers is also necessary to preserve a
sustainable amount of water for a region, ensuring that water never becomes too scarce
(Dabrowski, Murray, Ashton, & Leaner, 2008).

In Georgia, policymakers have become particularly concerned about meeting the needs of
farmers and maintaining ecological health in times of drought. During normal years, standard
irrigation practices do not jeopardize the river’s ecosystem by removing an excess of water
(Congressional Research Service, 2008). However, this situation changes during drought years.
Farmers use more water to irrigate crops during dry seasons, exacerbating the climatically dry
conditions for wildlife due to the drought. Furthermore, Alabama and Florida also depend on
rivers in the ACF River Basin to fuel economic growth (Stephenson, 2000). Alabama residents
extensively use the Chattahoochee for agricultural and recreational purposes. Including thermo-
electric power, Alabama withdraws about 185 million gallons of water per day from the Lower-
and Middle-Chattahoochee watersheds (United State Geological Survey, 2005). In Florida,
fisherman garner about $134 million in economic benefit annually in Apalachicola Bay, most of
it from the oyster harvest (Dixon, 2009). The harvest depends on healthy river flows to maintain
the proper salinity content of the water. The competing water needs among the three states led to
Alabama and Florida filing a lawsuit against U.S. Army Corps of Engineers in 1990 to prevent
Atlanta from using more water and degrading the water quality in the ACF River Basin
(Stephenson, 2000). The three-state water dispute demonstrates the difficulty in setting adequate
water management when multiple stakeholders are involved with competing wants.
Policymakers have to compromise between ensuring the health of the ecosystem and promoting
economic production.
To help in these decisions and cut down on the consumptive use of water, environmental
economists have previously employed spatial techniques to improve inefficient agricultural
techniques (Crossman et al., 2010). Other economic scholars have looked at how trading water
among regions can lead to more optimal outcomes for economic and environmental needs.

Qureshi, Connor, Kirby, and Mainuddin’s (2007) analysis of an Australian river basin showed
that free water trade results in an increase in irrigation benefits to farmers. However, some
revenue gains can be offset by negative externalities related to the water’s salinity. Water used
for irrigation can further harm the environment when farmers use more water during naturally
dry periods; the timing of water withdrawals is just as important as the quantity of water
withdrawn. However, research has shown that compromises can be made to maximize economic
benefit for farmers while minimizing environmental costs (Jones, Crean, Aluwihare, & Letcher,
2007). Virtual water trading across regions can also offset losses in water quality (Dabrowski,
Murray, Ashton, & Leaner, 2008).
A compromise between economic needs and environmental conservation is essential in
preventing harm to ecosystems. Severe drops in flow regimes have previously been shown to
negatively affect ecological biodiversity. Fish species diversity and abundance is strongly
related to year-round stream flows and river surface area (Oberdorff, Guégan, & Hugueny, 1995;
Xenopoulos et al., 2005). Sharp drops in stream levels due to either climatic conditions or
human use can drive species to extinction in certain areas. Other species will be confined to
small tributaries after being driven out of main rivers, which isolates the surviving populations.
According to Oberdorff, Guégan and Hugueny (1995), freshwater species are not able to adapt
quickly enough to survive dramatic water withdrawals.
Large-scale anthropogenic changes on the environment can have immediate and dramatic
effects on ecological biodiversity. A study by Bredenhand and Samways (2008) found that a
newly built dam reduced benthic macroinvertebrate diversity by half in areas below the dam
compared to untouched sections above. Benthic macroinvertebrates diversity relates strongly to
stream size and the size of the surrounding catchment area (Heino, Mykrä, Hämäläinen, Aroviita,
Muotka, 2007). When people change the dynamic of a river’s water, biodiversity levels can
change quickly. However, anthropogenic changes to the environment can sometimes increase
species diversity or abundance as well.
Research on Southwestern Georgia rivers often focuses on mussel species diversity. In
the Flint River Basin, droughts have severely affected abundance and diversity levels of mussel
species. More environmentally susceptible mussel species decline at a faster rate than common,
tolerant mussel common species (Golladay, Gagnon, Kearns, Battle, & Hicks, 2003). Declines
in mussel populations are thought to be associated both with droughts and increased demand for
irrigation on streams and aquifers. Mussel species diversity is also highly susceptible to changes
in the surrounding habitat and channel depth (Gagnon, Michener, Freeman, Brim Box, 2006).
Mussels are one of the most monitored animals in the ACF River Basin since several endangered
mussel species live in the region, along with one endangered sturgeon (Congressional Research
Service, 2007).
Research Questions
Our project looks into how variation in stream flows and groundwater levels affects the
ecological health of the ACF River Basin. We are studying how natural variation and human
economic water needs change the integrity of the surrounding ecological system. We want to
understand how ecological vulnerability changes throughout the year, both due to climatic
conditions and human use.
RQ1: How do stream flows vary in the ACF River Basin?
RQ1: Are key indicator species most vulnerable during times of peak water use?
RQ2: Which species are most vulnerable to decreased stream flows from irrigation?
RQ3: If and when does agricultural water demand overlap with ecological sensitive
periods of time within the ACF river basin?
ACF River Basin Background
The Chattahoochee River drainage covers an area of 8,770 square miles and is the most
heavily used water resource in Georgia. Its headwaters begin at the southern edge of the Blue
Ridge Mountains at an altitude above 3,000 feet and flow 430 miles to its confluence with the
Flint River. The Chattahoochee River provides drinking water for more than half of all
Georgians and recreation for more than 25 million people each year. The Chattahoochee and
Flint Rivers are part of the larger Apalachicola-Chattahoochee-Flint River Basin, which flows
through the states of Georgia, Alabama, and Florida. The Flint River is approximately 350 miles
long and drains an area of 8,460 square miles. Most of the larger tributaries in the ACF River
Basin are located in the lower reaches of the Flint River Basin.
The ACF river basin has greatly been affected by population growth, urbanization, an
influx of industry’s relocating to the state, increased water demands, and changes in the land
cover. Populations within the metropolitan Atlanta area increased 97% from 1970 to 1995, and
have continued to increase over the last two decades, growing 26% since 1990. Growth of
industry and urban areas around the state has increased the overall population of Georgia 34%
since 1990 to approximately 500,000 people.
Stream flow, or discharge, is the volume of water moving past a cross-section of a stream
over a set period of time. It is usually measured in cubic feet per second (cfs). Stream flow in the

ACF is affected by the amount of water within a watershed, increasing with rainstorms, and
decreasing due to drought, evaporation, and use. Flow is also important because it defines the
shape, size and course of the stream. It is integral not only to water quality, but also to habitat.
Food sources, spawning areas and migration paths of fish and other wildlife are all affected and
defined by stream flow and velocity. Velocity and flow together determine the kinds of
organisms that can live in the stream (USEPA, 1997).
Human impacts also affect stream flow, such as changes in land cover, especially
impervious land cover, building dams, pollution and waste disposal, and demands on surface
water and groundwater withdrawals.
Stream Flow
Stream flow data from USGS. Stream flow is measured in units of cubic feet per second (cfs) flowing past a point.
Chattahoochee River (Columbus, GA)
Flint River (Newton, GA)
Drainage Area (square miles) 8,770 8,460 Min Daily Flow (cfs) 252 863 Mean Daily (cfs) 5,490 4,080 Max Daily (cfs) 150,000 100,000 Years of Collection 2002-2009 2002-2009
Impervious surface change in acres from 1991 to 2005 1991 2001 2005
455,621 acres 670,116 acres 824,250 acres
Increase from 1991 to 2001: 214,495 acres 47.08% increase
Increase from 2001 to 2005: 154,134 acres 23.00% increase
Increase from 1991 to 2005: 368,629 acres 80.91% increase

2005 land cover statistics
ACF Watershed Totals ACF Total
Acres: 7,551,798Hectares: 2141294Square Miles: 9,742Square Kilometers: 26,575Beaches, Dunes, Mud 231Open Water 204,218Low Intensity Urban 836,027High Intensity Urban 173,398Clear-cut, Sparse 685,325Quarries, Strip Mines, Rocks 8,165
Deciduous Forest 1,700,326 Evergreen Forest 2,123,684 Mixed Forest 426,467 Row Crops and Pasture 2,397,183 Forested Wetland 703,274 Non-forested Wetland-Salt 0 Non-forested Wetland-Fresh 10,209
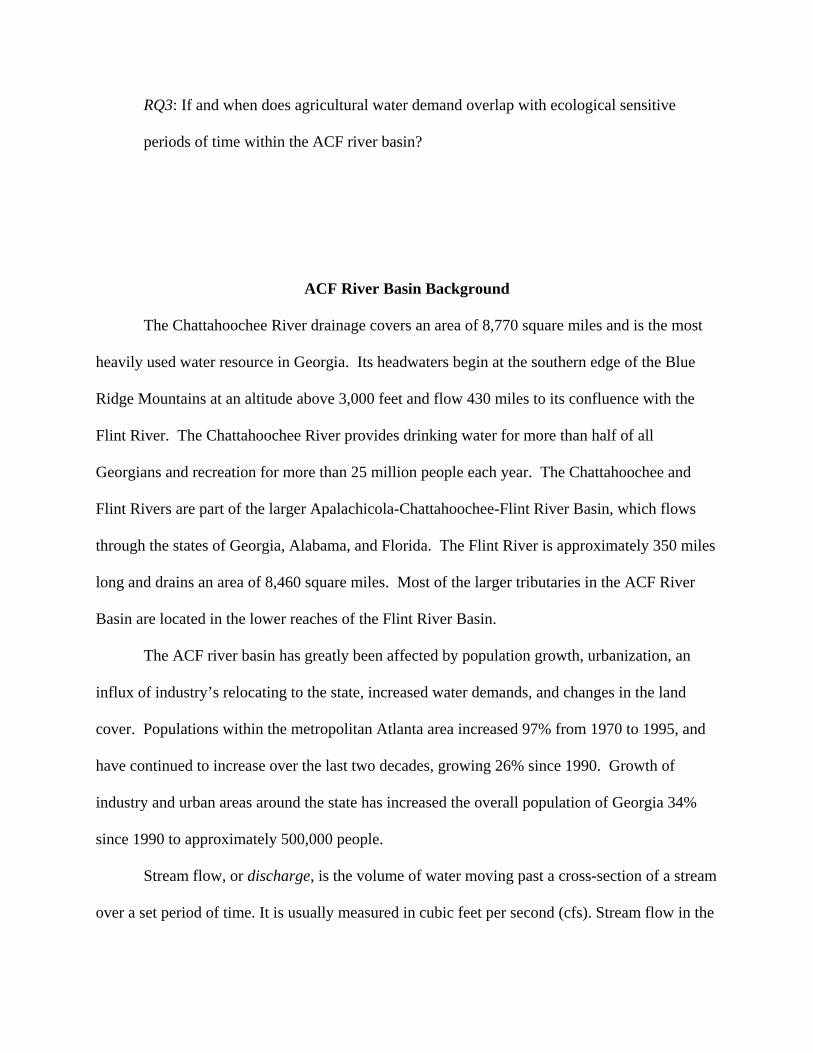
Impoundments in the Apalachicola-Chattahoochee-Flint River Basin
Dams constructed by the U.S. Army Corps of Engineers have created large
impoundments for flood control, water supply, power, and commercial navigation in the ACF
River Basin. Thirteen of 16 mainstream dams in the ACF River basin are along on the
Chattahoochee River (Congressional Research Service, 2007). Over most of its length,
hydroelectric plants release water for production of hydropower and control the flow. Dam
construction in the basin began in the early 1800s on the Chattahoochee River above the Fall
Line at Columbus, Ga., to take advantage of natural elevation gradients for power production.
During low flow periods, stored water is used to supplement the discharge of the river. There

have been marked decreases in the frequency of high and low flows since the start of operation
of Buford Dam in 1956, and river flows fluctuate daily below the reservoirs along the
Chattahoochee River. Lake Lanier provides 65 percent of the water storage to regulate flows,
yet it drains only 5% of the ACF River basin.
Two hydropower dams located on the Flint River impound run-of-the-river reservoirs and
do not appreciably influence the monthly flow of the Flint River. The Flint River is one of only
42 free-flowing river reaches longer than 125 miles remaining in the contiguous 48 states
(Congressional Research Service, 2007). See Figure 1 for ACF dams and power plant locations.
Congress first authorized construction of federal facilities for water resources
development of the ACF River basin in 1946. The Army Corps of Engineers operate five dams –
four on the Chattahoochee River and one on the Apalachicola River at the confluence of the
Chattahoochee and Flint Rivers. Four of these dams provide water storage. The most water is
stored behind Buford Dam that forms Lake Lanier, providing 62% of the Army Corps’ of
Engineers storage capacity in the ACF River Basin. The Army Corps of Engineers have
contracts with local interests for municipal and industrial water supply storage space at Lake
Lanier. Lake Lanier provides the ten heavily population counties around Atlanta with 72% of
their water supply. The other dams that provide water storage include West Point, W. F. George
and Woodruff. These facilities and other non-federal dams in the ACF River Basin also have
hydroelectric capabilities. The fifth federal dam, Andrews Dam, is operated for navigation.
The four largest reservoirs along the Chattahoochee River:
Area Shoreline Lake Lanier 38,000 acres 540 miles West Point Lake 25,900 acres 525 miles Lake Walter F. George 45,180 acres 640 miles Seminole (Woodruff) 37,500 acres 500 miles
Figure 1: Location of power plants and dams in the ACF River Basin; adapted from a Army Corps of Engineers map from http://www.sam.usace.army.mil/.
Groundwater
The headwaters of the Chattahoochee and Flint Rivers occur north of the Fall Line in the
Blue Ridge and Piedmont Provinces (Loeffler & Meyer). Water supplies in the headwater region
derive primarily from surface waters. South of the Fall Line are several aquifers, including the
Providence aquifers and upper Cretaceous strata. The Providence aquifers consist of sand and
gravel that are separated by clay and silt beds. The lower reaches of both rivers are part of the
Floridian aquifer system (Loeffler & Meyer). These groundwater sources are some of the most
productive in the world.
On the other hand, the aquifers in the Piedmont and Blue Ridge Provinces have a much
lower yield. Reported yields of wells in the rocks range from zero to 471 gallons per minute,
although they are usually less than 50 gallons per minute (Environmental Protection Division,
1997).
Rivers and streams in the Coastal Plain Province commonly are deeply incised into
underlying aquifers and receive substantial amounts of groundwater discharge. Rock layers
associated with the Floridian aquifer system are exposed along sections of the Apalachicola
River, Chattahoochee River, Flint River, and Spring Creek (Couch, Hopkins, & Hardy, 1996).
Due to the hydraulic connection between the Floridian aquifer system and the Flint River,
groundwater discharge contributes more significantly to stream flows in the Flint River than in
the Chattahoochee River; aquifer discharge to the Chattahoochee River is one-fifth of the amount
that discharges to the Flint River (Couch, Hopkins, & Hardy, 1996).
Groundwater depletion is a major issue associated with groundwater use. It occurs after
long periods of sustained and excessive use of an aquifer, mainly for agricultural purposes
(http://ga.water.usgs.gov). A few of the negative effects of groundwater depletion: drying up of

wells, reduction of water in streams and lakes, deterioration of water quality, increased pumping
costs, and land subsidence (http://ga.water.usgs.gov). Negative effects of groundwater depletion
are a lowering of the water table, increased costs of water, land subsistence, deterioration of
water quality, and a reduction of water in streams and lakes (http://ga.water.usgs.gov).
The Hydrologic Interaction between Groundwater and Surface Water While considering the future research of hydrological withdrawals in conjunction with
agricultural sustainability and environmental health, it is important to note the relationship
between groundwater and surface water. Aquifer withdrawals made north of the Apalachicola-
Chattahoochee-Flint River basin, especially during years of low precipitation, can imply
hardships not only for future farmers but also for continued ecological health and productivity in
the ACF basin. Since groundwater withdrawals lag behind stream flows, data collected from
USGS points in real time may not indicate simultaneous aquifer withdrawals. Therefore, low
stream flows may not only reflect periods of low precipitation, but also former ground water
withdrawals. Understanding the dynamic relationship between ground and surface water is vital
to implementing effective water policy in Georgia.
In order to analyze the specific effect ground water has on stream flow, it may be
necessary to update aquifers with new tracking systems. Several precipitation-runoff models
have been created to gauge the effect of water usage, one of which was tested as a type of
FORTRAN precipitation runoff model (STRMDPEL) to analyze flows in Massachusetts’
Ipswich River. The program is successfully and easily collecting and storing real-time data
specific to the Ipswich River and has, since its debut, been installed elsewhere in the country
(Zarriello, 2001). These systems can monitor individual pumping wells and simultaneously
monitor time variance affecting nearby channels. This program may be a valuable tool in

monitoring water use specific to ground withdrawals. This is important to future water
management as a means of detailing where communities can effectively time aquifer
withdrawals in respect to breeding patterns of key native species, reducing ecological damage.
Since the popularity of center pivot irrigation systems took hold of the Flint River Basin
in 1975, this basin has seen a decrease in stream flows between 40 – 46%, with no significant
change in rainfall (Rugel et al. 2009). Collecting data specific to ground water may bring
attention to actual usage and help reduce withdrawals. With the installation of monitoring
systems in Georgia’s pumping wells and aquifers, hydrologists and policy makers may be well-
informed to better manage our streams and river systems, allowing for prosperous crop yield in
the future at no expense to local river basins and ecological systems.
Precipitation in Georgia
Average annual rainfall in the FRB ranges from 48-54 in/yr (Fig. 5). Most of this falls
between early November and mid-April, although frontal rainfall, convective storms in late
spring through fall, and tropical storms can add significantly to annual rainfall totals (Couch,
McDowell, 2006). Droughts are also normal aspects of Georgia’s climate. Droughts lasting more
than two years in Georgia have occurred during the following years: 1708- 1709, 1714-1715,
1756-1760, 1762-1764, 1797-1802, 1844-1845, 1839-1840, 1855-1857, 1896-1899, 1925-1927,
1914-1915, 1954-1956, 1998-2002, 2006-2007 (Stooksbury, 2003). From 1952 to the late
1980’s, southwest Georgia had an accumulating rainfall deficit of as much as 60 inches
(GAEMN, 2005). Analysis of rainfall patterns over the last 50 years indicates that rainfall
patterns have been changing slightly, and that from April to September, which corresponds to the
main agricultural growing season, monthly rainfall totals have declined slightly (Couch,
McDowell 2006).

Figure 2: Aquifer regions in the ACF River Basin; Couch, C. A., Hopkins, E. H., Hardy, P. S. (1996). Influences of environmental settings on aquatic ecosystems in the Apalachicola-Chattahoochee-Flint River Bain. Atlanta, GA: U.S. Geological Survey.

Figure 3: Land resource regions of the ACF River Basin; Couch, C. A., Hopkins, E. H., Hardy, P. S. (1996). Influences of environmental settings on aquatic ecosystems in the Apalachicola-Chattahoochee-Flint River Bain. Atlanta, GA: U.S. Geological Survey.

Physiography
Figure 4: Physiography of the ACF River Basin; Couch, C. A., Hopkins, E. H., Hardy, P. S. (1996). Influences of environmental settings on aquatic ecosystems in the Apalachicola-Chattahoochee-Flint River Bain. Atlanta, GA: U.S. Geological Survey.
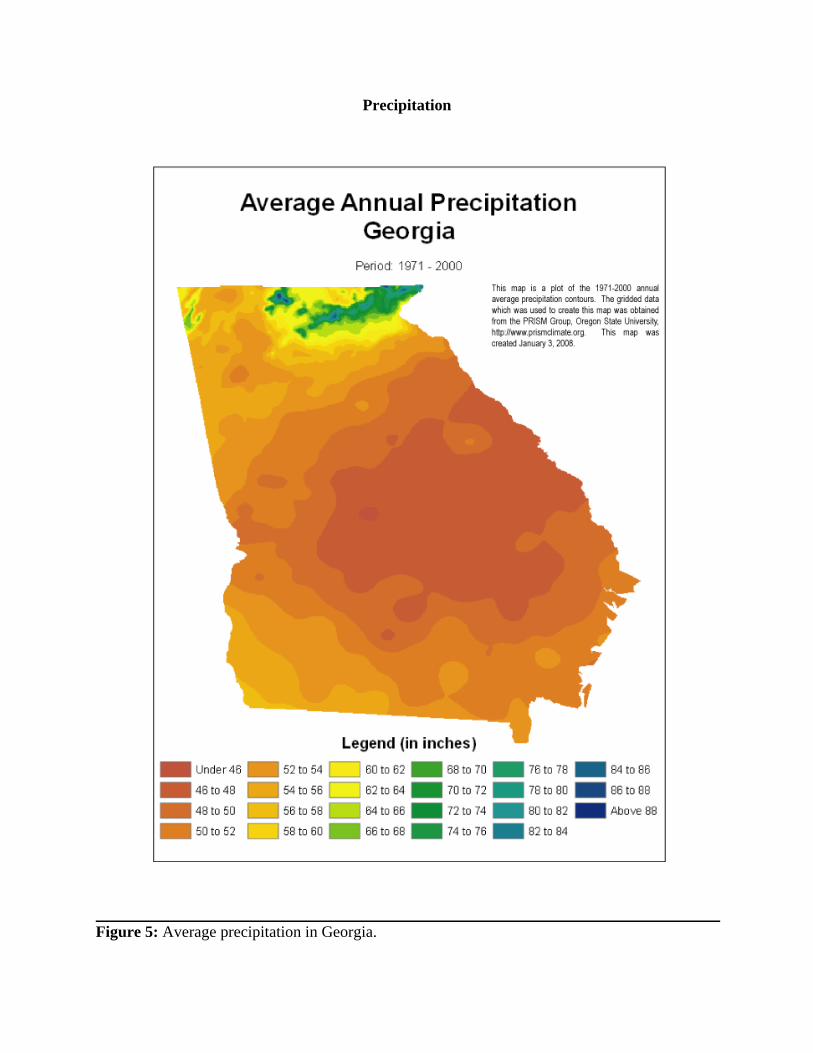
Precipitation
Figure 5: Average precipitation in Georgia.

Threats to Stream Ecological Health
Agricultural activities threaten fish populations, primarily through run-off of sediment,
nutrients, and pesticides. According to the Georgia Department of Natural Resources, these
impacts are most extreme in areas where agricultural practices occur next to stream banks and
when livestock are given access to streams for watering. Sedimentation, which can also result
from forestry practices and construction activities, is an almost ubiquitous problem in Georgia
streams (http://www.gadnr.org/). Suspended sediment decreases water clarity and interferes with
sight-feeding and other visually oriented aquatic animal behaviors (Blann, Anderson, Sands, &
Vondracek, 2009). For example, fish display territorial messages and mussels use lures to attract
their fish hosts. Sediment also fills in the spaces between larger rocks, eliminating habitats used
for spawning, feeding, and shelter. The Georgia Department of Natural Resources warns that
nutrient pollution from such sources as fertilizer runoff and animal waste can lead to algal
blooms, which in turn may affect water clarity, oxygen levels, and also the health of aquatic
plants that are beneficial to fishes. Cattle access points contribute to sedimentation and nutrient
pollution as well. Healthy river ecosystems also require a forest buffer. Forests provide shade,
filter runoff into the stream, give habitat to wildlife, and provide food sources of aquatic insects
(http://www.gadnr.org/).
Depending upon the size of the operation and its location, forestry operations may
negatively impact streams and its aquatic wildlife (Blann, Anderson, Sands, & Vondracek,
2009). Mechanisms of impact include sediment runoff associated with vegetation removal, soil
disturbance from forestry equipment, and stream bank destabilization from poorly designed
stream crossings (http://www.gadnr.org/). Additionally, the removal of trees from sensitive

habitats such as cypress swamps, floodplains, or other wetlands contributes to sedimentation and
increases in water temperature (http://www.gadnr.org/).
In the Piedmont region, the health and diversity of fish communities are best in
watersheds with adequate forests, followed by streams draining watersheds dominated by poultry
and suburban areas (Frick et al., 1998). Urban areas can severely degrade streams and the
ecological health of an entire watershed (Fitzhugh & Richter, 2004). The adverse effects on
watershed health in urban areas include high storm flows, degraded habitat, and the presence of
chemical contaminants such as insecticides (Frick et al., 1998).
Although urban and suburban land use accounts for only 5% of the ACF River Basin, it
has the most important effect on stream-water quality (Frick et. al., 1998). The intensity of
negative water quality varies in proportion to measures of urbanization, such as impervious area,
population density, and industrial and transportation land use (Fitzhugh & Richter, 2004).
Additionally, the use of nutrients and pesticides further degrade water quality of streams as urban
land use increases within a watershed. Watersheds in the Piedmont with higher population
densities generally are drained by streams dominated by a few species of pollution-tolerant,
mostly non-native fishes (Frick et al., 1998). Invasions of non-native, pollution-tolerant fish
species can indicate poor biological conditions and potentially poor water quality (Dick,
Platvoet, & Kelly, 2002; MacNeil & Briffa, 2009).
In the Coastal Plain of the ACF River Basin, cropland in upland areas is separated from
streams by relatively undisturbed riparian wetland habitats. This contrasts the extensively
farmed areas of the United States where wetlands have been drained, channelized or filled, which
leaves few riparian buffers between cropland and streams. Several water quality implications
can partially be attributed to these wetland buffer areas. Firstly, these streams have fewer

pesticides present in the water and lower pesticide and nutrient concentrations than in other areas
of the nation (Frick et. al., 1998). Secondly, there are lower nitrate concentrations in ground
water underlying the forested flood plains than in ground water underlying cropland. Finally,
fish communities are not as disturbed during large fluctuations in stream flows (Frick et. al.,
1998).
Indicator Species
Several different species of insects, fish, and mussels were selected as biological
indicators of ecological sensitivity to stream flows in the ACF River Basin. These organisms
were selected for their interdependence on each other for survival and their sensitivity to changes
in water quality and environmental habitat. Below are descriptions and reasoning behind each
indicator species.
Fish
Two fish in the genus Percina, the Halloween Darter (Percina crypta) and Blackbanded
Darter (Percina nigrofasciata), were chosen as indicators of the health of the ACF watershed
aquatic ecosystem. They are endemic to the Chattahoochee and Flint River systems of the
Apalachicola River drainage, and have a high sensitivity and response to chemical, physical, and
biological changes within the stream environment. The health of fish communities can change
with fluctuations in stream flows, increases in sedimentation, decreases in aquatic insects, and
decreases in dissolved oxygen, among other factors. A brief description of habitat, life cycle,
diet, and breeding requirements for each fish is detailed below.
Halloween Darter
The Halloween darter was discovered by Dr. Mary Freeman, an ecologist with the U.S.
Geological Survey and the UGA Odum School of Ecology (Jimenez, 2009). The Halloween
darter grows between two to five inches. The fish received its common name because males and
females develop a bright orange band on their front fins during breeding season in the late
spring. The darter’s other fins are banded with bright orange stripes.
Formally called Percina crypta, the Halloween, darter inhabits relatively swiftly flowing
shoals over bedrock or a mixture of coarse (boulder to gravel) bed sediments (Hill, 1996;
Marcinek, 2003). The Halloween darter consumes aquatic insect larvae, including mayflies and
caddisflies. The darter has been observed to spawn during April and May. Juvenile darters less
than one and one-half inches long live in stream shoals, but they grow to half of their adult size
by October. The Halloween darter reaches sexual maturity after one year, and researchers have
estimated the fish can live up to three years (Freeman, Freeman, Burkhead, & Straight, 2008).
The Halloween Darter is found in the ACF River Basin where it occurs in the Flint River
system and the Chattahoochee River system (Jimenez, 2009). Within the Flint River system, the
darter has been documented in the Flint River below and above the Fall Line, and in four
tributary stream systems. In the Chattahoochee River system, P. crypta is known from two
broadly separated areas, the first being the upper portion of the system in Georgia upstream from
Lake Lanier, and from the Uchee Creek system, and the second being an Alabama tributary that
enters the Chattahoochee River (Couch et al,. 1996). The darter’s fragmented habitat is believed
to be due to pollutants from Atlanta, removal of shoal environments within the river, and the
building of the 13 dams within the freshwater rivers of Georgia (Freeman, Freeman, Burkhead,
& Straight, 2008).
Blackbanded Darter:
The blackbanded darters are another small fish similar in size to the Halloween darter.
Unlike the Halloween darter, the blackbanded darter’s appearance is extremely variable and

appears to be strongly influenced by the surrounding habitat (Mettee, 1996). Most individuals
have up to 15 elliptical bars, crossing their light green, brown or tan sides. The darter’s fins are
normally transparent, but they change during the spawning season. Breeding males further
undergo coloration changes by developing green or blue colors in their body (Mettee, 1996).
The blackbanded darter has a large range in the Southeast, occurring throughout the
Mobile basin and coastal drainages in Alabama and the Piedmont region in Geogia. The darter
lives in a variety of habitats, usually in the gravel or sand of rivers (Crawford, 1956). It spawns
earlier than many fish species, as males begin the reproductive process beginning in late
February or early March when the water temperature rises from 10 C to 12 C. The spawning
season continues through July. On the other hand, most females prepare to spawn in late March
into April. By the end of May, most females have fertilized their eggs. While pregnant, the
female fish are highly susceptible to disturbances in their environments. By late June, all males
and females have spawned (Mathur, 1973). The blackbanded darter feeds on small
macroinvertebrate insects, including midges, blackflies, mayflies, and caddisfly larvae.
Insects
Mayflies and stoneflies were chosen because they are important insects to support
fisheries in the ACF River Basin. Mayflies and stoneflies are also extensively used as indicators
of pollution and environmental change. Adult insects and nymphs are a source of food for many
freshwater fish, making both an important link in the food chain.
Stoneflies
Stoneflies, known as plecoptera, are a diverse group of insects that are primarily
associated with clean, cold running waters. Stoneflies have been used for biological indicators
for river quality in past studies (Krno & Holubec, 2009). They are rather primitive insects and
may have been among the first insects to develop flight (Marden & Kramer, 1994). Stonefly
nymphs are found in a wide variety of habitats, from small to moderate-sized streams and rivers.
Stonefly nymphs usually live in leaf packs and riffle areas of streams, where rocks, gravel, and
woody debris provide hiding places and cover. Stonefly nymphs are predators that stalk their
prey on the river bottom. However, young stonefly nymphs feed on organic deitrus before
gradually shifting to predation on other macroinvertebrates as they mature. Predatory nymphs
commonly feed on other aquatic insects, such as midges, mayflies, caddisflies.
Stonefly diversity declines quickly from human disturbance (Krno & Holubec, 2009).
Stoneflies emerge from the water as adults to mate, locating each other by drumming with their
abdomens. The adults have been reported to emerge in May to July (Snellen & Stewart, 1979;
Stark et al., 1998). In Florida, Stark & Gaufin (1978) reported the emergence from April to
August (Pescador et al., 2000).
In our index, we have chosen the genus perlesta banks. This genus emerges from April
through August throughout most of the Eastern United States (Stark & Gaufin 1978).
Mayflies
Mayflies are susceptible to changes in water quality such as temperature and pollution.
Southeastern researchers have used mayflies, along with other benthic macroinvertebrates, to
measure the health of river ecosystems (Barbour et al., 1996; Lenat, 1993). Belonging to the
order ephemeroptera, mayflies are small- to medium-sized insects found near rivers and lakes
found throughout the ACF River Basin (http://www.sherpaguides.com). Mayflies live most of
their lives as nymphs in the stream. When they emerge as adults to mate, they live for only a few
days before dying.

Mayfly nymphs are common in muddy river bottoms throughout North America
(http://www.sherpaguide.com). Nymphs live in shallow burrows in muddy areas or near the
river margin, although their habitats vary greatly depending on species (University of California
Museum of Paleontology). They beat their feathery gills to circulate water and dissolved oxygen
into their burrows. Nymphs feed by filtering silt or mud for organic matter and microbes. When
the river’s temperature rises to the proper level, nymphs swim to the surface to emerge as winged
adult mayflies. Ten of thousands of mayflies can transform at one time to mate (Flecker, Allan,
& McClinktock, 1988). The new adults mate almost immediately in flight as they fly in large
swarms. Swarming may take place over the water itself, over the shore area, or even away from
the water. The time of swarming varies considerably, although dusk is the most common time of
day in temperate regions.
After mating, females deposit eggs directly on the water surface, under rocks or in debris
in the stream. The eggs sink to the river bottom where they will hatch and begin the next
generation of burrowing mayflies (University of California Museum of Paleontology). The
nymphal life span in mayflies varies, ranging for a few weeks to several years. Most nymphs
hatch at temperatures in the range of 3 C to 21 C, although nymphs hatch at different
temperatures by species (http://www.sherpaguides.com).
Mayflies will emerge at different times between spring and summer. Based on larval size
distributions, there are three emergence periods: Cohort 1 – March through May; Cohort 2 – late
June; and Cohort 3 – late September-early October (Johnson et. al., 2000). During the late
summer months, larval growth slows compared to spring and fall. Larvae of the largest size
class (10.5–10.9 mm) are most common during the first emergence period (Johnson et al., 2000).

Emergence is a critical period for mayflies, since this is when they breed. However,
mayfly nymphs can be adversely affected by pesticides, polluted water, and non-native predators
(Palmquist, Jepson, & Jenkins, 2008; Love, Taylor, & Warren, 2005). Some research even
suggests that reproductive success for mayflies may depend on the size of mayfly nymphs (Love,
Taylor, & Warren, 2005). Water regulation, such as dams, for water supply and power can have
profound effects on mayfly communities. In reservoirs, still water conditions can reduce mayfly
diversity (Crankshaft). Furthermore, loss of habitat and reduction in connectivity between
freshwaters is becoming a more pressing threat to mayflies.
Mollusks
According to the Georgia Department of Natural Resources, the freshwater mollusks in
Georgia are one of the most diverse and abundant found anywhere in the world. However,
freshwater mollusks are an imperiled group of animals and many efforts have been taken to
confront mussels dying off (Butler & Hartfield, 2006). Researchers think the primary cause for
species loss could be increased water demands by people and alterations to natural river habitats
(Gollady, Gagnon, Kearns, Battle, & Hicks, 2003). Mussels are important because they are one
of the most sensitive indicator species occurring in the ACF River Basin. Furthermore, the ACF
River Basin has several endangered species of mussels (Golladay, Gagnon, Kearns, Battle, &
Hicks, 2003). While many fish can move away from polluted stretches of rivers and streams,
mussels will remain until they can no longer survive. However, mussels have complex life
cycles, making re-colonization difficult in restored waters. In Georgia, mussel species richness
has been found to vary with average channel depth, forest cover and drainage network position
(Gagnon, Michener, Freeman, & Box, 2006). They are also a vital food source for certain fishes
and mammals, including otters, muskrats, and raccoons (http://www.gadnr.org/).

The majority of mussel species live in streams or rivers, although a few species live in
lakes as well. Mussels can survive in a variety of streambeds, but most species prefer a mixture
of sand, gravel and cobble. Adult freshwater mussels feed by filtering food particles – including
algae and bacteria – from the water (http://www.georgiaencyclopedia.org). They collect the food
particles by siphoning them through their entire body cavity.
Many mussel species release sperm into the water, which is carried by water currents to
female mussels (Storer, 1951). Female mussels then can capture the free-floating sperm in a
similar manner to their feeding behavior. The mussel’s eggs are fertilized in its body cavity,
where the mussel larvae can safely grow (http://www.georgiaencyclopedia.org).
The U.S. Fish and Wildlife Service recognizes 14 distinct threatened or endangered
mussel species in Georgia. Several of these species live in the ACF River Basin, including the
oval pigtoe and the shiny-rayed pocketbook.
The oval pigtoe’s reproductive season goes from May to late July (Baker, 1928).
Likewise, shiny-rayed pocketbooks release their mussel larvae from late May through mid-July
when water temperatures fluctuate from 20 C to 23.5 C.
Mussels have an odd patristic relationship with during their beginning stages of life.
Mussel larvae, called glochidia, require a period of parasitism on the gills or fins of a fish.
Glochidia reach the host species in two manners. The first option is for the female mussel to
release the larvae into the water column (http://www.georgiaencyclopedia.org). Once the
glochidia reach a potential host fish, they latch onto the fish’s gills or fins. The second method
is for the female mussel to trick a fish by displaying a lure. These displays mimic a specific
type of food eaten by the target fish to ensure the mussel larvae will develop into a juvenile
mussel. For several weeks or months, the mussel larvae draw nutrients from their fish host.
After progressing to a more mature state, the juvenile mussels free themselves from the fish to
live on the river bottom (http://www.georigaencyclopedia.org).
Freshwater mussels are sensitive to pollution, sedimentation, and other human-induced
habitat alterations (U.S. Fish & Wildlife, 2006). Historically, the primary factors leading to the
decline of mussels and snails in Georgia were the construction of dams; dredging; in-stream sand
and gravel mining; deforestation; and pollution. Sedimentation, further dam construction, and
urbanization continue to degrade or eliminate mussel habitat (U.S. Fish & Wildlife, 2006).
Decreased water flow caused by drought and withdrawal of water from streams and rivers poses
a threat to the survival of many species of mussels.
Data Analysis and Results
ACF watershed data for groundwater, surface water, and water quality was collected from,
USGS water resources for the United States web resource pages.
Agricultural water use data was obtained from the ground water and surface water
supplied systems from the U.S. Geological Survey. We also obtained data on typical year
irrigation application depths (inches) expected for monthly irrigation across all crop types for
sub-basins of the Lower Flint. Data were derived from observations of the Ag Water Pumping
program from 1999 through 2004 (Hook & Harrison, 2005).
Average monthly irrigation applications are influenced by the proportion of wet and dry
years. Based on the data collected over the six years of observations, there was variation in the
precipitation amounts that affected agricultural irrigation withdrawal amounts. The years 1999,
2000, and 2002 had dry summers, whereas 2003 was a wet summer. Both 2001 and 2004 were
more normal summers in terms of precipitation. These monthly averages are offered as the
typical irrigation scenario for each sub-basin.

Our indicator species ecological sensitivity index was based on the biological
reproduction periods of each species. Our index assumes species are at their ecologically
sensitive peak during primary reproductive months when species are spawning or during the
emergence of reproductive adults. Sensitivity is arbitrarily denoted by 0 = No sensitivity; 100=
Sensitivity (Peak breeding time). These periods are critical for the chosen species to successfully
complete their life cycle. As noted previously, the species were chosen due to their being good
indicators of water quality and overall watershed health. Since water withdrawals from surface
and ground water throughout the ACF River Basin have effects on the entire watershed and its
health, it is important to document during which months high water demand and water use
overlaps with the high ecological needs of the watershed flows and its inhabitants.
0
20
40
60
80
100
120
0 2 4 6 8 10
Timeline of Ecological Sensitivity of Indicator Species
12Blackbanded Darter Stoneflies Mayflies
Round Pigtoe Shiny Pocketbook Halloween Darter
Figure 6: Timeline of Ecological Sensitivity of Indicator Species; X-axis denotes months 0-12, (January-December). Y-axis; Ecological sensitivity is based on a (0 -100) index.
The following stations were included in the stream flow analysis:

Station Descriptions
02334430 Chattahoochee River at Buford Dam near Buford, GA 02334480 Richland Creek at Suwanee Dam Road Near Buford, GA 02334578 Level Creek at Suwanee Dam Road near Suwanee, GA 02335000 Chattahoochee River near Norcorss, GA 02335350 Crooked Creek near Norcross, GA 02335815 Chattahoochee River below Morgan Falls Dam, GA 02336030 N.F. Peachtree Creek at Graves Road near Doraville, GA 02336120 N.F. Peachtree Creek Buford Highway near Atlanta, GA 02336490 Chattahoochee River at GA 280, near Atlanta, GA 02336635 Nickajack Creek at US 78/278, near Mableton, GA 02336968 Noses Creek at Powder Springs Road, Powder Springs, GA 02337170 Chattahoochee River near Fairburn, GA 02338000 Chattahoochee River near Whitesburg, GA 02338523 Hillabahatchee Creek at Thadton Road, near Franklin,GA 02338660 New River at GA 100, near Corinth, GA 02346310 Potato Creek at County Line Road, near Orchard Hill, GA 02347500 Flint River at US 19 near Carsonville, GA 02351500 Muckalee Creek near Americus, GA 02352500 Flint River at Albany, GA 02354800 IchawayNochaway Creek near Elmodel, GA 02355662 Flint River at Riverview Plantation, near Hopeful, GA 02358000 Apalachicola Rier at Chattahoochee, FL Station graphs are listed by ID number, x-axis is month, Y-axis is cubic feet of water
Mathmatica software package was used to create the ecological sensitivity, surface flow,
agricultural withdrawal, and overlay graphs. Station (2352500) and (2355662) use lower-flint
Ag-use data, and (2354800) uses Ichaway-Nochaway Ag-use data. X-axis data is consecutive
months for 6 years, (1-72): January-December, Y-axis flow scale. (Derivatives were calculated
using the central difference formula in Mathematica. Central difference is f'( x ) approximately
equals (f(x+h) - f(x-h))/2h, and has an error bound of O(h^2)... which means on order of h^2...
http://math.fullerton.edu/mathews/n2003/differentiation/NumericalDiffProof.pdf)
Graphs below are identified by the site Id, and the indicator species used for comparison.

0 10 20 30 40 50 60 700
10000
20000
30000
400002352500 : Halloween_Darter
Figures 7: Flint River at Albany GA. X-axis is months, Y-axis is surface flow scale. Green is agriculture groundwater use (application depths in inches); Purple agricultural surface water use; Red is ecological sensitivity; Blue is stream flow (cfs); All data is multiplied by max flow to scale. .

0 10 20 30 40 50 60 700
10000
20000
30000
400002352500 : Blackbanded_Dart er
Figures 8-24: 2352500- Flint River at Albany, GA. 02354800-IchawayNochaway Creek near Elmodel, GA. 02355662- Flint River at Riverview Plantation, near Hopeful, GA Green is agriculture groundwater use (application depths in inches); Purple agricultural surface water use; Red is ecological sensitivity; Blue is stream flow (cfs); All data is multiplied by max flow to scale. .

Figure 9:
0 10 20 30 40 50 60 700
10000
20000
30000
400002352500 : Stoneflies
Figure 10:
0 10 20 30 40 50 60 700
10000
20000
30000
400002352500 : Mayflies
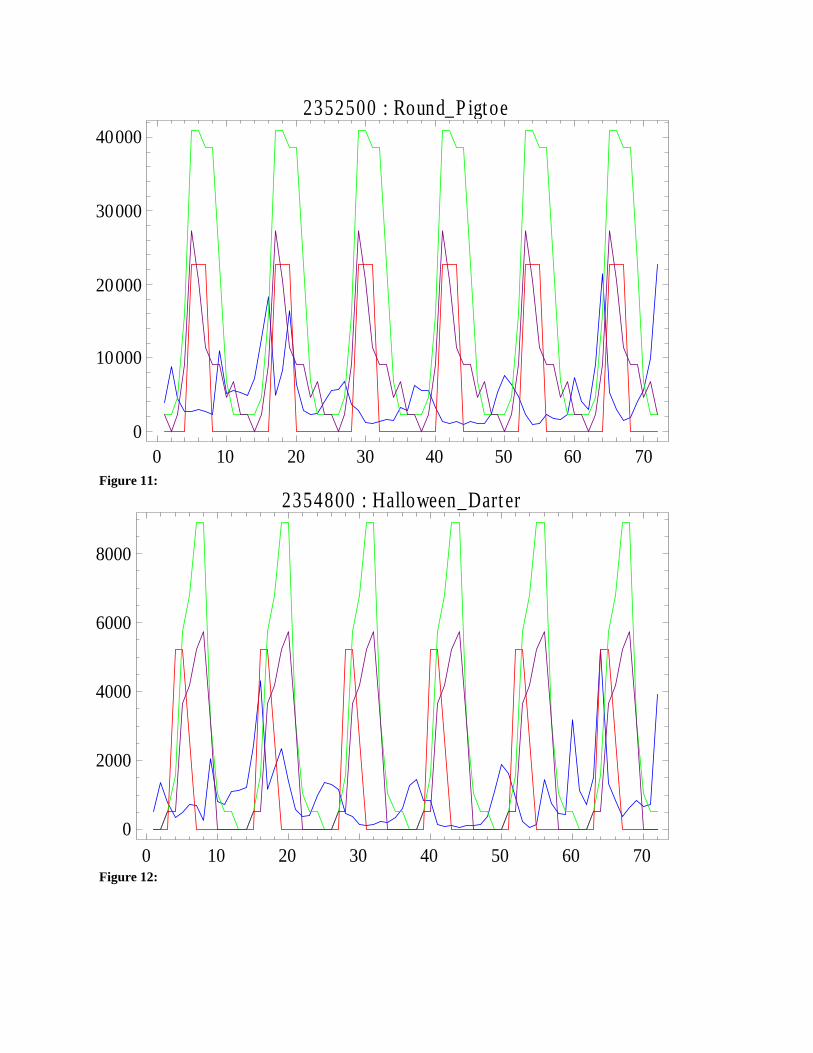
Figure 11:
0 10 20 30 40 50 60 700
10000
20000
30000
400002352500 : Round_P igtoe
Figure 12:
0 10 20 30 40 50 60 700
2000
4000
6000
8000
2354800 : Halloween_Dart er

Figure 13:
0 10 20 30 40 50 60 700
2000
4000
6000
8000
2354800 : Blackbanded_Dart er
.
Figure 14:
0 10 20 30 40 50 60 700
10000
20000
30000
400002352500 : Shiny_P ocketbook

0 10 20 30 40 50 60 700
2000
4000
6000
8000
2354800 : Stoneflies
Figure 15:
0 10 20 30 40 50 60 700
2000
4000
6000
8000
2354800 : Mayflies
Figure 16:

0 10 20 30 40 50 60 700
2000
4000
6000
8000
2354800 : Round_P igtoe
Figure 17:
0 10 20 30 40 50 60 700
2000
4000
6000
8000
2354800 : Shiny_P ocketbook
Figure 18.

0 10 20 30 40 50 60 700
10000
20000
30000
40000
50000
2355662 : Halloween_Darter
Figure 19:
0 10 20 30 40 50 60 700
10000
20000
30000
40000
50000
2355662 : Blackbanded_Dart er
Figure 20:

0 10 20 30 40 50 60 700
10000
20000
30000
40000
50000
2355662 : Stoneflies
Figure 21.
0 10 20 30 40 50 60 700
10000
20000
30000
40000
50000
2355662 : Mayflies
Figure 22:

0 10 20 30 40 50 60 700
10000
20000
30000
40000
50000
2355662 : Round_P igtoe
Figure 23:
0 10 20 30 40 50 60 700
10000
20000
30000
40000
50000
2355662 : Shiny_P ocketbook
Figure 24:

Figure 25: 3-D Species sensitivity index. X-axis is 6 year monthly span, Jan-Dec; Y-axis is scale (0-1) 0=No sensitivity, 1=Sensitivity; Z-axis are the species numbered (1-6).
Figure 26: 3-D Surface water flows for each of the 22 stations selected.
As can be seen in figures 7-24, there is a very high correlation between ecological sensitivity and
water demand during the late spring into summer. Each species has different environmental
requirements for reproduction that vary depending on location, and some species have multiple
periods of sensitivity where others have only a short window of sensitivity. Using GIS software
to plot the position of specific species and corresponding stream flow statistics at particular
stations throughout the ACF river basin will enable us to get much better ecological impact
results compared to water use needs at each location. This will help us pinpoint ecological “hot

spots” where water demands have the greatest negative effects on the stream ecosystems, and
identify other areas where water demand has little affect on stream ecosystems. Analysis of the
3 stations in the lower Flint river basin provide a good “enough” picture of the type of
agricultural water demand in these areas, and its high correlation to reproductive time frames for
many river basin inhabitants. Agriculture groundwater withdrawals are much greater than Ag
surface water withdrawals, and since groundwater withdrawals have a delayed effect on stream
flow, they most likely have the greatest impact in the late summer months, rather than the spring
and early summer. This project needs to establish an accurate groundwater lag period for affects
on stream flow to make a conclusive determination about overlap of water use and ecological
needs.
Conclusions
Our project looks into how variation in stream flows and groundwater levels affects the
ecological health of the ACF River Basin, focusing this portion of the project on agricultural
withdrawals. We were able to look at natural variation in surface water flows, and agricultural
water use for surface and groundwater, to compare with a select group of indicator species and
determine overlap of peak ecological sensitivity and agricultural water use needs. We addressed
each of our research questions:
RQ1: How do stream flows vary in the ACF River Basin?
RQ1: Are key indicator species most vulnerable during times of peak water use?
RQ2: Which species are most vulnerable to decreased stream flows from irrigation?
RQ3: If and when does agricultural water demand overlap with ecological sensitive
periods of time within the ACF river basin?

Stream and groundwater flows throughout the region were identified to vary greatly
depending on the surrounding land cover, population, water demands, rainfall, impoundments,
and river source waters. Indicator species were identified, and their reproductive time periods
were used to indicate ecological sensitivity. Most indicator species reproductive time periods
begin in the spring and continue into summer. Depending on specific biological needs some
begin reproducing earlier and other continue to reproduce late into the summer. The group was
able to create an overlaying graph of indicator species ecological sensitivity, surface flows,
agricultural surface and groundwater use in the lower Flint River area. Overall, the project
shows that agricultural water demands are greatest during the spring and summer months, and
have a high correlation to the reproductive timeframes for many of the river basins inhabitants,
which are most sensitive during the spring and summer months.
Further Research on the Project
This is a working project and further research, data collection, and analysis will be
continued in the future. Areas of extension on the project include:
• Using drought year data from the Lower Flint Watersheds, and comparing to the typical
year applications.
• Use recent data, collected as part of the State Water Management Plan, and use monthly
surface and groundwater demands for agricultural use by local drainage areas (LDAs).
• Further documentation of the hydrologic interaction between groundwater withdrawals
and surface water flows. Need to establish a lag timeframe between groundwater
withdrawal and stream flow affects.

• Use of GIS to identify specific areas within the ACF river basin affected highly by stream
flow changes.
• Closer analysis of water quality data and the interaction with ecological sensitivity at
particular station sites within the ACF river basin.

References
Baker, F. C. (1928). The fresh water mollusca of Wisconsin. Part II. Pelecypoda. Bulletin of the Wisconsin Geological and Natural History Survey, 70(2), 1-495. Barbour, M. T., Gerritsen, J., Griffith, G. E., Frydenborg, R., McCarron, E., White, J. S., &
Bastian, M. L. (1996). A framework for biological criteria for Florida streams using benthic macroinvertebrates. The Journal of the North American Benthological Society, 15(2), 185-211.
Blann, K., Anderson, J., Sands, G., & Vondracek, B. (2009). Effects of Agricultural Drainage on
Aquatic Ecosystems: A Review. Critical Reviews in Environmental Science & Technology, 39(11), 909-1001.
Bredenhand, E., & Samways, M. J. (2008). Impact of a dam on benthic macroinvertebrates in a
small river in a biodiversity hotspot: Cape Floristic Region, South Africa. Journal of Insect Conservation, 13(3), 297-307.
Butler, R., & Hartfield, P. (2006). The Return of the Clams. Endangered Species Bulletin, 31(1),
26-27. Congressional Research Service. (2007). Apalachicola-Chattahoochee-Flint Drought: Federal
Reservoir and Species Management. Washington, DC: Government Printing Office. Congressional Research Service. (2008). Apalachicola-Chattahoochee-Flint Drought: Federal
Water Management Issues. Washington, DC: Government Printing Office. Couch, Carol A., McDowell, Robin J. (2006). Flint River Basin Regional Water Development and Conservation Plan. Report by Georgia Dept. of Natural Resources Environmental Protection Division Couch, C. A., Hopkins, E. H., & Hardy, P. S. (1996). Influences of environmental settings on
aquatic ecosystems in the Apalachicola-Chattahoochee-Flint River Bain. Atlanta, GA: U.S. Geological Survey.
Crankshaft. Ephemeroptera (Mayflies) (Insects). Retrieved December 3, 2010, from
http://www.the-crankshaft.info/2010/04/ephemeroptera-mayflies.html Crawford, R.W. (1956) A study of the distribution and taxonomy of the percid fish Percina
nigrofasciata (Agassiz). Tulane Studies in Zoology, 4, 1-55 Crossman, N. D., Connor, J. D., Bryan, B. A., Summers, D. M., & Ginnivan, J. (2010).
Reconfiguring an irrigation landscape to improve provision of ecosystem services. Ecological Economics, 69, 1031-1042.
Dabrowski, J. M., Murray, K., Ashton, P. J., & Leaner, J. J. (2008). Agricultural impacts on

water quality and implications for virtual water trading decisions. Ecological Economics, 68, 1074-1082.
Dick, J., Platvoet, D., & Kelly, D. (2002). Predatory impact of the freshwater invader Dikerogammarus villosus (Crustacea: Amphipoda). Canadian Journal of Fisheries & Aquatic Sciences, 59(6), 1078.
Dixon, M. (2009, October 24). FDA proposes 8-month oyster ban. Panama City News Hearald. Retrieved from http://newsherald.com
Environmental Protection Divions. (1997). Flint River Basin Management Plan. Atlanta, GA:
Georgia Department of Natural Resources. Fitzhugh, T., & Richter, B. (2004). Quenching Urban Thirst: Growing Cities and Their Impacts
on Freshwater Ecosystems. Bioscience, 54(8), 741-754. Flecker, A. S., Allan, D. J., & McClintock, N. L. (1988). Male body size and mating success in
swarms of the mayfly Eperorus longimanus. Holarctic Ecology, 11, 280-285. Freeman, M. C., Freeman, B. J., Burkhead, N. M., & Straight, C. A. (2008). A new species of
Percina (Perciformes: Percidae) from the Apalachicola River drainage, southeastern United States. Zootaxa, 25-42
Frick, E. A., Hippe, Daniel J., Buell, G. R., Couch, C. A., Hopkins, E. H., Wangsness, D. J., &
Garrett, J. W. Water quality in the Apalachicola-Chattahoochee-Flint River Basin Georgia, Alabama, and Florida, 1992–95. Washington, D.C: U.S. Department of the Interior, 1998. Print.
Gagnon, P., Michener, W., Freeman, M., & Box, J. B. (2006). Unionid habitat and assemblage
composition in coastal plain tributaries of Flint River (Georgia). Southeastern Naturalist, 5(1), 31-52.
Georgia Automated Environmental Monitoring Network. Griffin Campus, University of Georgia, Copyright © 1997-2010. www.georgiaweather.net Georgia Department of Natural Resources. (2006). Flint River Basin regional water development
and conservation plan. Atlanta, GA: Georgia Environmental Protection Division. Golladay, S. W., Gagnon, P., Kearns, M., Battle, J., & Hicks D. W. (2003). The effects of the
2000 drought on freshwater mussels in the Lower Flint River Basin. Proceedings of the 2003 Georgia Water Resources Conference, Ed. K. Hatcher. The University of Georgia, Athens, GA. Print.
Grabarkiewicz, J. & Davis, W. (2008.) An introduction to freshwater mussels as biological
indicators. Washington, DC: U.S. Environmental Protection Agency.

Heino, J., Mykrä, H., Hämäläinen, H., Aroviita, J., Muotka, T. (2007). Responses of taxonomic distinctness and species diversity to anthropogenic impacts and natural environmental gradients in stream macroinvertebrates. Freshwater Biology, 52, 1846-1861.
Hill, P.L. Habitat use and life history of the Halloween darter, Percina sp., in the upper Flint
River system, Georgia. MS thesis. Auburn University, 1996. Hook, J., & Harrison, K. (2005). The Agricultural Water Pumping Program (AWP)
Environmental Protection Division “Statewide Irrigation Monitoring.” Tifton, GA: The University of Georgia.
Jimenez, A. (2009, January 6). UGA Odum School of Ecology researchers discover new Percina
fish species. [Press Release]. Retrieved from http://www.uga.edu/news/artman/publish/090106_PercinaFish.shtml
Johnson, B. R., Tarter, D. C., and Hutchens, J. J. (2000). Life history and trophic basis of
production of the mayfly callibaetis fluctuans (Walsh) (Ephemeroptera: Baetidae) in a mitigated wetland, West Virginia, USA. Wetlands, 20(2) 397–405.
Jones, R., Crean, J., Aluwihare, P., & Letcher, R. (2007). Economic cost of environmental flows
in an unregulated river system. The Australian Journal of Agricultural and Resource Economics, 51, 305-321.
Krno, I., & Holubec, M. (2009). Effects of land use on stonefly bioassessment metrics. Aquatic Insects, 31, 377-389.
Lenat, D. (1993). A biotic index for the Southeastern United States: Derivation and list of
tolerance values, with criteria for assigning water-quality ratings. Journal of the North American Benthological Society, 12(3), 279-290.
Loeffler, G., & Meyer, J. L. Chattahoochee-Flint River Basin. UGA River Basin. University of
Georgia, n.d. Web. 30 Nov. 2010.
Love, J., Taylor, C., & Warren, M. (2005). Predator density and dissolved oxygen affect body conditions of Stenonema tripunctatum (Ephemeroptera, Heptageniidae) from intermittent streams. Hydrobiologia, 543(1-3), 113-118.
MacNeil, C., & Briffa, M. (2009). Replacement of a native freshwater macroinvertebrate species
by an invader: implications for biological water quality monitoring. Hydrobiologia, 635(1), 321-327.
Marcinek, P.A. Variation of fish assemblages and species abundances in the upper Flint River
shoals, Georgia. MS thesis. University of Georgia, 2003. Marden, J. H., & Kramer, M. G. (1994). Surface-skimming stoneflies: A possible intermediate
stage in insect flight evolution. Science, 266(5184), 427-500.

Marella, R. L., Fanning, J. L., & Mooty, W. S. (1993). Estimated use of water in the
Apalachicola-Chattahoochee-Flint River basin during 1990 with state summaries from 1970 to 1990. Tallahassee, FL: U.S. Geological Survey.
Mathur, D. (1973). Some aspects of life history of the blackbanded darter, Percina nigrofasciata
(Agassiz), in Halawakee Creek, Alabama. The American Midland Naturalist, 89, 381-393.
McKissick, J. (2004). The Economic Importance of Irrigated Food and Fiber Production: A
Spotlight on Georgia’s Flint River Basin. Paper presented at The University of Georgia Center for Agribusiness and Economic Development, Athens, GA.
Mettee, M. F., O'Neil, P. E., & Pierson, J. M. Fishes of Alabama and the Mobile Basis.
Birmingham, AL: Oxmoor House, 1996. Print. Oberdorff, T., Guégan, J., & Hugueny, B. (1995). Global scale patterns of fish species richness
in rivers. Ecography, 18, 345-352. Palmquist, K. R., Jepson, P. C., & Jenkins, J. J. (2008). Impacts of aquatic insect life state and
emergence strategy on sensitivity to esfenvalerate exposure. Environmental Toxicology & Chemistry, 27(8), 1728-1734.
Peckarsky, B. L. (1979). A review of the distribution, ecology, and evolution of the North
American species of Acroneuria and six related genera (Plecoptera: Perlidae). Journal of the Kansas Entomological Society, 52(3), 787-809.
Pescador, M. L., Rasmussen, A. K., & Richard, B. A. (2000). A guide to stoneflies (plecoptera)
of Florida. Tallahassee, FL: Department of Environmental Protection. Qureshi, M. E., Connor, J., Kirby, M., & Mainuddin, M. (2007). Economic assessment of
acquiring water for environmental flows in the Murray Basin. The Australian Journal of Agricultural and Resource Economics, 51, 283-303.
Richter, B. D., Mathews, R., Harrison, D. L., & Wigington, R. (2003). Ecologically sustainable
water management: Managing river flows for ecological integrity. Ecological Applications, 13(1), 206-224.
Rugel, Kathleen, Josh Romeis, C. Rhett Jackson, Stephen W. Golladay, David W. Hicks, John F. Dowd. (2009). Use of Historic Data to Evaluate Effects of Pumping Stress Streams in Southwest Georgia. Snellen, R. K., & Stewart, K. W. (1979). The life cycle of Perlesta placida (Plecoptera:
Perlidae) in an intermittent stream in Northern Texas. Annals of the Entomological Society of America, 72, 659-666.
Sparks, R. E. (1995). Need for ecosystem management of large rivers and their floodplains. BioScience, 45, 169-182.
Stark, B. P., & Gaufin, A. R. (1979). The stoneflies (Plecoptera) of Florida. Transactions of the
American Entomological Society, 104, 391-433. Stark, B. P., Szczytko, S. W., & Nelson, C. R. (1998). American stoneflies: A photographic
guide to the Plecoptera. Columbus, OH: The Caddis Press. Stephenson, D. S. (2000). The tri-state compact: Falling waters and fading opportunities. Journal
of Land Use & Environmental Law, 16(1), 83-109. Stooksbury, D. E. (2003). “Historical droughts in Georgia and drought assessment and
management.” Proceedings of the 2003 Georgia Water Resources Conference, held April 23-24, 2003. Ed. Kathryn J. Hatcher. Athens, GA: The University of Georgia.
Storer, T.I. General Zoology, 2nd edition. New York: McGraw-Hill, 1951. Print. U.S. Fish and Wildlife Service. (2006). Fat threeridge, shinyrayed pocketbook, gulf
moccasinshell, ochlockonee moccasinshell, oval pigtoe, chipola slabshell, purple bankclimber: 5-year review: Summary and evaluation. Panama City, FL: Panama City Field Office.
United States Geological Survey. (2005). Total freshwater use, by watershed, in Alabama, 2005
[Data file]. Retrieved from http://al.water.usgs.gov/infodata/wudata-hucto.html University of California Music of Paleontology. Ephemeroptera: Mayflies. Retrieved December 4, 2010, from http://www.ucmp.berkeley.edu/arthropoda/uniramia/ephemeroptera.html USEPA (1997) Volunteer Stream Monitoring: A Methods Manual. (www.epa.gov/OWOW/monitoring/volunteer/stream) EPA 841-B-97-003. Office of Water. November 1997. Xenopoulos, M. M., Lodge, D. M., Alcamo, J., Märker, M., Schulze, K., & Van Vuurens, V.
(2005). Scenarios of freshwater fish extinctions from climate change and water withdrawal. Global Change Biology, 11, 1557-1564.
Zarriello, Philip J., Paul M. Barlow, and Paul B. Duda. (2001). Simulating the Effects of Ground-Water Withdrawals on Streamflow in a Precipitation-Runoff Model. USGS.

![Limnological and Ecological sensitivity of Rwenzori mountain lakes (Uganda - DR Congo) to climate warming [Hilde Eggermont]](https://img.pdfslide.us/doc/110x75/55498674b4c905c26a8b4ce6/limnological-and-ecological-sensitivity-of-rwenzori-mountain-lakes-uganda-dr-congo-to-climate-warming-hilde-eggermont.jpg)


![ECOLOGICAL SENSITIVITY - Eskom · 2019. 2. 22. · Ecological Support Area 2 10 CRITICAL BIODIVERSITY AREAS: ESKOM GOURIKWA-BLANCO 400kV POWERLINE . C] Alternative 1 Alternative 2](https://img.pdfslide.us/doc/110x75/6125d6b78ea1bb00f45a41b2/ecological-sensitivity-eskom-2019-2-22-ecological-support-area-2-10-critical.jpg)