Embed Size (px)
Citation preview
Comparing Distributions III:Chi squared test, ANOVA
By Peter Woolf ([email protected])University of Michigan
Michigan Chemical Process Dynamics and Controls Open Textbook
version 1.0
Creative commons
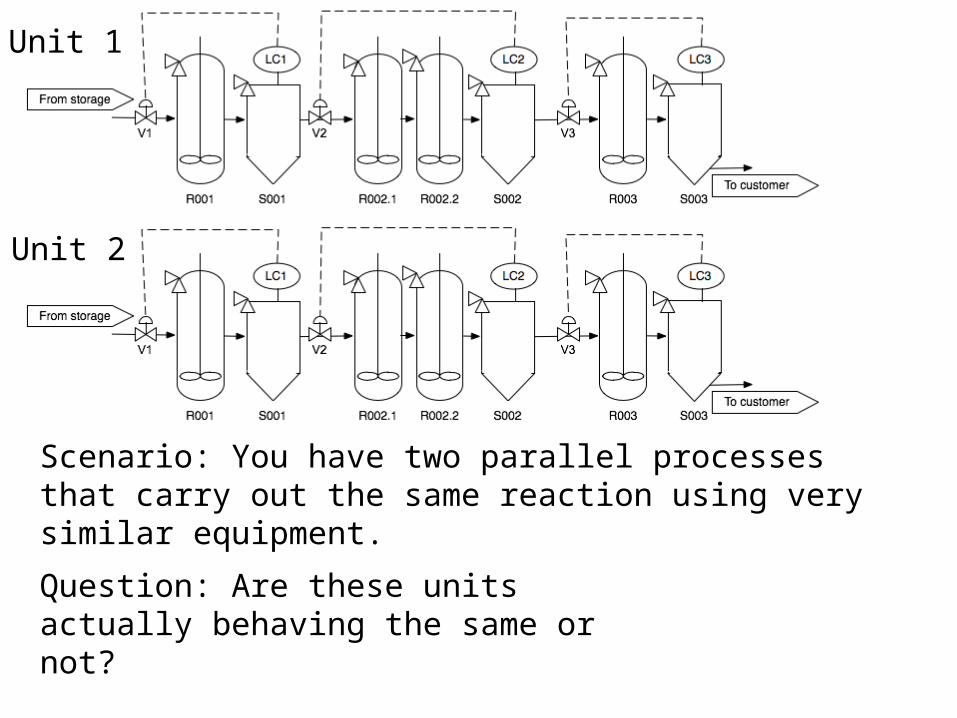
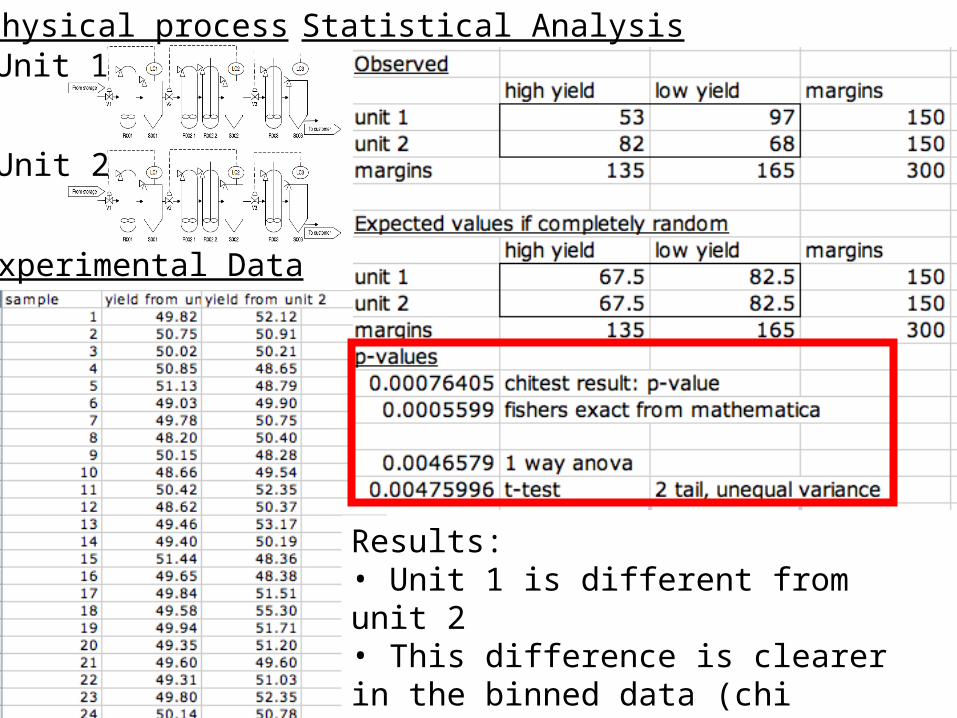
Unit 1
Unit 2
Scenario: You have two parallel processes that carry out the same reaction using very similar equipment.
Question: Are these units actually behaving the same or not?
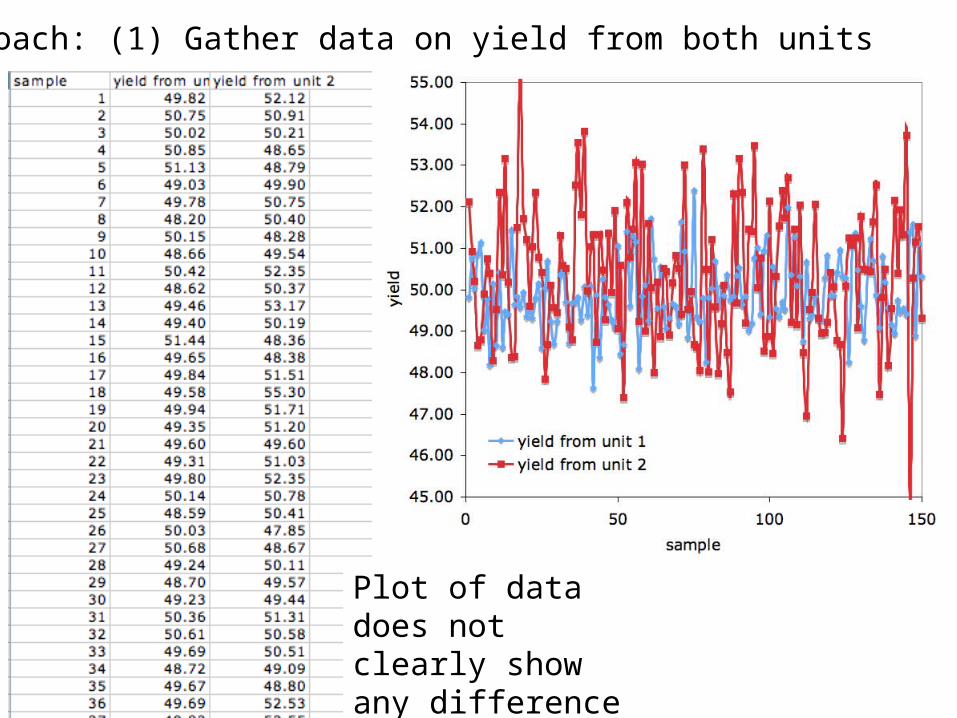
Approach: (1) Gather data on yield from both units
Plot of data does not clearly show any difference

Approach: (1) Gather data on yield from both units
(2) Perform statistical analysis- Fisher’s exact test- Chi squared test- ANOVA
Requires binning
Directly on data
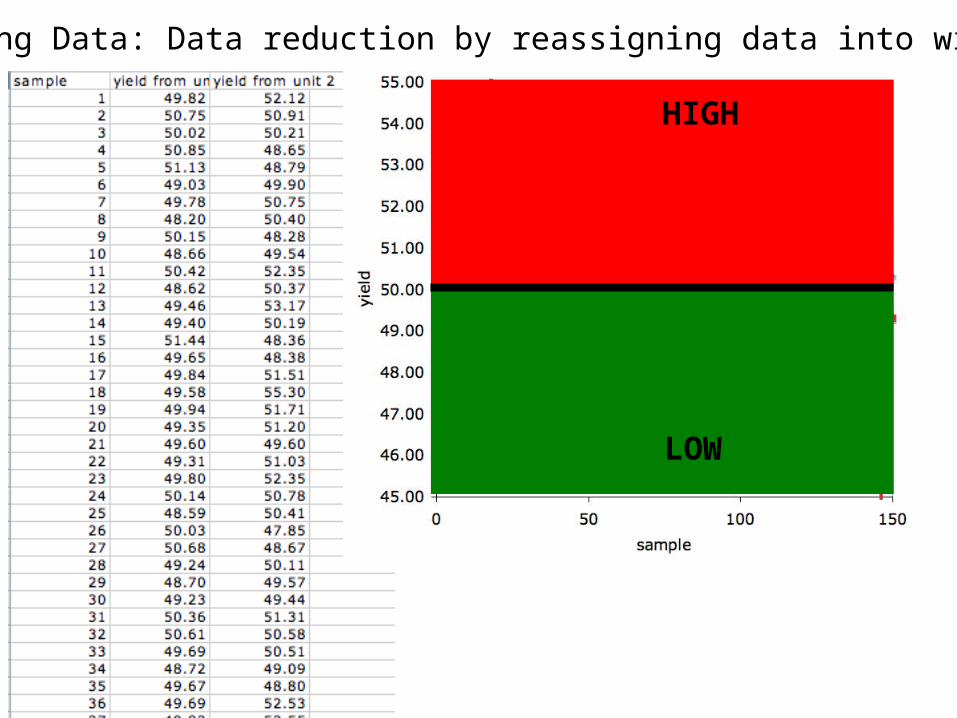
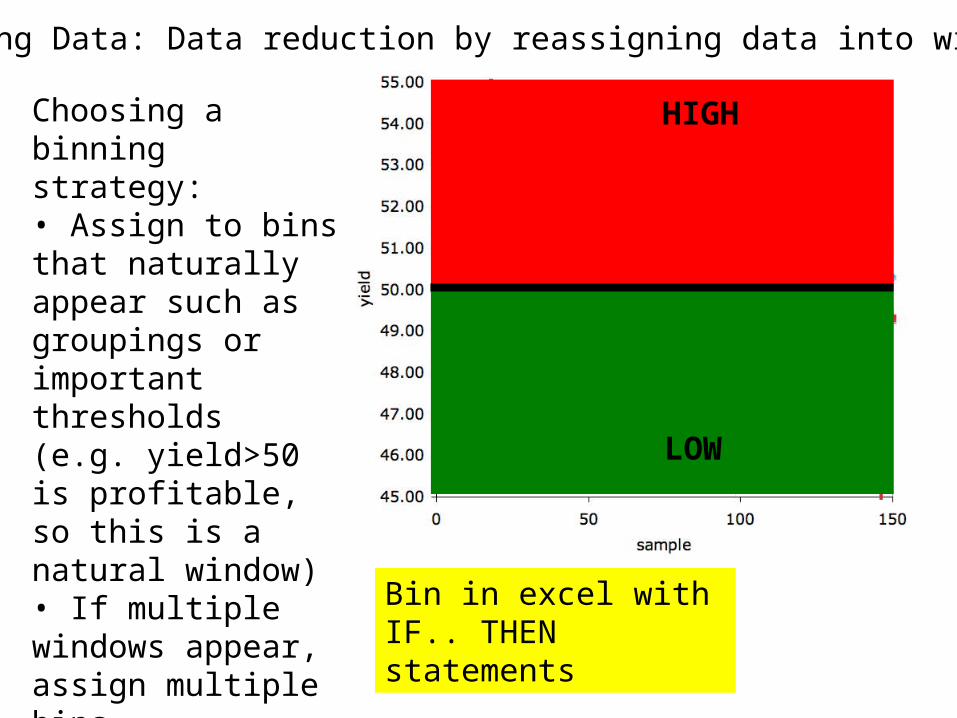
Binning Data: Data reduction by reassigning data into windows
HIGH
LOW
Binning Data: Data reduction by reassigning data into windows
HIGH
LOW
Choosing a binning strategy:• Assign to bins that naturally appear such as groupings or important thresholds(e.g. yield>50 is profitable, so this is a natural window)• If multiple windows appear, assign multiple bins• If no natural bins appear, choose equally sized bins or above/below average
Bin in excel with IF.. THEN statements
HIGH
LOW
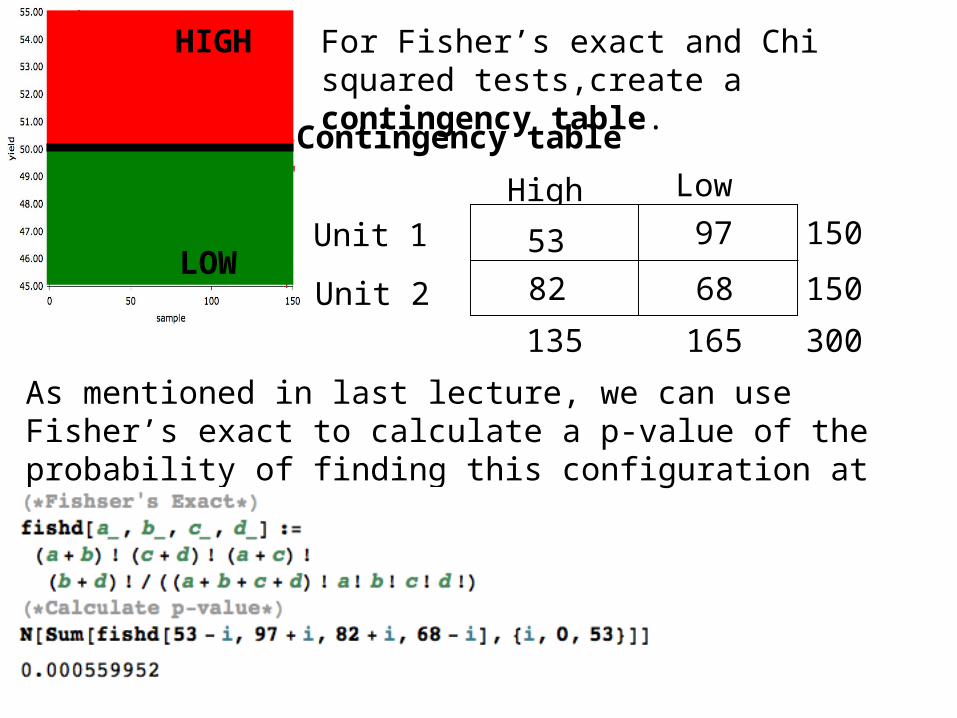
For Fisher’s exact and Chi squared tests,create a contingency table.
Contingency table
High Low
Unit 1
Unit 2
53
82 68
97
135 165
150
150
300
As mentioned in last lecture, we can use Fisher’s exact to calculate a p-value of the probability of finding this configuration at random
High Low
Unit 1
Unit 2
53
82 68
97
135 165
150
150
300
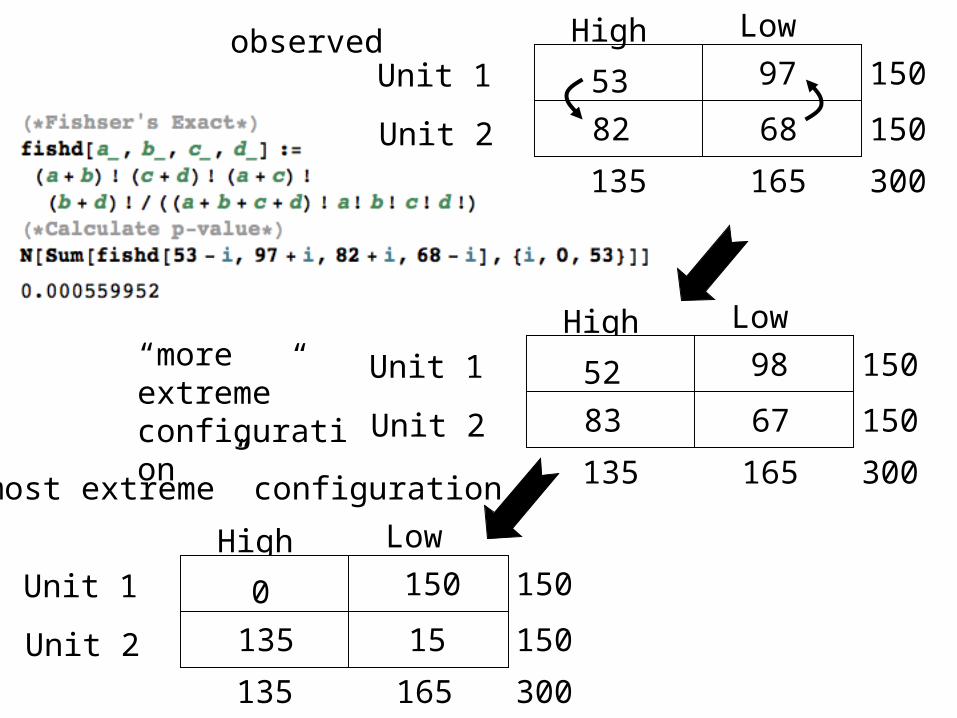
observed
High Low
Unit 1
Unit 2
52
83 67
98
135 165
150
150
300
“more extreme” configuration
“most extreme” configuration
High Low
Unit 1
Unit 2
0
135
150
135 165
150
150
300
15
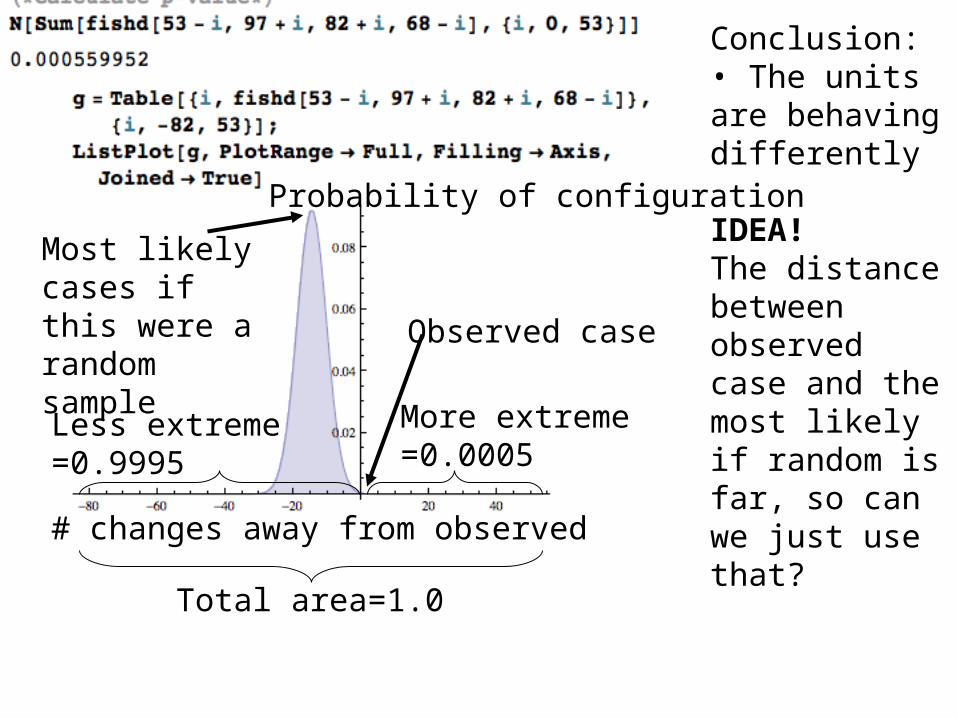
Observed case
Probability of configuration
# changes away from observed
More extreme=0.0005
Less extreme=0.9995
Most likely cases if this were a random sample
Total area=1.0
Conclusion:• The units are behaving differently
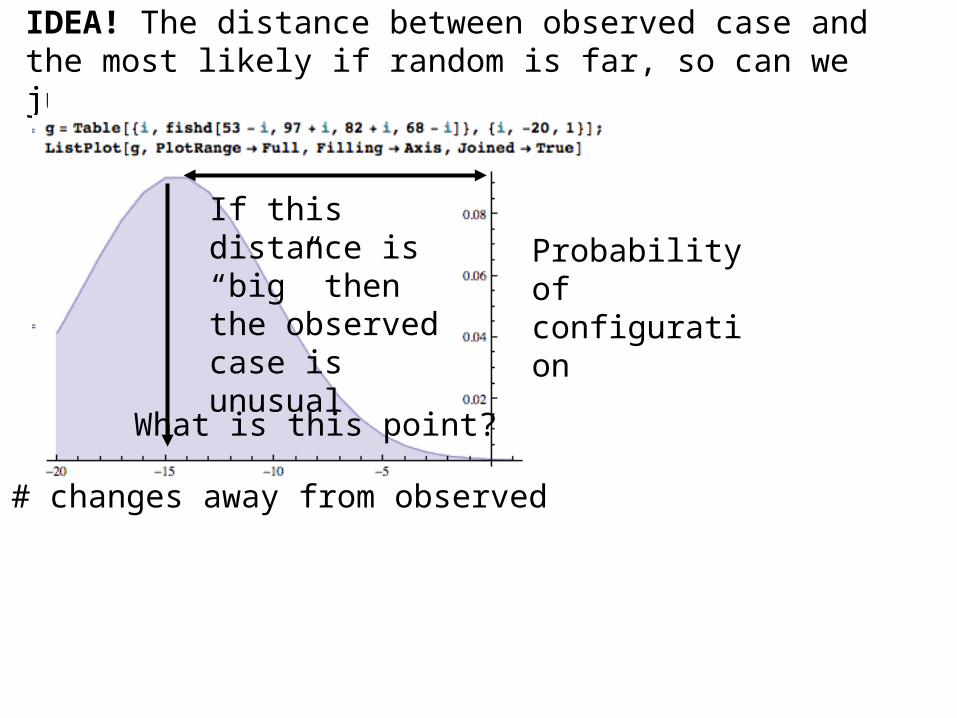
IDEA! The distance between observed case and the most likely if random is far, so can we just use that?
# changes away from observed
IDEA! The distance between observed case and the most likely if random is far, so can we just use that?
Probability of configuration
If this distance is “big” then the observed case is unusual
What is this point?
High Low
Unit 1
Unit 2
53
82 68
97
135 165
150
150
300What is this point?
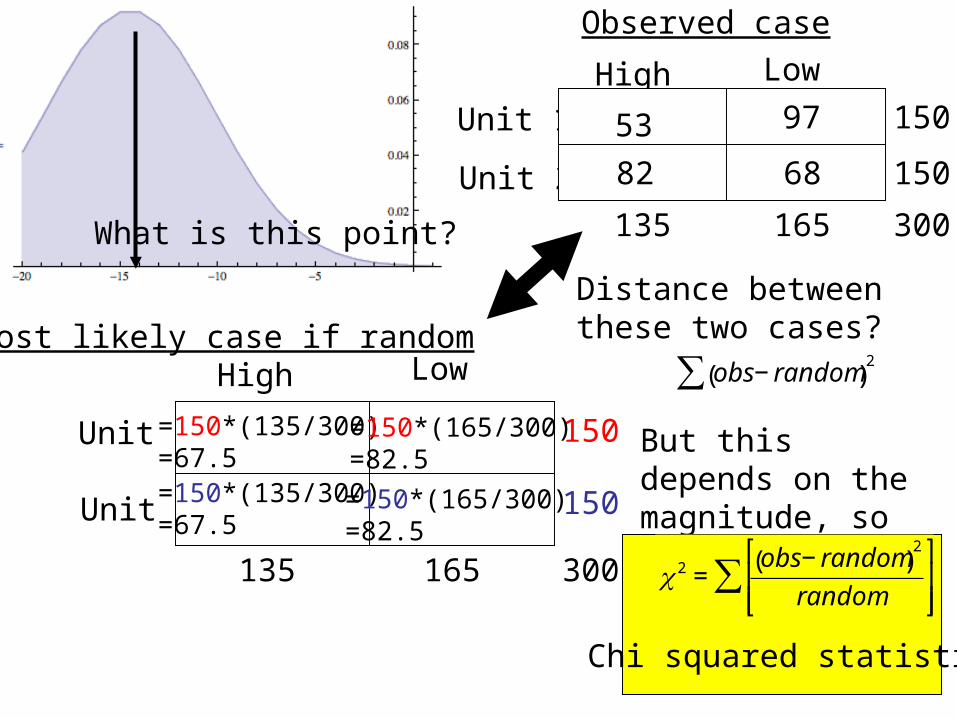
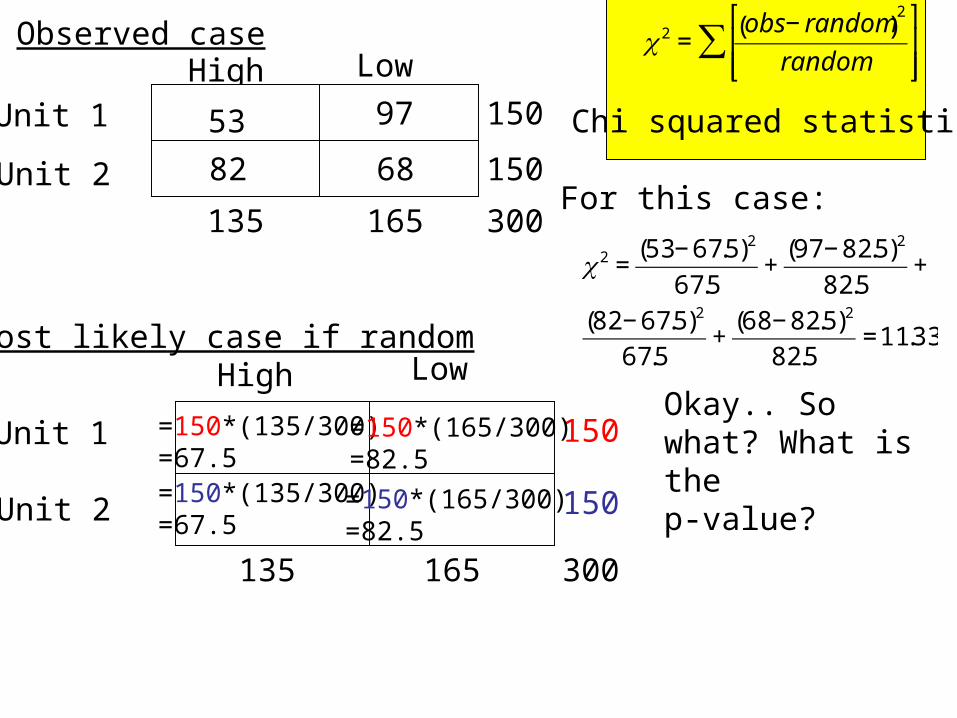
Observed case
Most likely case if randomHigh Low
Unit 1
Unit 2
135 165
150
150
300
=150*(135/300)=67.5=150*(135/300)=67.5
=150*(165/300)=82.5
=150*(165/300) =82.5
Distance between these two cases?
€
obs− random( )2∑
But this depends on the magnitude, so normalize it..
€
χ 2 =obs− random( )
2
random
⎡
⎣ ⎢ ⎢
⎤
⎦ ⎥ ⎥
∑
Chi squared statistic
High Low
Unit 1
Unit 2
53
82 68
97
135 165
150
150
300
Observed case
Most likely case if randomHigh Low
Unit 1
Unit 2
135 165
150
150
300
€
χ 2 =obs− random( )
2
random
⎡
⎣ ⎢ ⎢
⎤
⎦ ⎥ ⎥
∑
Chi squared statistic
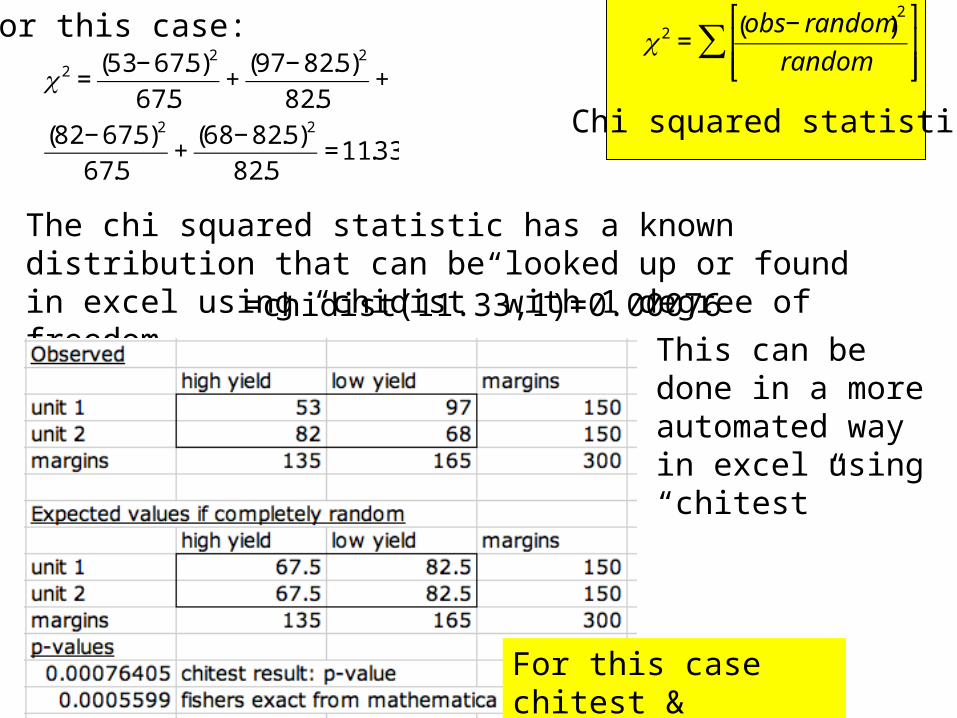
For this case:
€
χ 2 =(53− 67.5)2
67.5+
(97 − 82.5)2
82.5+
(82 − 67.5)2
67.5+
(68 − 82.5)2
82.5=11.33
Okay.. So what? What is the p-value?
=150*(135/300)=67.5=150*(135/300)=67.5
=150*(165/300)=82.5
=150*(165/300) =82.5
€
χ 2 =obs− random( )
2
random
⎡
⎣ ⎢ ⎢
⎤
⎦ ⎥ ⎥
∑
Chi squared statistic
For this case:
€
χ 2 =(53− 67.5)2
67.5+
(97 − 82.5)2
82.5+
(82 − 67.5)2
67.5+
(68 − 82.5)2
82.5=11.33
The chi squared statistic has a known distribution that can be looked up or found in excel using “chidist” with 1 degree of freedom. =chidist(11.33,1)=0.00076
This can be done in a more automated way in excel using “chitest”
For this case chitest & Fisher’s exact agree
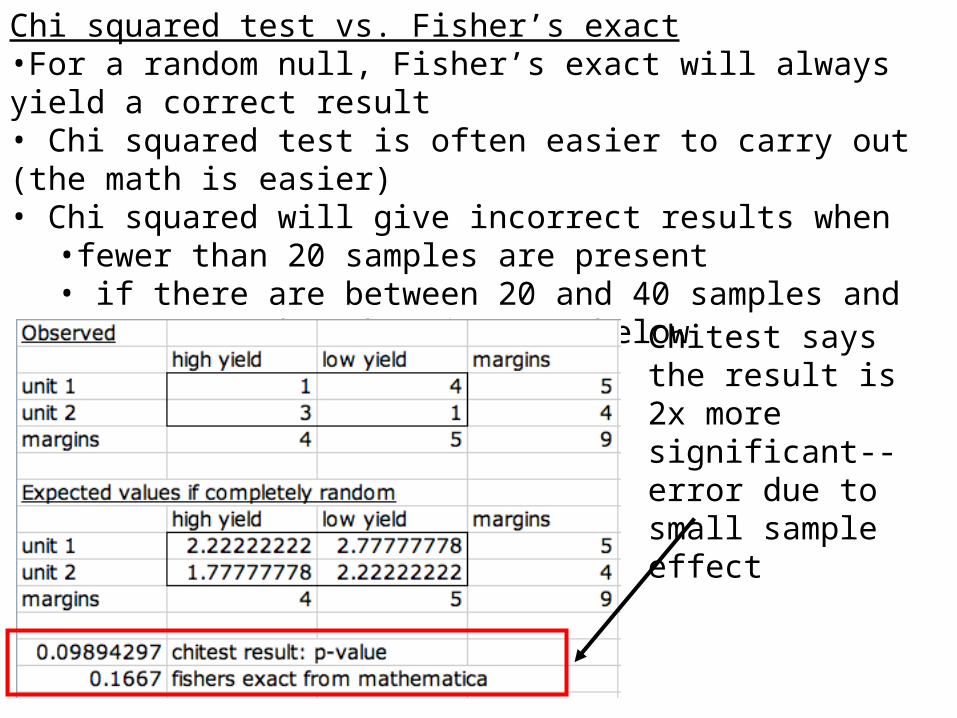
Chi squared test vs. Fisher’s exact•For a random null, Fisher’s exact will always yield a correct result• Chi squared test is often easier to carry out (the math is easier)• Chi squared will give incorrect results when
•fewer than 20 samples are present • if there are between 20 and 40 samples and one expected number is 5 or below
Chitest says the result is 2x more significant--error due to small sample effect
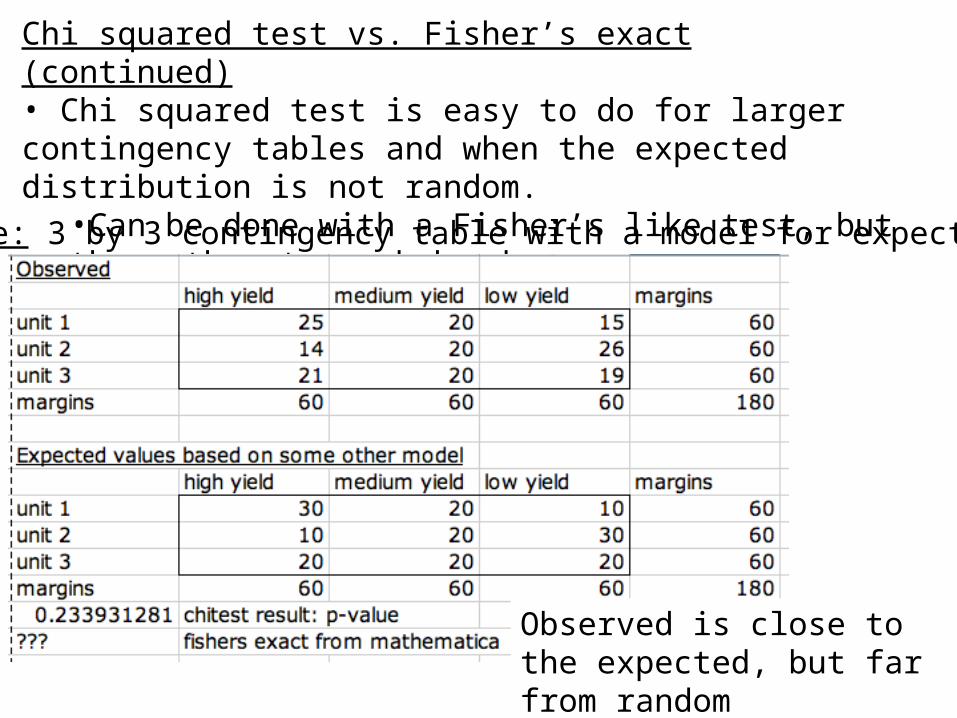
Chi squared test vs. Fisher’s exact (continued)• Chi squared test is easy to do for larger contingency tables and when the expected distribution is not random.
•Can be done with a Fisher’s like test, but the math gets much harder.
Example: 3 by 3 contingency table with a model for expectations
Observed is close to the expected, but far from random
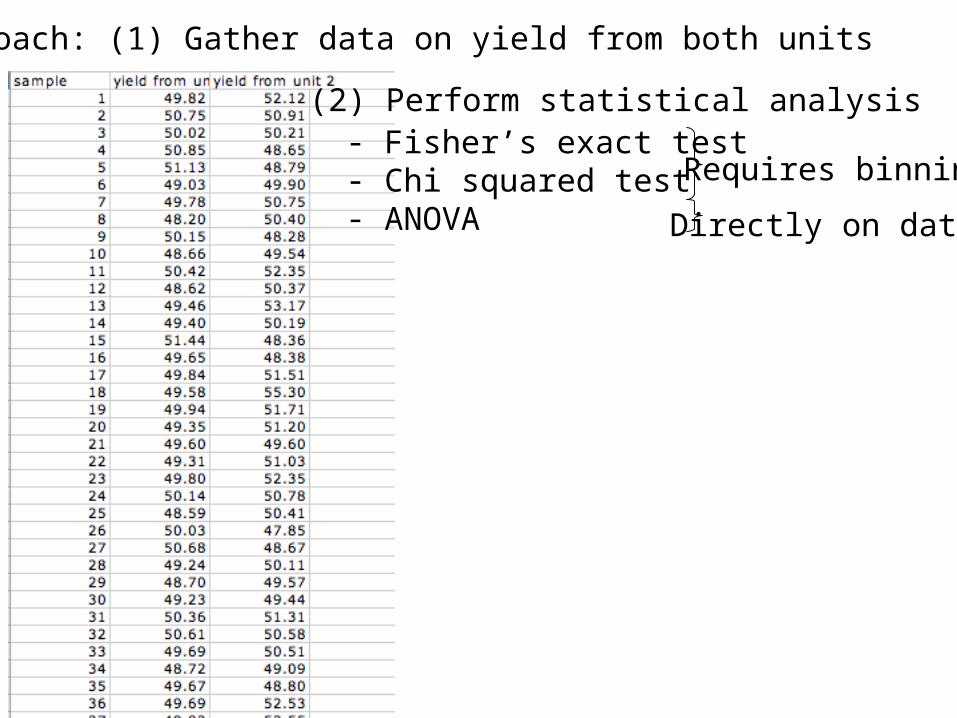
Approach: (1) Gather data on yield from both units
(2) Perform statistical analysis- Fisher’s exact test- Chi squared test- ANOVA
Requires binning
Directly on data
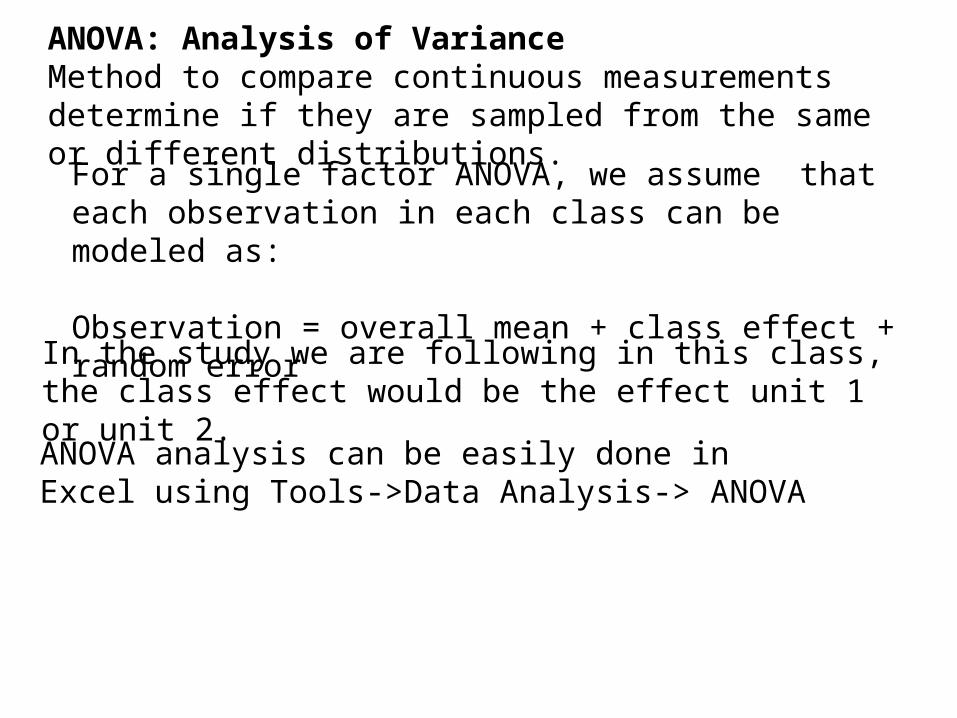
ANOVA: Analysis of VarianceMethod to compare continuous measurements determine if they are sampled from the same or different distributions.
For a single factor ANOVA, we assume that each observation in each class can be modeled as:
Observation = overall mean + class effect + random error
In the study we are following in this class, the class effect would be the effect unit 1 or unit 2.
ANOVA analysis can be easily done in Excel using Tools->Data Analysis-> ANOVA
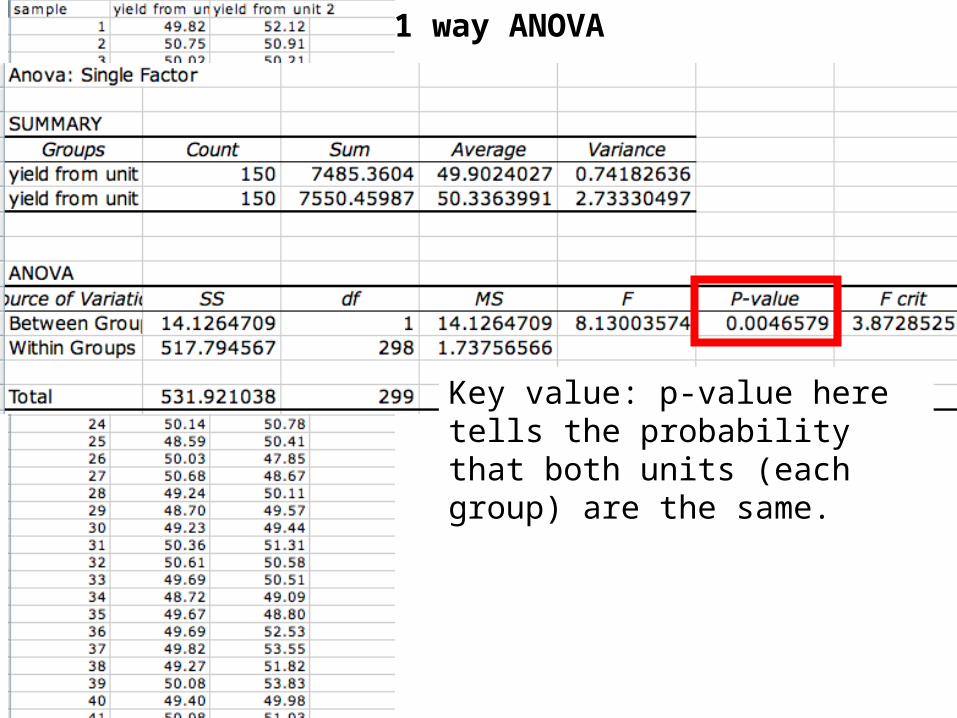
1 way ANOVA
Key value: p-value here tells the probability that both units (each group) are the same.
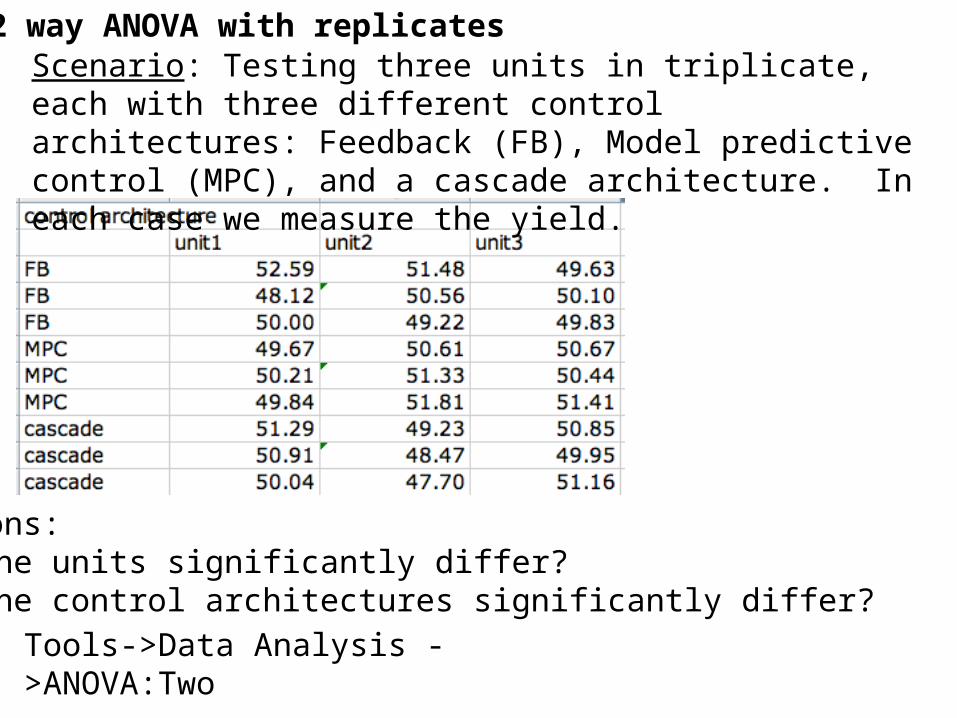
2 way ANOVA with replicatesScenario: Testing three units in triplicate, each with three different control architectures: Feedback (FB), Model predictive control (MPC), and a cascade architecture. In each case we measure the yield.
Questions:1) Do the units significantly differ?2) Do the control architectures significantly differ?
Tools->Data Analysis ->ANOVA:Two factor with replication
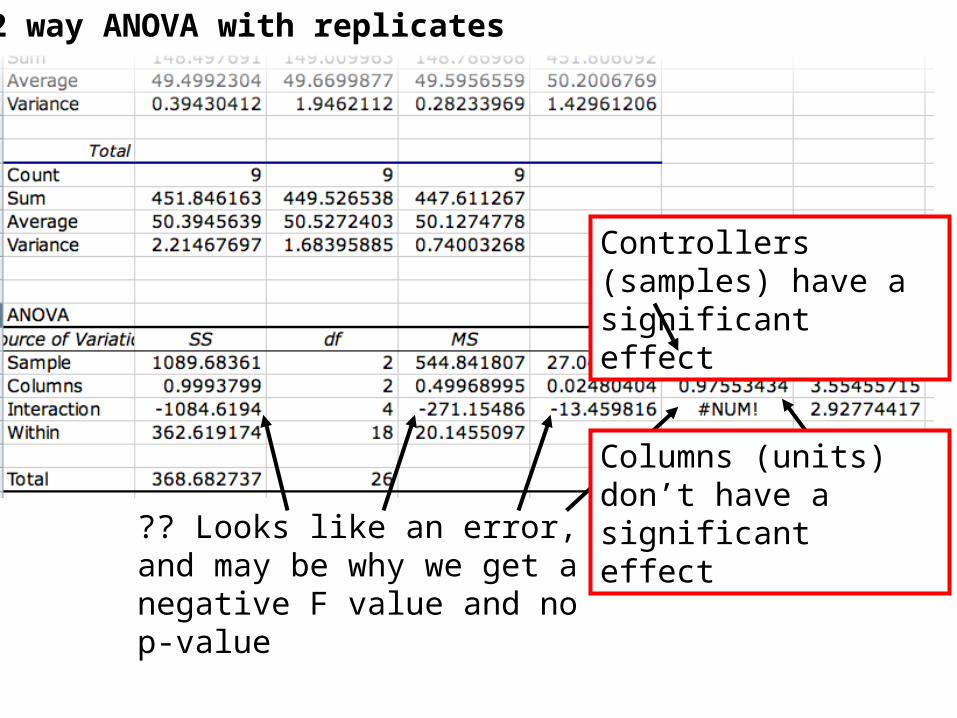
2 way ANOVA with replicates
Controllers (samples) have a significant effect
?? Looks like an error, and may be why we get a negative F value and no p-value
Columns (units) don’t have a significant effect
ANOVA • ANOVA tells you if factors are significantly
related to an outcome according to a linear model– Nonlinear relationships can be strong, but may
appear insignificant in an ANOVA analysis.
• ANOVA does not tell you the model parameters.
• ANOVA, t-test, and z-test all provide similar kinds of information for different kinds of data.
Unit 1
Unit 2
Physical process
Experimental Data
Statistical Analysis
Results:• Unit 1 is different from unit 2• This difference is clearer in the binned data (chi squared and fisher’s<ANOVA)
Take Home Messages
• Chi squared tests are analogous to Fisher’s exact tests, but are generally easier to calculate
• Chi squared tests fail when sample sizes are small
• ANOVA determines if lists of continuous measurements likely the same or different
• ANOVA can determine the significance of a set of factors on the measurements
The following pages have additional examples of ChemE applications of ANOVA analyses
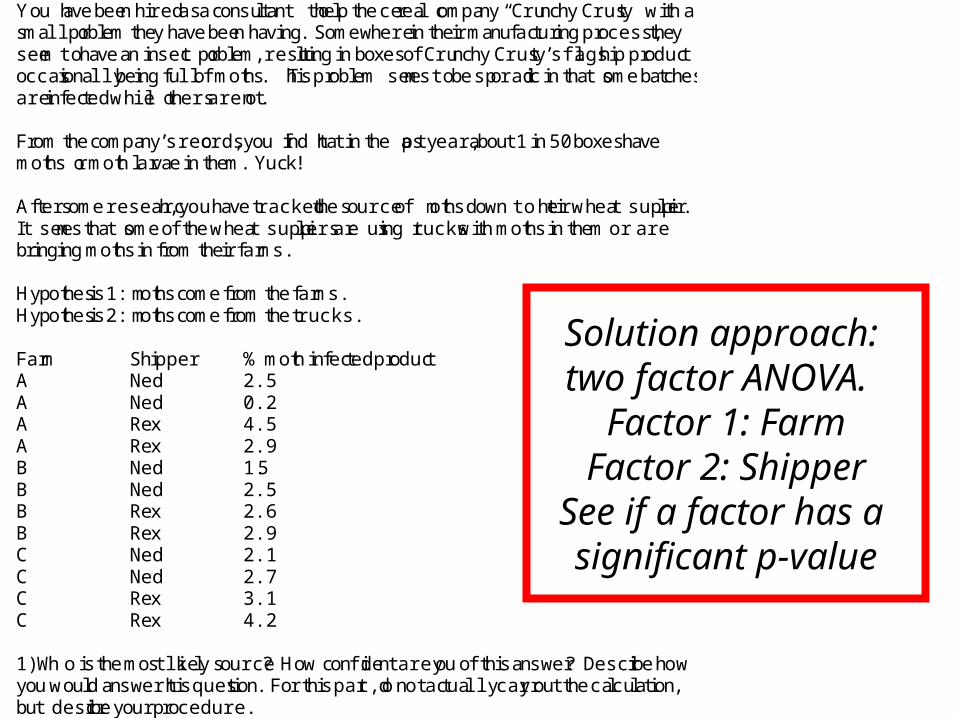
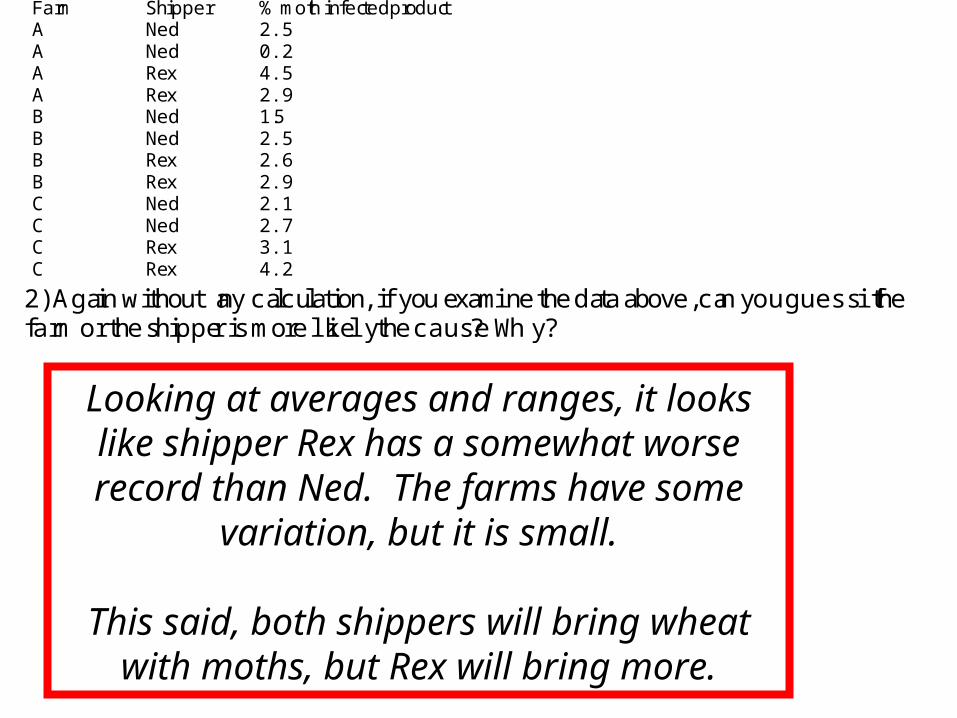
You have been hired as a consultant to help the cereal company “Crunchy Crusty” with a small problem they have been having. Somewhere in their manufacturing process, they seem to have an insect problem, resulting in boxes of Crunchy Crusty’s flagship product occasionally being full of moths. This problem seems to be sporadic in that some batches are infected while others are not. From the company’s records, you find that in the past year, about 1 in 50 boxes have moths or moth larvae in them. Yuck! After some research, you have tracked the source of moths down to their wheat supplier. It seems that some of the wheat suppliers are using trucks with moths in them or are bringing moths in from their farms. Hypothesis 1: moths come from the farms. Hypothesis 2: moths come from the trucks. Farm Shipper % moth infected product A Ned 2.5 A Ned 0.2 A Rex 4.5 A Rex 2.9 B Ned 1.5 B Ned 2.5 B Rex 2.6 B Rex 2.9 C Ned 2.1 C Ned 2.7 C Rex 3.1 C Rex 4.2 1) Who is the most likely source? How confident are you of this answer? Describe how you would answer this question. For this part, do not actually carry out the calculation, but describe your procedure.
Solution approach: two factor ANOVA.
Factor 1: FarmFactor 2: Shipper
See if a factor has a significant p-value
You have been hired as a consultant to help the cereal company “Crunchy Crusty” with a small problem they have been having. Somewhere in their manufacturing process, they seem to have an insect problem, resulting in boxes of Crunchy Crusty’s flagship product occasionally being full of moths. This problem seems to be sporadic in that some batches are infected while others are not. From the company’s records, you find that in the past year, about 1 in 50 boxes have moths or moth larvae in them. Yuck! After some research, you have tracked the source of moths down to their wheat supplier. It seems that some of the wheat suppliers are using trucks with moths in them or are bringing moths in from their farms. Hypothesis 1: moths come from the farms. Hypothesis 2: moths come from the trucks. Farm Shipper % moth infected product A Ned 2.5 A Ned 0.2 A Rex 4.5 A Rex 2.9 B Ned 1.5 B Ned 2.5 B Rex 2.6 B Rex 2.9 C Ned 2.1 C Ned 2.7 C Rex 3.1 C Rex 4.2 1) Who is the most likely source? How confident are you of this answer? Describe how you would answer this question. For this part, do not actually carry out the calculation, but describe your procedure.
2) Again without any calculation, if you examine the data above, can you guess if the farm or the shipper is more likely the cause? Why?
Looking at averages and ranges, it looks like shipper Rex has a somewhat worse record than Ned. The farms have some
variation, but it is small.
This said, both shippers will bring wheat with moths, but Rex will bring more.
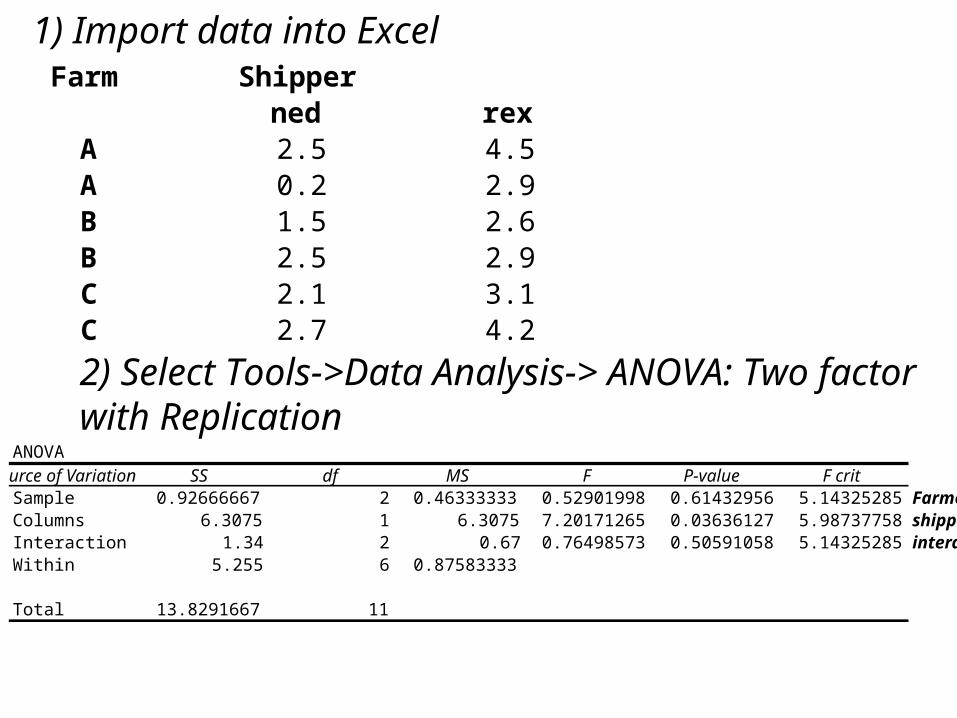
Farm Shipperned rex
A 2.5 4.5A 0.2 2.9B 1.5 2.6B 2.5 2.9C 2.1 3.1C 2.7 4.2
1) Import data into Excel
2) Select Tools->Data Analysis-> ANOVA: Two factor with Replication
ANOVASource of Variation SS df MS F P-value F critSample 0.92666667 2 0.46333333 0.52901998 0.61432956 5.14325285 Farmer significanceColumns 6.3075 1 6.3075 7.20171265 0.03636127 5.98737758 shipper significanceInteraction 1.34 2 0.67 0.76498573 0.50591058 5.14325285 interaction Within 5.255 6 0.87583333
Total 13.8291667 11
Conclusion, the factor “shipper” has a significant Influence on the moth probability with a p-value of 0.03
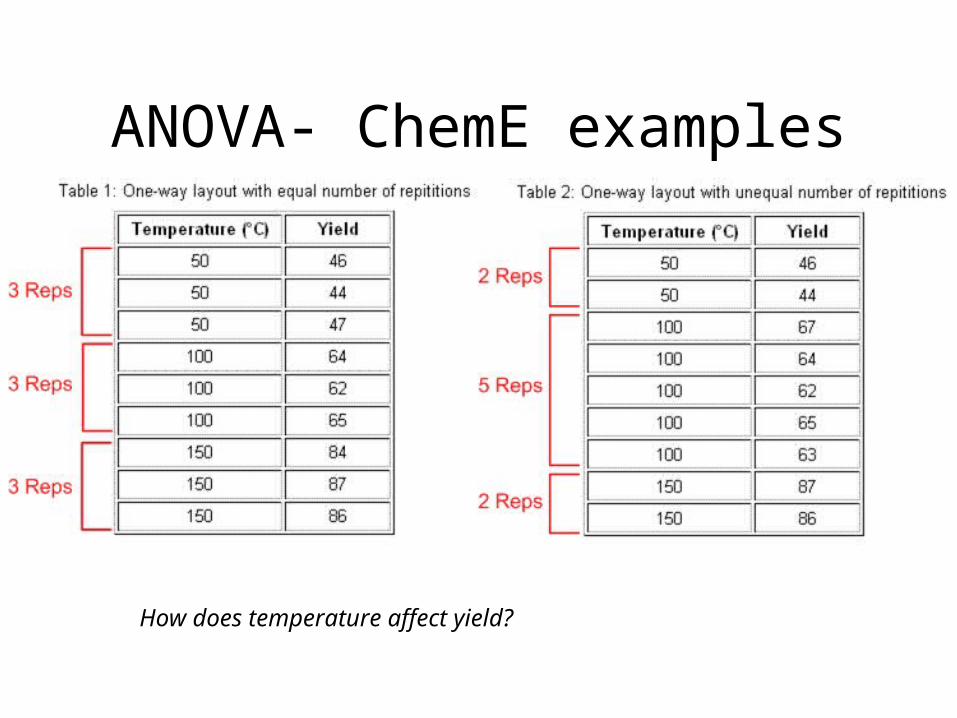
ANOVA- ChemE examples
How does temperature affect yield?
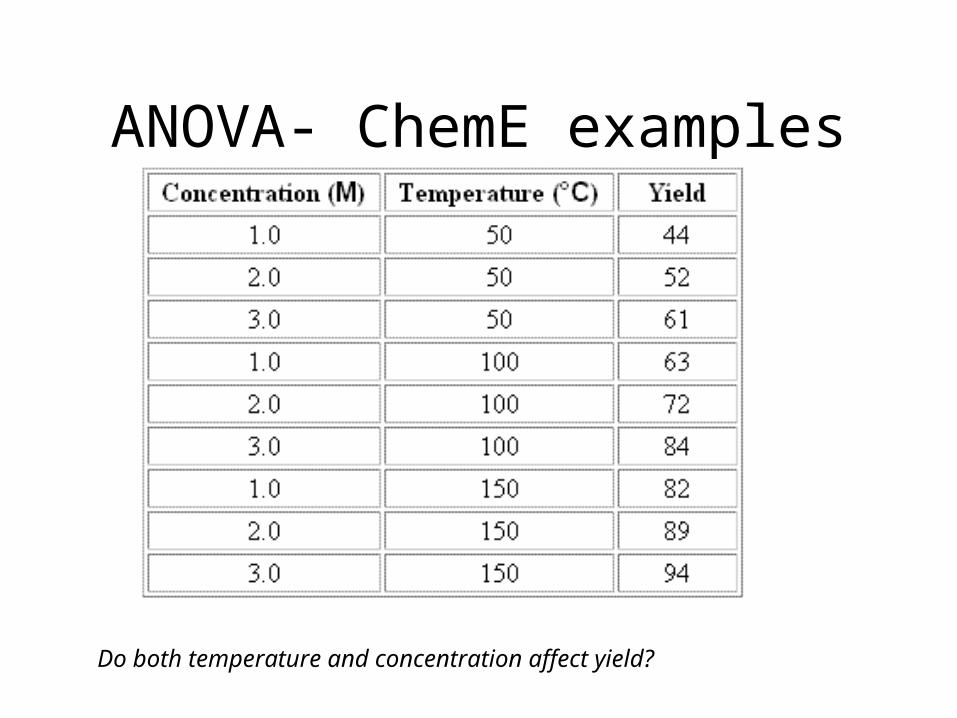
ANOVA- ChemE examples
Do both temperature and concentration affect yield?
ANOVA- ChemE examples
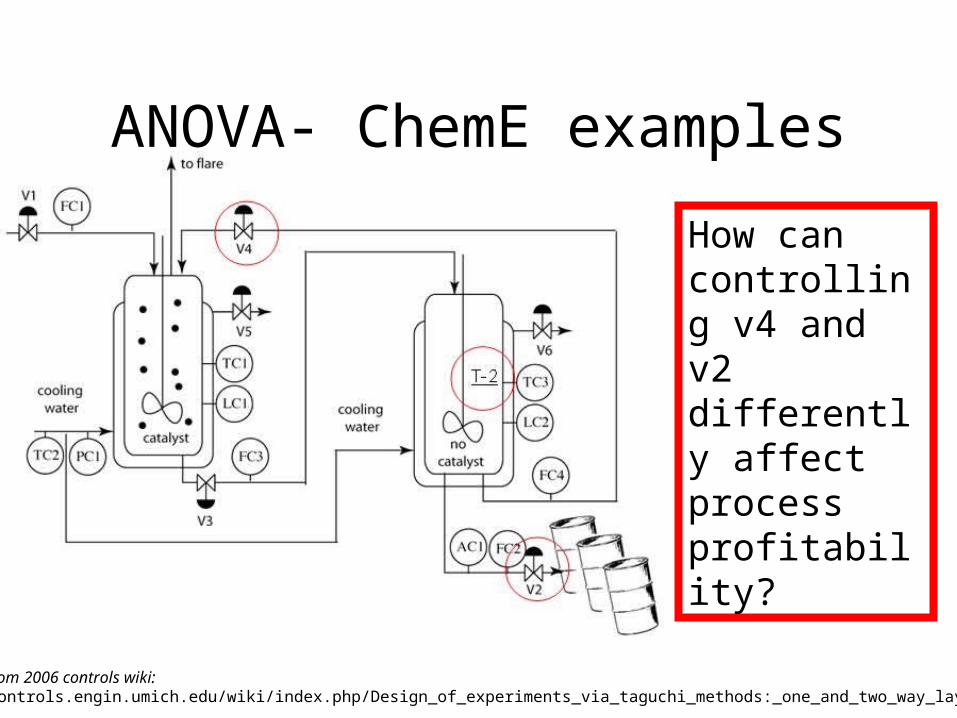
How can controlling v4 and v2 differently affect process profitability?
Example from 2006 controls wiki:http://controls.engin.umich.edu/wiki/index.php/Design_of_experiments_via_taguchi_methods:_one_and_two_way_layouts
How can controlling v4 and v2 differently affect process profitability?
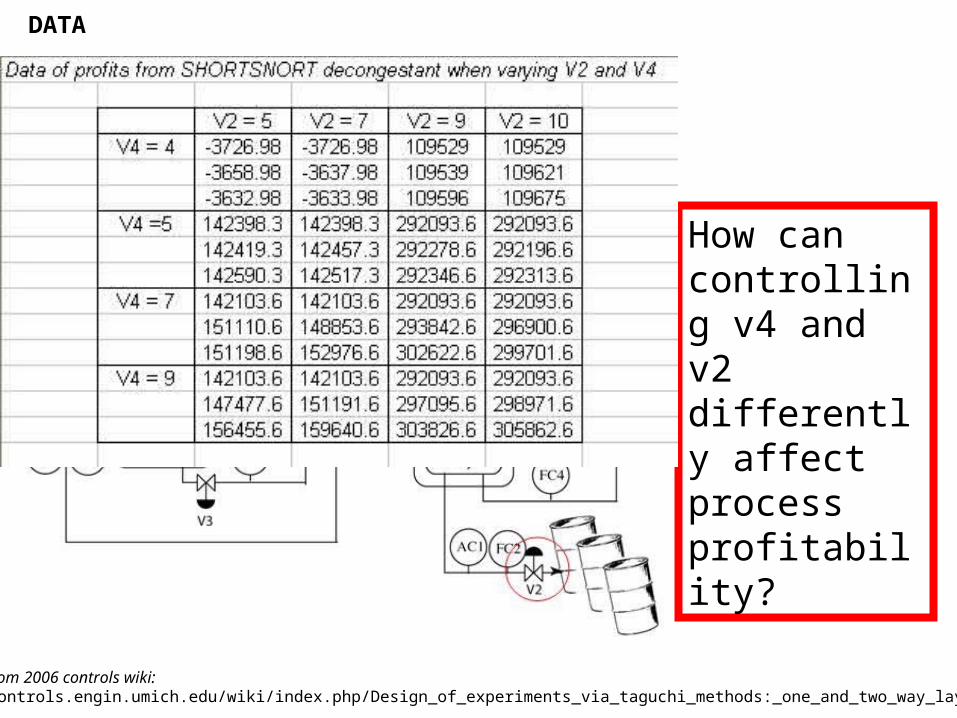
DATA
Example from 2006 controls wiki:http://controls.engin.umich.edu/wiki/index.php/Design_of_experiments_via_taguchi_methods:_one_and_two_way_layouts
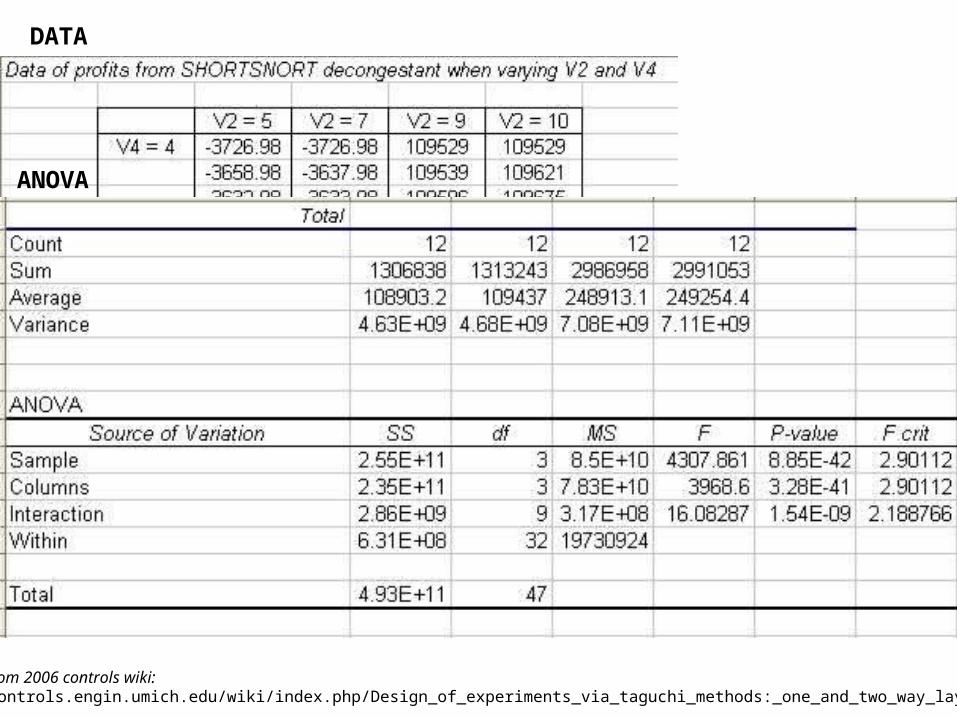
How can controlling v4 and v2 differently affect process profitability?
ANOVA
Example from 2006 controls wiki:http://controls.engin.umich.edu/wiki/index.php/Design_of_experiments_via_taguchi_methods:_one_and_two_way_layouts
DATA