Embed Size (px)
Citation preview

Vol-3 Issue-2 2017 IJARIIE-ISSN(O)-2395-4396
4367 www.ijariie.com 1692
“Comparative Study & Optimization of EDM
Process Parameters Using Different Shape of
Tool”
Harish R Patel1, V. D. Patel2
1P.G. Student Production (mechanical), LDRP-ITR, Gujarat, India
2Assistant Professor, Mechanical Engineering, LDRP-ITR, Gujarat, India
ABSTRACT
The correct selection of manufacturing conditions is one of the most important aspects to take into
consideration in the majority of manufacturing processes and, particularly, in processes related to Electrical
Discharge Machining (EDM). It is a capable of machining geometrically complex or hard material components, that
are precise and difficult-to-machine such as heat treated tool steels, composites, super alloys, ceramics, carbides,
heat resistant steels etc. being widely used in die and mold making industries, aerospace, aeronautics and nuclear
industries. EDM has become an important and cost-effective method of machining extremely tough and brittle
electrically conductive materials. It is widely used in the process of making moulds and dies and sections of
complex geometry and intricate shapes. The workpiece material selected in this experiment is Stavex taking into
account its wide usage in industrial applications. In today‟s world Stavex contributes to almost half of the world‟s
production and consumption for industrial purposes. The tool material is copper & brass. The input variable
parameters are current, pulse on time and pulse of time. Taguchi method is applied to create an L9 orthogonal array
of input variables using the Design of Experiments (DOE). The effect of the variable parameters mentioned above
upon machining characteristics such as Material Removal Rate (MRR), Tool Wear Rate (TWR) and Overcut (OC)
study and investigate.
Keyword : - MRR, TWR, OC, DOE, EDM, OA
1. INTRODUCTION
Electric Discharge Machining (EDM) is a nontraditional machining process in the sense that they do not employ
traditional tools for metal removal and instead directly by means of electric spark erosion [5]. It is developed in the
late 1940s, has been accepted worldwide as a standard process in manufacture of forming tools to produce plastics
molding, die castings, forging dies etc. New developments in the field of material science have led to new
engineering metallic materials, composite materials, and high tech ceramics, having good mechanical properties and
thermal characteristics as well as sufficient electrical conductivity so that they can readily be machined by spark
erosion [1].
The recent developments in the field of EDM have progressed due to the growing application of EDM process
and the challenges being faced by the modern manufacturing industries, from the development of new materials that
are hard and difficult-to-machine such as tool steels, composites, ceramics, super alloys, hastalloy, nitralloy,
carbides, stainless steels, heat resistant steel, etc. being widely used in die and mould making industries, aerospace,
aeronautics, and nuclear industries. Many of these materials also find applications in other industries owing to their
high strength to weight ratio, hardness and heat resisting qualities. EDM has also made its presence felt in the new
fields such as sports, medical and surgical instruments, optical, dental and jewellery industries, including automotive
R&D areas [1].

Vol-3 Issue-2 2017 IJARIIE-ISSN(O)-2395-4396
4367 www.ijariie.com 1693
The adequate selection of manufacturing conditions is one of the most important aspects to take into
consideration in the die-sinking electrical discharge machining (EDM) of conductive steel, as these conditions are
the ones that are to determine such important characteristics: Overcut(OC), Surface Roughness (SR), Tool Wear
Rate (TWR) and Material Removal Rate (MRR) [2]. In this paper, a study of Overcut performed on the influence of
the factors of Current, Pulse on Time & Pulse off Time.
2. PRINCIPLE OF EDM
In this process the metal is removing from the work piece due to erosion case by rapidly recurring spark
discharge taking place between the tool and work piece. A thin gap about 0.025mm is maintained between the tool
and work piece by a servo system shown in fig 1. Both tool and work piece are submerged in a dielectric fluid
Kerosene/EDM oil/de-ionized water is very common type of liquid dielectric although gaseous dielectrics are also
used in certain cases. Basically, there are two different types of EDM: Die-sinking EDM & Wire-cut EDM. A EDM
system has four major Components: (1) Computerized Numerical Control (CNC), (2) Power Supply, (3) Mechanical
Section : Worktable, work stand, taper unit etc., (4) Dielectric System[8].
3. LITERATURE REVIEW
Shankar Singh et. al. [1] evaluate that Electric Discharge Machining (EDM), a „non-traditional machining
process‟, has been replacing drilling, milling, grinding and other traditional machining operations and is now a well-
established machining option in many manufacturing industries throughout the world. This paper reports the results
of an experimental investigation carried out to study the effects of machining parameters such as pulsed current on
material removal rate, diameteral overcut, electrode wear, and surface roughness in electric discharge machining of
En-31 tool steel (IS designation: T105 Cr 1 Mn 60) hardened and tempered to 55 HRc. The work material was ED
machined with copper, copper tungsten, brass and aluminium electrodes by varying the pulsed current at reverse
polarity. Investigations indicate that the output parameters of EDM increase with the increase in pulsed current and
the best machining rates are achieved with copper and aluminium electrodes. After analysing the results of the
experiments on En-31 tool steel with different electrode materials, the following conclusion are arrived at: For the
En-31 work material, copper and aluminium electrodes offer higher MRR. Diameteral overcut produced on En-31 is
comparatively low when using copper and aluminium electrodes, which may be preferred for En-31 when low
diameteral overcut (higher dimensional accuracy) is the requirement. Copper and copper–tungsten electrodes offer
comparatively low electrode wear for the tested work material. Aluminium electrode also shows good results while
brass wears the most, of all the tested electrodes.Of the four tested electrode materials, Cu and Al electrodes produce
comparatively high surface roughness for the tested work material at high values of currents. Copper–tungsten
electrode offers comparatively low values of surface roughness at high discharge currents giving good surface finish
for tested work material. Copper is comparatively a better electrode materials as it gives better surface finish, low
diameteral overcut, high MRR and less electrode wear for En-31 work material, and aluminium is next to copper in
performance, and may be preferred where surface finish is not the requirement.
Othman Belgassim et. al. [7] used L9 orthogonal array based on Taguchi method to conduct a series of
experiments to optimize the EDM parameters. Experimental data were evaluated statistically by analysis of variance
(ANOVA). The EDM parameters are Pulse current (Ip), Pulse –on- time (Ton), Pulse –off- time (Toff), and the Gap
voltage (Vg) , while the machining responses in concern are the surface roughness of the machined surface and the
over-cut. The experimental results have given optimal combination of input parameters which give the optimum
surface finish of the EDM surface.
S.H.Tomadi et. al. [2] evaluate that the influence of operating parameters of tungsten carbide on the machining
characteristics such as surface quality, material removal rate and electrode wear. The effectiveness of EDM process
with tungsten carbide, WC-Co is evaluated in terms of the material removal rate, the relative wear ratio and the
surface finish quality of the workpiece produced. It is observed that copper tungsten is most suitable for use as the
tool electrode in EDM of WC-Co. Better machining performance is obtained generally with the electrode as the
cathode and the workpiece as an anode. In this paper, a study was carried out on the influence of the parameters such
peak current, power supply voltage, pulse on time and pulse off time. The surface quality that was investigated in
this experiment was surface roughness using perthometer machine. Material removal rate (MRR) and electrode wear
(EW) in this experiment was calculated by using mathematical method. The result of the experiment then was

Vol-3 Issue-2 2017 IJARIIE-ISSN(O)-2395-4396
4367 www.ijariie.com 1694
collected and analyzed using STATISTICA software. This was done by using the design of experiments (DOE)
technique and ANOVA analysis.
Subramanian Gopalakannan et. al. [3] study the effect of pulsed current on material removal rate, electrode
wear, surface roughness and diameter overcut in corrosion resistant stainless steels viz., 316 L and 17-4 PH. The
materials used for the work were machined with different electrode materials such as copper, cop-per-tungsten and
graphite. It is observed that the output parameters such as material removal rate, electrode wear and surface
roughness of EDM increase with increase in pulsed current. The results reveal that high material removal rate have
been achieved with copper electrode whereas copper-tungsten yielded lower electrode wear, smooth surface finish
and good dimensional accuracy.
V.Balasubramaniam et. al. [4] used different electrode materials namely copper, brass and tungsten while
EDM of Al-SiCp Metal Matrix Composite. Material Removal Rate (MRR), Electrode Wear Rate (EWR) and
Circularity (CIR) are considered as the performance measures. Artificial Neural Network is used for optimization of
the machining parameters such as current, pulse on time and flushing pressure. Investigations indicate that the
current is the most significant parameter. Among the three electrodes copper yields better performances. Machining
time is reduced with better performances.
Praveen Kumar Singh et. al. [5] focused on the effect of Copper and Brass electrodes on material removal rate
(MRR) and tool wear rate (TWR) for AISI D2 tool steel by using Die- Sinker EDM. The current was varied from 4
to 10 amp, the voltage and flushing pressure were constant, the MRR for copper electrode was in the range of
4.8139 -22.6580 mm3/min whereas the range of MRR for brass electrode was 7.2213-9.8203 gm/min. The trend of
TWR as shown in results increases with current for both the electrodes. The effect of voltage on MRR and TWR for
both the electrodes was analyzed. The MRR for copper electrode was continuously decreasing with voltage whereas
MRR for brass don‟t follow any specific trend. The TWR for both the electrodes decreases with voltage. It has been
observed that copper electrode is the best for machining AISI D2 tool steel by using Die- Sinker EDM.
4 EXPERIMENTAL SETUP & DOE
The electric discharge machine, model SPARKONIX SN-25 (die-sinking type) with servo-head (constant gap)
and positive polarity for electrode was used to conduct the experiments. Spark Erosion EDM oil was used as
dielectric fluid.
Material to be used as workpiece- AISI 316SS
Electrode to be used- Copper, having 10.00 mm diameter.
Variable Input Parameters- Current, Pulse on time, Pulse off time.
Constant Input Parameter- Voltage[50 V], Flushing Pressure[0.5 lb/m2]
Depth of Cut- 3 mm
Experiment has to be done at Jayvir Engineering, Ahmadabad.
DOE Adopted : Taguchi L9 Orthogonal Array
Overcut is calculated by, Overcut = [Diameter of Hole - Diameter of Tool] / 2
MRR is calculated by, MRR = [Weight of Workpiece Before Machining – Weight of Workpiece After Machining] /
[Time * Density of Workpiece Material]
TWR is calculated by, TWR = [Weight of Tool Before Machining – Weight of Workpiece After Machining]/ Time
Table 1. Chemical composition of AISI 316SS
Material
C Cr Fe Mn Ni P S Si N
AIS316
Wt. %
Max
0.08
18-20
66.345-
74
Max 2
8-10.5
Max
0.045
Max
0.03
0.75
0.1

Vol-3 Issue-2 2017 IJARIIE-ISSN(O)-2395-4396
4367 www.ijariie.com 1695
Typical Application of AISI 316 SS in : Chemical Equipments, Cooking Equipments, Cooling coil, Evaporators,
Food Processing Equipments, Hospital Equipments, Refrigerator Equipments, Paper & Rubber Industry. Corrosion
Resistant & Stain Resistant , use in P.V.C, acetates and for mould subjected to humid working. Wear Resistant i.e.
for moulding abrasive/filled material , including Injection-moulded thermosetting grades. High surface finish for
production of optical parts ,such as camera and sunglasses lenses and for medical container.
Technical Reasons for Selecting Copper: Copper can produce very fine surface finishes. Also Copper has high
electrical conductivity [1.04 * 10^7 Siemens/meter], Sufficiently high melting point [1083 ◦C]. Easily available &
low in cost [10].
The L9 Orthogonal Array methodology has been used to plan the experiments. Three factors are chosen the
design becomes a 3 level 3 factorial Taguchi design. The version 16 of the MINITAB software was used to develop
the experimental plan for L9 Orthogonal Array.
Table 2. Factors with Levels
Factors Notation
1
Levels
2 3
Current (Amps) Ip 4 8 15
Pulse on Time (μs) Ton 5 6 7
Pulse off Time (μs) Toff 4 5 6
5. EXPERIMENTAL RESULT & ANALYSIS
The effect of process parameters on the machining parameter is recorded in the table. The nine experiments done
on the electro discharge machine based on the Taguchi method and summarized in the following table.

Vol-3 Issue-2 2017 IJARIIE-ISSN(O)-2395-4396
4367 www.ijariie.com 1696
Table 3. Experimental Results For Round Shape Copper Tool
Table 4. Experimental Results For Square Shape Copper Tool

Vol-3 Issue-2 2017 IJARIIE-ISSN(O)-2395-4396
4367 www.ijariie.com 1697
5.1 Normality Testing For Round Shape Copper Tool
figure 1. Normality Testing For MRR
figure 2. Normality Testing For TWR
figure 3. Normality Testing For OC
Here, from above all graphs we can see that the P value of normality test is P ≥ 0.05. So, the data follows all the
natural phenomena & it is normal.
0.0150.0100.0050.000-0.005
99
95
90
80
70
60
50
40
30
20
10
5
1
TWR
Perc
ent
Mean 0.004065
StDev 0.004448
N 9
RJ 0.917
P-Value 0.063
Normality Test - Copper - TWRNormal
0.080.070.060.050.040.030.020.01
99
95
90
80
70
60
50
40
30
20
10
5
1
OC
Perc
ent
Mean 0.0425
StDev 0.01369
N 9
RJ 0.985
P-Value >0.100
Normality Test - Copper - OCNormal

Vol-3 Issue-2 2017 IJARIIE-ISSN(O)-2395-4396
4367 www.ijariie.com 1698
5.2 Normality Testing For Square Shape Copper Tool
fig 4. Normality Testing For MRR
figure 5. Normality Testing For OC
figure 6 . Normality Testing For TWR
Here, from above all graphs we can see that the P value of normality test is P ≥ 0.05. So, the data follows all the
natural phenomena & it is normal.
Vol-3 Issue-2 2017 IJARIIE-ISSN(O)-2395-4396
4367 www.ijariie.com 1699
5.3 Main Effect Plot For Round Shape Copper Tool
Graph 8. Main Effect Plot For MRR
figure 7. Main Effect Plot For OC
figure 8. Main Effect Plot For MRR
figure 9. Main Effect Plot For TWR
1584
0.054
0.048
0.042
0.036
0.030
765
654
0.054
0.048
0.042
0.036
0.030
I
Me
an
Pon
Poff
Main Effect Plot For OC - Copper
1584
0.0100
0.0075
0.0050
0.0025
0.0000
765
654
0.0100
0.0075
0.0050
0.0025
0.0000
I
Mea
n
Pon
Poff
Main Effect Plot For TWR - Copper

Vol-3 Issue-2 2017 IJARIIE-ISSN(O)-2395-4396
4367 www.ijariie.com 1700
5.4 Main Effect Plot For Square Shape Copper Tool
figure 10. Main Effect Plot For OC
figure 11. Main Effect Plot For MRR
figure 12. Main Effect Plot For TWR
1584
0.054
0.048
0.042
0.036
0.030
765
654
0.054
0.048
0.042
0.036
0.030
I
Me
an
Pon
Poff
Main Effect Plot For OC - Copper

Vol-3 Issue-2 2017 IJARIIE-ISSN(O)-2395-4396
4367 www.ijariie.com 1701
5.5 Interaction Plot For Round Shape Copper Tool
figure 13. Interaction Plot For OC
figure 14. Interaction Plot For MRR
figure 15. Interaction Plot For TWR
765 654
0.06
0.04
0.02
0.06
0.04
0.02
I
Pon
Poff
4
8
15
I
5
6
7
Pon
Interaction Plot For OC - Copper
765 654
0.010
0.005
0.000
0.010
0.005
0.000
I
Pon
Poff
4
8
15
I
5
6
7
Pon
Interaction Plot For TWR - Copper

Vol-3 Issue-2 2017 IJARIIE-ISSN(O)-2395-4396
4367 www.ijariie.com 1702
5.6 Interaction Plot For Square Shape Copper Tool
figure 16. Interaction Plot For OC
figure 17. Interaction Plot For MRR
figure 18. Interaction Plot For TWR

Vol-3 Issue-2 2017 IJARIIE-ISSN(O)-2395-4396
4367 www.ijariie.com 1703
5.7 Regression Model Analysis
5.7.1 Regression Model For Round Shape Copper Tool
Regression Model analysis for OC of Copper :
The Regression equation is OC = - 0.0237 + 0.00211 Current + 0.00967 Pon - 0.00217 Poff
Table 5. Regression Model analysis for OC
Source P
Regression 0.002
R-Sq = 94.3% R-Sq(adj) = 90.9%
Regression Model analysis for MRR of Copper :
The Regression equation is MRR = - 34.3 + 2.62 Current + 6.44 Pon - 1.14 Poff
Table 6. Regression Model analysis for MRR
Source P
Regression 0.016
R-Sq = 85.2% R-Sq(adj) = 82.2%
Regression Model analysis for TWR of Copper :
The Regression equation is TWR = - 0.00559 + 0.000893 Current + 0.000641 Pon - 0.000446 Poff
Table 7. Regression Model analysis for TWR
Source P
Regression 0.001
R-Sq = 96.1% R-Sq(adj) = 93.7%

Vol-3 Issue-2 2017 IJARIIE-ISSN(O)-2395-4396
4367 www.ijariie.com 1704
5.7.2 Regression Model For Square Shape Copper Tool
Regression Model analysis for OC of Copper :
The Regression equation is OC = - 0.0230 + 0.00209 Current + 0.0102 Pon - 0.00233 Poff
Table 8. Regression Model analysis for OC
Source P
Regression 0.002
R-Sq = 94.0% R-Sq(adj) = 90.5%
Regression Model analysis for MRR of Copper :
The Regression equation isMRR = - 34.1 + 2.73 Current + 6.53 Pon - 1.35 Poff
Table 9. Regression Model analysis for MRR
Source P
Regression 0.017
R-Sq = 84.9% R-Sq(adj) = 82.8%
Regression Model analysis for TWR of Copper :
The Regression equation is TWR = - 0.00519 + 0.000623 Current + 0.000667 Pon - 0.000217 Poff
Table 10. Regression Model analysis for TWR
Source P
Regression 0.000
R-Sq = 97.8% R-Sq(adj) = 96.4%
Here, from above regression model we can see that the P value of model is P ≤ 0.05. So, the model follows all the
natural phenomena & it is fit.
Vol-3 Issue-2 2017 IJARIIE-ISSN(O)-2395-4396
4367 www.ijariie.com 1705
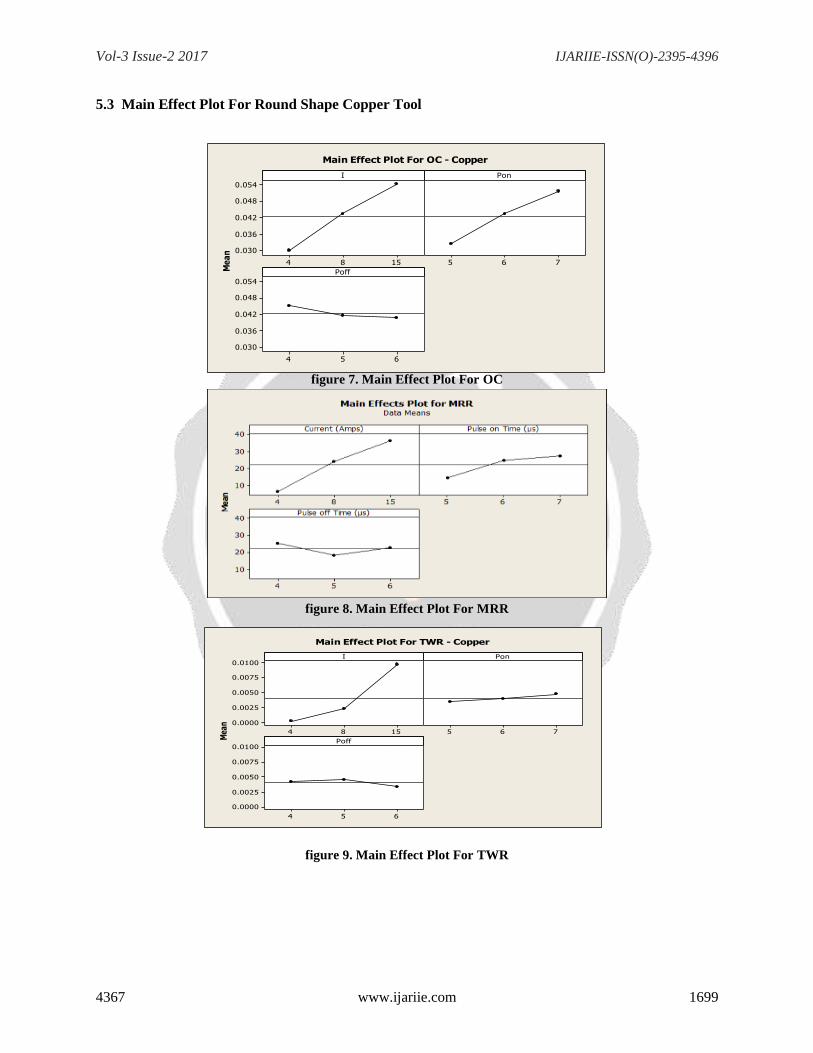
5.8 Optimization Problem Formulation The aim of present study was to determine the set of optimal parameters of EDM process to ensure minimum
overcut & tool wear rate and maximum material removal rate.
5.8.1 GA Function for Copper Tool _ Round function OC = DOE_OCG(x) OC = - 0.0237 + 0.00211 * x(1) + 0.00967 * x(2) - 0.00217 * x(3);
function MRR = DOE_MRRG(x)
MRR = - ( -34.3 + 2.62 * x(1) + 6.44 * x(2) – 1.14 * x(3));
function TWR = DOE_TWRG(x)
TWR = - 0.00559 + 0.000893 * x(1) + 0.000641 * x(2) - 0.000446 * x(3);
5.8.2 GA Function for Copper Tool _ Square function OC = DOE_OCC(x)
OC = - 0.0230 + 0.00209 * x(1) + 0.0102 * x(2) - 0.00233 * x(3);
function MRR = DOE_MRRC(x)
MRR = - (- 34.1 + 2.73 * x(1) + 6.53 * x(2) – 1.35 * x(3));
function TWR = DOE_TWRC(x)
TWR = - 0.00519 + 0.000623 * x(1) + 0.000667 * x(2) - 0.000217 * x(3);
Constraints for all the three functions are as follows:
• Current x(1) : Imin ≤ x(1) ≤ Imax, i.e. 4 A ≤ I ≤ 15 A
• Pulse on Time x(2) : Ponmin ≤ x(2) ≤ Ponmax, i.e. 5 μs ≤ Pon ≤ 7 μs
• Pulse off Time x(3) : Poffmin ≤ x(3) ≤ Poffmax, i.e. 4 μs ≤ Poff ≤ 6 μs
5.9 Optimization using MATLAB Tool box
5.9.1 Results of optimization using GA [Copper Tool_Round]
Optimized value of Overcut for Copper Tool using GA :
Table 11. Optimized Value of Overcut
Ext No. Process Variables Response
I Pon Poff OC
Population size : 50
1 4 5 6 0.020

Vol-3 Issue-2 2017 IJARIIE-ISSN(O)-2395-4396
4367 www.ijariie.com 1706
0 10 20 30 40 50 60 70 80 90 1000.02
0.03
0.04
0.05
GenerationF
itnes
s va
lue
Best: 0.02007 Mean: 0.02007
1 2 30
2
4
6
Number of variables (3)
Cur
rent
bes
t in
divi
dual
Current Best Individual
Best f itness
Mean fitness
Fig. 1 Plots of best fitness and best individual for GA using regression equations
Optimized value of MRR for Copper Tool using GA :
Table 12. Optimized Value of MRR
Ext No. Process Variables Response
I Pon Poff MRR
Population size : 50
1 15 7 5 45.51
Vol-3 Issue-2 2017 IJARIIE-ISSN(O)-2395-4396
4367 www.ijariie.com 1707
0 10 20 30 40 50 60 70 80 90 100-50
-40
-30
-20
GenerationF
itnes
s va
lue
Best: -45.5197 Mean: -45.5149
1 2 30
5
10
15
Number of variables (3)
Cur
rent
bes
t in
divi
dual
Current Best Individual
Best f itness
Mean fitness
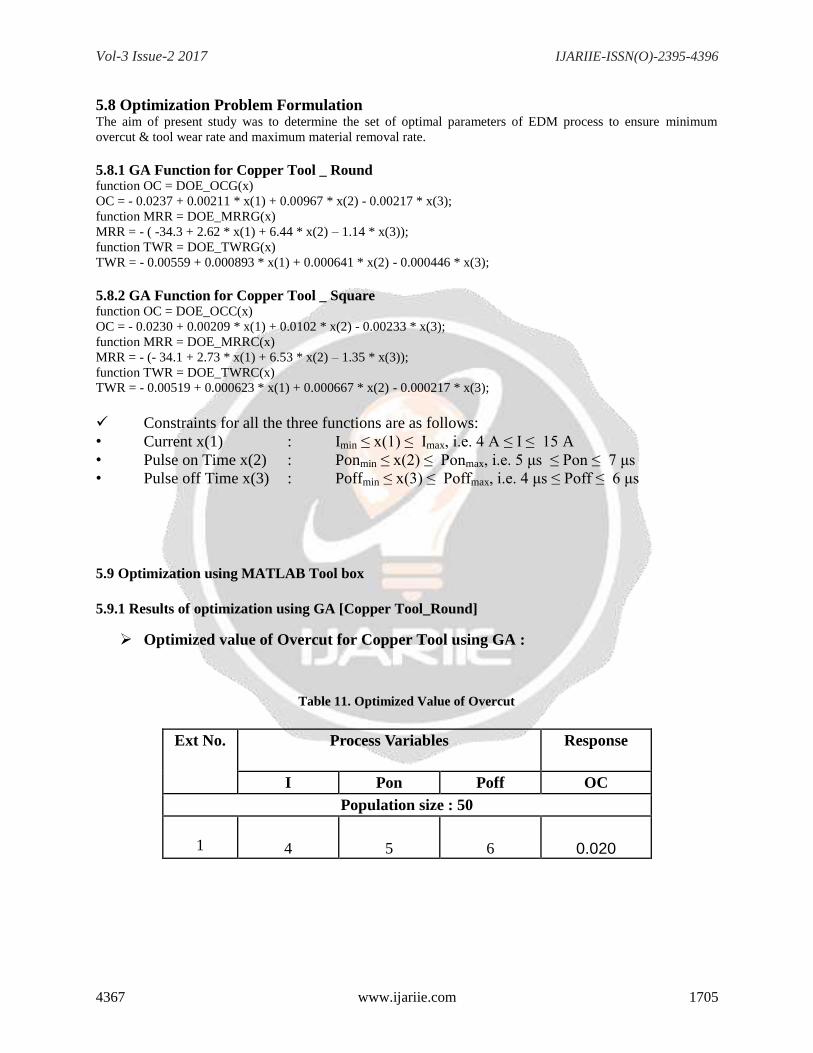
Fig. 2 Plots of best fitness and best individual for GA using regression equations
Optimized value of TWR for Copper Tool using GA :
Table 13. Optimized Value of TWR
Ext No. Process Variables Response
I Pon Poff TWR
Population size : 50
1 4 5 6 0.000028
Fig. 3 Plots of best fitness and best individual for GA using regression equations
0 10 20 30 40 50 60 70 80 90 1000
2
4
6x 10
-3
Generation
Fitn
ess
valu
e
Best: 2.81e-005 Mean: 2.81095e-005
1 2 30
2
4
6
Number of variables (3)
Cur
rent
bes
t in
divi
dual
Current Best Individual
Best f itness
Mean fitness

Vol-3 Issue-2 2017 IJARIIE-ISSN(O)-2395-4396
4367 www.ijariie.com 1708
5.9.2 Results of optimization using GA [Copper Tool_Square]
Optimized value of Overcut for Copper Tool using GA :
Table 14. Optimized Value of Overcut
Ext No. Process Variables Response
I Pon Poff OC
Population size : 50
1 4 5 6 0.022
0 10 20 30 40 50 60 70 80 90 1000.02
0.03
0.04
0.05
Generation
Fitness v
alu
e
Best: 0.02238 Mean: 0.02238
1 2 30
2
4
6
Number of variables (3)
Curr
ent
best
indiv
idual
Current Best Individual
Best f itness
Mean fitness
Fig. 4 Plots of best fitness and best individual for GA using regression equations
Optimized value of MRR for Copper Tool using GA :
Table 15. Optimized Value of MRR
Ext No. Process Variables Response
I Pon Poff MRR
Population size : 50
1 15 7 5 45.51

Vol-3 Issue-2 2017 IJARIIE-ISSN(O)-2395-4396
4367 www.ijariie.com 1709
0 10 20 30 40 50 60 70 80 90 100-50
-40
-30
-20
Generation
Fitness v
alu
e
Best: -47.1599 Mean: -47.1532
1 2 30
5
10
15
Number of variables (3)
Curr
ent
best
indiv
idual
Current Best Individual
Best f itness
Mean fitness
Fig. 5 Plots of best fitness and best individual for GA using regression equations
Optimized value of TWR for Copper Tool using GA :
Table 16. Optimized Value of TWR
Ext No. Process Variables Response
I Pon Poff TWR
Population size : 50
1 4 5 6 0.000018
0 10 20 30 40 50 60 70 80 90 100-2
-1.5
-1
-0.5x 10
-5
Generation
Fitness v
alu
e
Best: -1.89998e-005 Mean: -1.89949e-005
1 2 30
5
10
15
Number of variables (3)
Curr
ent
best
indiv
idual
Current Best Individual
Best f itness
Mean fitness
Fig. 6 Plots of best fitness and best individual for GA using regression equations

Vol-3 Issue-2 2017 IJARIIE-ISSN(O)-2395-4396
4367 www.ijariie.com 1710
5.10 Validation through Practical Experiment
The results obtained through optimization had to be validated. This was done through practical
performance of the experiment in the same manner as the practicals performed earlier as per DOE. The results are
tabulated as under :
Table 17. Validatory Experiment # 1 (As per Regression Model) (Copper Tool-Round)
Input Parameters Value* Optimized value of
Overcut
Experimental value of
Overcut
% Error
Current 4 A 0.020 0.021 4.76%
Pulse on Time 5 μs
Pulse off Time 6 μs
Input Parameters Value* Optimized value of
MRR
Experimental value of
MRR
% Error
Current 15 A 45.51 46.01 1.08%
Pulse on Time 7 μs
Pulse off Time 5 μs
Input Parameters Value* Optimized value of
TWR
Experimental value of
TWR
% Error
Current 4 A 0.000028 0.000029 3.44%
Pulse on Time 5 μs
Pulse off Time 6 μs
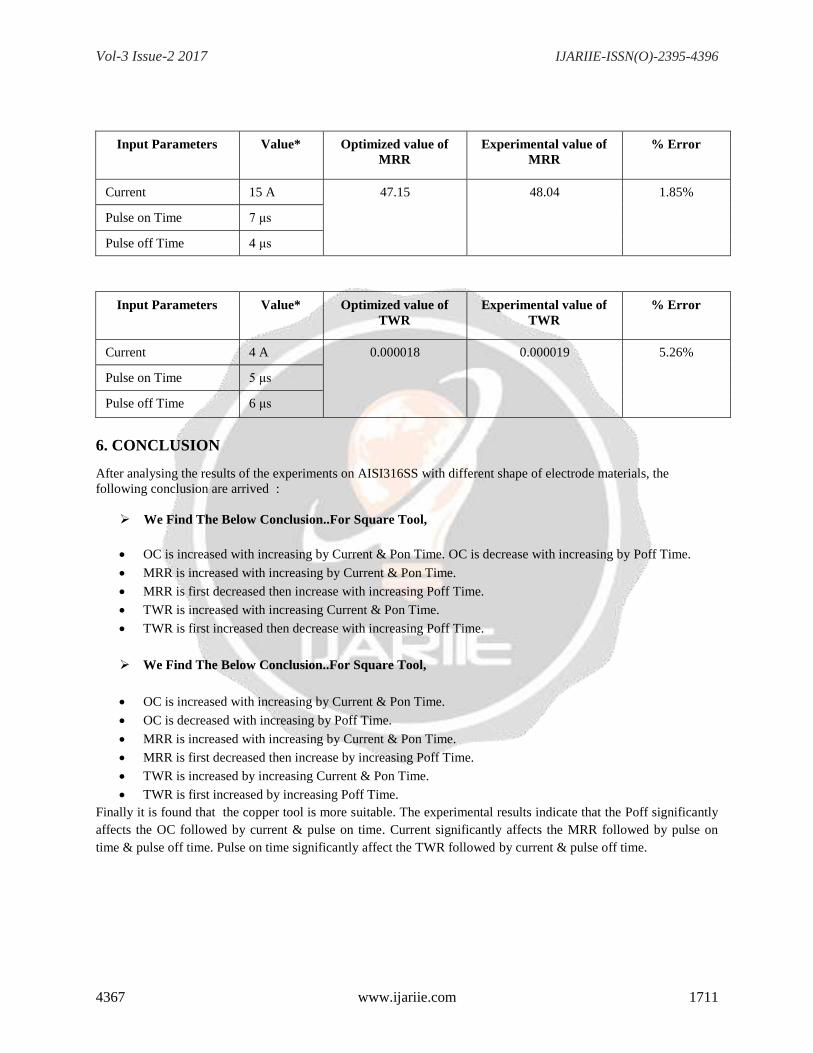
Table 18. Validatory Experiment # 2 (As per Regression Model) (Copper Tool-Square)
Input Parameters Value* Optimized value of
Overcut
Experimental value of
Overcut
% Error
Current 4 A 0.022 0.023 4.34%
Pulse on Time 5 μs
Pulse off Time 6 μs
Vol-3 Issue-2 2017 IJARIIE-ISSN(O)-2395-4396
4367 www.ijariie.com 1711
Input Parameters Value* Optimized value of
MRR
Experimental value of
MRR
% Error
Current 15 A 47.15 48.04 1.85%
Pulse on Time 7 μs
Pulse off Time 4 μs
Input Parameters Value* Optimized value of
TWR
Experimental value of
TWR
% Error
Current 4 A 0.000018 0.000019 5.26%
Pulse on Time 5 μs
Pulse off Time 6 μs
6. CONCLUSION
After analysing the results of the experiments on AISI316SS with different shape of electrode materials, the
following conclusion are arrived :
We Find The Below Conclusion..For Square Tool,
OC is increased with increasing by Current & Pon Time. OC is decrease with increasing by Poff Time.
MRR is increased with increasing by Current & Pon Time.
MRR is first decreased then increase with increasing Poff Time.
TWR is increased with increasing Current & Pon Time.
TWR is first increased then decrease with increasing Poff Time.
We Find The Below Conclusion..For Square Tool,
OC is increased with increasing by Current & Pon Time.
OC is decreased with increasing by Poff Time.
MRR is increased with increasing by Current & Pon Time.
MRR is first decreased then increase by increasing Poff Time.
TWR is increased by increasing Current & Pon Time.
TWR is first increased by increasing Poff Time.
Finally it is found that the copper tool is more suitable. The experimental results indicate that the Poff significantly
affects the OC followed by current & pulse on time. Current significantly affects the MRR followed by pulse on
time & pulse off time. Pulse on time significantly affect the TWR followed by current & pulse off time.

Vol-3 Issue-2 2017 IJARIIE-ISSN(O)-2395-4396
4367 www.ijariie.com 1712
7. FUTURE SCOPE
• In the present the regression was used. The empirical models will also use for comparison with regression
models.
• Different tool materials such as Brass, Tungsten, Copper Tungsten, Silver Tungsten, Tungsten Carbide,
Aluminum can be used.
• Other process parameters such as Polarity, Gap Voltage, Duty cycle, Flushing Pressure can be used for
analysis & also find out the surface roughness of work piece material.
• Multi – objective optimization can be done for the performance parameters.
• Work piece materials such as EN31 Tool Steel, Tungstan-Carbied, V Composite, Al 7075 B4C MMC, AISI
202 SS, AISI D3 Tool Steel, H-11 Steel, H-13 Tool Steel, Hastelloy Steel, Mild Steel, AISI 1040 Medium
Carbon Steel, EN19, EN9, AISI 316-L SS, NiTi60-SMA, AISI D2 Tool Steel, Ai-SiCP MMC, AISI P20
Tool Steel, Silver Steel, W300 Die Steel, AISI 4340 Steel, Titanium Super Alloy. etc can be used.
REFERENCES
[1] Shankar Singh et. al.,“Some investigations into the electric discharge machining of hardened tool steel using
different electrode materials”,Journal of Materials Processing Technology 149 (2004) 272–277.
[2] S.H.Tomadi et. al.,“ Analysis of the Influence of EDM Parameters on Surface Quality, Material Removal Rate
and Electrode Wear of Tungsten Carbide”, Proceedings of the International MultiConference of Engineers and
Computer Scientists 2009 Vol II IMECS 2009, March 18 - 20, 2009, Hong Kong.
[3] Subramanian Gopalakannan et. al.,“Effect of Electrode Materials on Electric Discharge Machining of 316 L and
17-4 PH Stainless Steels”, Journal of Minerals and Materials Characterization and Engineering, 2012, 11, 685-690
Published Online July 2012.
[4] V.Balasubramaniam et. al.,“ Optimization of Electrical Discharge Machining Parameters Using Artificial Neural
Network With Different Electrodes”, 5th International & 26th All India Manufacturing Technology, Design and
Research Conference (AIMTDR 2014) December 12th–14th, 2014, IIT Guwahati, Assam, India.
[5] Praveen Kumar Singh et. al.,“ Parametric studies for MRR and TWR using die sinking EDM with electrode of
Copper and Brass”, Proc. of the Intl. Conf. on Advances In Engineering And Technology - ICAET-2014, ISBN: 978-
1-63248-028-6 doi: 10.15224/ 978-1-63248-028-6-03-145.
[6] Priyesh N. Santoki et. al., “A Review - Status of Recent Developments & Effect of Machining Parameters on
Performance Parameters in EDM.”, International Journal of Innovative and Emerging Research in Engineering Vol.
X, No. X, 2015.
[7] Othman Belgassim et. al., “Optimization of the EDM Parameters on the Surface Roughness of AISI D3 Tool
Steel”, Proceedings of the 2012 International Conference on Industrial Engineering and Operations Management
Istanbul, Turkey, July 3 – 6, 2012.
[8] Priyesh N. Santoki et. al., “A Review - Status of Recent Developments & Effect of Machining Parameters on
Performance Parameters in EDM.”, International Journal of Innovative and Emerging Research in Engineering Vol.
X, No. X, 2015.
[9] Instruction and Maintenance Manual For Spark Erosion Machine by Sparkonix Pvt. Ltd.
[10] Techtips by Roger Kern.