Embed Size (px)
Citation preview

7/26/2019 Comparative Study of Different Color Normalization and Contrast Enhancement Techniques
http://slidepdf.com/reader/full/comparative-study-of-different-color-normalization-and-contrast-enhancement 1/6
I JSRD - I nternational Journal for Scientifi c Research & Development| Vol. 3, I ssue 12, 2016 | ISSN (onli ne): 2321-0613
All rights reserved by www.ijsrd.com 507
Comparative Study of Different Color Normalization and Contrast
Enhancement TechniquesRajiv Ranjan
Abstract — Image enhancement goes for enhancing the
nature of picture for better perception. The objective of
color and contrast enhancement, as a rule, is to give an all
the more engaging picture or video with clear hues andclarity of subtle elements. These improvements are
personally identified with distinctive properties of visual
sensation. It is essential to characterize these qualities before
examining the goals of shading and complexity upgrade, or
the different strategies to accomplish them. To achieve this,
we propose several algorithms for color normalization. Four
such algorithms have been discussed in the paper namely
Gray World Assumption, Retinex Theory, Diagonal Theory
and Quadratic Mapping of Intensities. Also, three Contrast
Enhancement techniques have been talked about. They are
Histogram Equalization Algorithm, Contrast Stretching
algorithm, Local Enhancement Using Histogram Statistics,
and Colour Deconvolution. Also, it has been demonstratedthat which algorithm works better in which scenario. The
objective of contrast enhancement is to build the visibility of
subtle elements that might be darkened by insufficient
worldwide and nearby lightness.Key words: Contrast Enhancement Techniques, Color
Normalization
I. I NTRODUCTION
An image taken from a stained blood sample utilizing a
conventional light microscope has many elements which
might influence the observed colors of the plasma
(background), cells, and stained objects. These conditionsmight be because of the microscope components likedifferent color features of the intensity adjustments, light
source, or color filters. However, color differences are
mainly related to the differences in the slide preparation
process: different stain concentrations, different staining
durations, or non-uniform staining. Thus, standardization of
the blood film preparation itself is also required. The colornormalization for the peripheral thin blood film images is
aimed at producing images which do not differ in their color
characteristics i.e. are normalized. After normalization
comes enhancement. Several techniques have been
implemented and the best one is taken into consideration for
both (color normalization and image enhancement).All thealgorithms have been implemented in Matlab
7.10.0(R2010a).
II. COLOR NORMALIZATION TECHNIQUES
A. Gray World Assumption
It argues that for a typical scene, the average intensity of the
red, green, and blue channels should be equal. This method
is very important for imaging, where the average is directed
towards darker regions of the region of interest which tend
to be neutral. In terms of implementation, let an image
I(m,n) have size A × B, where m and n denote the indices of
the pixel position. Furthermore, let Ir(m,n), Ig(m,n), andIb(m,n) denote the red, green, and blue channels of the
image respectively. We compute
vg 1
AB I
=
=
m, n Gvg 1AB Igm, n
=
=
Bvg 1AB Ibm,n=
=
In the event that the three values are
indistinguishable, the image already fulfills the gray world
assumption. Generally, they might not be. Commonly, we
keep the green channel unaltered and denote the gain of the
red and blue channels And
Then the red and blue pixels are adjusted by , , , ,
Fig. 1: Flowchart for grayworld assumption
B.
Retinex TheoryUnder the Retinex theory, it is contended that the apparent
white is connected with the maximum cone signals of the
human visual system. As such, the strategy for white
balance should be to equalize the extreme values of the red,
green, and blue channels. To prevent disturbances to thecomputation resulting from by a few bright pixels, one can
treat clusters of pixels or lowpass the image. To implement
this, we calculate ,, ,{,}
,
, Like the gray world assumption, we maintain thegreen channel unaltered. The gain for the red and blue
channels is defined as

7/26/2019 Comparative Study of Different Color Normalization and Contrast Enhancement Techniques
http://slidepdf.com/reader/full/comparative-study-of-different-color-normalization-and-contrast-enhancement 2/6
Comparative Study of Different Color Normalization and Contrast Enhancement Techniques
(IJSRD/Vol. 3/Issue 12/2016/133)
All rights reserved by www.ijsrd.com 508
The red and blue pixels is then adjusted by, , , ,
Fig. 2: Flowchart for Retinex theory
C. Quadratic Mapping of Intensities
The two methods have their separate qualities. For most
images, the two techniques produce diverse results. In other
words, the amended image can rarely fulfill both the gray
world assumption and the Retinex hypothesis. Moreover,there is likewise a fixed point in the mappings: for pixels
with zero intensity, the two mappings would not influencetheir qualities. To include the justifications of both methods,
we propose a simple adjustment here with a quadratic
mapping of intensities. Similarly as with the strategies
above, we keep the green channel unaltered.Let the change to the red channel be depicted as , , + ,
Where (u, ν) are the parameters for automatic white balance. To satisfy the gray world assumption, we require
that
=
=,
=
=,
i.e.
=
=
, +
=
=,
=
=,
Additionally, to fulfill the Retinex theory, we need
We can depict the above-mentioned two equations
in a matrix form:
[ max max ] [ max ]
This is solved analytically, either with Gaussian
elimination or using Cramer’s rule. The white balance for
the blue channels can be computed in an analogous manner.
D. Diagonal Method
The “diagonal model" is a simple and satisfactory model
which assumes that there is a diagonal 3x3 linear
transformation matrix which maps (pc = Mpu) the RGB
response under an unknown illuminant pu = (ru; gu; bu) tothe RGB response under a canonical known illuminant pc =(rc; gc; bc).
When the transformation matrix is assumed to be
Diagonal, its non-zero elements (mii) can be calculated by
simple scaling pci/pui
Where i E {r; g; b}.
M m 0 00 mgg 00 0 mbb
The simple gray value assumption can be
incorporated into the color normalization process of thin
blood films. Be that as it may, at first, input images must be
separated into foreground and background regions.
After separating the input (Iui) channels (i.e. {r; g;
b}), foreground (Ifur; g;b) and background (Ibui) images are
obtained and the proposed color normalization is performed
as follows:
1) Calculate ( )channel averages.Calculate : 55
2) Transform the whole image: with eq. ∑ (i={r,g,b} )
3) Calculate:
: using eq.
With
and
the reference image foreground channels
4) Transform only the foreground channels:
5) Replace the foreground channels of with to obtain
the final color normalized output image.
Fig. 3: Flowchart for quadratic mapping of intensities
7/26/2019 Comparative Study of Different Color Normalization and Contrast Enhancement Techniques
http://slidepdf.com/reader/full/comparative-study-of-different-color-normalization-and-contrast-enhancement 3/6
Comparative Study of Different Color Normalization and Contrast Enhancement Techniques
(IJSRD/Vol. 3/Issue 12/2016/133)
All rights reserved by www.ijsrd.com 509
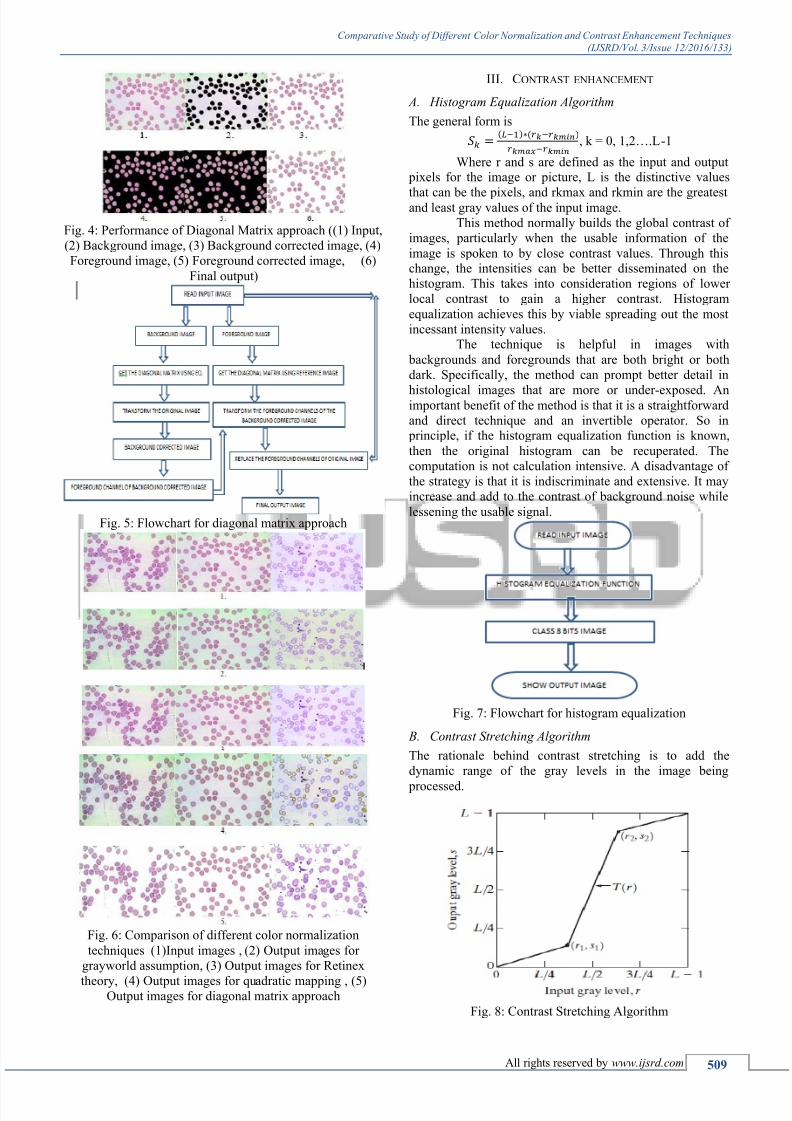
Fig. 4: Performance of Diagonal Matrix approach ((1) Input,
(2) Background image, (3) Background corrected image, (4)
Foreground image, (5) Foreground corrected image, (6)
Final output)
Fig. 5: Flowchart for diagonal matrix approach
Fig. 6: Comparison of different color normalization
techniques (1)Input images , (2) Output images for
grayworld assumption, (3) Output images for Retinex
theory, (4) Output images for quadratic mapping , (5)Output images for diagonal matrix approach
III. CONTRAST ENHANCEMENT
A. Histogram Equalization Algorithm
The general form is −∗−− , k = 0, 1,2….L-1
Where r and s are defined as the input and output pixels for the image or picture, L is the distinctive values
that can be the pixels, and rkmax and rkmin are the greatestand least gray values of the input image.
This method normally builds the global contrast of
images, particularly when the usable information of the
image is spoken to by close contrast values. Through thischange, the intensities can be better disseminated on the
histogram. This takes into consideration regions of lower
local contrast to gain a higher contrast. Histogram
equalization achieves this by viable spreading out the most
incessant intensity values.The technique is helpful in images with
backgrounds and foregrounds that are both bright or both
dark. Specifically, the method can prompt better detail in
histological images that are more or under-exposed. Animportant benefit of the method is that it is a straightforward
and direct technique and an invertible operator. So in principle, if the histogram equalization function is known,
then the original histogram can be recuperated. The
computation is not calculation intensive. A disadvantage of
the strategy is that it is indiscriminate and extensive. It may
increase and add to the contrast of background noise while
lessening the usable signal.
Fig. 7: Flowchart for histogram equalization
B. Contrast Stretching Algorithm
The rationale behind contrast stretching is to add the
dynamic range of the gray levels in the image being
processed.
Fig. 8: Contrast Stretching Algorithm

7/26/2019 Comparative Study of Different Color Normalization and Contrast Enhancement Techniques
http://slidepdf.com/reader/full/comparative-study-of-different-color-normalization-and-contrast-enhancement 4/6
Comparative Study of Different Color Normalization and Contrast Enhancement Techniques
(IJSRD/Vol. 3/Issue 12/2016/133)
All rights reserved by www.ijsrd.com 510
The depiction of points (r1, s1) and (r2, s2)
commands the shape and state of the transformation
function. The transformation is a linear function, wheneverr1=s1 and r2=s2, that delivers no adjustments in gray levels.
If r1=r2, s1=0 and s2=L-1, the transformation turns into a
thresholding function that makes a binary image.
Intermediate values of (r1, s1) and (r2, s2) generate different
degrees of spread in the gray levels of the output image,
subsequently influencing its contrast. In general, r1 ≤ r2 ands1 ≤ s2 is expected so that the function is single-valued and
monotonically expanding. This condition protects the order
of gray levels, subsequently avoiding the generation of
intensity artifacts in the processed image.
The general form is S 11 + m r⁄ E
Given s are the output image values, r are the inputimage values, m is the thresholding value and E is the slope.
Fig. 9: Flowchart for contrast stretching algorithm
C. Local Enhancement Using Histogram Statistics
This technique is utilized to enhance elements over little
areas in an image. The methodology is to characterize a
square or rectangular neighborhood and shift the center of
this area from pixel to pixel. At each location, the histogram
of the points in the neighborhood is processed and either ahistogram equalization or histogram specification
transformation function is gotten. To map the gray level of
the pixel centered in the neighborhood, this function is at
long last utilized. The center or the focal point of the nearby
region is then moved to an adjacent pixel location and the
process is rehashed. As only one singular new row orcolumn of the neighborhood alters during a pixel-to-pixel
translation of the region, renewing the histogram attained in
the previous location with the new data presented at each
motion step is changes. We acknowledge two uses of the
mean and variance for improvement purposes. The globalmean and variance are determined over an entire image and
are useful basically for gross adjustments of overall intensityand contrast. A considerably more powerful utilization of
these two measures is in local enhancement, in which the
local mean and variance are utilized as the premise for
making improvements that rely on image characteristics in a
predefined region for every pixel in the image.
∗ −=
−
= ∗ Assume (x, y) be the coordinates for a pixel in an
image, and then Sxy denotes a neighborhood (sub-image) ofstated size, centered at (x, y).Given the equation below, the
mean value mSxy of the pixels in Sxy can be found by ,,∈∗(,)rs, t is defined as the gray level at coordinates (s, t)
in the neighborhood and pr (s, t) is the nearby normalizedhistogram component equivalent to that value of gray level.
Essentially, the gray-level variance of the pixels inregion Sxy is defined by ,
,∈∗(,)
The local mean is a value signifying average gray
level in neighborhood Sxy, and the variance (or standard
deviation) is a count of contrast in that same area. A critical
part of image processing utilizing the local mean andvariance is the adjustability they allow in creating simple
and straightforward, yet intense enhancement techniques in
light of statistical measures that have a nearby, unsurprising
correspondence to image appearance.

7/26/2019 Comparative Study of Different Color Normalization and Contrast Enhancement Techniques
http://slidepdf.com/reader/full/comparative-study-of-different-color-normalization-and-contrast-enhancement 5/6
Comparative Study of Different Color Normalization and Contrast Enhancement Techniques
(IJSRD/Vol. 3/Issue 12/2016/133)
All rights reserved by www.ijsrd.com 511
Fig. 10: Flowchart for Local enhancement technique
Fig. 11: Comparison of various contrast enhancement
techniques. (1)Input (green channel of color normalizedimage), (2) Histogram Equalized, (3) Contrast stretched, (4)
Local enhancement output
D. Color Deconvolution
To analyze the photometric and morphometric
characteristics the, the relative contribution of dies must be
isolated.One of the major procedures used to deal with the
issue of dissolution of the contribution of various stains is
the utilization of color transformation techniques in light ofthe R-G-B (Red-Green-Blue) broadband data from any three
channel cameras. In any case, one of the major detriments of
the color transformation methods is that they do not bring
about the separations of the contribution of two or more
stains to the subsequent color. In histochemical andcytological staining generally, the areas are stained with
more than one color, so extensive data is lost when above
technique is utilized.
To conquer this issue and get a more precise result
the color deconvolution method is created. This technique
utilizes the broadband RGB data of the three channelcamera. This strategy is efficient to the point that it can be
utilized for separation of nearly all and every combination
and mix of three or more colors, given that the colors are
adequately dissimilar in their red, green or blue absorption
features. These method origins on the orthonormal
transformation of the original RGB image, relying on the
user-driven color data of the three colors. After de-
convolution, images can be remade independently and be
utilized for densitometry and texture examination for each
strain. This algorithm functions accurately when the
background is neutral, so background subtraction and color
correction must be enforced to image prior to handling.
After this, the de-convolution can be carried out
utilizing the accompanying steps:-
Detect intensities of light transmitted and amount
of stains with the absorbing factor, c, are portrayed by
lamberts law as: , exp The optical density (OD) is used for separation and
for each channel it can be defined as: ( ,⁄ ) ∗
Each stain will be characterized by a specific OD
for light and can be represented by a 3 X 1 OD vector. In the
case of 3 channel color system it can be described as matrix
of the form: [11 12 1321 22 2331 32 33]
To perform separation, we have to do the
orthonormal transformation of the RGB information toobtain independent information about each strain’s
contribution. The transformation has to be normalized to
achieve correct balancing of the normalization factor. To
implement normalization every OD vector is divided by its
complete length: √ + + ⁄ √ + + ⁄ √ + + ⁄ In this way, culminating in a normalized OD matrix:
[11 12 1321 22 2331 32 33]
If C is the 3 X 1 vectors for the amounts of the three
strains at a particular pixel, then the vectors of OD level
detected at that pixel is:
Y=CM
We can imply that, if we multiply the OD image
with the inverse of the OD matrix, known as color-deconvolution matrix, D, results in orthogonal representation
of the strains forming the image:C=D[Y]

7/26/2019 Comparative Study of Different Color Normalization and Contrast Enhancement Techniques
http://slidepdf.com/reader/full/comparative-study-of-different-color-normalization-and-contrast-enhancement 6/6
Comparative Study of Different Color Normalization and Contrast Enhancement Techniques
(IJSRD/Vol. 3/Issue 12/2016/133)
All rights reserved by www.ijsrd.com 512
1 2
3 4
Fig. 12: Performance of Color Deconvolution ((1) Input
image, (2) Contribution of DAB, (3) Contribution of
Haemotoxylin, (4) Contribution of Eosin)
Fig. 13: Flowchart for Color Deconvolution
IV. CONCLUSION
From the output images, it can be concluded that quadraticmapping of intensities provides good results for color
normalization. But if we have to focus on the objects rather
than the background, it is better to use diagonal matrix
approach as it provides good results for all the images. For
contrast enhancement, contrast stretching algorithm givesgood results when applied to the green channel of colorcorrected RGB images. Color Deconvolution is the only
efficient method to separate the contributions of more than
one stain in a multistained histochemical image.
R EFERENCES
[1] Lam E.Y.,”Combining Gray World and Retinex Theory
for Automatic White Balance in Digital Photography”.Proceedings of the Ninth International Symposium on
Consumer Electronics, (ISCE 2005).[2] Tek F.B.,”Computerized diagnosis of malaria”,Ph.D.
thesis,2007
[3] Tek F.B., Dempster A.G. and Kale I., “Malaria Parasite
Detection in Peripheral Blood images.”, Proceedings of
the British Machine Vision Conference (BMVC
2006),U.K.
[4] Al-amri S.S. ,”Contrast Stretching Enhancement in
Remote Sensing Image”, BIOINFO Sensor Networks,
Volume 1, Issue 1, 2011
[5] Zhu H., Chan F.H.Y., and Lam F. K. ,”Image ContrastEnhancement by Constrained Local Histogram
Equalization”, Computer Vision and Image
Understanding,Vol. 73, No. 2, February, pp. 281 – 290,1999
[6] Gonzales R.C., Woods R.E.,”Digital image processing”,2nd Ed,Prentice hall(2002) .
[7] Otsu N.,” A threshold selection method from gray-level
histogram”, IEEE Trans. Syst. Man Cybern., SMC-8
(1978).
[8] Ruifork A.C. , Johnston D.A. ,“Quantification of
Histochemical Staining by Color Deconvolution”,
Analytical & Quantitative Cytology & Histology,
23:291 – 299, 2001.


![An innovative technique for contrast enhancement of ... · contrast enhancement allows an easy distinction of the image components through an appropriate upsurge in its contrast [2]](https://img.pdfslide.us/doc/110x75/5f03b8127e708231d40a6f18/an-innovative-technique-for-contrast-enhancement-of-contrast-enhancement-allows.jpg)