Embed Size (px)
Citation preview
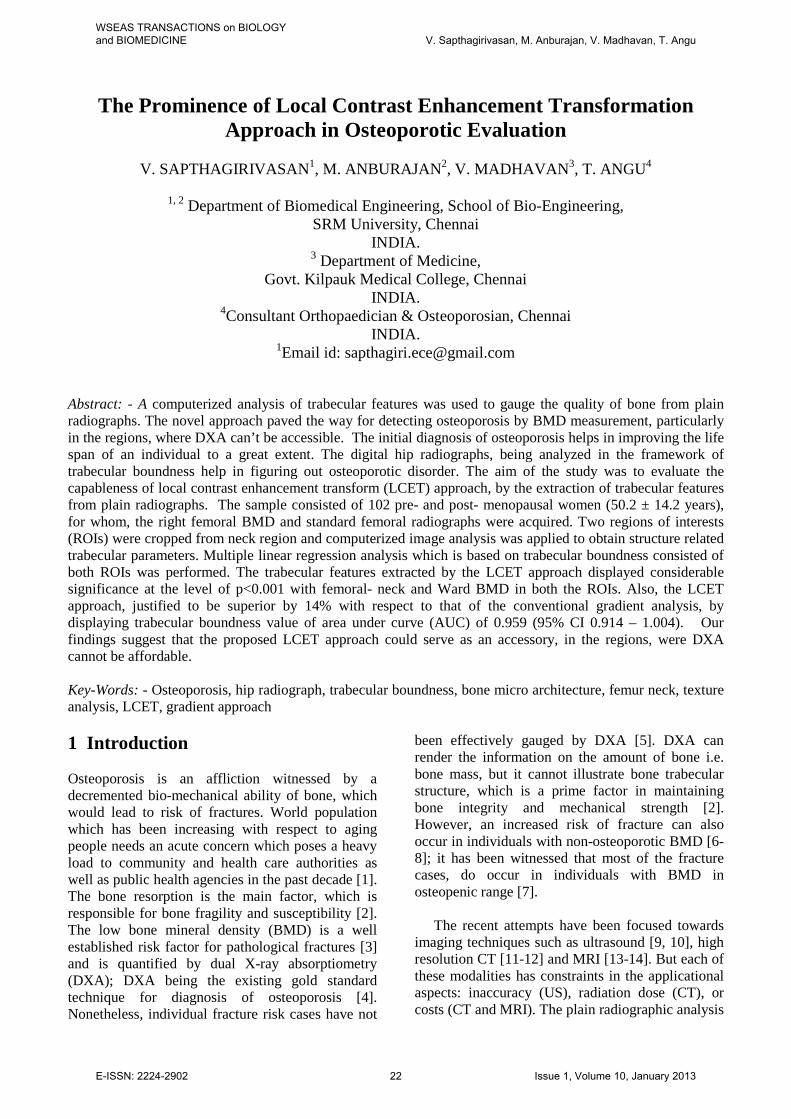
The Prominence of Local Contrast Enhancement Transformation Approach in Osteoporotic Evaluation
V. SAPTHAGIRIVASAN1, M. ANBURAJAN2, V. MADHAVAN3, T. ANGU4
1, 2 Department of Biomedical Engineering, School of Bio-Engineering,
SRM University, Chennai INDIA.
3 Department of Medicine, Govt. Kilpauk Medical College, Chennai
INDIA. 4Consultant Orthopaedician & Osteoporosian, Chennai
INDIA. 1Email id: [email protected]
Abstract: - A computerized analysis of trabecular features was used to gauge the quality of bone from plain radiographs. The novel approach paved the way for detecting osteoporosis by BMD measurement, particularly in the regions, where DXA can’t be accessible. The initial diagnosis of osteoporosis helps in improving the life span of an individual to a great extent. The digital hip radiographs, being analyzed in the framework of trabecular boundness help in figuring out osteoporotic disorder. The aim of the study was to evaluate the capableness of local contrast enhancement transform (LCET) approach, by the extraction of trabecular features from plain radiographs. The sample consisted of 102 pre- and post- menopausal women (50.2 ± 14.2 years), for whom, the right femoral BMD and standard femoral radiographs were acquired. Two regions of interests (ROIs) were cropped from neck region and computerized image analysis was applied to obtain structure related trabecular parameters. Multiple linear regression analysis which is based on trabecular boundness consisted of both ROIs was performed. The trabecular features extracted by the LCET approach displayed considerable significance at the level of p<0.001 with femoral- neck and Ward BMD in both the ROIs. Also, the LCET approach, justified to be superior by 14% with respect to that of the conventional gradient analysis, by displaying trabecular boundness value of area under curve (AUC) of 0.959 (95% CI 0.914 – 1.004). Our findings suggest that the proposed LCET approach could serve as an accessory, in the regions, were DXA cannot be affordable. Key-Words: - Osteoporosis, hip radiograph, trabecular boundness, bone micro architecture, femur neck, texture analysis, LCET, gradient approach 1 Introduction Osteoporosis is an affliction witnessed by a decremented bio-mechanical ability of bone, which would lead to risk of fractures. World population which has been increasing with respect to aging people needs an acute concern which poses a heavy load to community and health care authorities as well as public health agencies in the past decade [1]. The bone resorption is the main factor, which is responsible for bone fragility and susceptibility [2]. The low bone mineral density (BMD) is a well established risk factor for pathological fractures [3] and is quantified by dual X-ray absorptiometry (DXA); DXA being the existing gold standard technique for diagnosis of osteoporosis [4]. Nonetheless, individual fracture risk cases have not
been effectively gauged by DXA [5]. DXA can render the information on the amount of bone i.e. bone mass, but it cannot illustrate bone trabecular structure, which is a prime factor in maintaining bone integrity and mechanical strength [2]. However, an increased risk of fracture can also occur in individuals with non-osteoporotic BMD [6-8]; it has been witnessed that most of the fracture cases, do occur in individuals with BMD in osteopenic range [7].
The recent attempts have been focused towards
imaging techniques such as ultrasound [9, 10], high resolution CT [11-12] and MRI [13-14]. But each of these modalities has constraints in the applicational aspects: inaccuracy (US), radiation dose (CT), or costs (CT and MRI). The plain radiographic analysis
WSEAS TRANSACTIONS on BIOLOGY and BIOMEDICINE V. Sapthagirivasan, M. Anburajan, V. Madhavan, T. Angu
E-ISSN: 2224-2902 22 Issue 1, Volume 10, January 2013
in addition to the above mentioned imaging modalities has been proposed with efficient outcomes [15-20]. So, it is of significant interest to innovate as to how well, the new proposed method can be used to diagnose fracture risk owing to its low imaging costs and wide availability. X-Rays are commonly used in routine practice and constitute a 2D projection of the trabecular architecture. The outputting result is a texture and the relationships with the original 3D object are un-known, although spontaneously dependent. In certain cases, the trabecular bone texture within the vertebral body may be a marker of disease etiology [21]. The successful identification of osteoporotic sample from normal sample has been reported by many authors [15-17]; and even, fracture patients have been successfully isolated from normal group, using texture analysis of trabecular bone derived from radiographs [15, 17]. In 1970 itself, Singh et al [22] described a visual scoring index for the osteoporotic degree by assessing changes in the trabecular pattern of proximal femur and a high correlation was obtained (r2=0.66) between radiological and histological assessment of osteoporosis.
The trabecular structure and bone geometry can
be analyzed by radiography and information on bone density can be sought by utilizing relevant image analysis modalities. The X-ray image acquisition conditions can give rise to contrast and intensity variations between images, which will make it difficult to evaluate bone structure or density accurately; this is considered as methodological difficulty. Theoretically however, local gradient in the images are intensity and contrast independent and thus can overcome this methodological problem. The gradients earlier were used as the means for different edge detection methods and also for the medical image segmentation [23–28]. In addition, Veenland et al. [20, 29-30] and Pulkkinen et al. have successfully utilized the features of morphological gradient method for the trabecular bone analysis [8, 31]. The trabecular features extracted from digital X-ray image in the evaluation of osteoporosis based analysis has not been well studied so far across the globe. Henceforth, it would serve as an efficient tool for osteoporosis diagnosis. So, the present study focused on the quantitative features extracted from proximal femur digital X-ray by local contrast enhancement transformation (LCET) approach and the outcomes were compared with conventional gradient based approach and DXA.
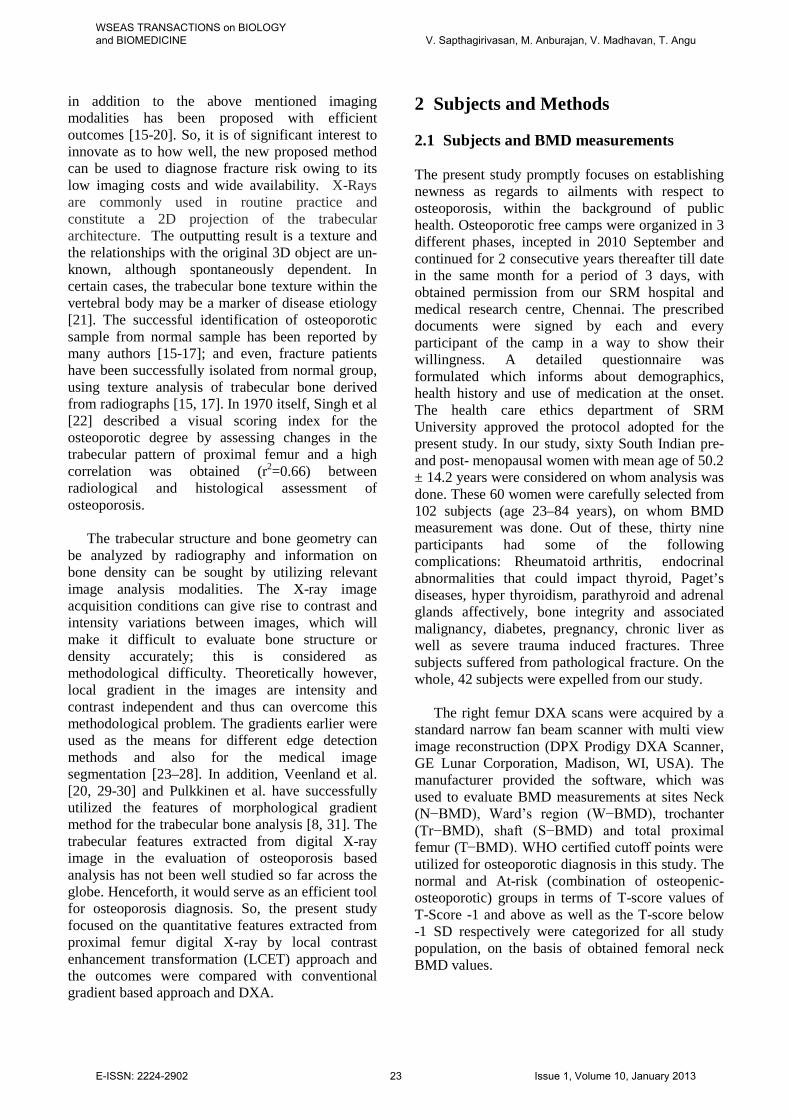
2 Subjects and Methods 2.1 Subjects and BMD measurements The present study promptly focuses on establishing newness as regards to ailments with respect to osteoporosis, within the background of public health. Osteoporotic free camps were organized in 3 different phases, incepted in 2010 September and continued for 2 consecutive years thereafter till date in the same month for a period of 3 days, with obtained permission from our SRM hospital and medical research centre, Chennai. The prescribed documents were signed by each and every participant of the camp in a way to show their willingness. A detailed questionnaire was formulated which informs about demographics, health history and use of medication at the onset. The health care ethics department of SRM University approved the protocol adopted for the present study. In our study, sixty South Indian pre- and post- menopausal women with mean age of 50.2 ± 14.2 years were considered on whom analysis was done. These 60 women were carefully selected from 102 subjects (age 23–84 years), on whom BMD measurement was done. Out of these, thirty nine participants had some of the following complications: Rheumatoid arthritis, endocrinal abnormalities that could impact thyroid, Paget’s diseases, hyper thyroidism, parathyroid and adrenal glands affectively, bone integrity and associated malignancy, diabetes, pregnancy, chronic liver as well as severe trauma induced fractures. Three subjects suffered from pathological fracture. On the whole, 42 subjects were expelled from our study.
The right femur DXA scans were acquired by a
standard narrow fan beam scanner with multi view image reconstruction (DPX Prodigy DXA Scanner, GE Lunar Corporation, Madison, WI, USA). The manufacturer provided the software, which was used to evaluate BMD measurements at sites Neck (N−BMD), Ward’s region (W−BMD), trochanter (Tr−BMD), shaft (S−BMD) and total proximal femur (T−BMD). WHO certified cutoff points were utilized for osteoporotic diagnosis in this study. The normal and At-risk (combination of osteopenic-osteoporotic) groups in terms of T-score values of T-Score -1 and above as well as the T-score below -1 SD respectively were categorized for all study population, on the basis of obtained femoral neck BMD values.
WSEAS TRANSACTIONS on BIOLOGY and BIOMEDICINE V. Sapthagirivasan, M. Anburajan, V. Madhavan, T. Angu
E-ISSN: 2224-2902 23 Issue 1, Volume 10, January 2013
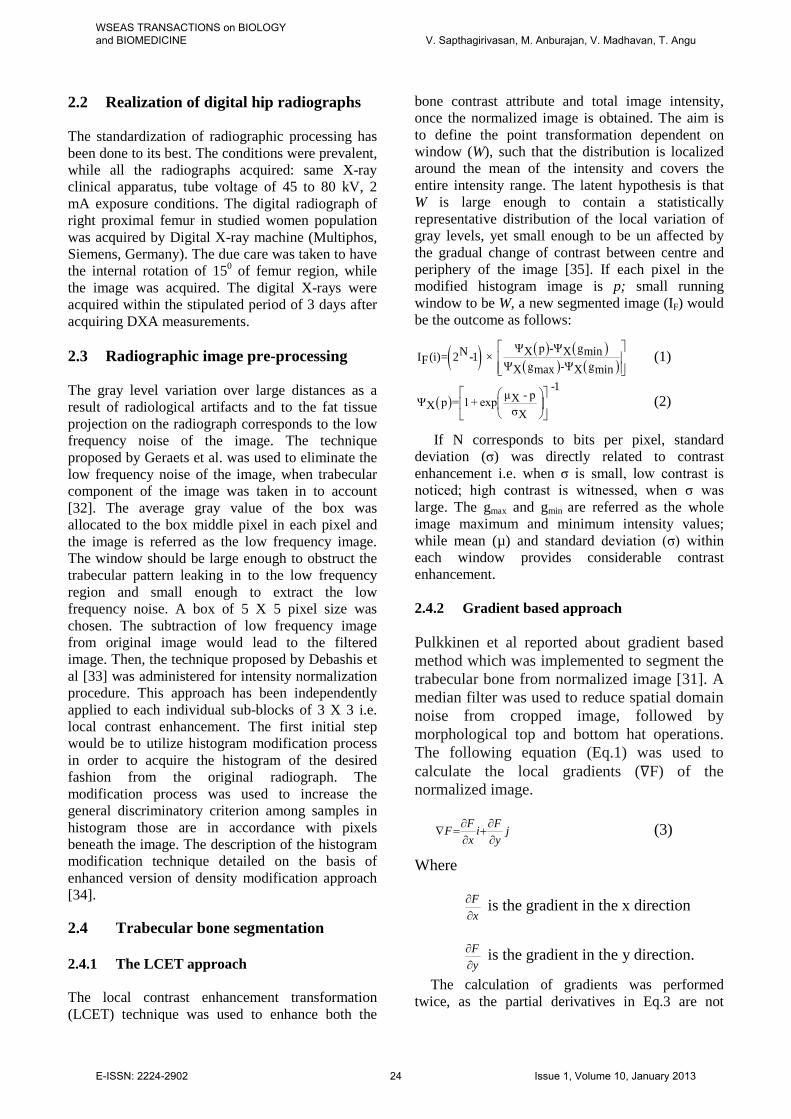
2.2 Realization of digital hip radiographs The standardization of radiographic processing has been done to its best. The conditions were prevalent, while all the radiographs acquired: same X-ray clinical apparatus, tube voltage of 45 to 80 kV, 2 mA exposure conditions. The digital radiograph of right proximal femur in studied women population was acquired by Digital X-ray machine (Multiphos, Siemens, Germany). The due care was taken to have the internal rotation of 150 of femur region, while the image was acquired. The digital X-rays were acquired within the stipulated period of 3 days after acquiring DXA measurements. 2.3 Radiographic image pre-processing The gray level variation over large distances as a result of radiological artifacts and to the fat tissue projection on the radiograph corresponds to the low frequency noise of the image. The technique proposed by Geraets et al. was used to eliminate the low frequency noise of the image, when trabecular component of the image was taken in to account [32]. The average gray value of the box was allocated to the box middle pixel in each pixel and the image is referred as the low frequency image. The window should be large enough to obstruct the trabecular pattern leaking in to the low frequency region and small enough to extract the low frequency noise. A box of 5 X 5 pixel size was chosen. The subtraction of low frequency image from original image would lead to the filtered image. Then, the technique proposed by Debashis et al [33] was administered for intensity normalization procedure. This approach has been independently applied to each individual sub-blocks of 3 X 3 i.e. local contrast enhancement. The first initial step would be to utilize histogram modification process in order to acquire the histogram of the desired fashion from the original radiograph. The modification process was used to increase the general discriminatory criterion among samples in histogram those are in accordance with pixels beneath the image. The description of the histogram modification technique detailed on the basis of enhanced version of density modification approach [34]. 2.4 Trabecular bone segmentation 2.4.1 The LCET approach The local contrast enhancement transformation (LCET) technique was used to enhance both the
bone contrast attribute and total image intensity, once the normalized image is obtained. The aim is to define the point transformation dependent on window (W), such that the distribution is localized around the mean of the intensity and covers the entire intensity range. The latent hypothesis is that W is large enough to contain a statistically representative distribution of the local variation of gray levels, yet small enough to be un affected by the gradual change of contrast between centre and periphery of the image [35]. If each pixel in the modified histogram image is p; small running window to be W, a new segmented image (IF) would be the outcome as follows:
( ) ( ) ( )( ) ( )
Ψ p -Ψ gX X minNI (i)= 2 -1 × F Ψ g -Ψ gX max X min
(1)
( ) -1
μ - pXΨ p = 1 + expX σX
(2)
If N corresponds to bits per pixel, standard deviation (σ) was directly related to contrast enhancement i.e. when σ is small, low contrast is noticed; high contrast is witnessed, when σ was large. The gmax and gmin are referred as the whole image maximum and minimum intensity values; while mean (µ) and standard deviation (σ) within each window provides considerable contrast enhancement. 2.4.2 Gradient based approach Pulkkinen et al reported about gradient based method which was implemented to segment the trabecular bone from normalized image [31]. A median filter was used to reduce spatial domain noise from cropped image, followed by morphological top and bottom hat operations. The following equation (Eq.1) was used to calculate the local gradients (∇F) of the normalized image.
F FF i jx y
∂ ∂∇ = +
∂ ∂ (3)
Where
Fx
∂∂
is the gradient in the x direction
Fy
∂∂
is the gradient in the y direction.
The calculation of gradients was performed twice, as the partial derivatives in Eq.3 are not
WSEAS TRANSACTIONS on BIOLOGY and BIOMEDICINE V. Sapthagirivasan, M. Anburajan, V. Madhavan, T. Angu
E-ISSN: 2224-2902 24 Issue 1, Volume 10, January 2013
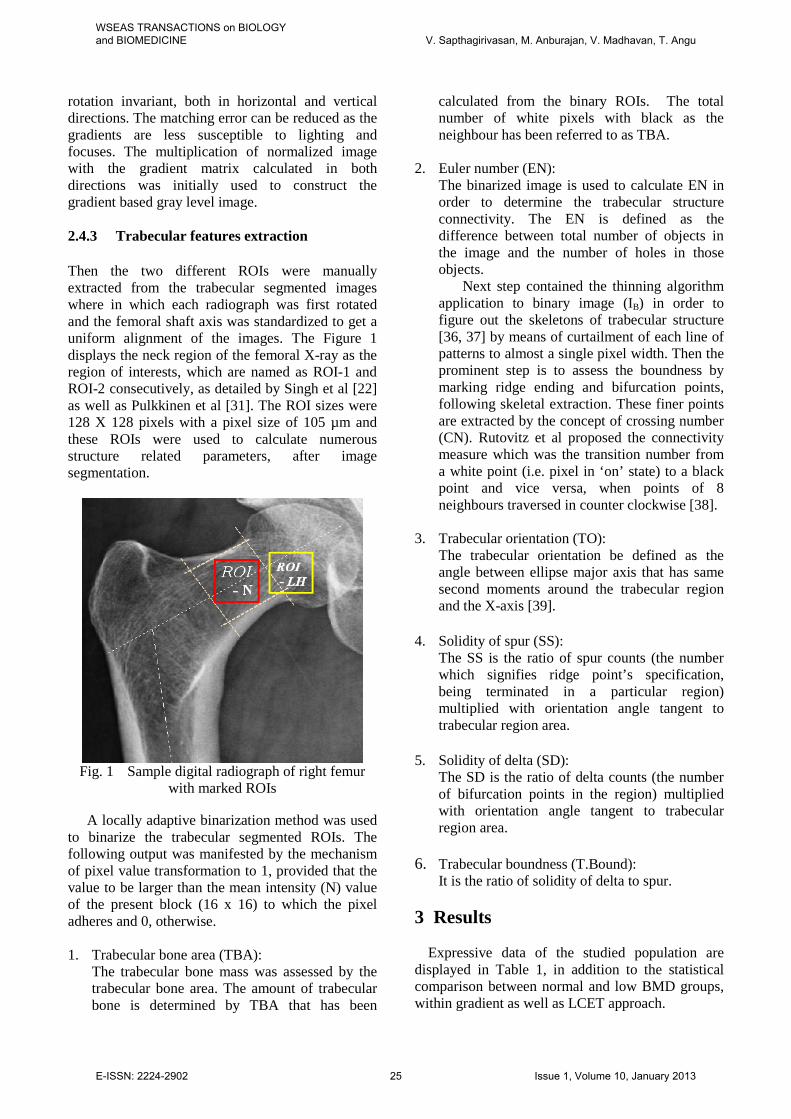
rotation invariant, both in horizontal and vertical directions. The matching error can be reduced as the gradients are less susceptible to lighting and focuses. The multiplication of normalized image with the gradient matrix calculated in both directions was initially used to construct the gradient based gray level image. 2.4.3 Trabecular features extraction Then the two different ROIs were manually extracted from the trabecular segmented images where in which each radiograph was first rotated and the femoral shaft axis was standardized to get a uniform alignment of the images. The Figure 1 displays the neck region of the femoral X-ray as the region of interests, which are named as ROI-1 and ROI-2 consecutively, as detailed by Singh et al [22] as well as Pulkkinen et al [31]. The ROI sizes were 128 X 128 pixels with a pixel size of 105 µm and these ROIs were used to calculate numerous structure related parameters, after image segmentation.
Fig. 1 Sample digital radiograph of right femur
with marked ROIs
A locally adaptive binarization method was used to binarize the trabecular segmented ROIs. The following output was manifested by the mechanism of pixel value transformation to 1, provided that the value to be larger than the mean intensity (N) value of the present block (16 x 16) to which the pixel adheres and 0, otherwise. 1. Trabecular bone area (TBA):
The trabecular bone mass was assessed by the trabecular bone area. The amount of trabecular bone is determined by TBA that has been
calculated from the binary ROIs. The total number of white pixels with black as the neighbour has been referred to as TBA.
2. Euler number (EN): The binarized image is used to calculate EN in order to determine the trabecular structure connectivity. The EN is defined as the difference between total number of objects in the image and the number of holes in those objects.
Next step contained the thinning algorithm application to binary image (IB) in order to figure out the skeletons of trabecular structure [36, 37] by means of curtailment of each line of patterns to almost a single pixel width. Then the prominent step is to assess the boundness by marking ridge ending and bifurcation points, following skeletal extraction. These finer points are extracted by the concept of crossing number (CN). Rutovitz et al proposed the connectivity measure which was the transition number from a white point (i.e. pixel in ‘on’ state) to a black point and vice versa, when points of 8 neighbours traversed in counter clockwise [38].
3. Trabecular orientation (TO): The trabecular orientation be defined as the angle between ellipse major axis that has same second moments around the trabecular region and the X-axis [39].
4. Solidity of spur (SS):
The SS is the ratio of spur counts (the number which signifies ridge point’s specification, being terminated in a particular region) multiplied with orientation angle tangent to trabecular region area.
5. Solidity of delta (SD):
The SD is the ratio of delta counts (the number of bifurcation points in the region) multiplied with orientation angle tangent to trabecular region area.
6. Trabecular boundness (T.Bound):
It is the ratio of solidity of delta to spur. 3 Results
Expressive data of the studied population are
displayed in Table 1, in addition to the statistical comparison between normal and low BMD groups, within gradient as well as LCET approach.
WSEAS TRANSACTIONS on BIOLOGY and BIOMEDICINE V. Sapthagirivasan, M. Anburajan, V. Madhavan, T. Angu
E-ISSN: 2224-2902 25 Issue 1, Volume 10, January 2013
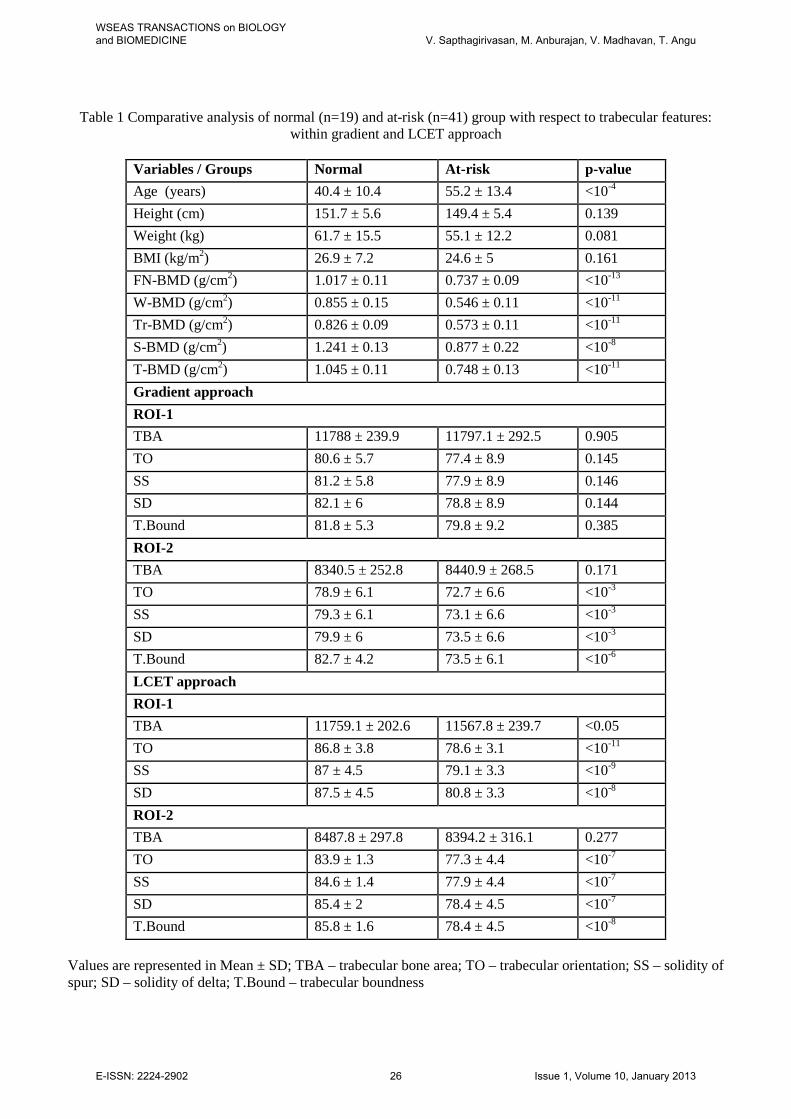
Table 1 Comparative analysis of normal (n=19) and at-risk (n=41) group with respect to trabecular features: within gradient and LCET approach
Variables / Groups Normal At-risk p-value Age (years) 40.4 ± 10.4 55.2 ± 13.4 <10-4 Height (cm) 151.7 ± 5.6 149.4 ± 5.4 0.139 Weight (kg) 61.7 ± 15.5 55.1 ± 12.2 0.081 BMI (kg/m2) 26.9 ± 7.2 24.6 ± 5 0.161 FN-BMD (g/cm2) 1.017 ± 0.11 0.737 ± 0.09 <10-13 W-BMD (g/cm2) 0.855 ± 0.15 0.546 ± 0.11 <10-11 Tr-BMD (g/cm2) 0.826 ± 0.09 0.573 ± 0.11 <10-11 S-BMD (g/cm2) 1.241 ± 0.13 0.877 ± 0.22 <10-8 T-BMD (g/cm2) 1.045 ± 0.11 0.748 ± 0.13 <10-11 Gradient approach ROI-1 TBA 11788 ± 239.9 11797.1 ± 292.5 0.905 TO 80.6 ± 5.7 77.4 ± 8.9 0.145 SS 81.2 ± 5.8 77.9 ± 8.9 0.146 SD 82.1 ± 6 78.8 ± 8.9 0.144 T.Bound 81.8 ± 5.3 79.8 ± 9.2 0.385 ROI-2 TBA 8340.5 ± 252.8 8440.9 ± 268.5 0.171 TO 78.9 ± 6.1 72.7 ± 6.6 <10-3 SS 79.3 ± 6.1 73.1 ± 6.6 <10-3 SD 79.9 ± 6 73.5 ± 6.6 <10-3 T.Bound 82.7 ± 4.2 73.5 ± 6.1 <10-6 LCET approach ROI-1 TBA 11759.1 ± 202.6 11567.8 ± 239.7 <0.05 TO 86.8 ± 3.8 78.6 ± 3.1 <10-11 SS 87 ± 4.5 79.1 ± 3.3 <10-9 SD 87.5 ± 4.5 80.8 ± 3.3 <10-8 ROI-2 TBA 8487.8 ± 297.8 8394.2 ± 316.1 0.277 TO 83.9 ± 1.3 77.3 ± 4.4 <10-7 SS 84.6 ± 1.4 77.9 ± 4.4 <10-7 SD 85.4 ± 2 78.4 ± 4.5 <10-7 T.Bound 85.8 ± 1.6 78.4 ± 4.5 <10-8
Values are represented in Mean ± SD; TBA – trabecular bone area; TO – trabecular orientation; SS – solidity of spur; SD – solidity of delta; T.Bound – trabecular boundness
WSEAS TRANSACTIONS on BIOLOGY and BIOMEDICINE V. Sapthagirivasan, M. Anburajan, V. Madhavan, T. Angu
E-ISSN: 2224-2902 26 Issue 1, Volume 10, January 2013
The statistical significance was not prominent in variables such as height, weight and BMI. In case of state of art gradient approach, statistical significance was not prominent with respect to TBA, TO, SS, SD and T.Bound (p=0.905, p=0.145, p=0.146, p=0.144 and p=0.385 respectively) in ROI-1. Similarly, with respect to ROI-2, the statistical significance was prominent with respect to TO, SS, SD and T.Bound at the level of p<10-3; however, TBA (p=0.171) demonstrated no significance. The proposed LCET approach details the exhibition of significance at the level of p<10-8 with respect to all the trabecular features in ROI-N; however, all trabecular features excepting TBA (p=0.277) showed significance at
the level of p<10-7 in ROI-LH among normal and low BMD groups.
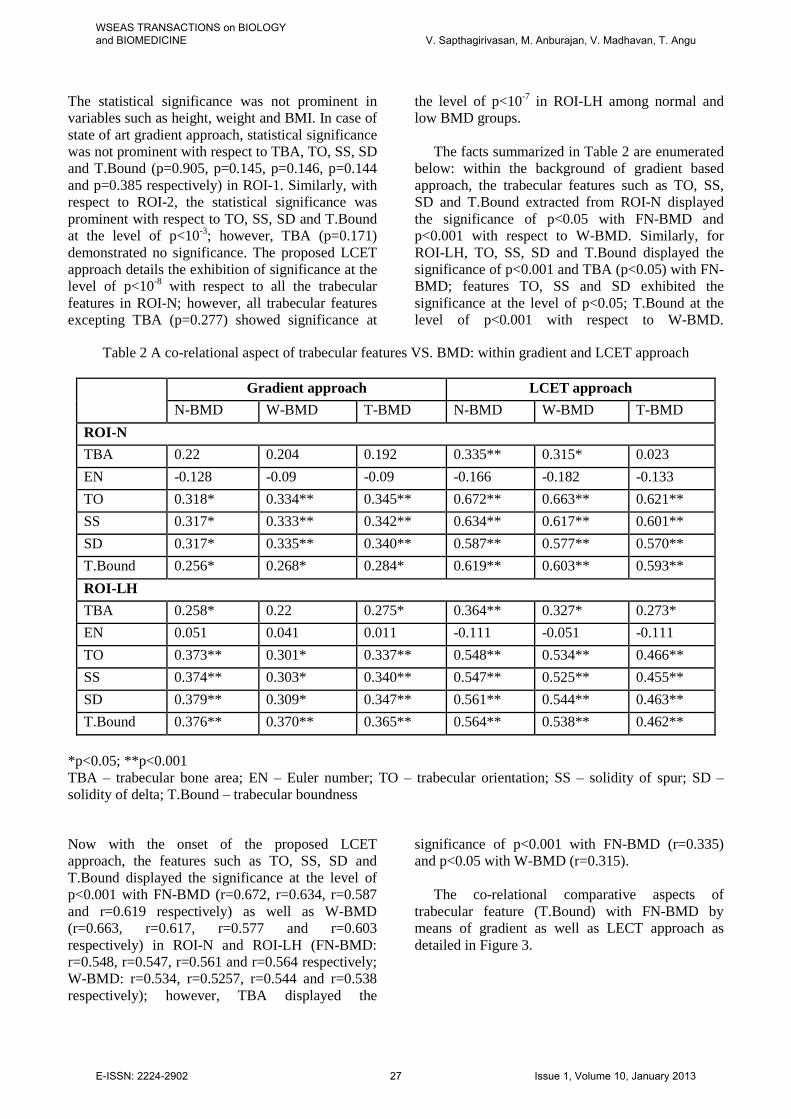
The facts summarized in Table 2 are enumerated below: within the background of gradient based approach, the trabecular features such as TO, SS, SD and T.Bound extracted from ROI-N displayed the significance of p<0.05 with FN-BMD and p<0.001 with respect to W-BMD. Similarly, for ROI-LH, TO, SS, SD and T.Bound displayed the significance of p<0.001 and TBA (p<0.05) with FN-BMD; features TO, SS and SD exhibited the significance at the level of p<0.05; T.Bound at the level of p<0.001 with respect to W-BMD.
Table 2 A co-relational aspect of trabecular features VS. BMD: within gradient and LCET approach
Gradient approach LCET approach N-BMD W-BMD T-BMD N-BMD W-BMD T-BMD
ROI-N TBA 0.22 0.204 0.192 0.335** 0.315* 0.023 EN -0.128 -0.09 -0.09 -0.166 -0.182 -0.133 TO 0.318* 0.334** 0.345** 0.672** 0.663** 0.621** SS 0.317* 0.333** 0.342** 0.634** 0.617** 0.601** SD 0.317* 0.335** 0.340** 0.587** 0.577** 0.570** T.Bound 0.256* 0.268* 0.284* 0.619** 0.603** 0.593** ROI-LH TBA 0.258* 0.22 0.275* 0.364** 0.327* 0.273* EN 0.051 0.041 0.011 -0.111 -0.051 -0.111 TO 0.373** 0.301* 0.337** 0.548** 0.534** 0.466** SS 0.374** 0.303* 0.340** 0.547** 0.525** 0.455** SD 0.379** 0.309* 0.347** 0.561** 0.544** 0.463** T.Bound 0.376** 0.370** 0.365** 0.564** 0.538** 0.462**
*p<0.05; **p<0.001 TBA – trabecular bone area; EN – Euler number; TO – trabecular orientation; SS – solidity of spur; SD – solidity of delta; T.Bound – trabecular boundness
Now with the onset of the proposed LCET approach, the features such as TO, SS, SD and T.Bound displayed the significance at the level of p<0.001 with FN-BMD (r=0.672, r=0.634, r=0.587 and r=0.619 respectively) as well as W-BMD (r=0.663, r=0.617, r=0.577 and r=0.603 respectively) in ROI-N and ROI-LH (FN-BMD: r=0.548, r=0.547, r=0.561 and r=0.564 respectively; W-BMD: r=0.534, r=0.5257, r=0.544 and r=0.538 respectively); however, TBA displayed the
significance of p<0.001 with FN-BMD (r=0.335) and p<0.05 with W-BMD (r=0.315).
The co-relational comparative aspects of trabecular feature (T.Bound) with FN-BMD by means of gradient as well as LECT approach as detailed in Figure 3.
WSEAS TRANSACTIONS on BIOLOGY and BIOMEDICINE V. Sapthagirivasan, M. Anburajan, V. Madhavan, T. Angu
E-ISSN: 2224-2902 27 Issue 1, Volume 10, January 2013
(a) (b)
(c) (d)
(e) (f)
(g) (h)
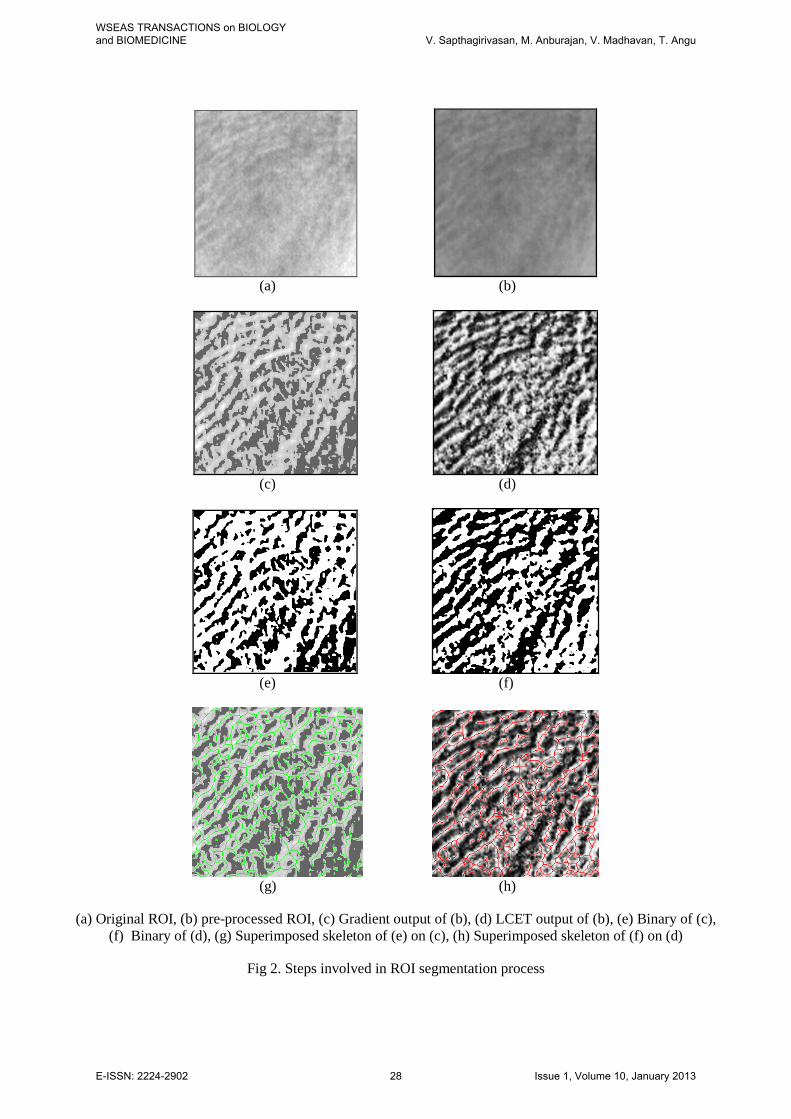
(a) Original ROI, (b) pre-processed ROI, (c) Gradient output of (b), (d) LCET output of (b), (e) Binary of (c), (f) Binary of (d), (g) Superimposed skeleton of (e) on (c), (h) Superimposed skeleton of (f) on (d)
Fig 2. Steps involved in ROI segmentation process
WSEAS TRANSACTIONS on BIOLOGY and BIOMEDICINE V. Sapthagirivasan, M. Anburajan, V. Madhavan, T. Angu
E-ISSN: 2224-2902 28 Issue 1, Volume 10, January 2013
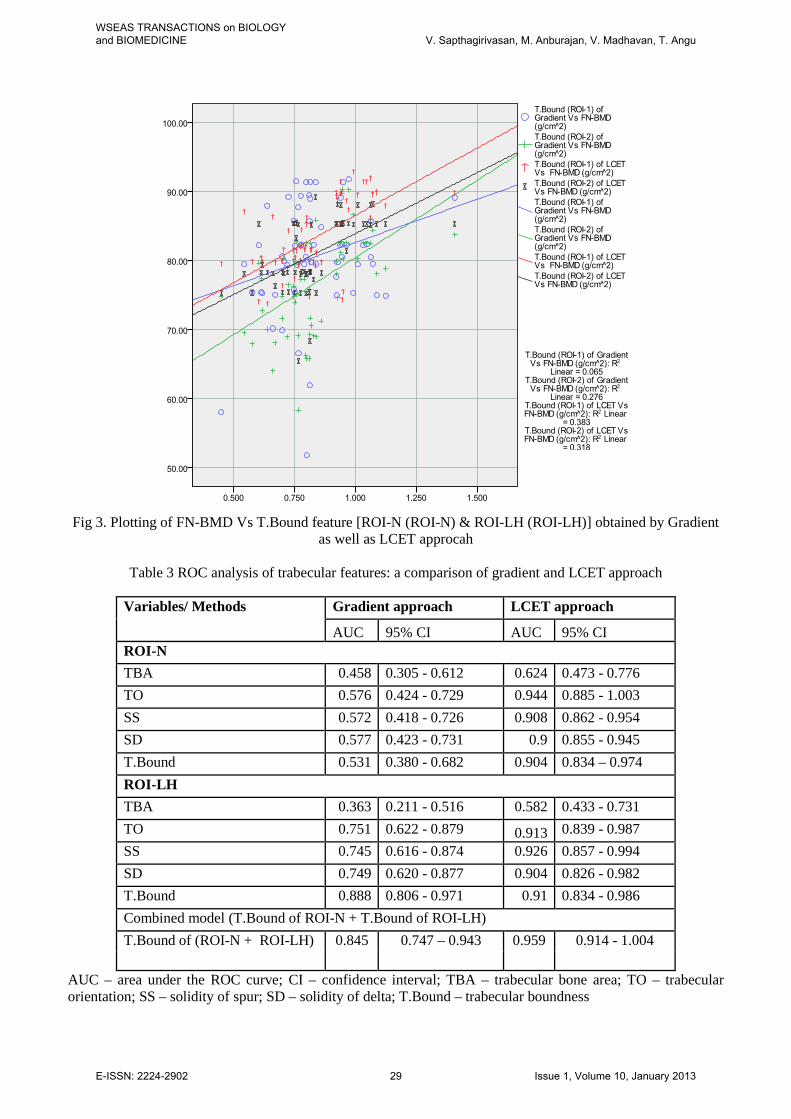
Fig 3. Plotting of FN-BMD Vs T.Bound feature [ROI-N (ROI-N) & ROI-LH (ROI-LH)] obtained by Gradient
as well as LCET approcah
Table 3 ROC analysis of trabecular features: a comparison of gradient and LCET approach
Variables/ Methods Gradient approach LCET approach
AUC 95% CI AUC 95% CI ROI-N TBA 0.458 0.305 - 0.612 0.624 0.473 - 0.776 TO 0.576 0.424 - 0.729 0.944 0.885 - 1.003 SS 0.572 0.418 - 0.726 0.908 0.862 - 0.954 SD 0.577 0.423 - 0.731 0.9 0.855 - 0.945 T.Bound 0.531 0.380 - 0.682 0.904 0.834 – 0.974 ROI-LH TBA 0.363 0.211 - 0.516 0.582 0.433 - 0.731 TO 0.751 0.622 - 0.879 0.913 0.839 - 0.987 SS 0.745 0.616 - 0.874 0.926 0.857 - 0.994 SD 0.749 0.620 - 0.877 0.904 0.826 - 0.982 T.Bound 0.888 0.806 - 0.971 0.91 0.834 - 0.986 Combined model (T.Bound of ROI-N + T.Bound of ROI-LH) T.Bound of (ROI-N + ROI-LH) 0.845 0.747 – 0.943 0.959 0.914 - 1.004
AUC – area under the ROC curve; CI – confidence interval; TBA – trabecular bone area; TO – trabecular orientation; SS – solidity of spur; SD – solidity of delta; T.Bound – trabecular boundness
WSEAS TRANSACTIONS on BIOLOGY and BIOMEDICINE V. Sapthagirivasan, M. Anburajan, V. Madhavan, T. Angu
E-ISSN: 2224-2902 29 Issue 1, Volume 10, January 2013
Results from ROC analysis are depicted in Table 3, in which, area under ROC curve (AUC) is provided for combined model of trabecular features of ROI-N and ROI-LH as well as trabecular features of individual ROIs. The AUC values of T.Bound in gradient approach as well as LCET approach with respect to ROI-N were 0.531 and 0.904 respectively.
The values with respect to ROI-LH were 0.888 and 0.91 respectively. The ROC analysis figured out the at-risk of fracture groups to be isolated from the norm al, utilizing the combined model of trabecular feature (T.Bound) being extracted from ROI-N and
ROI-LH. The combined T.Bound values were 0.845 (95% CI 0.747 – 0.943) and 0.959 (95% CI 0.914 – 1.004) for gradient as well as LECT approach respectively. The proposed LECT approach of combinational model exhibited 14% higher justification of AUC values, compared to the gradient approach.
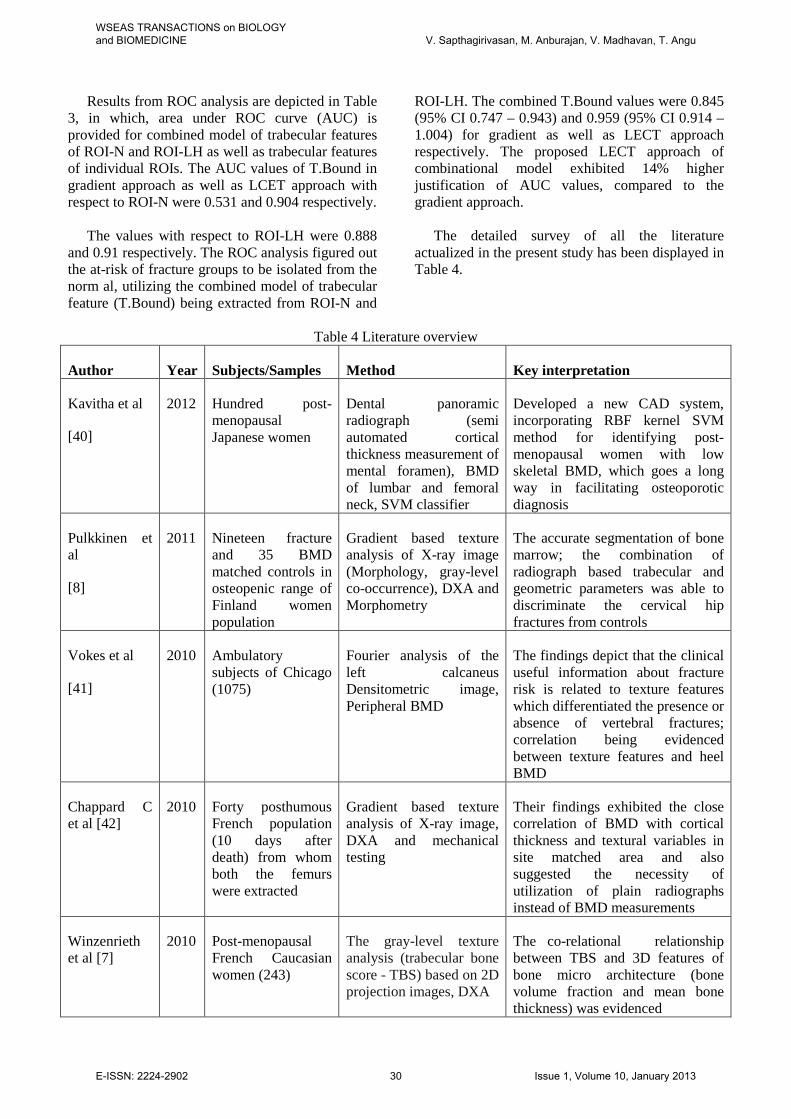
The detailed survey of all the literature
actualized in the present study has been displayed in Table 4.
Table 4 Literature overview
Author Year Subjects/Samples Method Key interpretation
Kavitha et al
[40]
2012 Hundred post- menopausal Japanese women
Dental panoramic radiograph (semi automated cortical thickness measurement of mental foramen), BMD of lumbar and femoral neck, SVM classifier
Developed a new CAD system, incorporating RBF kernel SVM method for identifying post-menopausal women with low skeletal BMD, which goes a long way in facilitating osteoporotic diagnosis
Pulkkinen et al
[8]
2011 Nineteen fracture and 35 BMD matched controls in osteopenic range of Finland women population
Gradient based texture analysis of X-ray image (Morphology, gray-level co-occurrence), DXA and Morphometry
The accurate segmentation of bone marrow; the combination of radiograph based trabecular and geometric parameters was able to discriminate the cervical hip fractures from controls
Vokes et al
[41]
2010 Ambulatory subjects of Chicago (1075)
Fourier analysis of the left calcaneus Densitometric image, Peripheral BMD
The findings depict that the clinical useful information about fracture risk is related to texture features which differentiated the presence or absence of vertebral fractures; correlation being evidenced between texture features and heel BMD
Chappard C et al [42]
2010 Forty posthumous French population (10 days after death) from whom both the femurs were extracted
Gradient based texture analysis of X-ray image, DXA and mechanical testing
Their findings exhibited the close correlation of BMD with cortical thickness and textural variables in site matched area and also suggested the necessity of utilization of plain radiographs instead of BMD measurements
Winzenrieth et al [7]
2010 Post-menopausal French Caucasian women (243)
The gray-level texture analysis (trabecular bone score - TBS) based on 2D projection images, DXA
The co-relational relationship between TBS and 3D features of bone micro architecture (bone volume fraction and mean bone thickness) was evidenced
WSEAS TRANSACTIONS on BIOLOGY and BIOMEDICINE V. Sapthagirivasan, M. Anburajan, V. Madhavan, T. Angu
E-ISSN: 2224-2902 30 Issue 1, Volume 10, January 2013
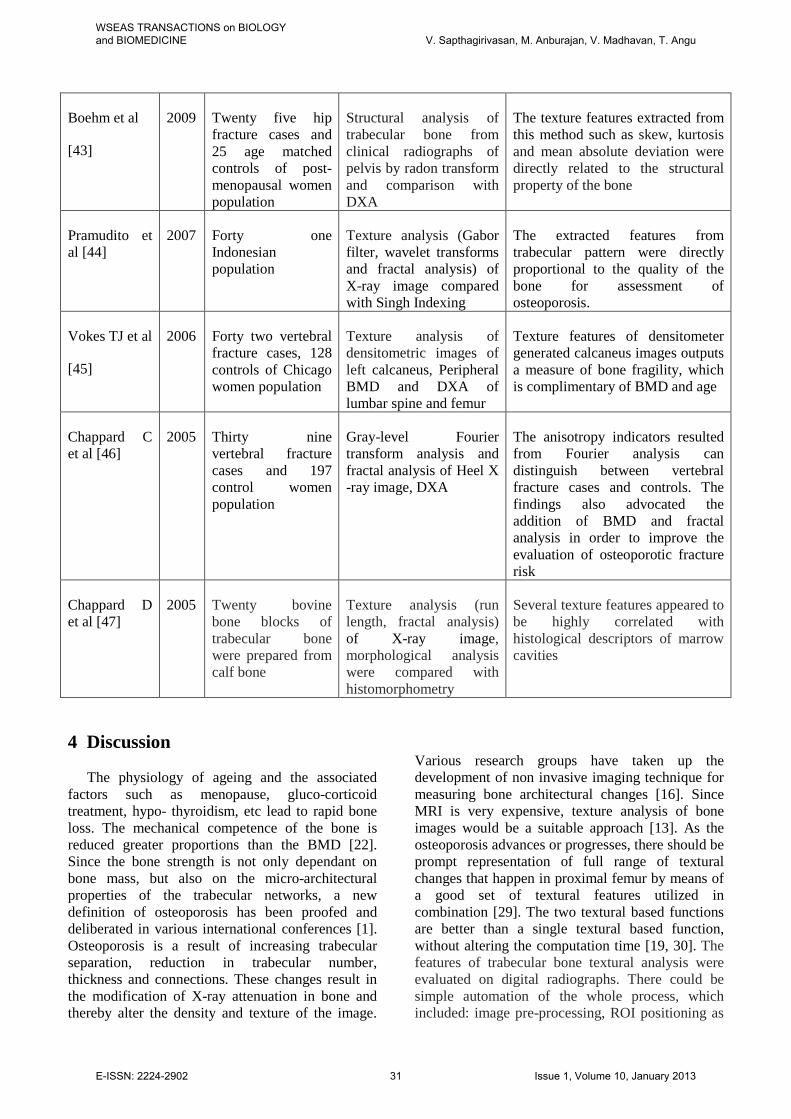
Boehm et al
[43]
2009 Twenty five hip fracture cases and 25 age matched controls of post-menopausal women population
Structural analysis of trabecular bone from clinical radiographs of pelvis by radon transform and comparison with DXA
The texture features extracted from this method such as skew, kurtosis and mean absolute deviation were directly related to the structural property of the bone
Pramudito et al [44]
2007 Forty one Indonesian population
Texture analysis (Gabor filter, wavelet transforms and fractal analysis) of X-ray image compared with Singh Indexing
The extracted features from trabecular pattern were directly proportional to the quality of the bone for assessment of osteoporosis.
Vokes TJ et al
[45]
2006 Forty two vertebral fracture cases, 128 controls of Chicago women population
Texture analysis of densitometric images of left calcaneus, Peripheral BMD and DXA of lumbar spine and femur
Texture features of densitometer generated calcaneus images outputs a measure of bone fragility, which is complimentary of BMD and age
Chappard C et al [46]
2005 Thirty nine vertebral fracture cases and 197 control women population
Gray-level Fourier transform analysis and fractal analysis of Heel X -ray image, DXA
The anisotropy indicators resulted from Fourier analysis can distinguish between vertebral fracture cases and controls. The findings also advocated the addition of BMD and fractal analysis in order to improve the evaluation of osteoporotic fracture risk
Chappard D et al [47]
2005 Twenty bovine bone blocks of trabecular bone were prepared from calf bone
Texture analysis (run length, fractal analysis) of X-ray image, morphological analysis were compared with histomorphometry
Several texture features appeared to be highly correlated with histological descriptors of marrow cavities
4 Discussion
The physiology of ageing and the associated
factors such as menopause, gluco-corticoid treatment, hypo- thyroidism, etc lead to rapid bone loss. The mechanical competence of the bone is reduced greater proportions than the BMD [22]. Since the bone strength is not only dependant on bone mass, but also on the micro-architectural properties of the trabecular networks, a new definition of osteoporosis has been proofed and deliberated in various international conferences [1]. Osteoporosis is a result of increasing trabecular separation, reduction in trabecular number, thickness and connections. These changes result in the modification of X-ray attenuation in bone and thereby alter the density and texture of the image.
Various research groups have taken up the development of non invasive imaging technique for measuring bone architectural changes [16]. Since MRI is very expensive, texture analysis of bone images would be a suitable approach [13]. As the osteoporosis advances or progresses, there should be prompt representation of full range of textural changes that happen in proximal femur by means of a good set of textural features utilized in combination [29]. The two textural based functions are better than a single textural based function, without altering the computation time [19, 30]. The features of trabecular bone textural analysis were evaluated on digital radiographs. There could be simple automation of the whole process, which included: image pre-processing, ROI positioning as
WSEAS TRANSACTIONS on BIOLOGY and BIOMEDICINE V. Sapthagirivasan, M. Anburajan, V. Madhavan, T. Angu
E-ISSN: 2224-2902 31 Issue 1, Volume 10, January 2013
well as the measurement. On the contrary with respect to the automated analysis, the semi quantitative approaches may induce bias such as the osteoporosis index as reported by Singh et al [9], which needs the assistance of a radiologist for image interpretation. The texture analysis ROIs were chosen to accommodate compressive and tensile trabeculae of the proximal femur [9]. The BMD measurement sites at femoral neck and Ward’s region were opted close to the location of the ROIs. The previous studies used similar regions [31, 32]. The mathematical morphology or fractal geometry is the basis for texture analysis approach. The implementation of morphological methods by means of X-ray images has been reported by several authors in identification of osteoporotic fracture risk patients [27-31]. In all these approaches, the X-ray images were clearly evidenced by the trabecular network. The positive correlation was witnessed between the textures gauged by mathematical morphology (trabecular main orientation, trabecular bound and TBA) with site matched BMDs [35]. Even the present study which is based on morphological gradient approach as well as LCET approach, exhibited similar strong co-relational relationship with morphological features such as trabecular orientation, solidity of spur and delta as well as trabecular boundness with FN-BMD and W-BMD; and also trabecular bone area similarly demonstrated moderate co-relational significance with FN-BMD and W-BMD. The texture analysis technique based on the morphological gradients was utilized by Veenland et al. [42] and observed the suitability of architecture alteration detection, incorporated by erosion or by opening the model. The texture analysis of X-ray images can be effectively known to gauge trabecular bone micro-architecture. Our study has some limitations. The concept of utilization of plain digital radiographs for which, we lack awareness with respect to BMD cut-off suggestions in osteoporosis evaluation has been adopted. Further, the proposed LCET approach has to be extended to larger population sample for validation. 5 Conclusion When utilizing image processing analysis, we have noticed that the morphological features such as trabecular orientation, solidity of spur and delta as well as trabecular boundness displayed high correlation with femoral neck BMD and Ward’s BMD in LCET approach. The combinational model of trabecular boundness, which included both ROI-1
and ROI-2 displayed higher AUC value of 0.959 with respect to LCET approach. The proposed LCET approach may serve to be an efficient diagnostic tool to evaluate osteoporosis, after validated clinical authentication. Acknowledgment
The authors would like to convey their gratitude to health care personnel of SRM University for their prompt and timely help. All financial necessities required to acquire the data and overall, were managed by first author only. The authors also wish to express their thanks to Mr. Kishore Mohan K B, Fulltime Research Scholar, SRM University. References: [1] Cooper C, Melton LJ “Hip fractures in the
elderly: a worldwide projection,” Osteoporos Int, Vol. 2, pp. 285–289, 1992
[2] Benhamou CL, Poupon S, Lespessailles E, et al “Fractal analysis of radiographic trabecular bone texture and bone mineral density: two complementary parameters related to osteoporotic fractures,” J Bone Miner Res, Vol.16, pp. 697–704, 2001
[3] Cummings SR, Black DM, Nevitt MC, et al “Bone density at various sites for prediction of hip fractures. The Study of Osteoporotic Fractures Research Group,” Lancet, Vol. 341, pp.72–5, 1993
[4] Anonymous, “Assessment of fracture risk and its application to screening for postmenopausal osteoporosis. Report of a WHO Study Group,” World Health Organ Tech Rep Ser, Vol.843, pp.1–129, 1994
[5] Robbins JA, Schott AM, Garnero P, et al “Risk factors for hip fracture in women with high BMD: EPIDOS study,” Osteoporos Int , Vol.16, pp. 149–154, 2005
[6] Stone KL, Seeley DG, Lui LY, et al “BMD at multiple sites and risk of fracture of multiple types: long-term results from the Study of Osteoporotic Fractures,” J Bone Miner Res, Vol. 18, pp. 1947–54, 2003.
[7] Winzenrieth R, Dufour R, Pothuaud L et al “A Retrospective Case–Control Study Assessing the Role of Trabecular Bone Score in Postmenopausal Caucasian Women with Osteopenia: Analyzing the Odds of Vertebral Fracture,” Calcif Tissue Int, Vol. 86, pp. 104–109, 2010
WSEAS TRANSACTIONS on BIOLOGY and BIOMEDICINE V. Sapthagirivasan, M. Anburajan, V. Madhavan, T. Angu
E-ISSN: 2224-2902 32 Issue 1, Volume 10, January 2013

[8] Pulkkinen P, Partanen J, Jalovaara P, et al “Combination of radiograph-based trabecular and geometrical parameters can discriminate cervical hip fractures from controls in individuals with BMD in non-osteoporotic range,” Bone, Vol. 49, pp. 290–294, 2011
[9] Nicholson PH, Müller R, Cheng XG, et al “Quantitative ultrasound and trabecular architecture in the human calcaneus,” J Bone Miner Res, Vol. 16, pp. 1886–1892, 2001
[10] Njeh CF, Fuerst T, Diessel E, et al “Is quantitative ultrasound dependent on bone structure? A reflection,” Osteoporos Int, Vol.12, pp.1–15, 2001
[11] Bauer JS, Kohlmann S, Eckstein F, et al “Structural analysis of trabecular bone of the proximal femur using multi-slice computed tomography: a comparison with dual X-ray absorptiometry for predicting biomechanical strength in vitro,” Calcif Tissue Int, Vol. 78, pp. 78–89, 2006.
[12] Showalter C, Clymer BD, Richmond B, et al “Three dimensional texture analysis of cancellous bone cores evaluated at clinical CT resolutions,” Osteoporos Int, Vol. 17, pp. 259–266, 2006
[13] Herlidou S, Grebe R, Grados F, et al “Influence of age and osteoporosis on calcaneus trabecular bone structure: a preliminary in vivo MRI study by quantitative texture analysis,” Magn Reson Imaging, Vol. 22, pp. 237–243, 2004
[14] Mueller D, Link TM, Monetti R et al “The 3Dbased scaling index algorithm: a new structure measure to analyze trabecular bone architecture in high-resolution MR images in vivo,” Osteoporos Int, Vol. 17, pp. 1483–1493, 2006
[15] Benhamou CL, Poupon S, Lespessailles E, et al “Fractal analysis of radiographic trabecular bone texture and bone mineral density: two complementary parameters related to osteoporotic fractures,” J Bone Miner Res, Vol. 16, pp. 697–704, 2001
[16] Pothuaud L, Lespessailles E, Harba R, et al “Fractal analysis of trabecular bone texture on radiographs: discriminant value in postmenopausal osteoporosis,” Osteoporos Int, Vol. 8, pp. 618–25, 1998
[17] Gregory JS, Stewart A, Undrill PE, et al “Identification of hip fracture patients from radiographs using Fourier analysis of the trabecular structure: a cross-sectional study,” BMC Med Imaging, Vol. 4:4, 2004
[18] Chappard D, Chennebault A, Moreau M, et al “Texture analysis of X-ray radiographs is a
more reliable descriptor of bone loss than mineral content in a rat model of localized disuse induced by the Clostridium botulinum toxin,” Bone, Vol. 28, pp. 72–9, 2001
[19] Guggenbuhl P, Bodic F, Hamel L, et al “Texture analysis of X-ray radiographs of iliac bone is correlated with bone micro-CT,” Osteoporos Int, Vol. 17, pp. 447–54, 2006
[20] Veenland JF, Grashuis JL, Weinans H, et al “Suitability of texture features to assess changes in trabecular bone architecture,” Pattern Recognit Lett, Vol. 23, pp. 395–403, 2002
[21] Zucker SW, Terzopoulos D “Rinding structures in co-occurrence matrices for texture analysis,” Comput Graph Image Proc, Vol. 12, pp. 286–308, 1980
[22] Singh M, Nagrath AR, Maini PS, “Changes in trabecular pattern of the upper end of the femur as an index of osteoporosis,” J Bone Joint Surg Am, Vol. 52, pp. 457–467, 1970
[23] Pietka E, “Lung segmentation in digital radiographs,” J Digit Imaging, Vol. 7, pp. 79–84, 1994
[24] Petric N, Chan HP, Sahiner B, et al “Combined adaptive enhancement and region-growing segmentation of breast masses on digital mammograms,” Med Phys, Vol. 26, pp. 1642–1654, 1999
[25] Paquerault S, Yarusso LM, Papaioannou J, et al “Radial gradient-based segmentation of mammographic micro-calcifications: observer evaluation and effect on CAD performance,” Med Phys, Vol. 31, pp. 2648–2657, 2004
[26] Chabat F, Desai SR, Hansell DM, et al “Gradient correction and classification of CT lung images for the automated quantification of mosaic attenuation pattern,” J Comput Assist Tomogr, Vol. 24, pp.437–447, 2000
[27] Haris K, Efstratiadis SN, Maglaveras N, et al “Model-based morphological segmentation and labeling of coronary angiograms,” IEEE Trans Med Imaging, Vol. 18, pp. 1003–1015, 1999
[28] Santos VT, Schiabel H, Goes CE, et al “A segmentation technique to detect masses in dense breast digitized mammograms,” J Digit Imaging, Vol. 15(Suppl 1), pp. 210–213, 2002
[29] Veenland JF, Link TM, Konermann W, et al “Unraveling the role of structure and density in determining vertebral bone strength,” Calcif Tissue Int, Vol. 61, pp. 474–479, 1997
[30] Veenland JF, Grashuis JL, Gelsema ES, “Texture analysis in radiographs: the influence of modulation transfer function and noise on
WSEAS TRANSACTIONS on BIOLOGY and BIOMEDICINE V. Sapthagirivasan, M. Anburajan, V. Madhavan, T. Angu
E-ISSN: 2224-2902 33 Issue 1, Volume 10, January 2013
the discriminative ability of texture features,” Med Phys, Vol.25, pp. 922–936, 1998
[31] Pulkkinen P, Jamsa T, Lochmüller EM, et al “Experimental hip fracture load can be predicted from plain radiography by combined analysis of trabecular bone structure and bone geometry,” Osteoporos Int, Vol. 19, pp. 547–58, 2008
[32] Geraets WGM, VanderStelt PF, Netelenbos CJ, et al “A new method for automatic recognition of the trabecular pattern,” J Bone Miner Res, Vol. 5, pp. 227–233, 1990
[33] Debashis S, Sankar KP, “Automatic exact histogram specification for contrast enhancement and visual system based quantitative evaluation,” IEEE Transactions on Image Processing, Vol. 20(5), pp. 1211-1220, 2011
[34] Sen D, Pal SK, “Feature space based image segmentation via density modification,” Proc IEEE Int Conf Image Process, pp. 4017–4020, 2009
[35] Sinthanayothin C, Boyce JF, Cook HL, et al “Automated localization of the optic disc, fovea, and retinal blood vessels from digital colour fundus images,” Br J Ophthalmol, Vol. 83, pp. 902–910, 1999
[36] Hastings E, “A Survey of Thinning Methodologies,” IEEE Transactions on Pattern analysis and Machine Intelligence, Vol. 4(9), pp. 869–885, 1992
[37] Lam L, Lee SW, Suen CY, “Thinning Methodologies - A Comprehensive Survey,” IEEE Transactions on Pattern analysis and machine intelligence, Vol. 14(9), 1992
[38] Rutovitz D, “Pattern recognition. Journal of the Royal Statistical Society,” Series-A 129(4), pp. 504–530, 1966
[39] Chaudari D, Samal A, “A simple method for fitting of bounding rectangle to closed regions,” Pattern Recogn, Vol. 40, pp. 1981–1989, 2007
[40] Kavitha MS, Asano A, Taguchi A, et al “Diagnosis of osteoporosis from dental
panoramic radiographs using the support vector machine method in a computer-aided system,” BMC Medical Imaging, Vol 12:1, 2012
[41] Vokes T, Lauderdale D, Siu-Ling M et al “Radiographic Texture Analysis of Densitometric Calcaneal Images: Relationship to Clinical Characteristics and to Bone Fragility,” Journal of Bone and Mineral Research, Vol. 25(1) pp. 56–63, 2010
[42] Chappard C, Bousson V, Bergot C, et al “Prediction of Femoral Fracture Load: Cross-sectional Study of Texture Analysis and Geometric Measurements on Plain Radiographs versus Bone Mineral Density,” Radiology, Vol. 255(2), 2010
[43] Boehm HF, Lutz M, Mutschler W, et al “Using Radon transform of standard radiographs of the hip to differentiate between post-menopausal women with and without fracture of the proximal femur,” Osteoporos Int, Vol. 20, pp. 323–333, 2009
[44] Pramudito JT, Soegijoko S, Mengko TR, et al “Trabecular Pattern Analysis of Proximal Femur Radiographs for Osteoporosis Detection,” Journal of Biomedical & Pharmaceutical Engineering, Vol. 1(1), pp. 45-51, 2007
[45] Vokes TJ, Giger ML, Chinander MR, et al “Radiographic texture analysis of densitometer-generated calcaneus images differentiates postmenopausal women with and without fractures,” Osteoporos Int, Vol. 19, pp. 547–558, 2006
[46] Chappard C, Barbara BI, Lemineur G, et al “Anisotropy changes in post-menopausal osteoporosis: characterization by a new index applied to trabecular bone radiographic images,” Osteoporos Int, Vol. 16, pp. 1193–1202, 2005
[47] Chappard D, Guggenbuhl, Legrand E, et al “Texture analysis of X-ray radiographs is correlated with bone histomorphometry,” J Bone Miner Metab, Vol. 23, 24–29, 2005
WSEAS TRANSACTIONS on BIOLOGY and BIOMEDICINE V. Sapthagirivasan, M. Anburajan, V. Madhavan, T. Angu
E-ISSN: 2224-2902 34 Issue 1, Volume 10, January 2013