Embed Size (px)
Citation preview
Journal of Engineering Science and Technology Review 5 (4) (2012) 42 -47 Special Issue on Renewable Energy Systems
Research Article
Comparative Performance Analysis of Small Scale Wind Turbines
P. Kádár
Óbuda University, Dept. of Power Systems, Hungary
Received 6 August 2012; Revised 3 October 2012; Accepted 10 October 2012 ___________________________________________________________________________________________ Abstract Expectations towards small scale urban wind based electricity generation are rather high. The vendors promise high production rates and high returns on the investment. In this paper we describe our practical measurement experiment of one horizontal and three vertical axis turbines. The result shows that the performance of the turbines does not meet the expectations and the urban wind blow is really far from being optimal in energy production. Keywords: Horizontal and Vertical axis wind turbines, wind measurements, island mode operation, wind correlation, battery storage
___________________________________________________________________________________________
1. Introduction Óbuda University and Budapest Airport, Hungary made a joint research about the applicability of the small scale wind turbines. The initial assumption was to set up four different turbines and to investigate their future role in supplying the airport’s devices, e.g. emergency lighting or supply of remote meteorological substations. In the market there is a high expectation towards the vertical axis wind turbines (VAWT) that is why our task was to test such devices, as well. For referencing we used also one horizontal axis turbine (HAWT). The aim of the measurement was to counterpoint the theoretical expectations and the real measurements. The real urban circumstances are far from the laboratory test environment. The main steps we made were:
- selection of test site based on wind measurement - estimation of the energy that can be produced by
the turbines - setting up a real measurement environment - evaluation of month-long measurement period
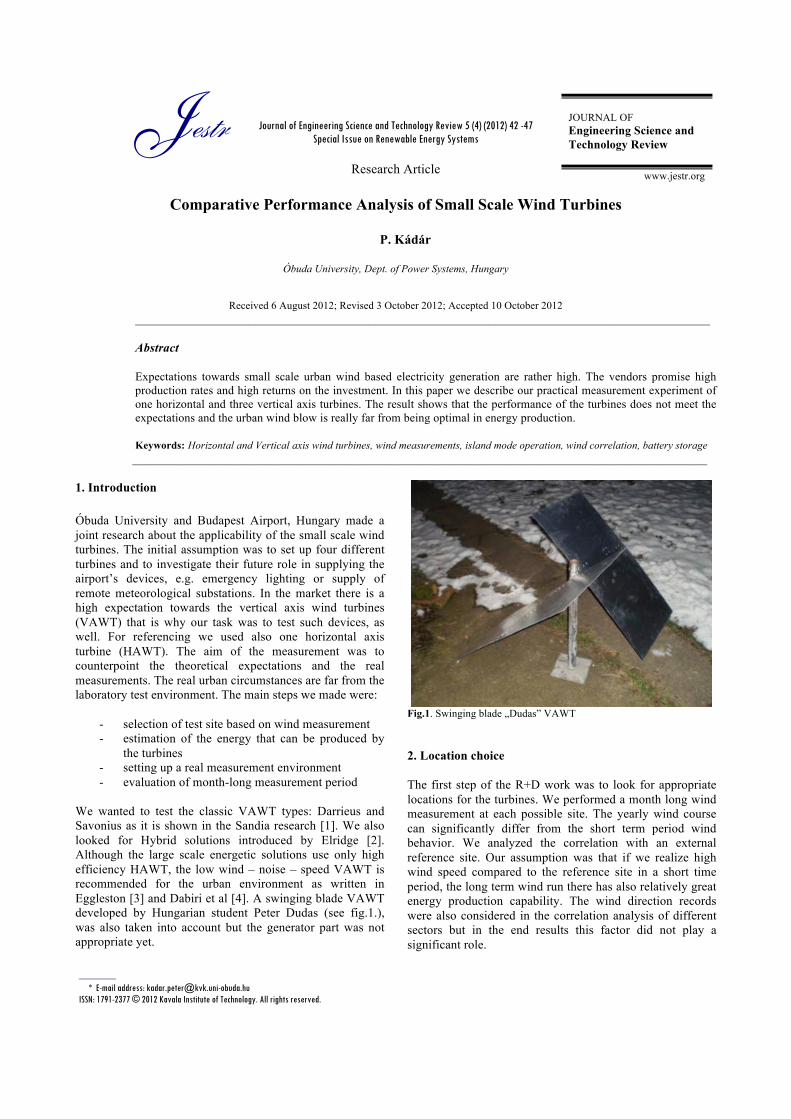
We wanted to test the classic VAWT types: Darrieus and Savonius as it is shown in the Sandia research [1]. We also looked for Hybrid solutions introduced by Elridge [2]. Although the large scale energetic solutions use only high efficiency HAWT, the low wind – noise – speed VAWT is recommended for the urban environment as written in Eggleston [3] and Dabiri et al [4]. A swinging blade VAWT developed by Hungarian student Peter Dudas (see fig.1.), was also taken into account but the generator part was not appropriate yet.
Fig.1. Swinging blade „Dudas” VAWT 2. Location choice The first step of the R+D work was to look for appropriate locations for the turbines. We performed a month long wind measurement at each possible site. The yearly wind course can significantly differ from the short term period wind behavior. We analyzed the correlation with an external reference site. Our assumption was that if we realize high wind speed compared to the reference site in a short time period, the long term wind run there has also relatively great energy production capability. The wind direction records were also considered in the correlation analysis of different sectors but in the end results this factor did not play a significant role.
Jestr JOURNAL OF Engineering Science and Technology Review
www.jestr.org
______________ * E-mail address: [email protected] ISSN: 1791-2377 © 2012 Kavala Institute of Technology. All rights reserved.

P. Kádár/Journal of Engineering Science and Technology Review 5 (4) (2012) 42 -47
43
Fig.2. Location options We measured wind course measurement at the potential deployment sites (see. fig.2. and 3.) during one month:
� T1 – building roof, 15 m height, high Public Relation value
� T2 – building terrace, 10 m height, high Public Relation value
� K – service building top, 12 m height � T3 – non functioning radar tower, 20 m axis height � OMSZ – reference metering of National
Meteorology Service, 10 m height
Fig.3. Wind measurement device at site T1 (Photo Bencsik)
2. Devices The following “off-the-shelves” turbines were selected for erection (see fig. 4.):
� 600 W Horizontal axis 3 blade turbine – ZW 600 � 600W Vertical Axis magnetic levitation combined
Savonius – Darrieus PER 600 turbine � 1000W Vertical Axis turbine with 5 „spoon” form
blades – Sollight 1000 � 500 W Vertical Axis Darrieus bladed – SAWT
P500
Fig. 4. The turbines on the old radar tower
3. Metering In Figure 5 the month long pure wind speed measurement can be seen. As we know, energy production is possible only above the cut in speed (red ellipses above the red dotted line). The wind rose (fig.6.) is interesting only at some asymmetrical, wind – shadow sites (wake effect – e.g. building side). Fortunately at the finally chosen T3 site there were no external obstacles.
Fig. 5. Wind course of the reference site
Fig. 6. Wind rose of the reference metering In order to determine how large part of the wind blows over the cut in speed, we draw the distribution of the
0
2
4
6
8
10
12
2011. 10. 11. 0:00
2011. 10. 11. 10:40
2011. 10. 11. 21:20
2011. 10. 12. 8:00
2011. 10. 12. 18:40
2011. 10. 13. 5:20
2011. 10. 13. 16:00
2011. 10. 14. 2:40
2011. 10. 14. 13:20
2011. 10. 15. 0:00
2011. 10. 15. 10:40
2011. 10. 15. 21:20
2011. 10. 16. 8:00
2011. 10. 16. 18:40
2011. 10. 17. 5:20
2011. 10. 17. 16:00
2011. 10. 18. 2:40
2011. 10. 18. 13:20
2011. 10. 19. 0:00
2011. 10. 19. 10:40
2011. 10. 19. 21:20
2011. 10. 20. 8:00
2011. 10. 20. 18:40
2011. 10. 21. 5:20
2011. 10. 21. 16:00
2011. 10. 22. 2:40
2011. 10. 22. 13:20
2011. 10. 23. 0:00
2011. 10. 23. 10:40
2011. 10. 23. 21:20
2011. 10. 24. 8:00
2011. 10. 24. 18:40
2011. 10. 25. 5:20
2011. 10. 25. 16:00
2011. 10. 26. 2:40
2011. 10. 26. 13:20
2011. 10. 27. 0:00
2011. 10. 27. 10:40
2011. 10. 27. 21:20
2011. 10. 28. 8:00
2011. 10. 29. 6:00
2011. 10. 29. 16:40
2011. 10. 30. 3:20
2011. 10. 30. 14:00
2011. 10. 31. 0:40
2011. 10. 31. 11:20
2011. 10. 31. 22:00
2011. 11. 1. 8:40
2011. 11. 1. 19:20
2011. 11. 2. 6:00
2011. 11. 2. 16:40
2011. 11. 3. 3:20
2011. 11. 3. 14:00
2011. 11. 4. 0:40
2011. 11. 4. 11:20
2011. 11. 4. 22:00
2011. 11. 5. 8:40
2011. 11. 5. 19:20
2011. 11. 6. 6:00
2011. 11. 6. 16:40
2011. 11. 7. 3:20
2011. 11. 7. 14:00
2011. 11. 8. 0:40
2011. 11. 8. 11:20
2011. 11. 8. 22:00
Szélsebesség 10 perces átlag
0
0,002
0,004
0,006
0,008
0,01
0,012
0,014
0,016
0,018
0,02
15 9 13 17 21
2529
3337
4145
49535761
65
69
73
77
81
85
89
93
97
101
105
109
113
117
121125
129133
137141
145149
153157
161165169173177181
185189193197201205
209213
217221
225229
233237
241
245
249
253
257
261
265
269
273
277
281
285
289
293
297
301305309
313317
321325
329333
337341345
349353357
Szélirány gyakoriság

P. Kádár/Journal of Engineering Science and Technology Review 5 (4) (2012) 42 -47
44
metered speed data. It is described by the Weibull distribution (see Eq.1.). In this form the ‘k’ parameter refers to the shape of the curve, the ‘λ’ parameter refers to the specific wind blow. λ is typically 1,12*vaverage speed of wind. This formalization helps us compare the energy production capability of the sites.
𝑓 𝑥 =!!
!!
!!!𝑒! ! ! ! , 𝑥 ≥ 0
0, 𝑥 < 0 (1)
Fig. 7. shows the distribution of the wind blow.
Fig. 7. Weibull distribution of the wind blow of the reference site
The best fit ’k’ form parameter is 1,7686, λ is 4,0263, it means about 3,6 m/s average wind speed. In Table I. we summarized the λ parameters for each site and the related average wind speeds. The three different parameters of the same reference metering point are the result of the 3 distinct one month long metering. Table I.
Site λ value average wind
speed (m/s)
Site λ value average wind
speed (m/s)
T1 2,1027 1,877 Ref.
metering
4,0263 3,6
T2 1,3443 1,2 Ref. metering
2,1594 1,9
T3 3,0873 2,756 Ref. metering
3,905 3,486
Fig. 8. summarizes the Weibull distributions of all the sites. In the figure the results of three distinct one month’ wind measurement periods were visualized. In each month a reference metering (site OMSZ) and a possible deployment site data were measured (T1 – Ref., T2 – Ref.; T3 – Ref.). The correlation between a measured test site and the reference site shows the general ratio of the wind speeds (e.g. the wind run at T1 is generally half of the Ref. site measurements). We calculated the correlations between the sites and the reference metering point according to earlier works of Kadar [5][6]. We have a decade long measurement data from the reference site, so based on those data and the correlation we can have a good estimation for the future. The best wind run has been measured at site T3. It has also the highest average, and relatively it has largest part above the cut in speed of the turbines. It means the turbines will run here the most.
Fig. 8. Weibull distributions of the three parallel one-month-long measurements Using the correlation coefficient we extrapolated the yearly wind run and we calculated the potential yearly energy production for each site, for each turbine. In the calculation we took into account the factory certified power characteristics and the estimated yearly wind run.
Fig. 9. Turbines’ factory characteristics
The general equation of the energy production calculation is: 𝐸 = 𝑣 𝑡!!
!!∗ 𝑃 𝑣 dt (2)
where 𝐸 = energy generated during period t! − t! 𝑣 𝑡 = wind speed course (function of time) 𝑃 𝑣 = wind turbine power characteristics (function of wind speed)
Fig. 10. Energy production estimation

P. Kádár/Journal of Engineering Science and Technology Review 5 (4) (2012) 42 -47
45
4. Evaluation
bat bat bat
24 V DC
Inverter
230 V AC
bat batbat bat
Hall current meter
voltage metering
switch
fuse
load + -‐ + -‐+ -‐
bat. contr.
+ -‐
PER 600 Winpower 600 Sollight SAWT
battery protection
bat. contr. bat. contr. bat. contr.
Fig. 11. Metering scheme Fig. 11. is the rough sketch of the island mode metering circuits. We measured the energy (U, I, t) charged into the batteries. We applied a continuous load of 80 mA and 150 mA – 1 Watt and 3,6 Watts. The batteries were protected by the charger devices and the external resistors, as well. The wind speed and the current and voltage data were collected by 1 min density. Fig. 12. depicts the metering devices.
Fig. 12. The metering room The turbines are built in with some generator and speed control, the electronics contain battery protection, dump load, status indicators, electric brake, etc. The pure generator power – wind speed characteristics are not identical to the battery charging power – wind speed characteristics. We metered the latter, but this value is lower than the generator input, due to the loss on the cables, the electronics and the dump resistor. Charging also depends on the condition of the battery. We investigated the small island mode systems from the user aspect that is why we were interested in the final energy outcome. For the demonstration of the short term performance evaluation we chose a short stormy wind attack in 80 minutes duration (see fig.13.). Practically there was no wind before and after.
Fig. 13. Wind run in a stormy hour In Fig. 14. one can observe that the charging current is proportional to the general factory curves (see. fig.9.). It verifies the vendor stated cut in speeds: 4 m/s for PER turbine and 3 m/s for Windpower and Sollight turbines. During one we measured the average current at each minute. The one sample per minute is capable of long term measurements (month long) but it is not appropriate for short term transient analysis.
Fig. 14. Generator currents (one sample per minute) In Fig. 15. a non typical but often occurring current transient can be seen at ¼ sec sampling frequency on AIR-X 400 wind turbine, measured by a Labview device during a previous research. In spite of our expectation of long term smooth energy production we experienced a quick upward/downward control – for a long time (6 Amppeak). The internal control electronics may explain this operation but instead of continuous production we got only a sagged and smaller energy output.
Fig. 15. Generator currents (four samples per one second)
0.0
2.0
4.0
6.0
8.0
10.0
12.0
14.0
16.0
1 4 7 10 13 16 19 22 25 28 31 34 37 40 43 46 49 52 55 58 61 64 67 70 73 76 79
m/s
min
avg windspeed
avg windspeed
0.0
2.0
4.0
6.0
8.0
10.0
1 7 13 19 25 31 37 43 49 55 61 67 73 79
A
min
Windpower
PER
Sollight

P. Kádár/Journal of Engineering Science and Technology Review 5 (4) (2012) 42 -47
46
Using the above metered data we can redraw the practical power – wind speed characteristics that can be seen in Fig. 16. a-c. These verify the shape of the factory curves but the useful power is much less than predicted. One of the reasons can be the relatively high consumption of the control electronics (low efficiency at the low power output range). Although the cut in speed is at 3 and 4 m/s, the reasonable energy production can be expected only in the 6-7 m/s range. This is a message for the user: below 7 m/s (25 km/h) wind speed these turbines do not really produce energy. In an urban area we rarely encounter 25 km/h wind blow.
Fig. 16. a-c. Measured battery charging characteristics A final “user aspect” check was the energy balance metering. In this 10 days long period we investigated the energy charged into the battery and the energy supplied by the battery for the external load.
Fig. 17. Battery data for energy calculation
Based on the rough battery charge current and battery voltage metering we calculated the charged in energy, that is 1,63 kWh. During this period the artificial load consumes 0,8 kWh and the electronics of the system consumes approx. 0,5 kWh standby energy. The storage efficiency is about 80 %. In Fig. 17 a month long battery status data can be seen. In case of high winds the battery was charged with 5-7 Amps, the voltage raised from 24 to 27 Volts. During calm days the
battery voltage sank back to the nominal 24 Volts. The small scale island mode wind turbine system works. The amount of the produced freely consumable energy has lagged far behind the expected values. After a long term evaluation we can obtain even more precise data. 5. Discussion Our experiences can be summarized as follows: In the urban area (better to say inhabited area) the high wind perception doesn’t mean energetically high wind blows – only a low amount of wind based electricity can be generated by small scale wind turbines. That is why this type of energy generation is not competitive with the network electricity supply. It is hard to determine the measure of the load that can be connected to the system without arriving at deep discharge situation of the battery. Having some security margin this load is comparable to the stand by load of the electronics and the energy loss because of the bad battery efficiency (about 80 % is the ratio of energy used from the battery and charged into). Protection must also be applied to switch off the load in case of a low charge level of the battery. The small scale wind turbines are rarely connected directly to the network, they mainly use batteries as internal storage. The batteries are the weak points of the system because the high performance, high capacity batteries’ price comparative to the wind turbine cost, the life-time is no more than 6 years. It can be protected against the excess current and overcharging but the deep discharge can’t be avoided in case of some weeks of dead calm. The PV combined hybrid solution can help to avoid this situation. The battery control philosophy of the individual “charger” products is not known in detail. Some of these devices switch on the load in case of the energy surplus, others protect against over/under charge. Some remarkable process was identified when the charging process was abandoned after some minutes at high wind blow and medium voltage level – when all the circumstances determined “battery charge” mode. Why did the charger control down the charging current meanwhile all the circumstances predestined an hour long charge? We do not doubt that all the processes can be explained but according to the experience the system is not robust. The chargers’ standby load compared to the charging current represents remarkable current (50-100 mA – 1-2 Watts). Taking into account a 100 Ah capacity at 24 V it means maximum 1000 hours for the discharge of the battery without another load. It may happen the probability of this situation is not zero. The factory guaranteed characteristics are valid for the turbine/generator complex but the real battery charge depends on the condition of the battery, too. In case of an insufficiently conditioned battery at the quick voltage raise the charger may stop the battery charge and will dissipate all the gained wind energy on the dump resistor. 6. Conclusion There are various small scale wind turbine products available. Their application is reasonable only in island mode, if we are out of the power network covered area. The turbines confirm their factory characteristics but the amount
0
50
100
150
200
250
0.0 2.0 4.0 6.0 8.0 10.0 12.0 14.0 16.0
W
m/s
Winpower
0
5
10
15
20
25
30
35
0.0 2.0 4.0 6.0 8.0 10.0 12.0 14.0 16.0
W
m/s
PER

P. Kádár/Journal of Engineering Science and Technology Review 5 (4) (2012) 42 -47
47
of the produced energy lags behind the expectations. In our comparison the best performing device has been the three bladed HAWT. In case of long term data collection we can filter also the wake effect of the close deployed turbines. The weak point of the island mode operation is the battery. The extension of the system with Photo Voltaic panels can help keep the batteries in proper condition in case of long dead calms
Acknowledgement The author thanks the cooperation and technical help of Tamás Bessenyei, Imre Fejes, Ildikó Kelemen, Budapest Airport: Ferenc Kiss, Zsuzsa Munkácsi , KEIK Nonprofit Organization, Óbuda University and students Szilárd Nagypál, Roland Bálint, Imre Ress and Ákos Bencsik
______________________________
References
1. Vertical Axis Wind Turbines: The History of DOE Program, U.S. Department of Energy, Sandia National Laboratories, U.S.A., 1998.
2. Eldridge Frank R., Wind Machines, 2nd Edition, Van Nostrand Reinhold Company, New York, U.S.A., 1980.
3. Eggleston Eric, What Are Vertical-Axis Wind Turbines (VAWTs), American Wind Energy Association, Washington DC, U.S.A., 2001.
4. John O. Dabiri: „Potential Order of Magnitude Enhancement of Wind Farm Power Density via Counter Rotating Vertical Axis Wind Turbine Array”, Journal of
5. Renewable and Sustainable Energy, Volume 3, Issue 4, July 19, 2011.
6. P. Kadar: Evaluation of Correlation the wind speed measurements and wind turbine characteristics; 8th International Symposium of Hungarian Researchers on Computational Intelligence and Informatics, CINTI 2007, 2007. nov. 15-17, Budapest, Hungary pp 429-440
7. P. Kádár– L. Nagy: Wind measurement analysis for deployment urban small scale wind turbine; 10th International Symposium on Applied Machine Intelligence and Informatics (SAMI 2012) Herlany, Slovakia January 26-28, 2011 Submission 102