Embed Size (px)
Citation preview
COMPARATIVE METABOLITE PROFILING OF DROUGHT STRESSRESPONSIVE BIOCHEMICAL PATHWAYS IN ROOT AND LEAVES OF
TRITICEAE SPECIES
byNAIMAT ULLAH
Submitted to the Faculty of Engineering and Natural Sciencesin partial fulfilment of
the requirements for the degree ofDoctor of Philosophy
Sabanci University
June 2017

© NAIMAT ULLAH 2017
All Rights Reserved

ABSTRACT
COMPARATIVE METABOLITE PROFILING OF DROUGHT STRESSRESPONSIVE BIOCHEMICAL PATHWAYS IN ROOT AND LEAVES OF
TRITICEAE SPECIES
Naimat Ullah
Molecular Biology, Genetics and BioengineeringPh.D. Thesis, 2017
Prof. Dr. Hikmet Budak (Thesis Supervisor)
Keywords: Metabolomics, Organic acids, Biochemical pathway, Plant Genomics
An untargeted metabolite profiling was applied to modern wheat and wild relatives
exposed to drought stress using Gas Chromatography-Mass Spectrometry technique. A
total of 84 analytes were resolved in the wheat metabolome for which multivariate
analyses including supervised (Principal Component Analyses) and unsupervised
(Partial Least-Squares-Discriminant Analysis) provided significantly variable dataset
under control and drought stress conditions. Around 45 significantly altered metabolites,
with possible roles in drought stress, were identified in all species tested through the
GC-MS study. The potential drought stress responsive metabolites were further
investigated to track genes encoding the enzymes of selected biochemical pathways
using FL-cDNA sequences and transcriptome data. It has been hypothesized that if the
genes encoding the enzymes that control the biosynthesis of drought stress-specific
metabolites have a significant role in tolerance, contrasting genotypes would have a
variance in the metabolite content. A small proportion showed a reduction in the
metabolite accumulation in the drought sensitive genotypes, indicating that selected
genes are directly or indirectly engaged in metabolome-regulative biochemical
pathways under water-limiting conditions. These results demonstrated that those
specific genotypes with high drought tolerance skills, especially wild emmer wheat,
could be genetic model systems for experiments to validate metabolomics–genomics
networks.
4
ÖZET
KOMPARATİF METABOLİT TARANMASI YÖNTEMİYLE TRİTİCEAETÜRLERİNİN KÖK İLE YAPRAKLARINDA KURAKLIK STRESİNDE
BİYOKİMYASAL YOLAKLARIN KARAKTERİZASYONU
Naimat Ullah
Moleküler Biyoloji, Genetik ve BiyomühendişliğiPh.D. Tezi, 2017
Prof. Dr. Hikmet Budak (Tez Danışmanı)
Keywords: Metabolomik, Organik Asitleri, Biokimyasal Yolağı, Bitki Genomik
Gaz Kromatografi-Kütle Spektrometri (GC-MS) yöntemiyle hedeflenmeyen metabolit
taranması çağdaş buğday çeşitleriyle yabani akraba türlerine uygulanmıştır. Toplam
olarak 84 buğday örneklerin metabolomune karakterize edilmiştir. Çok değişkenli
analize olan Temel Bileşen Analizi (PCA) ve Kısmi En Az Kare Ayırtaç Analizi (PLS-
DA) kullanarak verilerinde kontrol ile kuraklık stres koşulların arasında istatistik olarak
anlamlı değişiklikleri tespit edilmiştir. Tüm türlerine bakarken, GC-MS çalışmasında 45
istatistik olarak anlamlı fark gösteren metabolit belirlenmiştir; kuraklık stresinde rol
oynadığını düşünülmektedir. Kuraklık stresine tepki gösteren metabolitlerini üreten
biyokimyasal yolaklarında yer bulunan enzim kodlayan genleri, FL-cDNA ve
transkriptom verilerinden araştırılmıştır. Varsayım bulunmakta ki, eğer kuraklık stresine
özel metabolitlerin biyosentezi yapan enzimlerin genleri dayanıklılığında rol oynarsa,
farklı genotiplerde metabolit içeriklerinde değişiklik bulunurdu. Kuraklığa hassas
genotiplerde, bazı metabolitin birikmesini azaldığını görülmüştür. Belirtilen genler,
kısıtlı su koşullarında doğrudan veya dolaylı olarak metabolomu ayarlayan
biyokimyasal yolaklarında yer aldığını gösterilmektedir. Sonuç olarak, kuraklık stresine
iyi tolerans gösteren genotipler, özellikle yabani gernik buğdayı, ileride metabolomik-
genomik ağlarını araştırmak için faydalı genetik model sistemleri olacağını
önerilmektedir.
5
With all my heart,
To my dear parents, brothers, sisters, wife and son (Rayyan Khan)
6

ACKNOWLEDGEMENTS
First of all, I would like to thank my supervisor Prof. Dr. Hikmet Budak. His advice
throughout my doctoral years was priceless for me. He has influenced me in ways that
transcend academics, and his voice will guide me throughout my career and my life.
I wish to express my special gratitude to my lab mentors as well as my sincere friends
Dr. Meral Yüce and Dr. Stuart J. Lucas for their assistance all the times. They are my
ever and ever best friends and I will never forget them in throughout my life.
I am thankful to all my lab mates: Bala Anı Akpınar, Babar Hussain, Reyyan Bulut,
Zaeema Khan, İpek Özdemir, Burcu Alptekin, Kadriye Kahraman, Tugdem Muslu,
Halise Busra Cagirici and Sezgi Biyiklioglu for their support. Additionally, I would also
like to thank Yusuf Tutuş and Mustafa Atilla Yazıcı for their assistance during my
experiments in the greenhouse and growth chambers.
I would also like to thank Higher Education Commission (HEC) of Pakistan for the
financial support they have provided during my doctoral years.
Finally and most important of all I would like to express my sincerest gratitude to my
dear parents, wife and son (Rayyan Khan) for their tremendous support, patience and
faith in me. I owe all my achievements to their unconditional support and love.
7
TABLE OF CONTENTS
CHAPTER NO.1...............................................................................................................1
1. Introduction................................................................................................................1
CHAPTER NO. 2..............................................................................................................4
2. Review of Litrature....................................................................................................4
2.1. Triticeae, The tribe..............................................................................................4
2.2. Wheat as a Staple Food.......................................................................................5
2.3. Abiotic Stress Factors and Drought....................................................................5
2.4. Drought Stress Tolerance....................................................................................6
2.5. Effects and Responses to Drought Stress...........................................................7
2.6. Wild and Domesticated Crops............................................................................8
2.6.1. Wild Emmer Wheat.....................................................................................8
2.7. Improvement of Drought-Tolerant Cultivars........................................................10
CHAPTER NO.3.............................................................................................................12
3. Materials and Methods................................................................................................12
3.1. Plant growth conditions, experimental design and drought stress treatments......12
3.1.1. Measurement of root morphology dynamics.................................................12
3.1.2. Extraction and derivatization of wheat leaf and root metabolites..................13
3.1.3. Metabolite profiling using GC-MS technology.............................................13
3.1.4. Metabolomics data analysis and metabolite identification............................14
3.1.5. Statistical data analysis..................................................................................15
3.1.6. Identification and location of genes in wheat genome...................................15
CHAPTER NO. 4............................................................................................................17
4. Results......................................................................................................................17
4.1. Morphological responses of roots to drought stress.............................................17
4.1.1. Metabolic profile analysis upon control and drought stress treatments........18
4.1.2. Identification of the drought stress-responsive metabolites in wheat roots and leaves.................................................................................................................24
4.1.3. Pathway mapping and the metabolite-to-metabolite network visualization30
4.1.4. Putative genes controlling the accumulation of succinate, aspartate, and trehalose30
8
CHAPTER NO.5.............................................................................................................36
5.1. Discussion.................................................................................................................36
5.2. Conclusion............................................................................................................39
APPENDIX A..................................................................................................................40
APPENDIX B..................................................................................................................41
6. References................................................................................................................59
9
LIST OF TABLES
TABLE 1 LIST OF TRITICEAE SPECIES USED IN OUR STUDY.............................................44TABLE 2 IDENTIFIED WATER-STRESS RESPONSIVE METABOLITES IN LEAF SAMPLES OF
WHEAT USING THE GC-MS.......................................................................................44TABLE 3 IDENTIFIED WATER-STRESS RESPONSIVE METABOLITES IN ROOT SAMPLES FROM
THE GC-MS..............................................................................................................49TABLE 4 MORPHOLOGICAL PARAMETERS OF ROOTS OF ALL GENOTYPES MEASURED BY
WINRHIZO SYSTEM. ARA (CM2) ANALYSED REGION AREA (CM2); ARW (CM)ANALYSED REGION WIDTH (CM); ARH (CM) ANALYSED REGION HEIGHT (CM); RL(CM) ROOT LENGTH (CM); PA (CM2) PROJECTED AREA (CM2); SA (CM2) SURFACE
AREA (CM2); AVD (MM) AVG DIAMETER (MM); LPV (CM/M3) LENGTH PER VOLUME
(CM/M3); RV (CM3) ROOT VOLUME (CM3).................................................................51TABLE 5 NAMES OF 45 SIGNIFICANTLY ALTERED AND DIFFERENTIALLY ACCUMULATED
METABOLITES DETECTED AND IDENTIFIED BY GC-MS FROM LEAF AND ROOT TISSUE
SAMPLES FROM ALL SEVEN GENOTYPES...................................................................53TABLE 6 EXPLANATION AND PREDICTABILITY VALUES USED FOR DIFFERENT ANALYSIS
SUCH AS CL-DSL-CR-DSR WERE ANALYZED USING THE DROUGHT STRESS
TREATED LEAVES AND ROOTS AS WELL AS THEIR CONTROLS; CL-DSL, ANALYZED
USING THE CONTROL AND DROUGHT STRESS TREATED LEAF SAMPLES; CR-DSR,ANALYZED USING THE CONTROL AND DROUGHT STRESS TREATED ROOT SAMPLES;DSL-DSR, ANALYZED USING THE DROUGHT STRESS TREATED LEAF AND ROOT
SAMPLES; CL-CR, ANALYZED USING CONTROL LEAF AND ROOT SAMPLES.............54TABLE 7 LEAF METABOLITES, THE FOLD CHANGESX IN THE CONCENTRATIONS OF EACH
METABOLITE BETWEEN CL AND DSL GROUPS USING THE FORMULA LOG2(DROUGHT
TREATED/CONTROL) AND VARIABLE IMPORTANCE IN THE PROJECTION (VIP) OF THE
TYPICAL/REPRESENTATIVE SAMPLE (TR39477). “*” AND “**” INDICATE THE
SIGNIFICANT (P<0.05) AND HIGHLY SIGNIFICANT (P<0.01) DIFFERENCES COMPARED
TO THE CONTROL, RESPECTIVELY.............................................................................54TABLE 8 ROOT METABOLITES, THE FOLD CHANGESX IN THE CONCENTRATIONS OF EACH
METABOLITE BETWEEN CR AND DSR GROUPS USING THE FORMULA LOG2(DROUGHT TREATED/CONTROL) AND VARIABLE IMPORTANCE IN THE PROJECTION
(VIP) OF THE TYPICAL/REPRESENTATIVE SAMPLE (TR39477). “*” AND “**”INDICATE THE SIGNIFICANCE (P<0.05) AND HIGHLY SIGNIFICANCE (P<0.01) LEVEL...................................................................................................................................55
TABLE 9 THE KEGG PATHWAYS (R-SOFTWARE) OF THE ALTERED METABOLITES
EXPOSURE TO DROUGHT STRESS IN WHEAT LEAVES AND ROOT SAMPLES................57TABLE 10 THE CHANGED GENES AND METABOLITES INVOLVED IN GENE-TO-METABOLITE
NETWORK UPON WATER STRESS EXPOSURE IN WHEAT..............................................58
10
LIST OF FIGURES
FIGURE 1 THE OUTLINES OF METHODOLOGIES USED FOR (A) METABOLITE EXTRACTION
AND ANALYSIS AND (B) BLAST SEARCH FOR TARGET GENE IDENTIFICATION.........16FIGURE 2 ROOT MORPHOLOGY OF NORMAL AND DROUGHT-STRESSED TRITICUM
AESTIVUM (BOLAL) AS A REPRESENTATIVE SAMPLE (A) SAMPLE UNDER NORMAL
CONDITIONS (B) ROOT SAMPLES UNDER DROUGHT STRESS CONDITIONS (C) LIGHT
MICROSCOPY (10X) IMAGES OF LATERAL ROOT LENGTH AND DIAMETER (D)PRIMARY ROOT DIAMETER (19.17 ΜM) TAKEN FROM NORMAL ROOTS (E & F)PRIMARY & SECONDARY ROOT DIAMETERS (13.8 ΜM) FROM DROUGHT STRESS
TREATED SAMPLE (G) AVERAGE ROOT LENGTH MEASURED IN CENTIMETERS (CM)AND (H) AVERAGE SURFACE AREA MEASURED FOR ALL SEVEN GENOTYPES............18
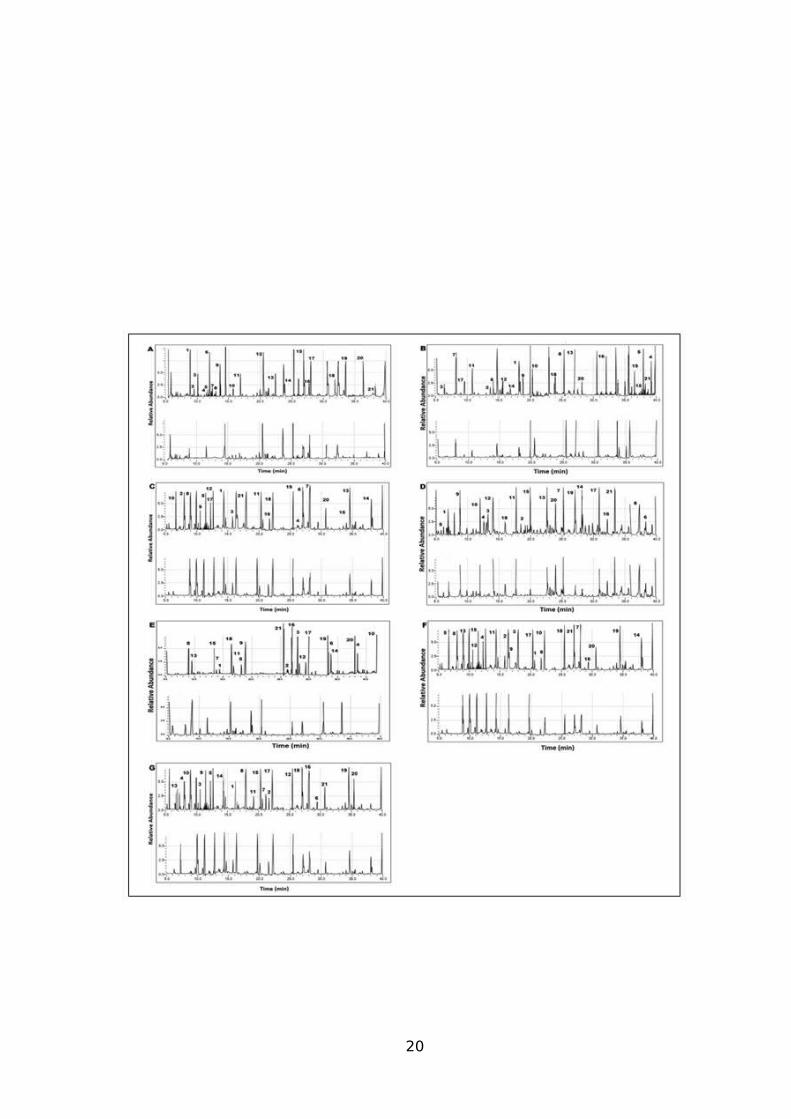
FIGURE 3 GC-MS SPECTRA FOR A TYPICAL (REPRESENTATIVE) SAMPLE IN CONTROL
(LOWER PANNEL) AND WATER-STRESS TREATED (UPPER PANNEL) LEAVES OF (A)AEGILOPS SPELTOIDES (B) TRITICUM DICOCCOIDES (TR39477) (C) TRITICUM
DICOCCOIDES (TTD-22), (D) TRITICUM AESTIVUM (BOLAL). 1. SUCROSE, 2.TREHALOSE, 3. MANNITOL 4. MALTOSE, 5. PROLINE, 6. GLUTAMATE, 7. ALANINE,8. LYCINE, 9. ASPARAGINES, 10. METHIONINE, 11. THREONINE, 12.PHENYLALANINE, 13. HOMOCYSTEINE, 14. SERINE, 15. VALINE 16. TYROSINE, 17.SUCCINATE, 18. CITRATE, 19. ASPARTATE 20. GLUCONATE 21. GLUTATHIONE (E)TRITICUM AESTIVUM (TOSUNBEY), (F) TRITICUM MONOCOCCUM, AND (G) AEGILOPS
TAUSCHII. COMPLETE CHROMATOGRAPHIC TIME WAS 5.0-40.0 MIN. 1. SUCROSE, 2.TREHALOSE, 3. MANNITOL 4. MALTOSE, 5. PROLINE, 6. GLUTAMATE, 7. ALANINE,8. LYCINE, 9. ASPARAGINES, 10. METHIONINE, 11. THREONINE, 12.PHENYLALANINE, 13. HOMOCYSTEINE, 14. SERINE, 15. VALINE 16. TYROSINE, 17.SUCCINATE, 18. CITRATE, 19. ASPARTATE 20. GLUCONATE 21. GLUTATHIONE........21
FIGURE 4 GC-MS SPECTRA FOR A TYPICAL (REPRESENTATIVE) SAMPLE IN CONTROL
(LOWER PANEL) AND WATER-STRESS TREATED (UPPER PANEL) ROOTS OF (A)AEGILOPS SPELTOIDES (B) TRITICUM DICOCCOIDES (TR39477) (C) TRITICUM
DICOCCOIDES (TTD-22), (D) TRITICUM AESTIVUM (BOLAL). 1. SUCROSE, 2.TREHALOSE, 3. MANNITOL 4. MALTOSE, 5. PROLINE, 6. GLUTAMATE, 7. ALANINE,8. LYSINE, 9. ASPARAGINE, 10. METHIONINE, 11. THREONINE, 12. PHENYLALANINE,13. HOMOCYSTEINE, 14. SERINE, 15. VALINE 16. TYROSINE, 17. SUCCINATE, 18.CITRATE, 19. ASPARTATE 20. GLUCONATE 21. GLUTATHIONE (E) TRITICUM
AESTIVUM (TOSUNBEY), (F) TRITICUM MONOCOCCUM, AND (G) AEGILOPS TAUSCHII.1. SUCROSE, 2. TREHALOSE, 3. MANNITOL 4. MALTOSE, 5. PROLINE, 6.GLUTAMATE, 7. ALANINE, 8. LYSINE, 9. ASPARAGINE, 10. METHIONINE, 11.THREONINE, 12. PHENYLALANINE, 13. HOMOCYSTEINE, 14. SERINE, 15. VALINE 16.TYROSINE, 17. SUCCINATE, 18. CITRATE, 19. ASPARTATE 20. GLUCONATE 21.GLUTATHIONE...........................................................................................................22
11
FIGURE 5 PRINCIPAL COMPONENT ANALYSIS (PCA) SCORE PLOTS OF METABOLITE
PROFILES IN WHEAT LEAVES AND ROOTS UNDER CONTROL AND DROUGHT STRESS
CONDITIONS. (A) PCA SCORE PLOT FOR CONTROL LEAVES (CL; GREEN), DROUGHT
STRESS LEAVES (DSL; BLUE), CONTROL ROOTS (CR; RED) AND DROUGHT STRESS
ROOTS (DSR; BLACK) SAMPLES, (B) PCA SCORE PLOT FOR CR AND DSR SAMPLES,(C) PCA SCORE PLOT FOR CL AND DSL SAMPLES, (D) PCA SCORE PLOT FOR DSLAND DSR SAMPLES AND (E) PCA SCORE PLOT FOR CL AND CR SAMPLES.............23
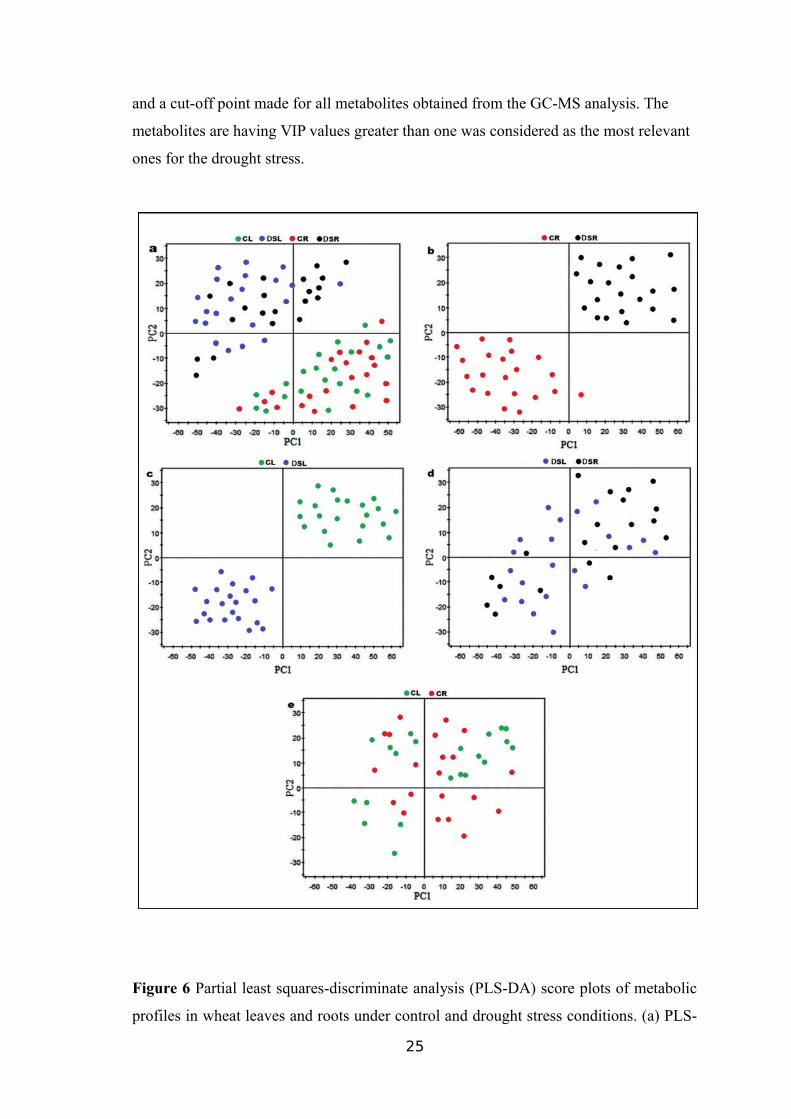
FIGURE 6 PARTIAL LEAST SQUARES-DISCRIMINATE ANALYSIS (PLS-DA) SCORE PLOTS OF
METABOLIC PROFILES IN WHEAT LEAVES AND ROOTS UNDER CONTROL AND
DROUGHT STRESS CONDITIONS. (A) PLS-DA SCORE PLOT FOR CONTROL LEAVES
(CL; GREEN), DROUGHT STRESS LEAVES (DSL; BLUE), CONTROL ROOTS (CR; RED)AND DROUGHT STRESS ROOTS (DSR; BLACK) SAMPLES, (B) PLS-DA SCORE PLOT
FOR CR AND DSR SAMPLES, (C) PLS-DA SCORE PLOT FOR CL AND DSL SAMPLES,(D) PLS-DA SCORE PLOT FOR DSL AND DSR SAMPLES AND (E) PLS-DA SCORE
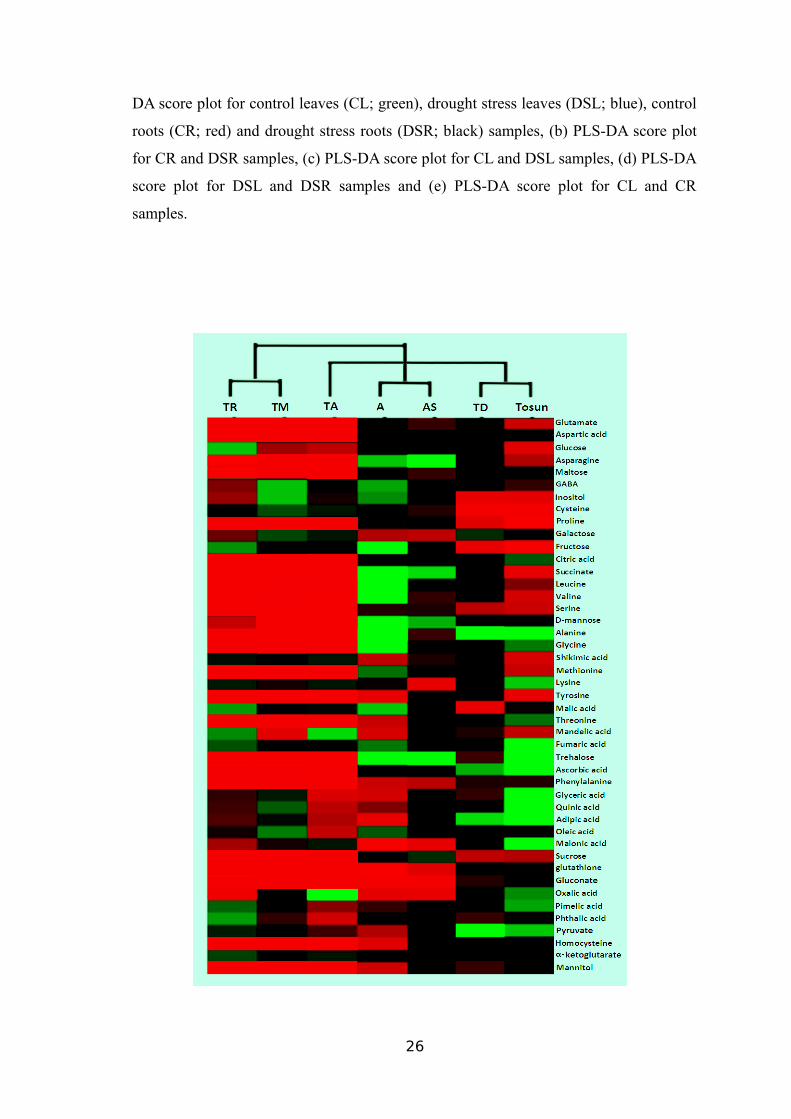
PLOT FOR CL AND CR SAMPLES...............................................................................25FIGURE 7 HIERARCHICAL CLUSTER ANALYSIS (HCA) REVEALED THE DIFFERENTIALLY
ACCUMULATED METABOLITES IN SEVEN TRITICEAE SPECIES AFTER EXPOSURE TO
DROUGHT STRESS (30% WATER HOLDING CAPACITY). THE COLOUR SCALE IS RED,HIGH ACCUMULATION; BLACK, MODERATE/NORMAL ACCUMULATION; GREEN, LOW
ACCUMULATION........................................................................................................27FIGURE 8 THE NUMBER OF HIGH AND LOW ACCUMULATED METABOLITES IN SEVEN
TRITICEAE SPECIES UNDER DROUGHT STRESS TREATMENT (30% WATER HOLDING
CAPACITY). EACH GROUP CONSISTS OF A BLUE (HIGH ACCUMULATED METABOLITES)AND RED COLUMN (LOW ACCUMULATED METABOLITES). THE NUMERAL OVER THE
COLUMN IS THE NUMBER OF HIGH/LOW ACCUMULATED METABOLITES IN EACH
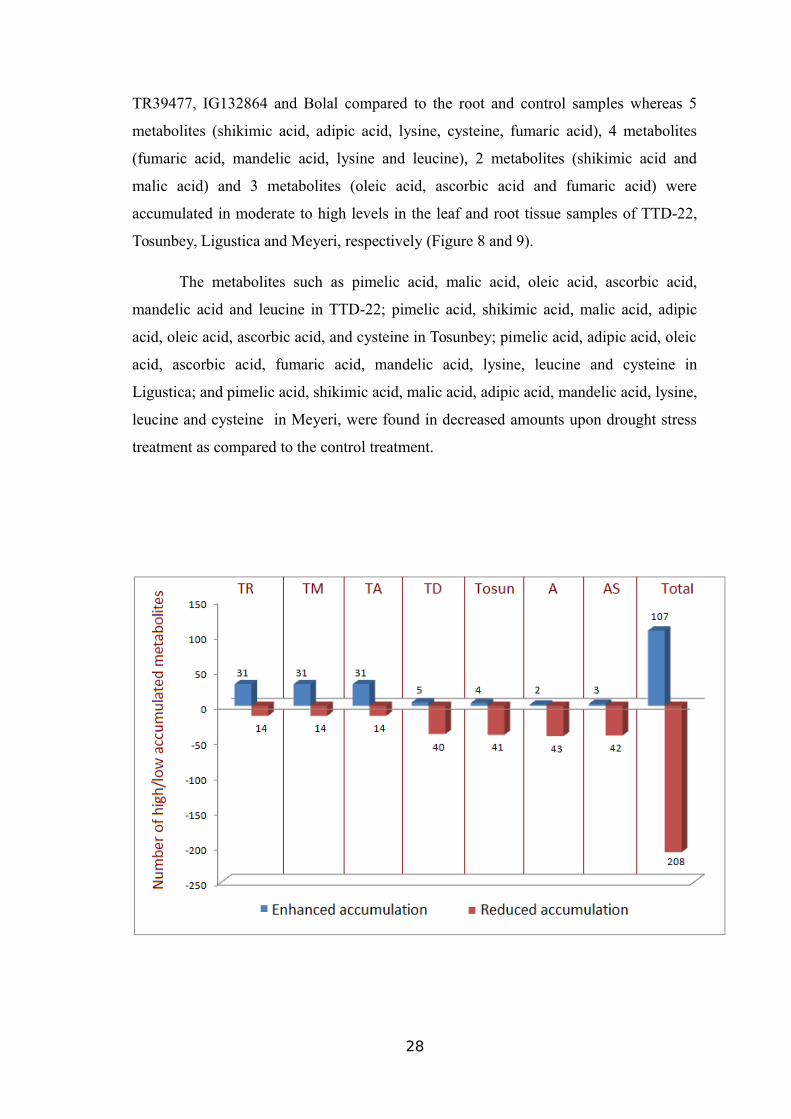
GENOTYPE.................................................................................................................29FIGURE 9 THE RELATIVE ABUNDANCES OF METABOLITES INCREASED AND DECREASED IN
THEIR ACCUMULATION IN TRITICEAE SPECIES. TR39477 (RED) IS TAKEN AS A
REPRESENTATIVE SAMPLE FOR DROUGHT TOLERANT, WHILE TTD-22 (BLACK)REPRESENTS DROUGHT SENSITIVE GENOTYPES AMONG SEVEN TRITICEAE SPECIES.THEIR CONTROLS ARE SHOWN IN GRAY COLOUR....................................................30
FIGURE 10 METABOLITES INVOLVED IN THE PRIMARY PATHWAYS IN LEAVES OF
TRITICEAE AND ITS WILD RELATIVES UNDER DROUGHT STRESS. THE SIGNIFICANT
(P<0.05) AND HIGHLY SIGNIFICANT (P<0.01) UP-REGULATED METABOLITES WERE
INDICATED IN RED AND BLUE CIRCLES, RESPECTIVELY............................................32FIGURE 11 ROOT METABOLITES INVOLVED IN THE PRIMARY PATHWAYS IN TRITICEAE
UNDER DROUGHT STRESS. THE SIGNIFICANTLY (P<0.05) INCREASED METABOLITES
ARE REPRESENTED BY RED CIRCLES AND THE METABOLITES WITH HIGHLY
SIGNIFICANT (P<0.01) UP-REGULATION ARE ENCIRCLED IN BLUE BOXES................32FIGURE 12 TOTAL ION CHROMATOGRAMS (TICS) FOR THE COMPARISON OF TRITICEAE
ON THE BASIS OF SUCCINATE ACCUMULATION AFTER THE DROUGHT STRESS
TREATMENT (30% WATER HOLDING CAPACITY).......................................................34FIGURE 13 SCHEMATIC DIAGRAM OF THE BIOCHEMICAL PATHWAY FOR SUCCINATE
(SUCCINIC ACID) ACCUMULATION. BLUE BOX HIGHLIGHTS SUCCINATE DETECTED IN
12
THE UNTARGETED METABOLITE ANALYSIS. ENZYME NAMES ARE INDICATED IN
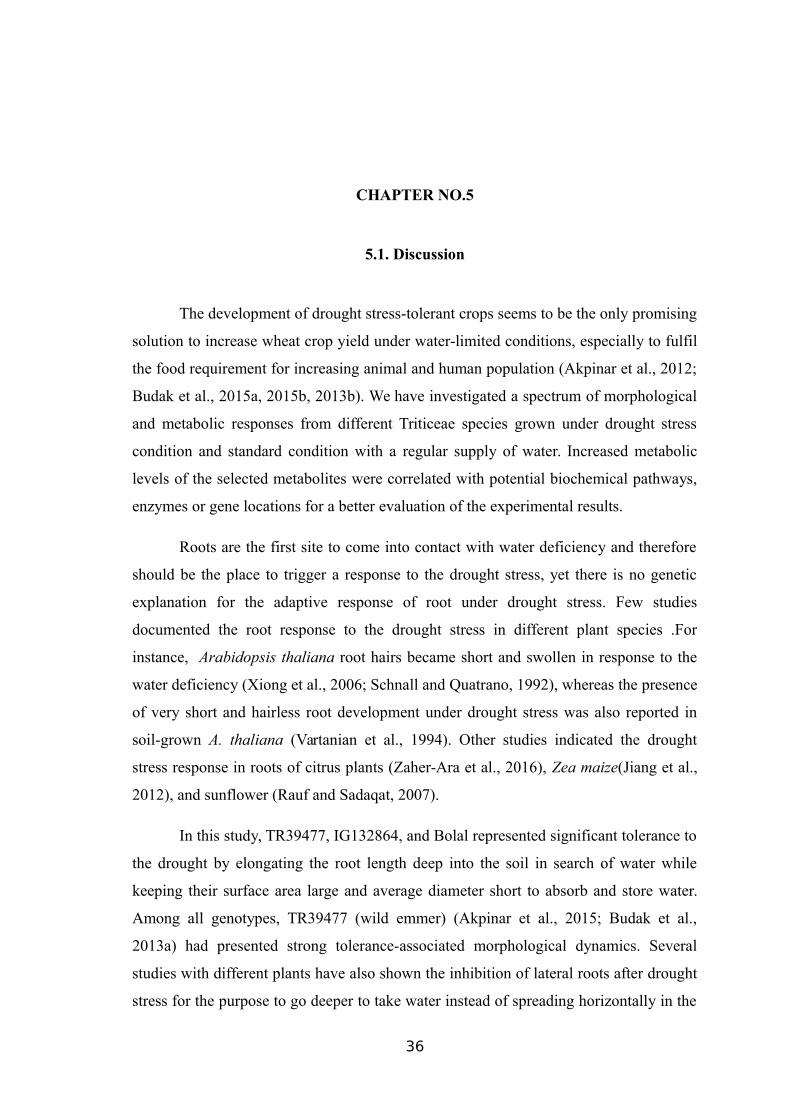
BROWN COLOUR........................................................................................................34FIGURE 14 FLOW CHART SHOWING THE BIOCHEMICAL PATHWAY FOR TREHALOSE
SYNTHESIS................................................................................................................35
13
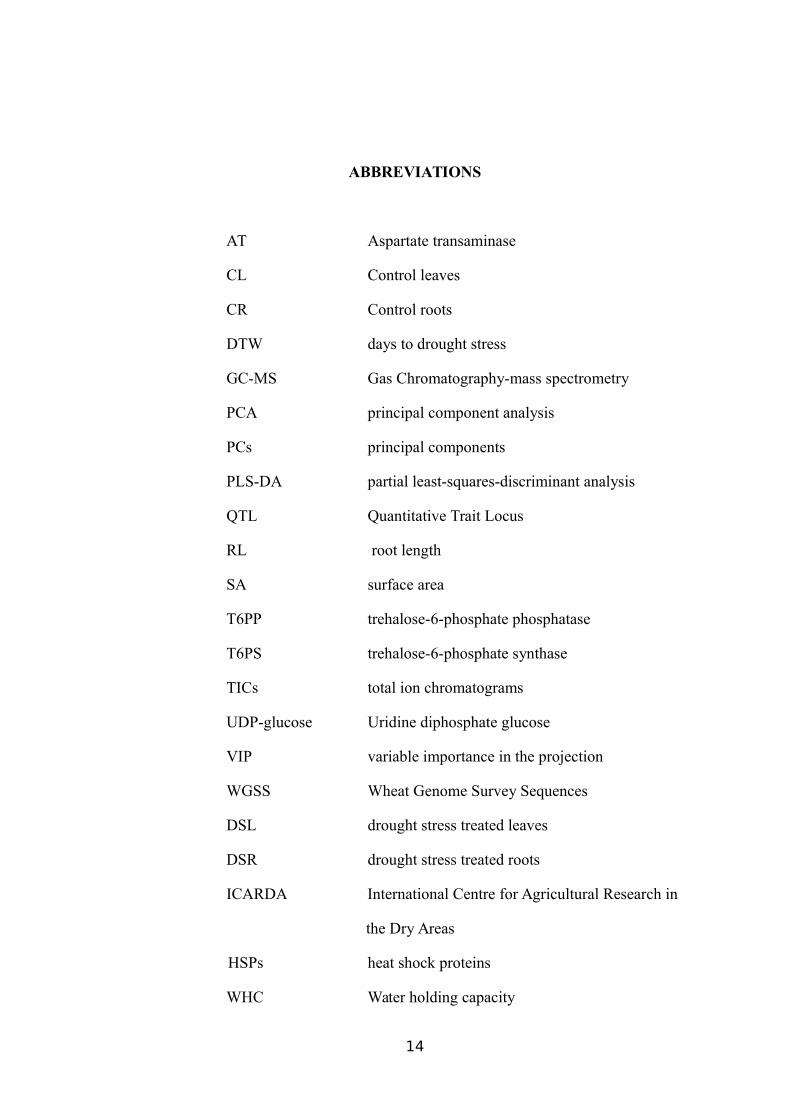
ABBREVIATIONS
AT Aspartate transaminase
CL Control leaves
CR Control roots
DTW days to drought stress
GC-MS Gas Chromatography-mass spectrometry
PCA principal component analysis
PCs principal components
PLS-DA partial least-squares-discriminant analysis
QTL Quantitative Trait Locus
RL root length
SA surface area
T6PP trehalose-6-phosphate phosphatase
T6PS trehalose-6-phosphate synthase
TICs total ion chromatograms
UDP-glucose Uridine diphosphate glucose
VIP variable importance in the projection
WGSS Wheat Genome Survey Sequences
DSL drought stress treated leaves
DSR drought stress treated roots
ICARDA International Centre for Agricultural Research in
the Dry Areas
HSPs heat shock proteins
WHC Water holding capacity
14
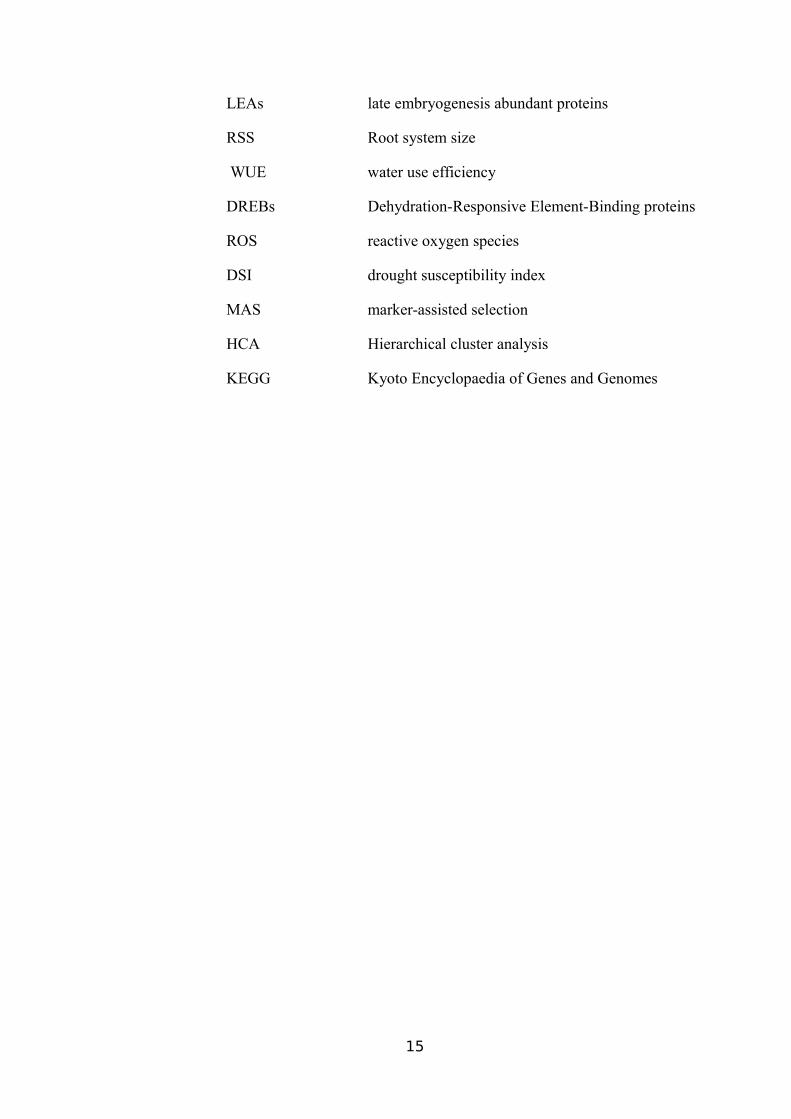
LEAs late embryogenesis abundant proteins
RSS Root system size
WUE water use efficiency
DREBs Dehydration-Responsive Element-Binding proteins
ROS reactive oxygen species
DSI drought susceptibility index
MAS marker-assisted selection
HCA Hierarchical cluster analysis
KEGG Kyoto Encyclopaedia of Genes and Genomes
15

CHAPTER NO.1
1. Introduction
Human beings get 94% of the food from plants worldwide; two-third of which is
contributed by cereals. Among all cereals, wheat (Triticum ssp.) is one of the major and
staple crops, providing 20% of all calories consumed by 75% population of the world.
Additionally, it also makessignificant contribution to animal feed worldwide. It is
predicted that the consumption of wheat will overcome its production in future due to
fast growing global population. With the world's population estimated to reach 9.6
billion by 2050, wheat production will have a crucial bearing on food security and the
global economy in the coming decades.
Approximately half a century ago, population growth threatened to overtake
food production, and at that point, it was discovered that semi-dwarf mutants of wheat
produced much more grain than their taller relatives. A series of research, development
and technology transfer initiatives so-called Green Revolution has led to steady annual
increases in grain production, in which selective breeding for yield and other important
traits played a major role (Kantar et al., 2011a).
Wheat, an outstanding member of Triticeae, attracts more attention than many
other crops, particularly in the face of increasing population and the global climate
change challenging the food security of future generations (Ergen and Budak, 2009;
Lucas et al., 2011b). Drought, affecting more than 70% of arable lands around the
world, is the most critical condition for plants among all other environmental stresses
that bring the good-yielding crops to a lower production.
The drought stress-related yield loss has gained considerable attention in recent
years as agricultural activities have been extended to less fertile or infertile fields to
meet the growing food demand. As a result, the enhancement of drought tolerance in
plants, especially in the cereal crops, has become the key challenge for today’s wheat
agronomists and plant geneticists.
Drought or water shortage is considered as the main factor responsible for the
decrease in wheat production. However, this growth may no longer be adequate to meet
future demand (Tester and Langridge, 2010). The World is threatened by global
1
warming resulting in increased incidence of environmental stresses, making stabilizing
yields as much of a challenge as increasing them. Climate change has detrimental
consequences particularly for crops which hold great economic value (Habash et al.,
2009). Drought, arguably the most significant single abiotic stress factor is currently
increasing worldwide, effecting progressively more arable land and impacting
agricultural production.
Wheat and its related species are of great importance, constituting the primary
sources of food and feed consumption. However, domestication of wheat species,
followed by years of cultivation, genetics and breeding practices has considerably
narrowed gene pools of today’s elite cultivars. These practices introduce an artificial
selection pressure for yield, ultimately eradicating genetic diversity, resulting in the loss
of valuable alleles for drought stress tolerance. Ironically, the semi-dwarfism trait that
drastically improved grain yields 50 years ago makes wheat more vulnerable to drought
in many cases. Therefore, it is crucial to take initiatives for the next Green Revolution to
develop wheat yielding high even under water-limited environments.
Drought tolerance translates not only into the survival skills under water deficit
conditions but also the maintenance of high productivity (Budak et al., 2013b; Lucas et
al., 2011b). Over the past few decades, there has been a significant effort for the
elucidation of the drought stress mechanisms in plants. Although several genes involved
in the plant drought stress responses have been identified (Budak et al., 2013a, 2013b),
the drought stress response is still a complex phenomenon with several key factors that
have yet to be investigated. Comprehensive understanding of the stress adaptation
mechanisms in plants and associate them with the genome at the structural and
functional level is required to overcome the reduced grain yield.
Various omics fields including biochemistry, physiology, molecular biology,
genetics, and metabolomics have been used to clarify the drought tolerance mechanisms
in wheat and reveal metabolic pathways that can be manipulated to surmount the
adverse effects of water-limited conditions. Plant metabolomics (Fiehn et al., 2000), for
instance, has been extensively exercised for investigations of physiological and
metabolomic functions of genes, QTL studies, and development of genetic breeding
programs (Jacobs et al., 2007).
Metabolomics refers to the quantitative and comprehensive study of metabolites
in an organism (Dettmer & Hammock, 2004). It can be described as a snapshot of all
2
small metabolites constituting an organism’s phenotype in its tissues or fluids and is the
latest of the “omics”- sciences, preceded by genomics, transcriptomics and proteomics.
In contrast to the other “omics” metabolomics provides broader information of the
phenotype, with endogenous metabolites reflecting both genetic setup and response, as
well as exogenous metabolites from exposure to environmental factors. The untargeted
metabolomics approach is primarily a tool generating new hypotheses and prediction
models (Kell, 2004).
The main hypothesis when using the untargeted approach is that there is
asystematic variation of metabolites, e.g. between treatment group and control or
between baseline and later time points or between treatments. The aim when choosing
analytical methods for metabolomics is to find a method that detects and quantities as
many metabolites as possible, rather than aiming at the in-depth exploration of an a
priori defined set of metabolites.
In this study, a GC-MS-based metabolomics approach was implemented for
determination of low-molecular-weight drought stress-responsive metabolites in leaf
and root tissue samples of wild and domesticated wheat relatives. The metabolic content
of control and drought-stressed leaf and root tissues from different Triticeae species
were compared to explore the effects of drought stress on a metabolomic level and to
track the genes that are encoding enzymes involved in the biochemical pathways, using
the transcriptome and Wheat Genome Survey Sequences (WGSS).
Finally, the mechanisms of plant adaptation to drought stress were observed
through morphological examination of the sample roots. The outcomes of this study
provide a valuable source for metabolome of modern and wild wheat species, which
could eventually contribute to the future genetic and metabolomic studies of the
domesticated crops.
3
CHAPTER NO. 2
2. Review of Literature
2.1. Triticeae, The tribe
The tribe Triticeae belongs to the grass family (Poaceae) includes nearly 400
perennial and 100 annual taxa. Triticeae has played a precious role in human
civilization, and it includes species that are indispensable for human welfare. It
encompasses forage and lawn grasses as well as several agriculturally important
domesticated major crops from the genera Hordeum (barley), Triticum (wheat) and
Secale (rye), which are traditionally cultivated in the temperate zone. These species
have been used as staple food and beverages in various ways throughout the history of
humanity. Triticeae species have a complex evolutionary history being subjected to
domestication (Middleton et al., 2014).
Triticeae tribe has a basic chromosome number of seven and comprises diploids
(2n=2x=14), as well as species with varying degrees of polyploidy up to duodecaploids
(2n=12x=84). Allopolyploidization, a cytogenetic process during hybridization resulting
in the presence of complete chromosome sets of both parents in the progeny, has been
and still is the major driving force in this tribe’s evolution. Hence, this natural process
has been utilized to artificially create species through intergeneric or interspecific
hybridization, increasing the genetic variability within the tribe.
For instance, Triticale (Triticosecale), a currently commercial crop was
synthesized by artificial hybridization to develop a crop with high grain quality and
quantity of wheat, and superior stress tolerance of rye. Elucidation of molecular
mechanisms underlying differential yield and stress characteristics of Triticeae genera,
species, subspecies and cultivars and their integration into breeding programmes is
crucial for further improvement of their agronomic performance and ameliorate the
effects of climate change (Wang et al., 2010; Wang and Lu, 2014; Middleton et al.,
2014).
4
2.2. Wheat as a Staple Food
Wheat is currently the most extensively grown crop in the world covering 30%
of the agricultural area (approximately 218 million hectors) used for cereal cultivation.
With a global annual production of over 713 million tones, wheat is the third most
abundantly produced crop, following maize and rice (based on FAO statistics of
2013;http://faostat.fao.org). Wheat is a fundamental source of protein, vitamins and
minerals for human food consumption, providing almost 20% of the human dietary
energy supply in calories (http://www.fao.org, 2011).
Wheat cultivation and domestication has been directly associated with the spread
of agriculture. Cultivated wheat refers mainly to two types: hexaploid bread wheat
(Triticum aestivum L.; AABBDD, 2n=6x=42) accounting for about 95% of world wheat
production, and the tetraploid durum wheat (T.turgidum ssp. durum; AABB, 2�=4�=28)
accounting for the remaining 5%. Domesticated tetraploid durum is one of the oldest
cultivated cereal species in the world and its domestication from wild emmer wheat (T.
turgidum ssp. dicoccoides; AABB, 2�=4�=28) in the Near East Fertile Crescent, dates to
approximately 10,000 year ago.
Allohexaploid bread wheat is originated from hybridization between cultivated
allotetraploid emmer wheat and diploid goat grass (DD, Aegilops tauschii)
approximately 8,000 years ago in the Near East Fertile Crescent. The three diploid
genome progenitors: Triticum urartu (AA), Aegilops tauschii (DD) an unknown BB
progenitor (possibly Sitopsis section species similar to Aegilops speltoides) radiated
from a common Triticeae ancestor 2.5-4.5 million years ago and, AABB tetraploids
arose less than 0.5 million years ago (Feldman, 2001; Brenchley et al., 2012; Kurtoglu
et al., 2014).
2.3. Abiotic Stress Factors and Drought
To meet the demands of the ever-growing population, world food production
needs to be doubled by the year 2050 (Tilman et al., 2002; Qin et al., 2011). Abiotic
stresses, as the primary causes of agricultural loss worldwide, are estimated to result in
an average yield loss of more than 50% for most crops (Boyer, 1982; Bray et al., 2000;
Akpinar et al., 2013; Qin et al., 2011). Global environmental warming, with the prospect
of increasing environmental stresses, threatens the world’s food supply, making
5
stabilizing yields as much of a challenge as increasing them (Nevo and Chen, 2010;
Kantar et al., 2011a). Drought in crop production results from a shortage of water in the
root zone (Salekdeh et al., 2009; Nevo and Chen, 2010). Constant and sproadic periods
of drought is currently the most prominent andwidespread abiotic stress, accounting for
a significant portion of the yield loss resulting from abiotic factors and effecting more
than 10% of arable land (Akpinar et al., 2013; Kantar et al., 2011a; Bray et al., 2000).
2.4. Drought Stress Tolerance
Drought stress tolerance is the ability of a plant to access soil water and use it
efficiently to live, grow and reproduce satisfactorily under conditions of limited water
supply or under periodic conditions of water deficit (Fleury et al., 2010; Turner, 1979;
Richards et al., 2010; Munns et al., 2010; Kantar et al., 2011a). Tolerance strategies
include resistance mechanisms, which enable plants to survive osmotic stress, and
avoidance mechanisms, which prevent plants’ exposure to dehydration through growth
habits like deeper rooting for better access soil water, or shortened growth span through
faster development and maturation (Fleury et al., 2010; Kantar et al., 2011a; Nevo and
Chen, 2010).
Most plants have developed strategies to cope with drought stress having
evolved in habitats with limited water availability (Kantar et al., 2011a). However,
modern crop species, have drastically lost their tolerance to environmental stresses,
including drought through the process of domestication, followed by centuries of
cultivation (Tang et al., 2010; Nevo, 2004; Dubcovsky and Dvorak, 2007; Reynolds and
Condon, 2007; Kantar et al., 2011a; Nevo and Chen, 2010).
The capacity of plants to tolerate drought depends largely on the drought
adaptation mechanisms within their genomes, and how efficiently these mechanisms are
activated when plants are exposed to stress. Few agronomic traits are controlled by
single genes or isolated biological pathways. Likewise, genetic control of plant response
to drought is a complex trait controlled by an intermingled network of gene interactions
regulated at multiple levels and highly effected by environmental factors. Elucidation,
the complete molecular basis of drought response and tolerance, is highly challenging,
yet crucial.
6
2.5. Effects and Responses to Drought Stress
The drought has a multitude of detrimental effects on plant cellular function.
Drought responses of plants include attenuated growth and suppression of core
metabolism. Exposure to drought is followed by a decrease in osmotic potential and
cellular dehydration, causing reduced cytosolic and vacuolar volumes. With the
suppression of core metabolism, reactive oxygen species (ROS) (e.g. singlet oxygen and
hydrogen peroxide) are highly accumulated majorly from chloroplasts and to some
extend from mitochondria, causing oxidative stress, resulting in cellular and protein
damage (Ergen et al., 2009; Kantar et al., 2011a).
Plant response to drought aims to minimize these harmful effects for the
continuation of plant survival, growth and reproduction. This includes stimulation of
multiple signal transduction cascades consisting of a network of protein interactions
mediated by reversible phophorylation (e.g. mitogen activated protein kinases, sucrose
nonfermenting-like kinases, phosphotases) and release of secondary messengers (e.g.
phospholipid and calcium signalling) triggering cellular, metabolic and physiological
changes. Following dehydration, compatible solutes, sugars, sugar alcohols, amino
acids, or other nontoxic molecules (e.g. proline, glycine betaine), are highly
accumulated in the cytoplasm and are believed to confer osmotic adjustment without
interfering with the metabolism (Bartels and Sunkar, 2005; Valliyodan and Nguyen,
2006; Barnabás et al., 2008).
The level of different chemicals including ascorbate, carotenoids and enzymatic
antioxidants (superoxidase dismutase, catalase), which cope with oxidative damage by
scavenging ROS, are also drought induced (Shinozaki and Yamaguchi-Shinozaki,
2007). To ameliorate the effects of oxidative damage, late embryogenesis abundant
proteins (LEAs) (e.g. dehydrin) and molecular chaperones like heat shock proteins
(HSPs) also accumulate during osmotic stress aiding in the functional protection of
essential proteins (Wang et al., 2003; Mahajan and Tuteja, 2005). Drought response is a
complex process, in which several other cellular mechanisms have been implicated
including signalling through molecules like salicyclic acid, or nitric oxide; as well as
regulation of transport through aquaporins and ion channels.
Activation of various cellular mechanisms for triggering drought response
demands the synthesis of new proteins and degradation of existing ones that are not or
less essential in this environment (Bartels and Sunkar, 2005; Barnabás et al., 2008;
7
Mahajan and Tuteja, 2005). These alterations in expression profiles are regulated
elaborately in multiple levels: transcriptional, post-transcriptional, post-translational.
Transcriptional regulation of drought-induced gene products is achieved through
activation of several transcription factors and trancriptional regulators; and abscisic acid
(ABA)-dependent and -independent pathways are two well-established transcriptional
regulatory circuits induced by drought.
Plant genes involved in drought response are also known to be regulated at the
post-transcriptional level. Similarly, some post-translational modifications (e.g.
ubiquitination, small ubiquitin-like modifier-ylation, isoprenylation) with different
cellular roles have also been shown to contribute to regulation in response to drought
(Kantar et al., 2011a; Ergen et al., 2009).
2.6. Wild and Domesticated Crops
As the availability of water for agriculture is becoming limited, there is growing
emphasis on the need to identify and dissect novel drought-response mechanisms to
utilize in the genetic improvement of cultivated crops for stress tolerance.
Domestication of crops, followed by centuries of cultivation has considerably narrowed
the gene pools of today’s elite cultivars, drastically reducing their stress tolerance.
Common agricultural practices favour breeding under tightly controlled conditions,
which introduces an artificial selection pressure for production yield, which eradicates
the crop germplasm diversity in the long run and leads to the loss of valuable alleles for
stress tolerance.
For the development of high yielding cultivars under stress conditions,
investigation of naturally occurring relatives of modern crops hold great potential as
these drought- resistant ancestors are valuable sources harbouring advantageous stress
adaptation and tolerance pathways. As progenitors of cultivated wheat and barley: T.
dicoccoides and H. spontaneum have recently gained prominenence as genetic resources
for novel drought mechanisms (Kantar et al., 2010; Ergen et al., 2009; Akpinar et al.,
2013; Nevo and Chen, 2010).
2.6.1. Wild Emmer Wheat
Triticum turgidum ssp. dicoccoides is the tetraploid progenitor of both bread
wheat and domesticated tetraploid durum wheat. It is thought to have originated in
8
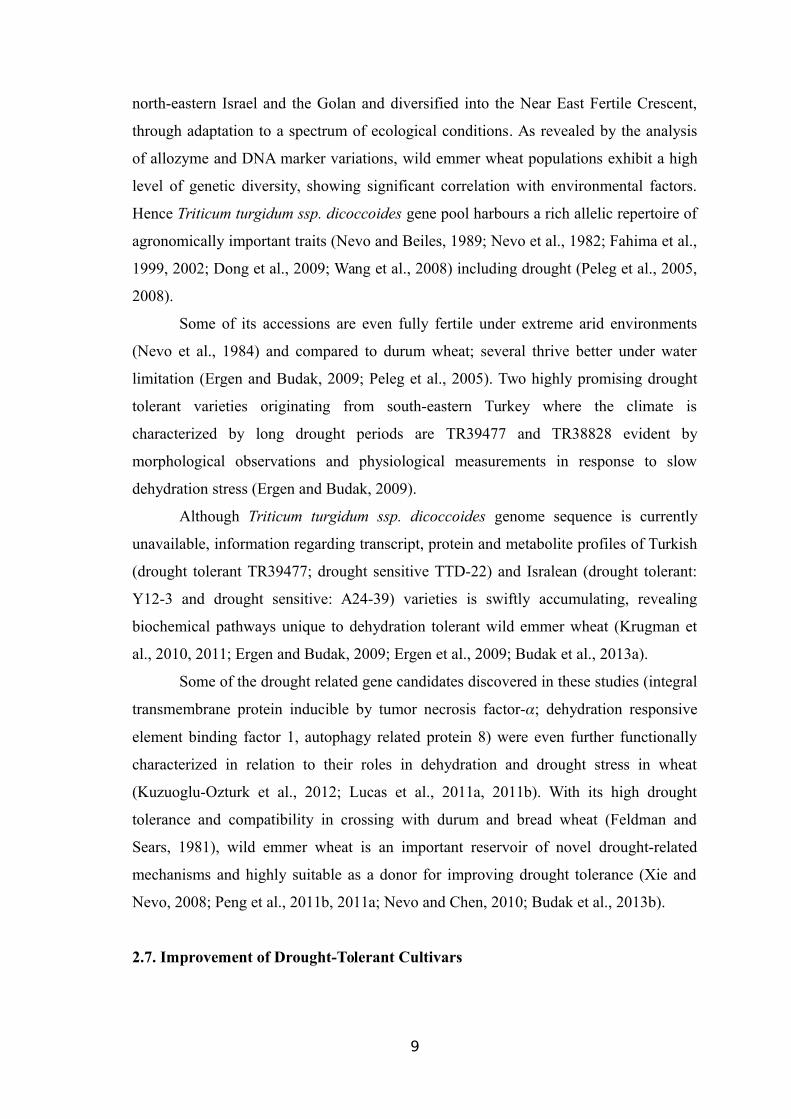
north-eastern Israel and the Golan and diversified into the Near East Fertile Crescent,
through adaptation to a spectrum of ecological conditions. As revealed by the analysis
of allozyme and DNA marker variations, wild emmer wheat populations exhibit a high
level of genetic diversity, showing significant correlation with environmental factors.
Hence Triticum turgidum ssp. dicoccoides gene pool harbours a rich allelic repertoire of
agronomically important traits (Nevo and Beiles, 1989; Nevo et al., 1982; Fahima et al.,
1999, 2002; Dong et al., 2009; Wang et al., 2008) including drought (Peleg et al., 2005,
2008).
Some of its accessions are even fully fertile under extreme arid environments
(Nevo et al., 1984) and compared to durum wheat; several thrive better under water
limitation (Ergen and Budak, 2009; Peleg et al., 2005). Two highly promising drought
tolerant varieties originating from south-eastern Turkey where the climate is
characterized by long drought periods are TR39477 and TR38828 evident by
morphological observations and physiological measurements in response to slow
dehydration stress (Ergen and Budak, 2009).
Although Triticum turgidum ssp. dicoccoides genome sequence is currently
unavailable, information regarding transcript, protein and metabolite profiles of Turkish
(drought tolerant TR39477; drought sensitive TTD-22) and Isralean (drought tolerant:
Y12-3 and drought sensitive: A24-39) varieties is swiftly accumulating, revealing
biochemical pathways unique to dehydration tolerant wild emmer wheat (Krugman et
al., 2010, 2011; Ergen and Budak, 2009; Ergen et al., 2009; Budak et al., 2013a).
Some of the drought related gene candidates discovered in these studies (integral
transmembrane protein inducible by tumor necrosis factor-�; dehydration responsive
element binding factor 1, autophagy related protein 8) were even further functionally
characterized in relation to their roles in dehydration and drought stress in wheat
(Kuzuoglu-Ozturk et al., 2012; Lucas et al., 2011a, 2011b). With its high drought
tolerance and compatibility in crossing with durum and bread wheat (Feldman and
Sears, 1981), wild emmer wheat is an important reservoir of novel drought-related
mechanisms and highly suitable as a donor for improving drought tolerance (Xie and
Nevo, 2008; Peng et al., 2011b, 2011a; Nevo and Chen, 2010; Budak et al., 2013b).
2.7. Improvement of Drought-Tolerant Cultivars
9
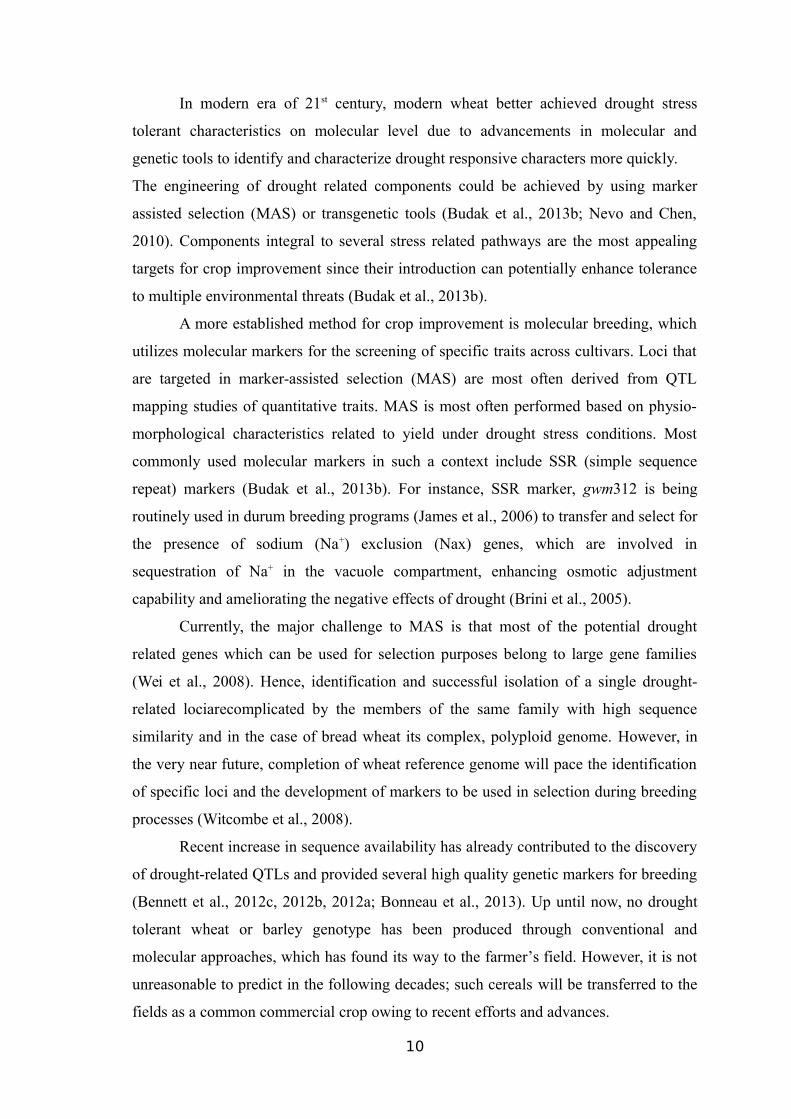
In modern era of 21st century, modern wheat better achieved drought stress
tolerant characteristics on molecular level due to advancements in molecular and
genetic tools to identify and characterize drought responsive characters more quickly.
The engineering of drought related components could be achieved by using marker
assisted selection (MAS) or transgenetic tools (Budak et al., 2013b; Nevo and Chen,
2010). Components integral to several stress related pathways are the most appealing
targets for crop improvement since their introduction can potentially enhance tolerance
to multiple environmental threats (Budak et al., 2013b).
A more established method for crop improvement is molecular breeding, which
utilizes molecular markers for the screening of specific traits across cultivars. Loci that
are targeted in marker-assisted selection (MAS) are most often derived from QTL
mapping studies of quantitative traits. MAS is most often performed based on physio-
morphological characteristics related to yield under drought stress conditions. Most
commonly used molecular markers in such a context include SSR (simple sequence
repeat) markers (Budak et al., 2013b). For instance, SSR marker, gwm312 is being
routinely used in durum breeding programs (James et al., 2006) to transfer and select for
the presence of sodium (Na+) exclusion (Nax) genes, which are involved in
sequestration of Na+ in the vacuole compartment, enhancing osmotic adjustment
capability and ameliorating the negative effects of drought (Brini et al., 2005).
Currently, the major challenge to MAS is that most of the potential drought
related genes which can be used for selection purposes belong to large gene families
(Wei et al., 2008). Hence, identification and successful isolation of a single drought-
related lociarecomplicated by the members of the same family with high sequence
similarity and in the case of bread wheat its complex, polyploid genome. However, in
the very near future, completion of wheat reference genome will pace the identification
of specific loci and the development of markers to be used in selection during breeding
processes (Witcombe et al., 2008).
Recent increase in sequence availability has already contributed to the discovery
of drought-related QTLs and provided several high quality genetic markers for breeding
(Bennett et al., 2012c, 2012b, 2012a; Bonneau et al., 2013). Up until now, no drought
tolerant wheat or barley genotype has been produced through conventional and
molecular approaches, which has found its way to the farmer’s field. However, it is not
unreasonable to predict in the following decades; such cereals will be transferred to the
fields as a common commercial crop owing to recent efforts and advances.
10

11
CHAPTER NO.3
3. Materials and Methods
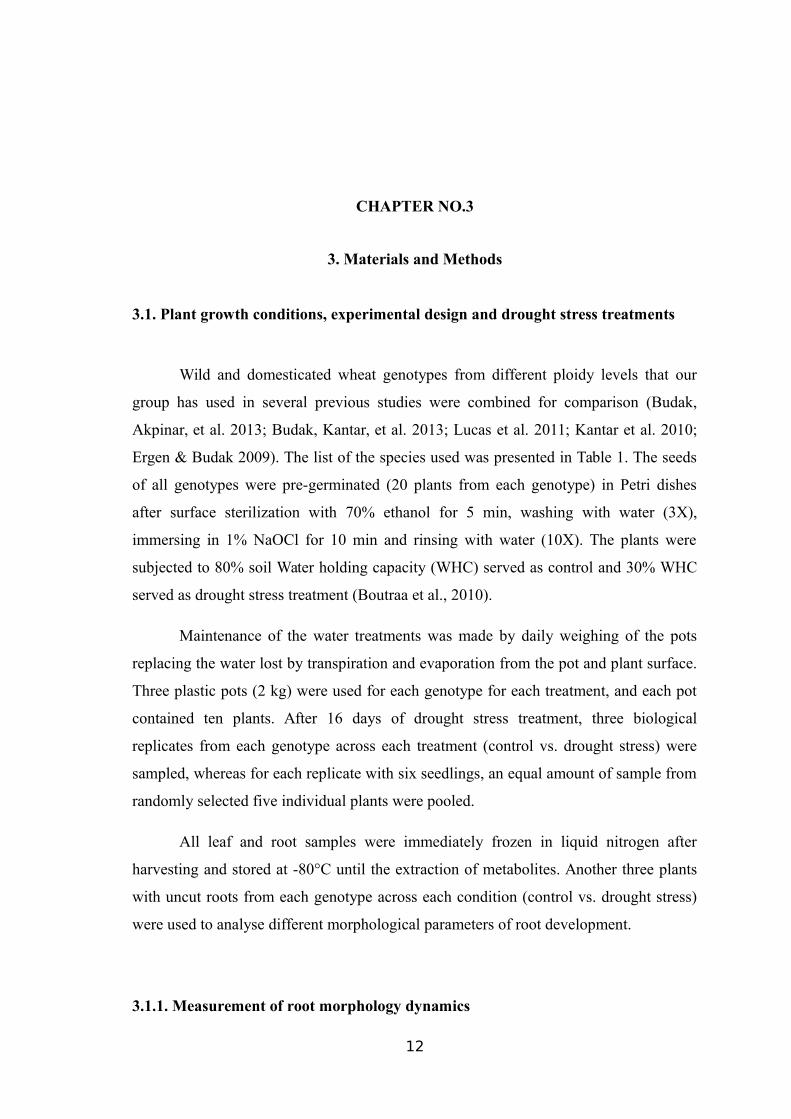
3.1. Plant growth conditions, experimental design and drought stress treatments
Wild and domesticated wheat genotypes from different ploidy levels that our
group has used in several previous studies were combined for comparison (Budak,
Akpinar, et al. 2013; Budak, Kantar, et al. 2013; Lucas et al. 2011; Kantar et al. 2010;
Ergen & Budak 2009). The list of the species used was presented in Table 1. The seeds
of all genotypes were pre-germinated (20 plants from each genotype) in Petri dishes
after surface sterilization with 70% ethanol for 5 min, washing with water (3X),
immersing in 1% NaOCl for 10 min and rinsing with water (10X). The plants were
subjected to 80% soil Water holding capacity (WHC) served as control and 30% WHC
served as drought stress treatment (Boutraa et al., 2010).
Maintenance of the water treatments was made by daily weighing of the pots
replacing the water lost by transpiration and evaporation from the pot and plant surface.
Three plastic pots (2 kg) were used for each genotype for each treatment, and each pot
contained ten plants. After 16 days of drought stress treatment, three biological
replicates from each genotype across each treatment (control vs. drought stress) were
sampled, whereas for each replicate with six seedlings, an equal amount of sample from
randomly selected five individual plants were pooled.
All leaf and root samples were immediately frozen in liquid nitrogen after
harvesting and stored at -80°C until the extraction of metabolites. Another three plants
with uncut roots from each genotype across each condition (control vs. drought stress)
were used to analyse different morphological parameters of root development.
3.1.1. Measurement of root morphology dynamics
12
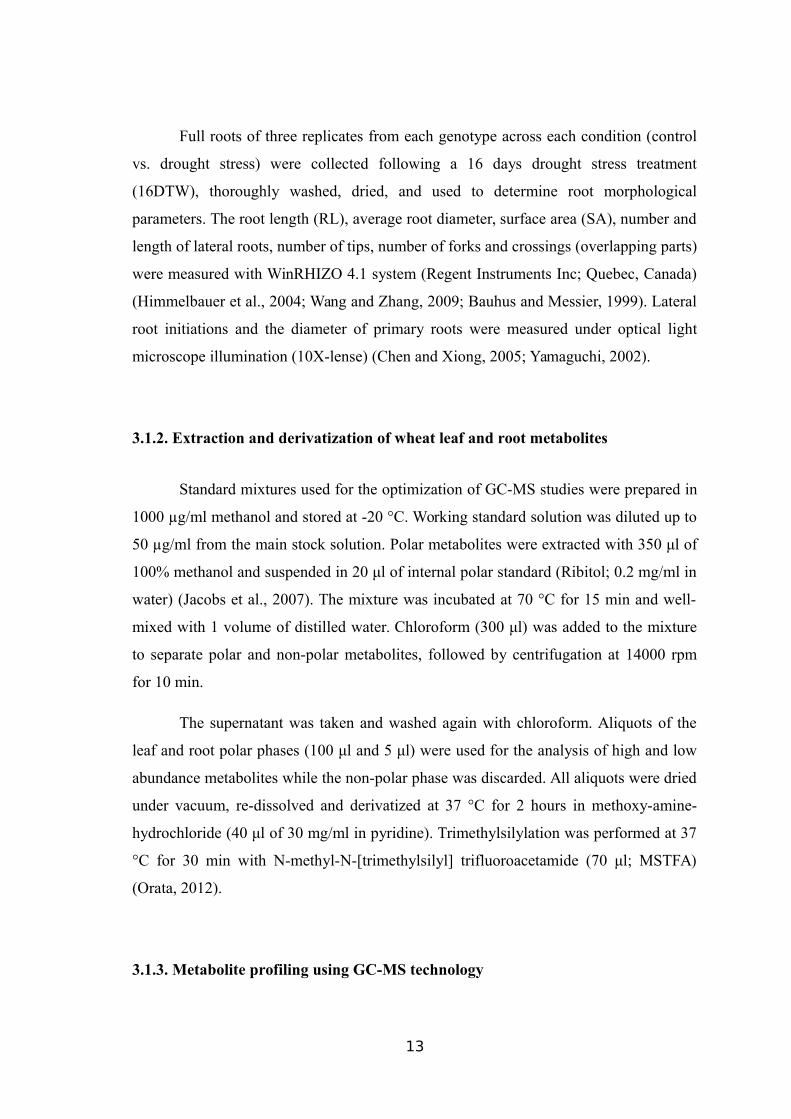
Full roots of three replicates from each genotype across each condition (control
vs. drought stress) were collected following a 16 days drought stress treatment
(16DTW), thoroughly washed, dried, and used to determine root morphological
parameters. The root length (RL), average root diameter, surface area (SA), number and
length of lateral roots, number of tips, number of forks and crossings (overlapping parts)
were measured with WinRHIZO 4.1 system (Regent Instruments Inc; Quebec, Canada)
(Himmelbauer et al., 2004; Wang and Zhang, 2009; Bauhus and Messier, 1999). Lateral
root initiations and the diameter of primary roots were measured under optical light
microscope illumination (10X-lense) (Chen and Xiong, 2005; Yamaguchi, 2002).
3.1.2. Extraction and derivatization of wheat leaf and root metabolites
Standard mixtures used for the optimization of GC-MS studies were prepared in
1000 µg/ml methanol and stored at -20 °C. Working standard solution was diluted up to
50 µg/ml from the main stock solution. Polar metabolites were extracted with 350 μl of
100% methanol and suspended in 20 μl of internal polar standard (Ribitol; 0.2 mg/ml in
water) (Jacobs et al., 2007). The mixture was incubated at 70 °C for 15 min and well-
mixed with 1 volume of distilled water. Chloroform (300 μl) was added to the mixture
to separate polar and non-polar metabolites, followed by centrifugation at 14000 rpm
for 10 min.
The supernatant was taken and washed again with chloroform. Aliquots of the
leaf and root polar phases (100 μl and 5 μl) were used for the analysis of high and low
abundance metabolites while the non-polar phase was discarded. All aliquots were dried
under vacuum, re-dissolved and derivatized at 37 °C for 2 hours in methoxy-amine-
hydrochloride (40 μl of 30 mg/ml in pyridine). Trimethylsilylation was performed at 37
°C for 30 min with N-methyl-N-[trimethylsilyl] trifluoroacetamide (70 μl; MSTFA)
(Orata, 2012).
3.1.3. Metabolite profiling using GC-MS technology
13
GC-MS-QP2010 Ultra Gas Chromatograph Mass Spectrometer with an AOC-
20i auto-injector GC Ultra and a DSQ quadruple MS (SHIMADZU Corporation, Tokyo,
101-8448, Japan) was used for metabolite profiling. The MS was tuned according to the
manufacturer’s recommendations using tris-(perfluorobutyl)-amine (CF43). GC was
performed on a 30-m MDN-35 capillary column with 0.25 mm inner diameter and 0.25
μm film thickness (Varian Inc, Victoria, Australia).
The injection temperature was set at 230 °C, the MS transfer line at 280 °C, and
the ion source at 250 °C. Helium 99.99% purity was used as a carrier gas with 1 ml/min
flow rate. The analysis was performed under the following oven temperature program:
injection at 70 °C followed by 1 °C/min ramp to 76 °C, and then by 6 °C/min to 330 °C,
finishing with 10 min isothermal at 330 °C. The samples obtained were injected into the
GC-MS column in the splitless mode, using the hot needle technique. The GC-MS
system was then temperature-equilibrated for 1 min at 70 °C before injection of the next
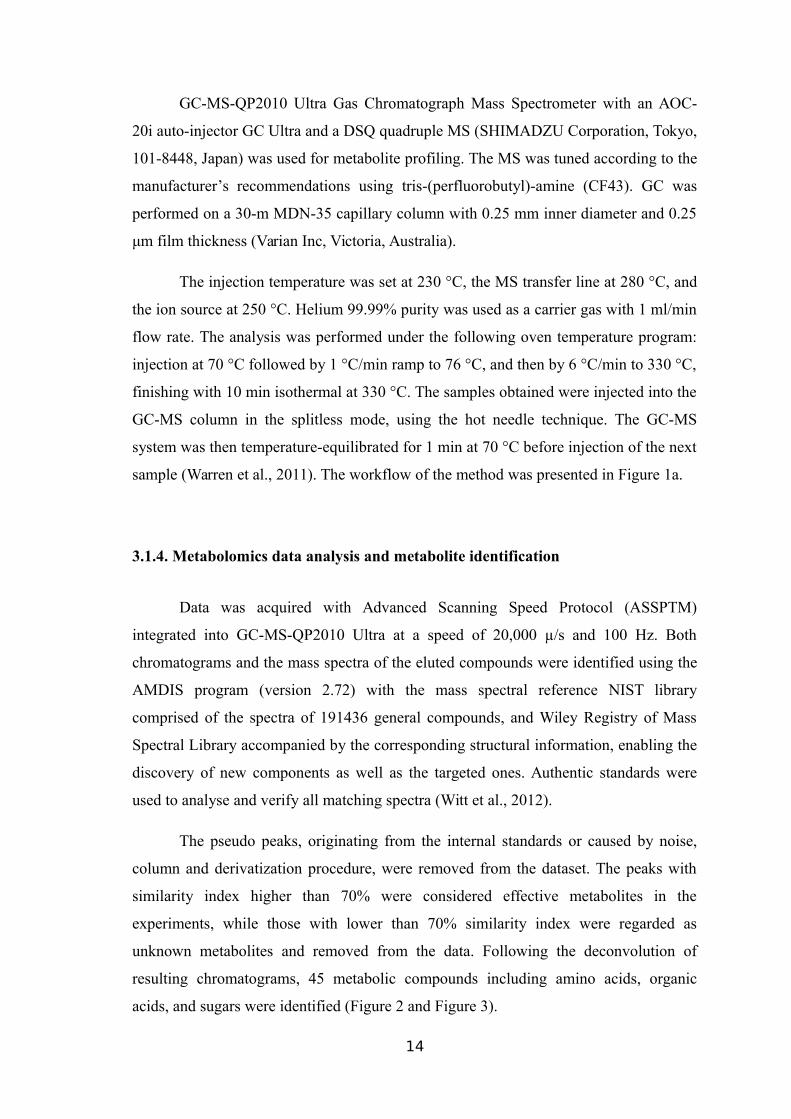
sample (Warren et al., 2011). The workflow of the method was presented in Figure 1a.
3.1.4. Metabolomics data analysis and metabolite identification
Data was acquired with Advanced Scanning Speed Protocol (ASSPTM)
integrated into GC-MS-QP2010 Ultra at a speed of 20,000 µ/s and 100 Hz. Both
chromatograms and the mass spectra of the eluted compounds were identified using the
AMDIS program (version 2.72) with the mass spectral reference NIST library
comprised of the spectra of 191436 general compounds, and Wiley Registry of Mass
Spectral Library accompanied by the corresponding structural information, enabling the
discovery of new components as well as the targeted ones. Authentic standards were
used to analyse and verify all matching spectra (Witt et al., 2012).
The pseudo peaks, originating from the internal standards or caused by noise,
column and derivatization procedure, were removed from the dataset. The peaks with
similarity index higher than 70% were considered effective metabolites in the
experiments, while those with lower than 70% similarity index were regarded as
unknown metabolites and removed from the data. Following the deconvolution of
resulting chromatograms, 45 metabolic compounds including amino acids, organic
acids, and sugars were identified (Figure 2 and Figure 3).
14
Each metabolic compound was given a specific trace to be used in the
quantification (Alvarez et al., 2008). The resulting peak areas were normalized to the
area of a specific trace of the internal standard resulting in relative response ratios,
which were further normalized by the fresh weight of each sample (Table 2 and Table
3).
3.1.5. Statistical data analysis
The complete metabolomics data were mean-centered for Principal Component
Analysis (PCA) and Partial Least-Squares-Discriminant Analysis (PLS-DA).
Hierarchical Cluster Analysis (HCA) was performed usingCluster (version 3.0). Total
explained variance (R2) and predictability (Q2) values were extracted from the
metabolomics data by using unit variance scaling method. A two-sample t-test was
applied to find the level of significance between the metabolites and the inter-
connection between significantly altered metabolites was analyzed by using R software.
The Cytoscape software was used to reveal metabolite-metabolite interaction
and gene-metabolite networks by integrating the data (Lopes et al., 2010; Shannon et
al., 2003; Kopka, 2006).
3.1.6. Identification and location of genes in wheat genome
For the validation of data, the full-length cDNA from Oryza sativa (The Rice
Full-Length cDNA Consortium, 2013) was used to extract orthologous of genes
encoding the enzymes of biochemical pathways responsible for the biosynthesis of
drought-specific metabolites. Later, TBLASTX search (e-value<3e-106) was adopted by
using annotated rice orthologous cDNA sequences to identify corresponding wheat FL-
cDNAs from the Chinese spring collection (Kawaura et al., 2009) and the transcriptome
data (Akpinar et al., 2015; Alptekin and Budak, 2016).
Finally, BLASTN search was performed against WGSS, and the chromosomal
location was identified based on a threshold value of 85% sequence identity. The
workflow of the study was presented in Figure 1b.
15
Figure 1 The outlines of methodologies used for (a) metabolite extraction and analysis
and (b) BLAST search for target gene identification.
16
CHAPTER NO. 4
4. Results
4.1. Morphological responses of roots to drought stress
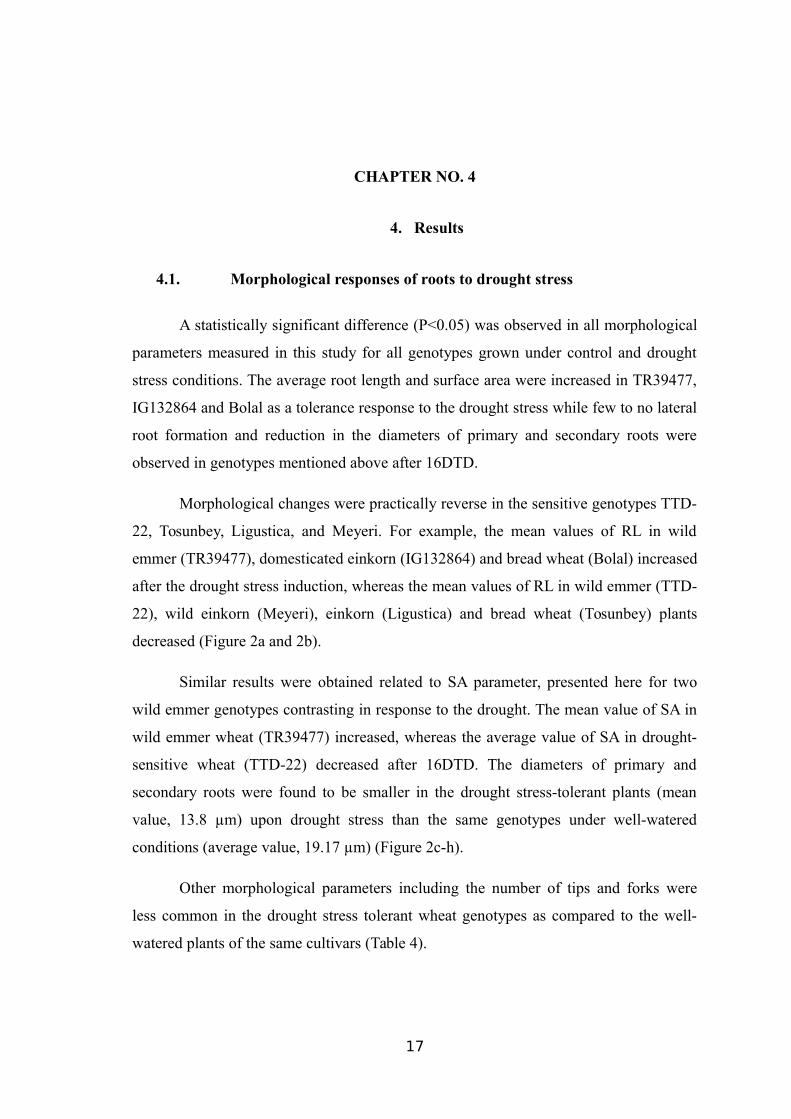
A statistically significant difference (P<0.05) was observed in all morphological
parameters measured in this study for all genotypes grown under control and drought
stress conditions. The average root length and surface area were increased in TR39477,
IG132864 and Bolal as a tolerance response to the drought stress while few to no lateral
root formation and reduction in the diameters of primary and secondary roots were
observed in genotypes mentioned above after 16DTD.
Morphological changes were practically reverse in the sensitive genotypes TTD-
22, Tosunbey, Ligustica, and Meyeri. For example, the mean values of RL in wild
emmer (TR39477), domesticated einkorn (IG132864) and bread wheat (Bolal) increased
after the drought stress induction, whereas the mean values of RL in wild emmer (TTD-
22), wild einkorn (Meyeri), einkorn (Ligustica) and bread wheat (Tosunbey) plants
decreased (Figure 2a and 2b).
Similar results were obtained related to SA parameter, presented here for two
wild emmer genotypes contrasting in response to the drought. The mean value of SA in
wild emmer wheat (TR39477) increased, whereas the average value of SA in drought-
sensitive wheat (TTD-22) decreased after 16DTD. The diameters of primary and
secondary roots were found to be smaller in the drought stress-tolerant plants (mean
value, 13.8 µm) upon drought stress than the same genotypes under well-watered
conditions (average value, 19.17 µm) (Figure 2c-h).
Other morphological parameters including the number of tips and forks were
less common in the drought stress tolerant wheat genotypes as compared to the well-
watered plants of the same cultivars (Table 4).
17
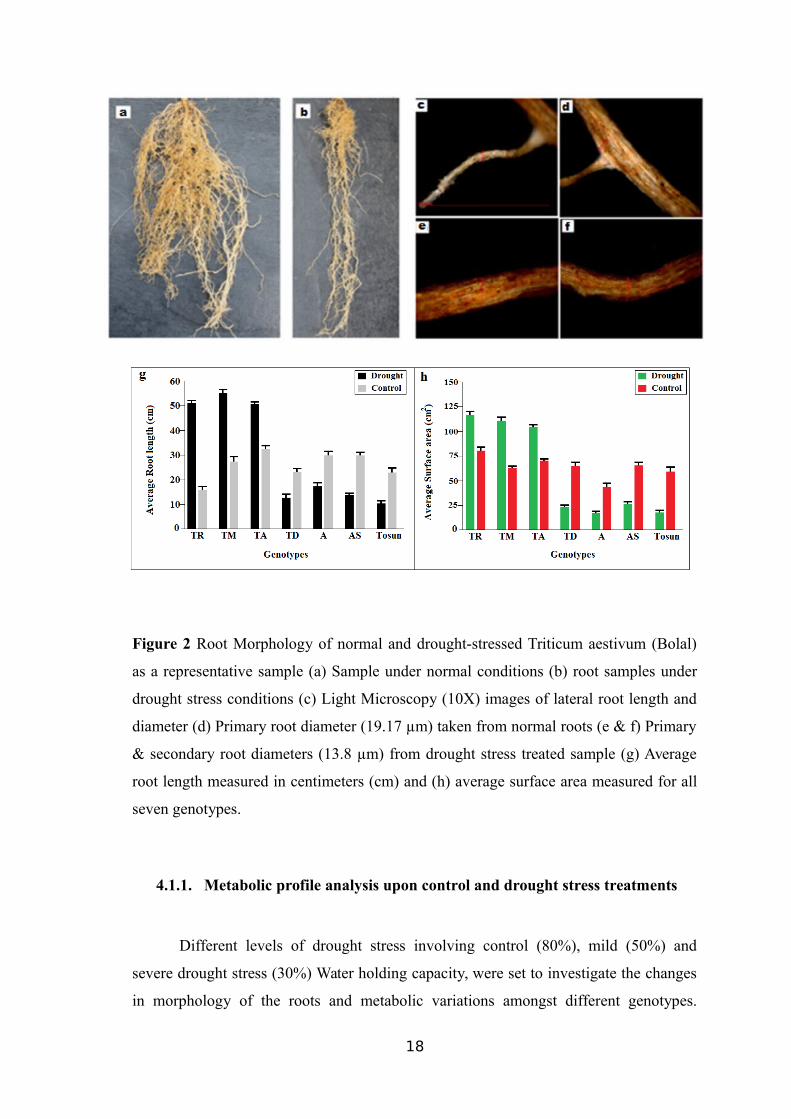
Figure 2 Root Morphology of normal and drought-stressed Triticum aestivum (Bolal)
as a representative sample (a) Sample under normal conditions (b) root samples under
drought stress conditions (c) Light Microscopy (10X) images of lateral root length and
diameter (d) Primary root diameter (19.17 µm) taken from normal roots (e & f) Primary
& secondary root diameters (13.8 µm) from drought stress treated sample (g) Average
root length measured in centimeters (cm) and (h) average surface area measured for all
seven genotypes.
4.1.1. Metabolic profile analysis upon control and drought stress treatments
Different levels of drought stress involving control (80%), mild (50%) and
severe drought stress (30%) Water holding capacity, were set to investigate the changes
in morphology of the roots and metabolic variations amongst different genotypes.
18
Interestingly, no obvious morphological differences were observed between control
samples and individuals exposed to mild 50% WHC for maximum 16 days, whereas
30% WHC caused severe effects on the morphology and physiology of the drought-
sensitive plants.
Therefore, severe drought stress treatment (30% WHC) was chosen to compare
the morphological and metabolic responses of the samples from different ploidy with
control treatment (80% WHC), wherein metabolomics analysis coupled with the
transcriptomics data, previously reported by our group (Akpinar et al., 2015), was used.
Metabolites were extracted from the leaf, and root tissue samples in triplicates from all
seven Triticeae species for each of the four experimental groups, including drought
stress treated leaves (DSL), drought stress treated roots (DSR), control leaves (CL) and
control roots (CR) (Figure 3 and Figure 4). All four groups presented distinct
chromatographic patterns, and 45 metabolic compounds were differentially
accumulated, embracing amino acids, organic acids, sugars, organic compounds and
organic antioxidants and compatible solutes as presented in Table 5.
PCA, an unsupervised data analysis method, was performed to reduce the
dimensionality of the metabolomics data generated by GC-MS. The explanation and
predictability values measured for first two PCs were 71.2% and 42.6%, respectively.
PCA analysis is presented discriminations between the 80% WHC and 30% WHC
samples, but, an overlap was observed between the DSL and DSR samples (Figure 5a).
PCA analysis was also applied separately for each of the remaining three groups
including CL vs. DSL, CR vs. DSR and DSL vs. DSR in order to contrast the datasets
for better understanding.
19
20
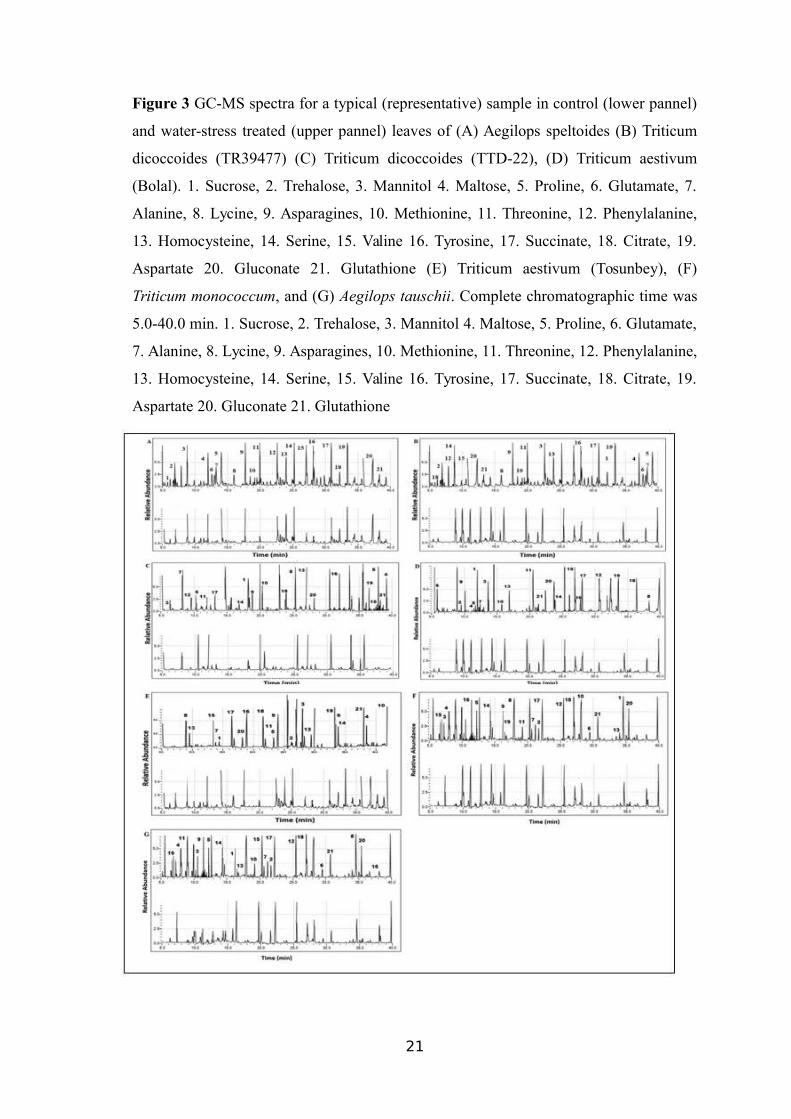
Figure 3 GC-MS spectra for a typical (representative) sample in control (lower pannel)
and water-stress treated (upper pannel) leaves of (A) Aegilops speltoides (B) Triticum
dicoccoides (TR39477) (C) Triticum dicoccoides (TTD-22), (D) Triticum aestivum
(Bolal). 1. Sucrose, 2. Trehalose, 3. Mannitol 4. Maltose, 5. Proline, 6. Glutamate, 7.
Alanine, 8. Lycine, 9. Asparagines, 10. Methionine, 11. Threonine, 12. Phenylalanine,
13. Homocysteine, 14. Serine, 15. Valine 16. Tyrosine, 17. Succinate, 18. Citrate, 19.
Aspartate 20. Gluconate 21. Glutathione (E) Triticum aestivum (Tosunbey), (F)
Triticum monococcum, and (G) Aegilops tauschii. Complete chromatographic time was
5.0-40.0 min. 1. Sucrose, 2. Trehalose, 3. Mannitol 4. Maltose, 5. Proline, 6. Glutamate,
7. Alanine, 8. Lycine, 9. Asparagines, 10. Methionine, 11. Threonine, 12. Phenylalanine,
13. Homocysteine, 14. Serine, 15. Valine 16. Tyrosine, 17. Succinate, 18. Citrate, 19.
Aspartate 20. Gluconate 21. Glutathione
21
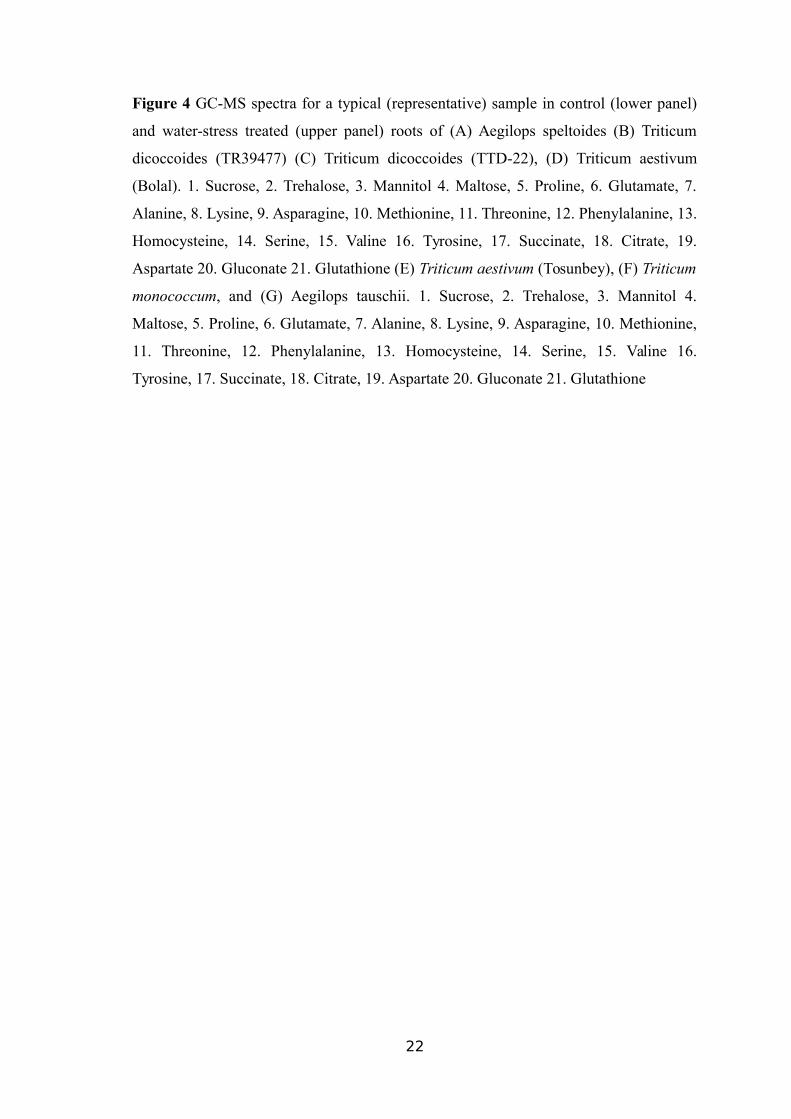
Figure 4 GC-MS spectra for a typical (representative) sample in control (lower panel)
and water-stress treated (upper panel) roots of (A) Aegilops speltoides (B) Triticum
dicoccoides (TR39477) (C) Triticum dicoccoides (TTD-22), (D) Triticum aestivum
(Bolal). 1. Sucrose, 2. Trehalose, 3. Mannitol 4. Maltose, 5. Proline, 6. Glutamate, 7.
Alanine, 8. Lysine, 9. Asparagine, 10. Methionine, 11. Threonine, 12. Phenylalanine, 13.
Homocysteine, 14. Serine, 15. Valine 16. Tyrosine, 17. Succinate, 18. Citrate, 19.
Aspartate 20. Gluconate 21. Glutathione (E) Triticum aestivum (Tosunbey), (F) Triticum
monococcum, and (G) Aegilops tauschii. 1. Sucrose, 2. Trehalose, 3. Mannitol 4.
Maltose, 5. Proline, 6. Glutamate, 7. Alanine, 8. Lysine, 9. Asparagine, 10. Methionine,
11. Threonine, 12. Phenylalanine, 13. Homocysteine, 14. Serine, 15. Valine 16.
Tyrosine, 17. Succinate, 18. Citrate, 19. Aspartate 20. Gluconate 21. Glutathione
22
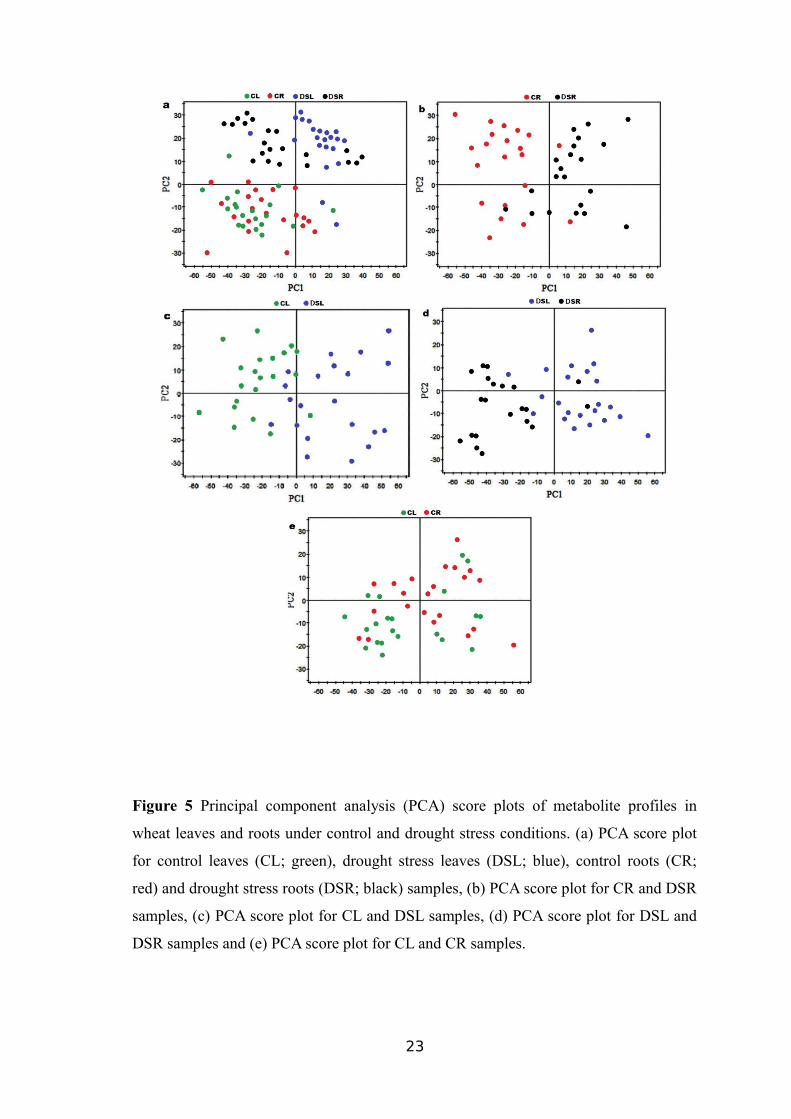
Figure 5 Principal component analysis (PCA) score plots of metabolite profiles in
wheat leaves and roots under control and drought stress conditions. (a) PCA score plot
for control leaves (CL; green), drought stress leaves (DSL; blue), control roots (CR;
red) and drought stress roots (DSR; black) samples, (b) PCA score plot for CR and DSR
samples, (c) PCA score plot for CL and DSL samples, (d) PCA score plot for DSL and
DSR samples and (e) PCA score plot for CL and CR samples.
23
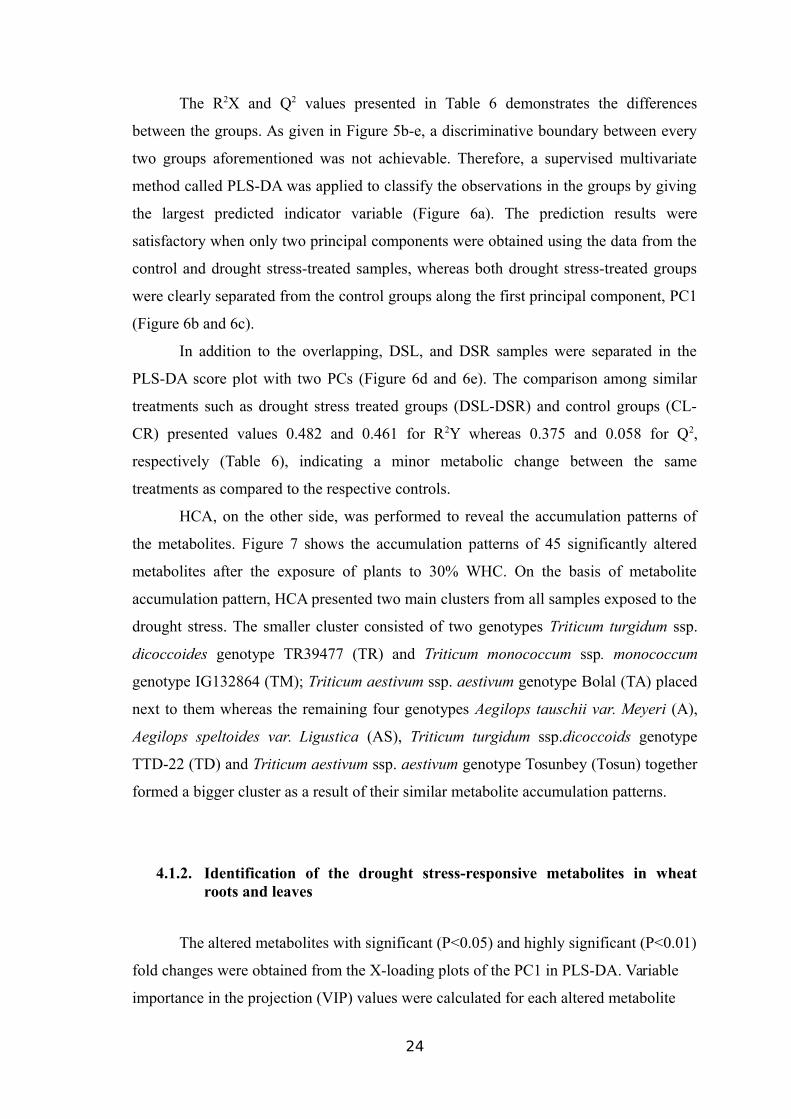
The R2X and Q2 values presented in Table 6 demonstrates the differences
between the groups. As given in Figure 5b-e, a discriminative boundary between every
two groups aforementioned was not achievable. Therefore, a supervised multivariate
method called PLS-DA was applied to classify the observations in the groups by giving
the largest predicted indicator variable (Figure 6a). The prediction results were
satisfactory when only two principal components were obtained using the data from the
control and drought stress-treated samples, whereas both drought stress-treated groups
were clearly separated from the control groups along the first principal component, PC1
(Figure 6b and 6c).
In addition to the overlapping, DSL, and DSR samples were separated in the
PLS-DA score plot with two PCs (Figure 6d and 6e). The comparison among similar
treatments such as drought stress treated groups (DSL-DSR) and control groups (CL-
CR) presented values 0.482 and 0.461 for R2Y whereas 0.375 and 0.058 for Q2,
respectively (Table 6), indicating a minor metabolic change between the same
treatments as compared to the respective controls.
HCA, on the other side, was performed to reveal the accumulation patterns of
the metabolites. Figure 7 shows the accumulation patterns of 45 significantly altered
metabolites after the exposure of plants to 30% WHC. On the basis of metabolite
accumulation pattern, HCA presented two main clusters from all samples exposed to the
drought stress. The smaller cluster consisted of two genotypes Triticum turgidum ssp.
dicoccoides genotype TR39477 (TR) and Triticum monococcum ssp. monococcum
genotype IG132864 (TM); Triticum aestivum ssp. aestivum genotype Bolal (TA) placed
next to them whereas the remaining four genotypes Aegilops tauschii var. Meyeri (A),
Aegilops speltoides var. Ligustica (AS), Triticum turgidum ssp.dicoccoids genotype
TTD-22 (TD) and Triticum aestivum ssp. aestivum genotype Tosunbey (Tosun) together
formed a bigger cluster as a result of their similar metabolite accumulation patterns.
4.1.2. Identification of the drought stress-responsive metabolites in wheatroots and leaves
The altered metabolites with significant (P<0.05) and highly significant (P<0.01)
fold changes were obtained from the X-loading plots of the PC1 in PLS-DA. Variable
importance in the projection (VIP) values were calculated for each altered metabolite
24
and a cut-off point made for all metabolites obtained from the GC-MS analysis. The
metabolites are having VIP values greater than one was considered as the most relevant
ones for the drought stress.
Figure 6 Partial least squares-discriminate analysis (PLS-DA) score plots of metabolic
profiles in wheat leaves and roots under control and drought stress conditions. (a) PLS-
25
DA score plot for control leaves (CL; green), drought stress leaves (DSL; blue), control
roots (CR; red) and drought stress roots (DSR; black) samples, (b) PLS-DA score plot
for CR and DSR samples, (c) PLS-DA score plot for CL and DSL samples, (d) PLS-DA
score plot for DSL and DSR samples and (e) PLS-DA score plot for CL and CR
samples.
26
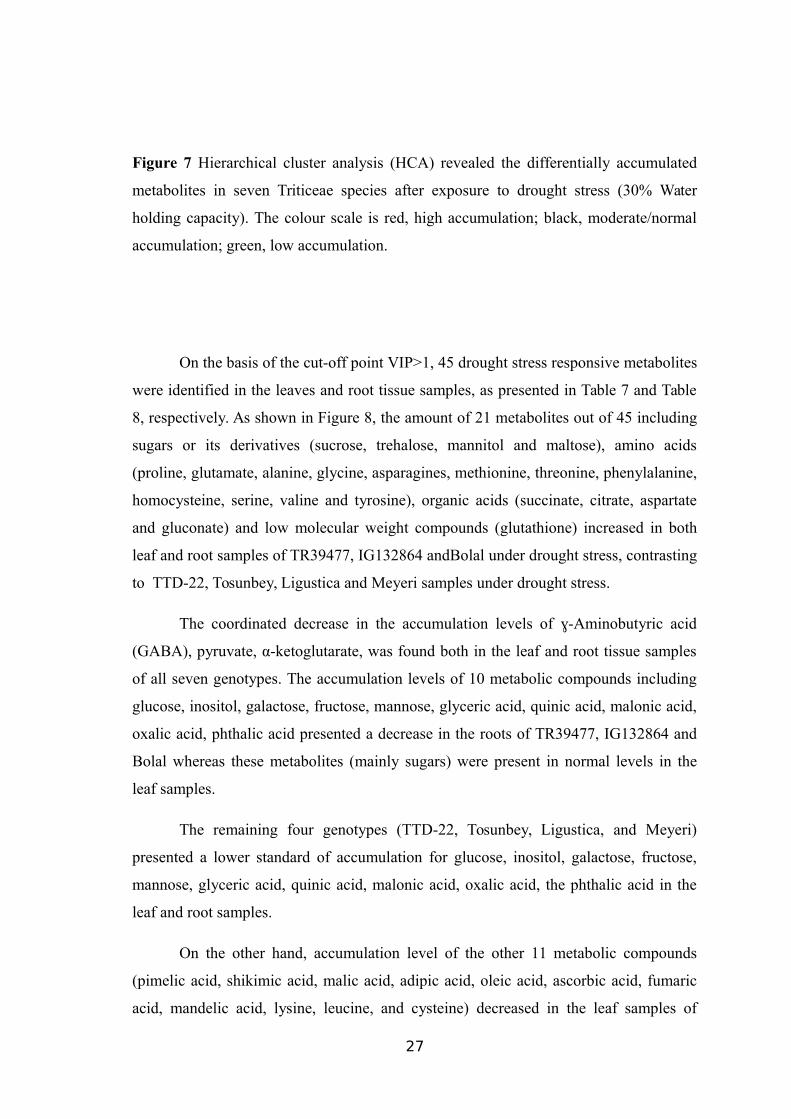
Figure 7 Hierarchical cluster analysis (HCA) revealed the differentially accumulated
metabolites in seven Triticeae species after exposure to drought stress (30% Water
holding capacity). The colour scale is red, high accumulation; black, moderate/normal
accumulation; green, low accumulation.
On the basis of the cut-off point VIP>1, 45 drought stress responsive metabolites
were identified in the leaves and root tissue samples, as presented in Table 7 and Table
8, respectively. As shown in Figure 8, the amount of 21 metabolites out of 45 including
sugars or its derivatives (sucrose, trehalose, mannitol and maltose), amino acids
(proline, glutamate, alanine, glycine, asparagines, methionine, threonine, phenylalanine,
homocysteine, serine, valine and tyrosine), organic acids (succinate, citrate, aspartate
and gluconate) and low molecular weight compounds (glutathione) increased in both
leaf and root samples of TR39477, IG132864 andBolal under drought stress, contrasting
to TTD-22, Tosunbey, Ligustica and Meyeri samples under drought stress.
The coordinated decrease in the accumulation levels of -Aminobutyric acidɣ
(GABA), pyruvate, α-ketoglutarate, was found both in the leaf and root tissue samples
of all seven genotypes. The accumulation levels of 10 metabolic compounds including
glucose, inositol, galactose, fructose, mannose, glyceric acid, quinic acid, malonic acid,
oxalic acid, phthalic acid presented a decrease in the roots of TR39477, IG132864 and
Bolal whereas these metabolites (mainly sugars) were present in normal levels in the
leaf samples.
The remaining four genotypes (TTD-22, Tosunbey, Ligustica, and Meyeri)
presented a lower standard of accumulation for glucose, inositol, galactose, fructose,
mannose, glyceric acid, quinic acid, malonic acid, oxalic acid, the phthalic acid in the
leaf and root samples.
On the other hand, accumulation level of the other 11 metabolic compounds
(pimelic acid, shikimic acid, malic acid, adipic acid, oleic acid, ascorbic acid, fumaric
acid, mandelic acid, lysine, leucine, and cysteine) decreased in the leaf samples of
27
TR39477, IG132864 and Bolal compared to the root and control samples whereas 5
metabolites (shikimic acid, adipic acid, lysine, cysteine, fumaric acid), 4 metabolites
(fumaric acid, mandelic acid, lysine and leucine), 2 metabolites (shikimic acid and
malic acid) and 3 metabolites (oleic acid, ascorbic acid and fumaric acid) were
accumulated in moderate to high levels in the leaf and root tissue samples of TTD-22,
Tosunbey, Ligustica and Meyeri, respectively (Figure 8 and 9).
The metabolites such as pimelic acid, malic acid, oleic acid, ascorbic acid,
mandelic acid and leucine in TTD-22; pimelic acid, shikimic acid, malic acid, adipic
acid, oleic acid, ascorbic acid, and cysteine in Tosunbey; pimelic acid, adipic acid, oleic
acid, ascorbic acid, fumaric acid, mandelic acid, lysine, leucine and cysteine in
Ligustica; and pimelic acid, shikimic acid, malic acid, adipic acid, mandelic acid, lysine,
leucine and cysteine in Meyeri, were found in decreased amounts upon drought stress
treatment as compared to the control treatment.
28
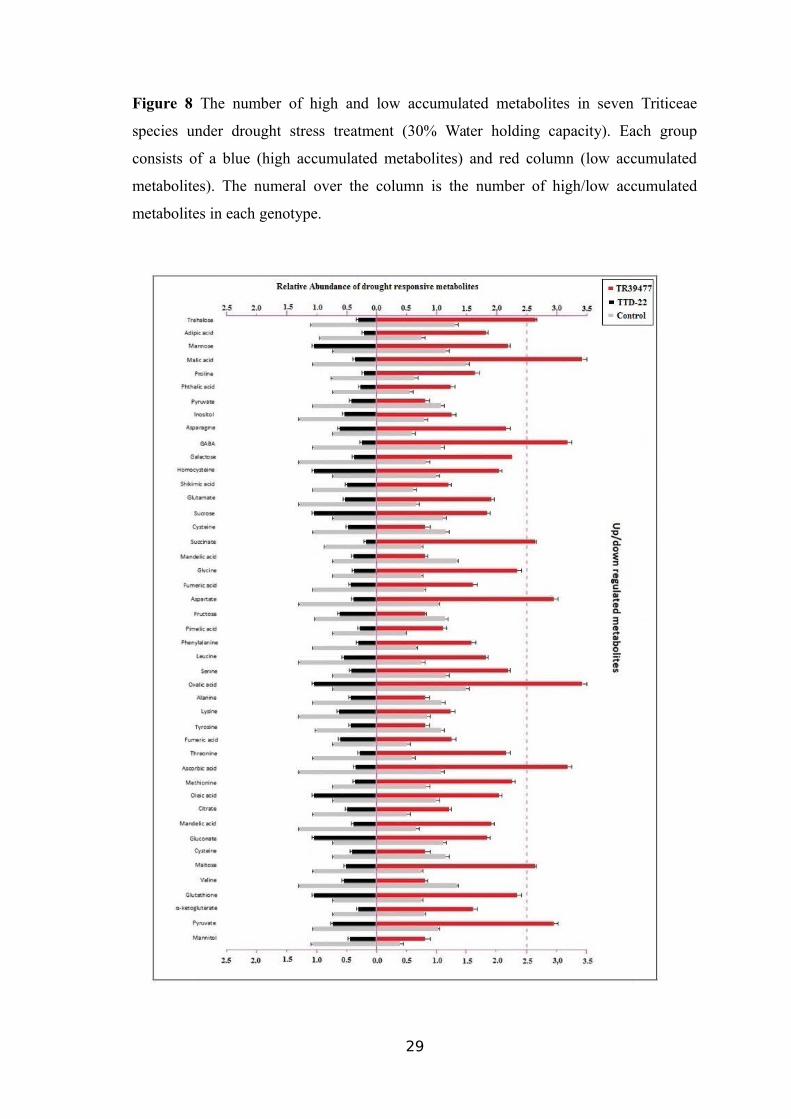
Figure 8 The number of high and low accumulated metabolites in seven Triticeae
species under drought stress treatment (30% Water holding capacity). Each group
consists of a blue (high accumulated metabolites) and red column (low accumulated
metabolites). The numeral over the column is the number of high/low accumulated
metabolites in each genotype.
29
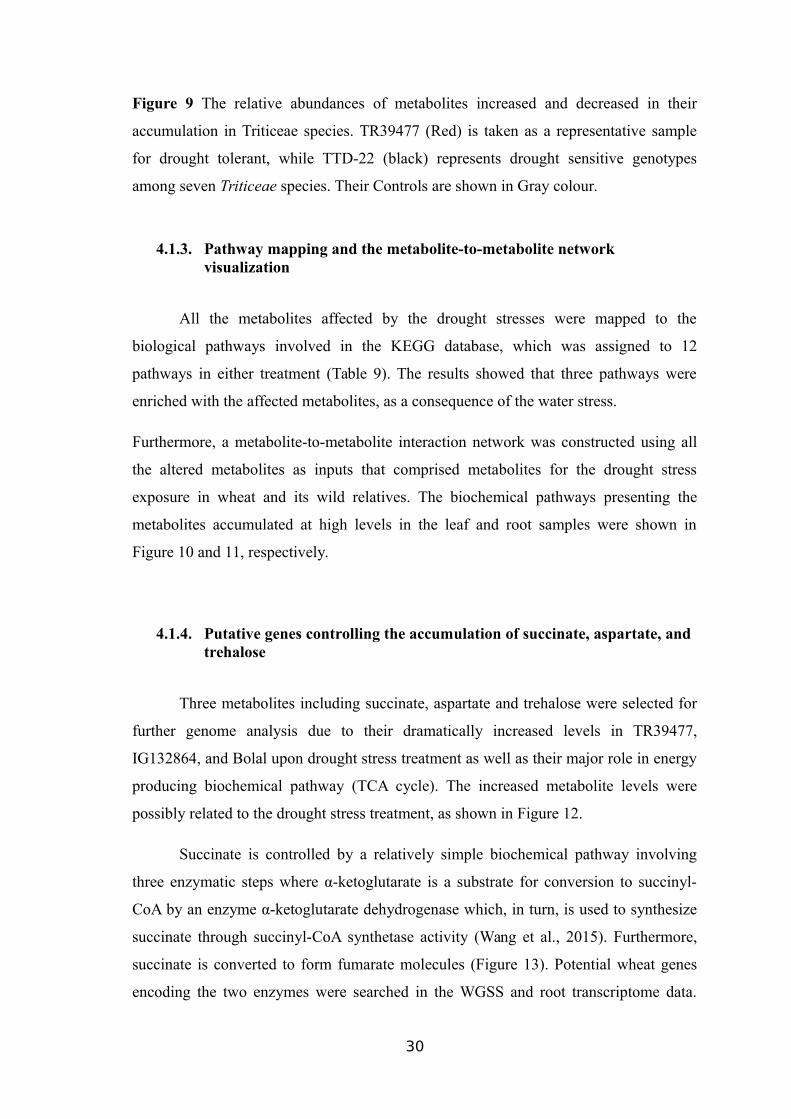
Figure 9 The relative abundances of metabolites increased and decreased in their
accumulation in Triticeae species. TR39477 (Red) is taken as a representative sample
for drought tolerant, while TTD-22 (black) represents drought sensitive genotypes
among seven Triticeae species. Their Controls are shown in Gray colour.
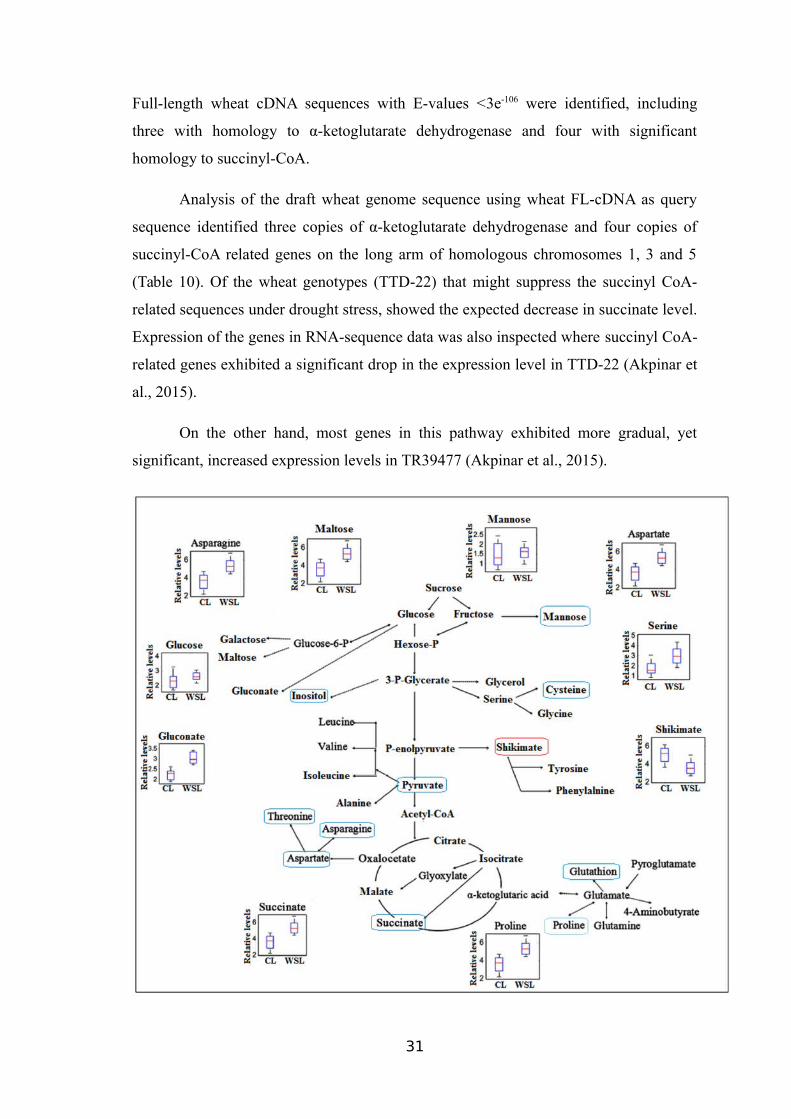
4.1.3. Pathway mapping and the metabolite-to-metabolite network visualization
All the metabolites affected by the drought stresses were mapped to the
biological pathways involved in the KEGG database, which was assigned to 12
pathways in either treatment (Table 9). The results showed that three pathways were
enriched with the affected metabolites, as a consequence of the water stress.
Furthermore, a metabolite-to-metabolite interaction network was constructed using all
the altered metabolites as inputs that comprised metabolites for the drought stress
exposure in wheat and its wild relatives. The biochemical pathways presenting the
metabolites accumulated at high levels in the leaf and root samples were shown in
Figure 10 and 11, respectively.
4.1.4. Putative genes controlling the accumulation of succinate, aspartate, and trehalose
Three metabolites including succinate, aspartate and trehalose were selected for
further genome analysis due to their dramatically increased levels in TR39477,
IG132864, and Bolal upon drought stress treatment as well as their major role in energy
producing biochemical pathway (TCA cycle). The increased metabolite levels were
possibly related to the drought stress treatment, as shown in Figure 12.
Succinate is controlled by a relatively simple biochemical pathway involving
three enzymatic steps where α-ketoglutarate is a substrate for conversion to succinyl-
CoA by an enzyme α-ketoglutarate dehydrogenase which, in turn, is used to synthesize
succinate through succinyl-CoA synthetase activity (Wang et al., 2015). Furthermore,
succinate is converted to form fumarate molecules (Figure 13). Potential wheat genes
encoding the two enzymes were searched in the WGSS and root transcriptome data.
30
Full-length wheat cDNA sequences with E-values <3e-106 were identified, including
three with homology to α-ketoglutarate dehydrogenase and four with significant
homology to succinyl-CoA.
Analysis of the draft wheat genome sequence using wheat FL-cDNA as query
sequence identified three copies of α-ketoglutarate dehydrogenase and four copies of
succinyl-CoA related genes on the long arm of homologous chromosomes 1, 3 and 5
(Table 10). Of the wheat genotypes (TTD-22) that might suppress the succinyl CoA-
related sequences under drought stress, showed the expected decrease in succinate level.
Expression of the genes in RNA-sequence data was also inspected where succinyl CoA-
related genes exhibited a significant drop in the expression level in TTD-22 (Akpinar et
al., 2015).
On the other hand, most genes in this pathway exhibited more gradual, yet
significant, increased expression levels in TR39477 (Akpinar et al., 2015).
31
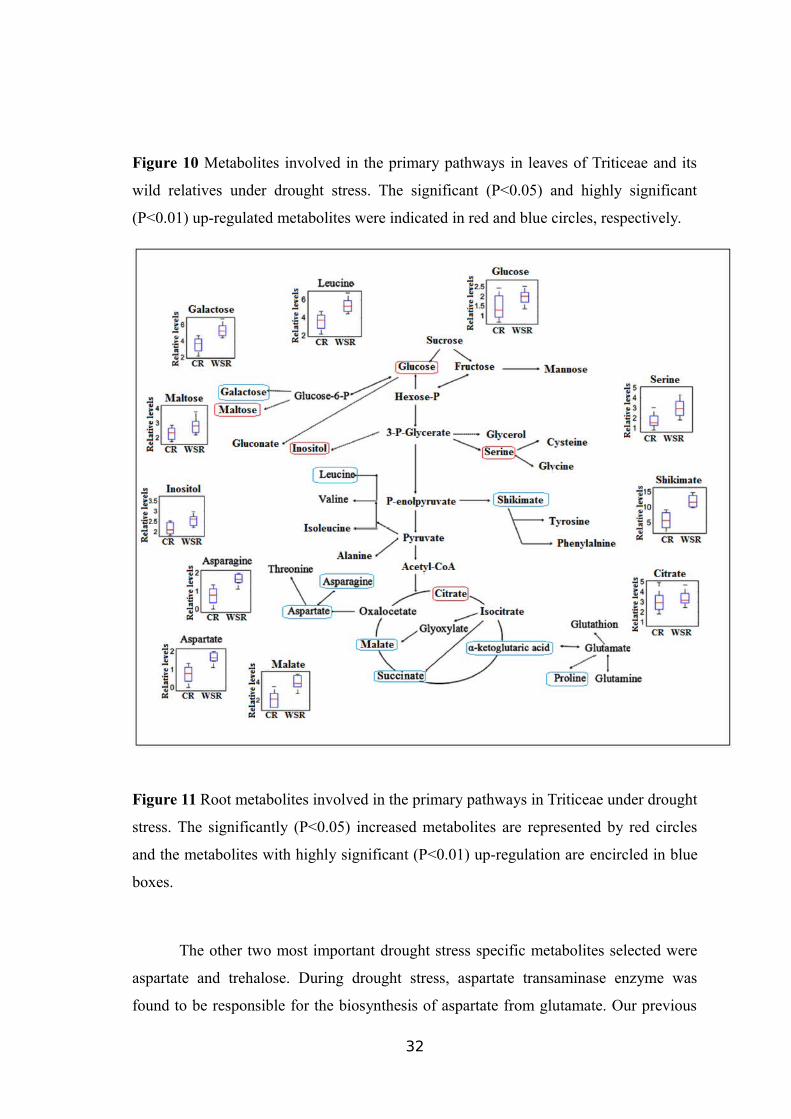
Figure 10 Metabolites involved in the primary pathways in leaves of Triticeae and its
wild relatives under drought stress. The significant (P<0.05) and highly significant
(P<0.01) up-regulated metabolites were indicated in red and blue circles, respectively.
Figure 11 Root metabolites involved in the primary pathways in Triticeae under drought
stress. The significantly (P<0.05) increased metabolites are represented by red circles
and the metabolites with highly significant (P<0.01) up-regulation are encircled in blue
boxes.
The other two most important drought stress specific metabolites selected were
aspartate and trehalose. During drought stress, aspartate transaminase enzyme was
found to be responsible for the biosynthesis of aspartate from glutamate. Our previous
32
studies indicates that aspartate transaminase belongs to a multi-gene family of which
different homologous chromosomes (1, 3 and 5) contain almost six copies of these
genes instead of each copy present on 3AS and 3DS (Budak et al., 2013a; Lucas et al.,
2011b; Akpinar et al., 2015).
A very simple biochemical pathway having three enzymatic steps control
accumulation of trehalose and uridine diphosphate glucose (UDP-glucose) and glucose-
6-phosphate acts as substrates for the conversion to trehalose through trehalose-6-
phosphate phosphatase (T6PP) activity and further, trehalose, an enzyme converts
trehalose molecules into two glucose molecules (Figure 14). An additional enzyme
involved in the biosynthesis of trehalose (not shown in the pathway) is trehalose-6-
phosphate synthase (T6PS).
The putative wheat genes encoding all enzymes involved in both biochemical
pathwayswere identified in the WGSS. For comparative purposes, the identification of
wheat cDNAs encoding aspartate transaminase, T6PP, T6PS and trehalase were
performed. Analysis of the draft wheat genome sequence revealed different copy
numbers of an above-mentioned enzyme related genes on the long and short arms of
different chromosomes of TR39477 and other drought stress tolerant genotypes.
Of the TTD-22 and Tosunbey that lacked the drought, stress-related sequences
showed the expected decrease in metabolite levels (Budak et al., 2013a; Lucas et al.,
2011b; Akpinar et al., 2015).
33
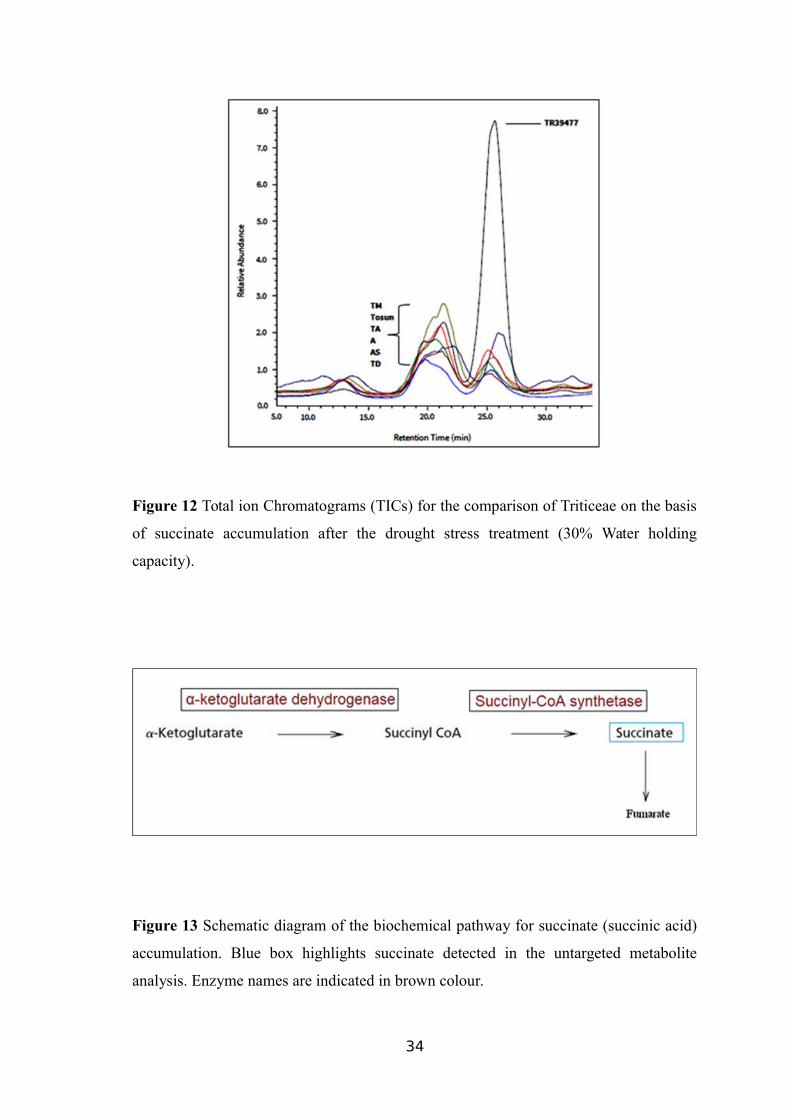
Figure 12 Total ion Chromatograms (TICs) for the comparison of Triticeae on the basis
of succinate accumulation after the drought stress treatment (30% Water holding
capacity).
Figure 13 Schematic diagram of the biochemical pathway for succinate (succinic acid)
accumulation. Blue box highlights succinate detected in the untargeted metabolite
analysis. Enzyme names are indicated in brown colour.
34
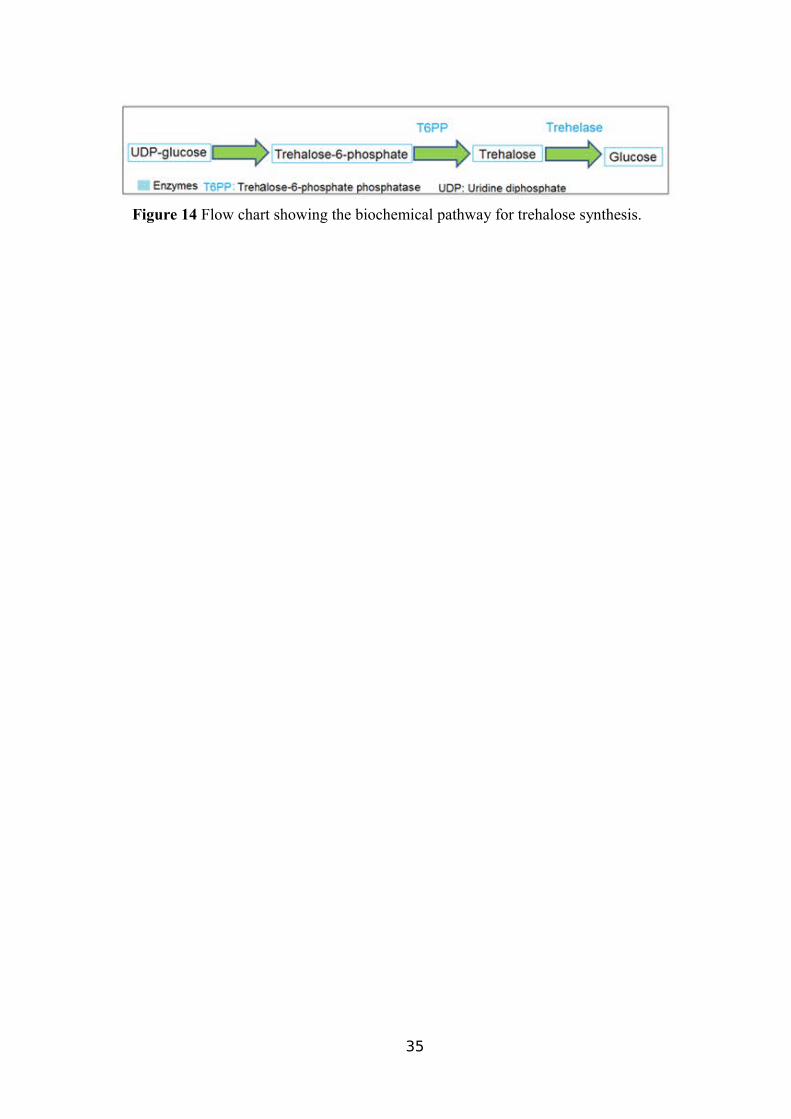
Figure 14 Flow chart showing the biochemical pathway for trehalose synthesis.
35
CHAPTER NO.5
5.1. Discussion
The development of drought stress-tolerant crops seems to be the only promising
solution to increase wheat crop yield under water-limited conditions, especially to fulfil
the food requirement for increasing animal and human population (Akpinar et al., 2012;
Budak et al., 2015a, 2015b, 2013b). We have investigated a spectrum of morphological
and metabolic responses from different Triticeae species grown under drought stress
condition and standard condition with a regular supply of water. Increased metabolic
levels of the selected metabolites were correlated with potential biochemical pathways,
enzymes or gene locations for a better evaluation of the experimental results.
Roots are the first site to come into contact with water deficiency and therefore
should be the place to trigger a response to the drought stress, yet there is no genetic
explanation for the adaptive response of root under drought stress. Few studies
documented the root response to the drought stress in different plant species .For
instance, Arabidopsis thaliana root hairs became short and swollen in response to the
water deficiency (Xiong et al., 2006; Schnall and Quatrano, 1992), whereas the presence
of very short and hairless root development under drought stress was also reported in
soil-grown A. thaliana (Vartanian et al., 1994). Other studies indicated the drought
stress response in roots of citrus plants (Zaher-Ara et al., 2016), Zea maize(Jiang et al.,
2012), and sunflower (Rauf and Sadaqat, 2007).
In this study, TR39477, IG132864, and Bolal represented significant tolerance to
the drought by elongating the root length deep into the soil in search of water while
keeping their surface area large and average diameter short to absorb and store water.
Among all genotypes, TR39477 (wild emmer) (Akpinar et al., 2015; Budak et al.,
2013a) had presented strong tolerance-associated morphological dynamics. Several
studies with different plants have also shown the inhibition of lateral roots after drought
stress for the purpose to go deeper to take water instead of spreading horizontally in the
36
soil (Xiong et al., 2006). The ability of plants to access water from depths through
vertical root growth has been found beneficial for crop productivity under water
deficiency (Comas et al., 2013).
Observation of the significantly altered metabolites accumulated upon drought
stress was monitored with a non-targeted metabolite profiling analysis in Triticeae
species using GC-MS technique. The most significant changes were observed in
metabolites in the form of amino acid, organic acid, and sugars, of which approximately
half increased statistically in TR39477, IG132864, and Bolal samples. TR39477,
IG132864, and Bolal were found to be more tolerant against severe drought stress (30%
WHC) by accumulating proline, trehalose, glycine and some other amino acids,
considered as drought stress-specific markers and osmoprotectants.
The increased accumulation of these metabolites was reported in other studies
conducted on different plant species in which these metabolites were found responsible
for drought stress tolerance and had an osmoprotective function (Sanchez et al., 2012;
Norouzi et al., 2008; Charlton et al., 2008; Rampino et al., 2006; Boyer et al., 2008;
Nanjo et al., 1999; Redillas et al., 2012; Guimarães et al., 2008; Witt et al., 2012).
Proline accumulation functions as an electron sink mechanism can reduce the amount of
singlet oxygen present, which causes lipid peroxidation of thylakoid membranes,
providing evidence that it is a significant contributor to cellular redox balance (Alia et
al., 1997; Szabados and Savouré, 2010; Sharma and Dietz, 2006).
The branch chain amino acids such leucine, valine, alanine also increased
significantly in TR39477, IG132864 and Bolal samples unlike to other genotypes under
drought stress exposure. The increased accumulation of these branch chain amino acids
was also reported in previous studies on Arabidopsis (Urano et al., 2009; Rizhsky et al.,
2004; Taylor et al., 2004; Malatrasi et al., 2006). Less and Galili (2008) reported that
catabolic enzymes of amino acids increase rapidly in response to drought stress and
have an important role in amino acid metabolism under drought stress conditions (Less
and Galili, 2008).
On the other side, sugar and its derivatives such as galactose, mannose, fructose,
mannitol and other non-reducing sugars and oligosaccharides provide a hydration shell
around proteins under drought stress (Hoekstra et al., 2001). The increase in the amount
of these sugars may provide an initial defensive state against further water loss.
37
Succinic acid or succinate is the basic, intermediate component of ATP pathway,
the citric acid cycle (Krebs cycle), which plays a vital role in energy production and
involve in the regulation of mitochondrial tricarboxylic acid cycle (TCA cycle)
(Cavalcanti et al., 2014). The overproduction of NADH under drought stress inhibits all
dehydrogenases (pyruvate dehydrogenase, isocitrate dehydrogenase, α-ketoglutarate
dehydrogenase and citrate synthase) except the succinate dehydrogenase in TCA cycle
which converts succinyl-CoA to succinate (Tretter and Adam-Vizi, 2005). By over
synthesis of succinate, mitochondria get more ATPs and store them for unfavourable
conditions (Oestreicher et al., 1973).
The elevated level of succinate found in wild emmer genotype, TR39477 which
is characterized by its high tolerance against drought stress (Kantar et al., 2011b; Ergen
and Budak, 2009; Akpinar et al., 2015; Budak et al., 2013a), might be related to the
efficient use of TCA cycle to produce more energy (ATPs) under water-limited
conditions.
Succinic acid (succinate), trehalose and aspartic acid (aspartate) were selected
for further genome analysis because of their potential involvement in biochemical
pathways linked to drought stress specific response (Jain, 2013; Golldack et al., 2014).
Our main focus for genomic analysis were drought stress tolerant genotypes, most
specifically TR39477 due to the higher elevation of succinate level.
The results of genome analyses demonstrated that droughts stress tolerant wheat
genotypes might be worthy of endorsing gene-to-metabolite networks. Therefore the
alteration in metabolic levels in sensitive and drought stress tolerant genotypes under
control and drought stress conditions can be attributed to gene suppression or
overexpression from the related chromosome arms. Of the wheat genotypes that lacked
the succinyl CoA-related sequences, TTD-22 and Tosunbey were among the wheat
genotypes which showed a decrease in the level of metabolites, suggest that succinyl-
CoA synthetase on 1AS, 5AL, 6BL, and 3DL might be a rate-limiting step in succinate
accumulation.
However, the near to absent succinate level did not show a similar effect in
Triticum aestivum ssp. aestivum (Tosunbey), Aegilops speltoides ssp. speltoids
(Ligustica) and Aegilops tauschii ssp. tauschii (Meyeri), indicating that succinyl-CoA
synthetase genes might be playing a different role rather succinate biosynthesis. A 3-
38
fold increase in the accumulation of succinate in wild emmer wheat (TR39477)
indicated that some unknown genes from primary biochemical pathways were
regulating the accumulation of succinate in wheat.
The metabolism of trehalose accumulation was controlled by post-translational
modification pathways and regulatory networks (Ramakrishna and Ravishankar, 2011).
Therefore, it is suggested that pathway-specific genes might be located on 1AL, 1BL
1DL, 3BL, 3DL, 5AS, 6AL, 6BL and 6DL which were involved in the up-regulation of
trehalose in TR39477. As discussed previously in the literature, the proteomic (Budak
et al., 2013a) and transcriptomic (Akpinar et al., 2015) analyses of these cultivars have
identified candidate genes for the genetic manipulation of wheat cultivars in order to
enhance drought stress tolerance, and the metabolite data further validate these results.
5.2. Conclusion
Drought stress affects the structure of plant cells and tissues. Hence a
comprehensive omics approaches (genomics, transcriptomics, proteomics, and
metabolomics) will enhance our understanding of the underlying mechanisms of water
deficiency in Triticeae, which will in turn help breeders to identify the responsive genes,
proteins, metabolites for drought stress tolerance. This study indicated that drought
stress treated leaves and roots of wheat and its wild genotypes have distinct mechanisms
of metabolite accumulation and regulation, which is valuable for the better
understanding of overall abiotic stress tolerance mechanisms.
Triticeae species with high crop yields under the drought stress are expected to
be developed in the future through the genetic transformation of novel genes identified
in large-scale studies including metabolomics research.
39
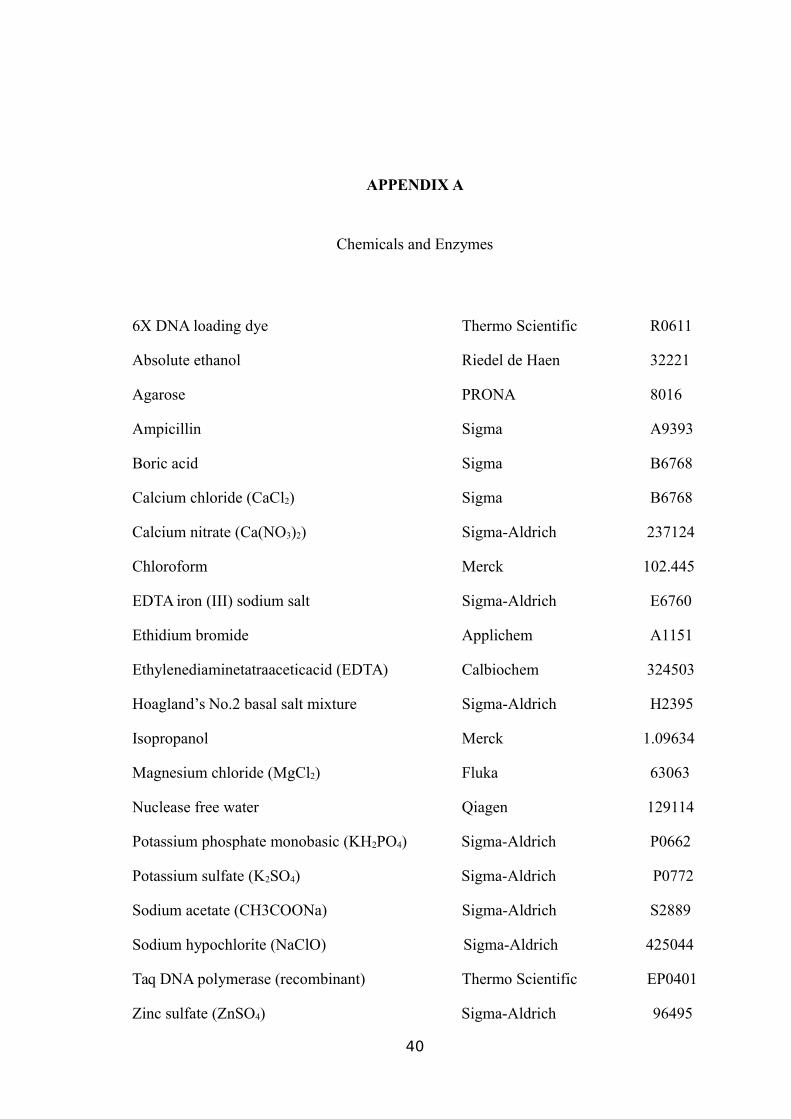
APPENDIX A
Chemicals and Enzymes
6X DNA loading dye Thermo Scientific R0611
Absolute ethanol Riedel de Haen 32221
Agarose PRONA 8016
Ampicillin Sigma A9393
Boric acid Sigma B6768
Calcium chloride (CaCl2) Sigma B6768
Calcium nitrate (Ca(NO3)2) Sigma-Aldrich 237124
Chloroform Merck 102.445
EDTA iron (III) sodium salt Sigma-Aldrich E6760
Ethidium bromide Applichem A1151
Ethylenediaminetatraaceticacid (EDTA) Calbiochem 324503
Hoagland’s No.2 basal salt mixture Sigma-Aldrich H2395
Isopropanol Merck 1.09634
Magnesium chloride (MgCl2) Fluka 63063
Nuclease free water Qiagen 129114
Potassium phosphate monobasic (KH2PO4) Sigma-Aldrich P0662
Potassium sulfate (K2SO4) Sigma-Aldrich P0772
Sodium acetate (CH3COONa) Sigma-Aldrich S2889
Sodium hypochlorite (NaClO) Sigma-Aldrich 425044
Taq DNA polymerase (recombinant) Thermo Scientific EP0401
Zinc sulfate (ZnSO4) Sigma-Aldrich 96495
40

APPENDIX B
Equipments
Autoclave: Hirayama, Hiclave HV-110, JAPAN
Nüve 0T 032, TÜRKİYE
Balance: Sartorius, BP221S, GERMANY
Schimadzu, Libror EB-3 200 HU, JAPAN
Camera Olympus C-7070, JAPAN
Centrifuge: Microfuge 18 Centrifuge Beckman Coulter, USA
Kendro Lab. Prod., Heraeus Multifuge 3S-R, GERMANY
Kendro Lab. Prod., Sorvall RC5C Plus, USA
Eppendorf, 5415D, GERMANY
Eppendorf, 5415R, GERMANY
Deepfreeze: -20 oC Bosch, TURKEY
-80 oC Thermo electron corporation, USA
Distilled Water: Millipore, Elix-S, FRANCE
Millipore, MilliQ Academic, FRANCE
Electrophoresis: Labnet Gel XL Ultra V-2, USA
Biogen Inc., USA
Biorad Inc., USA
Fiter papers: Whatman General Purpose Filtration Paper WHASE1141,
Sigma, MO, USA
Gel Documentation: Biorad Universal Hood II F1-F2 Fuses Type T2A, USA
Biorad, UV-Transilluminator 2000, USA
Glassine crossing bags: Focus Packaging & Design Ltd, North Lincolnshire, UK
Growth chamber: Digitech DG12, Ankara, TURKEY
Heating block: HDV Life Sciences, AUSTRIA
Thermostat Bio TDB-100, LATVIA
Hydroponic tanks: GroWell, UK
41
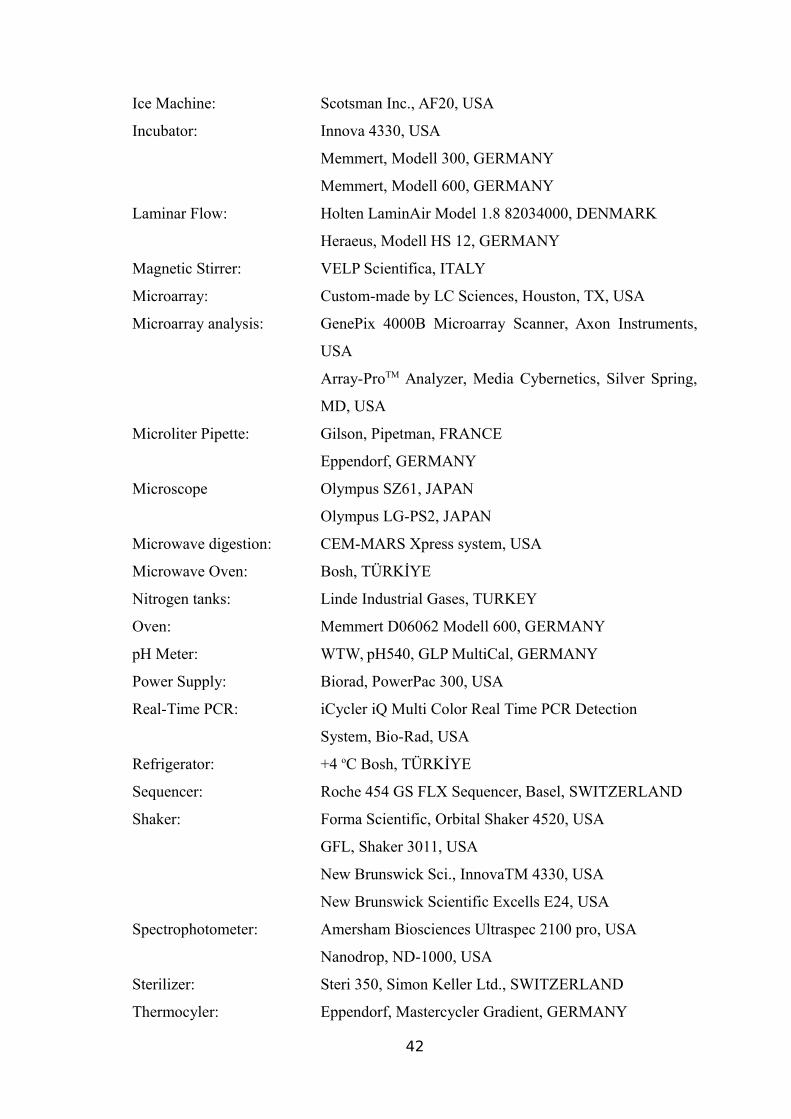
Ice Machine: Scotsman Inc., AF20, USA
Incubator: Innova 4330, USA
Memmert, Modell 300, GERMANY
Memmert, Modell 600, GERMANY
Laminar Flow: Holten LaminAir Model 1.8 82034000, DENMARK
Heraeus, Modell HS 12, GERMANY
Magnetic Stirrer: VELP Scientifica, ITALY
Microarray: Custom-made by LC Sciences, Houston, TX, USA
Microarray analysis: GenePix 4000B Microarray Scanner, Axon Instruments,
USA
Array-ProTM Analyzer, Media Cybernetics, Silver Spring,
MD, USA
Microliter Pipette: Gilson, Pipetman, FRANCE
Eppendorf, GERMANY
Microscope Olympus SZ61, JAPAN
Olympus LG-PS2, JAPAN
Microwave digestion: CEM-MARS Xpress system, USA
Microwave Oven: Bosh, TÜRKİYE
Nitrogen tanks: Linde Industrial Gases, TURKEY
Oven: Memmert D06062 Modell 600, GERMANY
pH Meter: WTW, pH540, GLP MultiCal, GERMANY
Power Supply: Biorad, PowerPac 300, USA
Real-Time PCR: iCycler iQ Multi Color Real Time PCR Detection
System, Bio-Rad, USA
Refrigerator: +4 oC Bosh, TÜRKİYE
Sequencer: Roche 454 GS FLX Sequencer, Basel, SWITZERLAND
Shaker: Forma Scientific, Orbital Shaker 4520, USA
GFL, Shaker 3011, USA
New Brunswick Sci., InnovaTM 4330, USA
New Brunswick Scientific Excells E24, USA
Spectrophotometer: Amersham Biosciences Ultraspec 2100 pro, USA
Nanodrop, ND-1000, USA
Sterilizer: Steri 350, Simon Keller Ltd., SWITZERLAND
Thermocyler: Eppendorf, Mastercycler Gradient, GERMANY
42
Biorad Gradient Cycler DNA Engine, USA
Tissue Lyser: Qiagen Retsch, USA
Vacuum: Heto, MasterJet Sue 300Q, DENMARK
Vortex Mixer: VELP Scientifica 2X3, ITALY
43
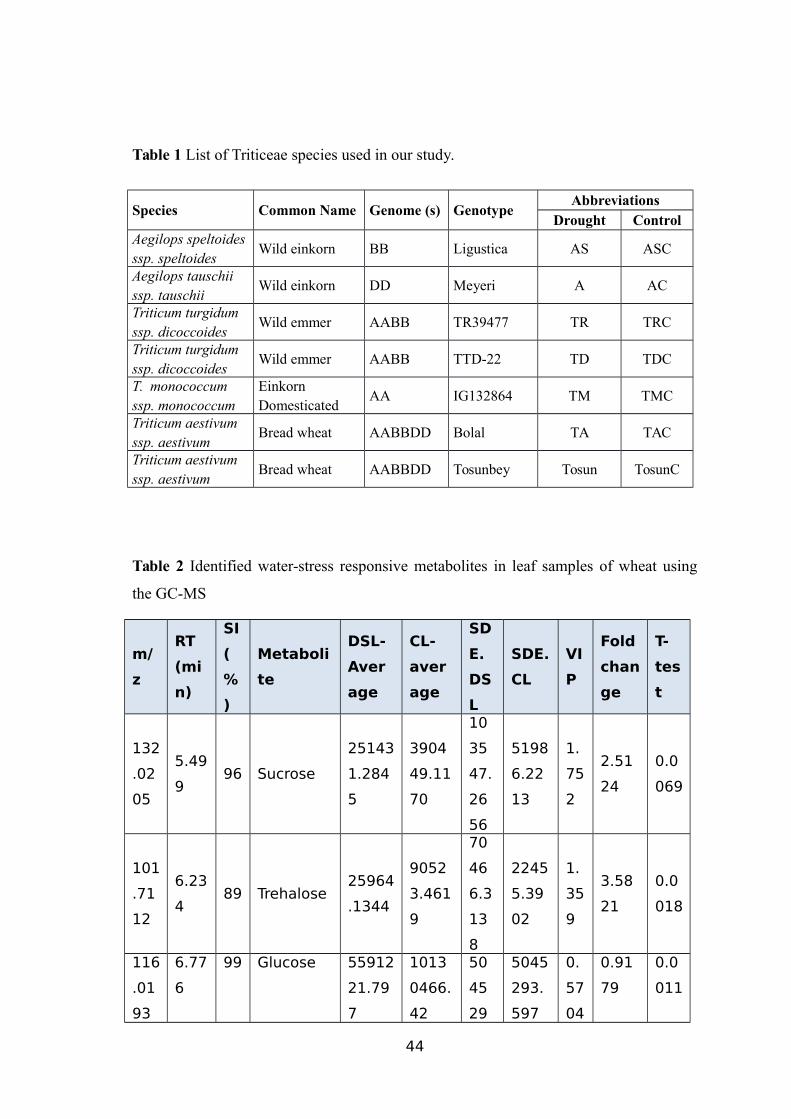
Table 1 List of Triticeae species used in our study.
Table 2 Identified water-stress responsive metabolites in leaf samples of wheat using
the GC-MS
m/
z
RT
(mi
n)
SI
(
%
)
Metaboli
te
DSL-
Aver
age
CL-
aver
age
SD
E.
DS
L
SDE.
CL
VI
P
Fold
chan
ge
T-
tes
t
132
.02
05
5.49
996 Sucrose
25143
1.284
5
3904
49.11
70
10
35
47.
26
56
5198
6.22
13
1.
75
2
2.51
24
0.0
069
101
.71
12
6.23
489 Trehalose
25964
.1344
9052
3.461
9
70
46
6.3
13
8
2245
5.39
02
1.
35
9
3.58
21
0.0
018
116
.01
93
6.77
6
99 Glucose 55912
21.79
7
1013
0466.
42
50
45
29
5045
293.
597
0.
57
04
0.91
79
0.0
011
44
Species Common Name Genome (s) GenotypeAbbreviations
Drought ControlAegilops speltoidesssp. speltoides
Wild einkorn BB Ligustica AS ASC
Aegilops tauschii ssp. tauschii
Wild einkorn DD Meyeri A AC
Triticum turgidum ssp. dicoccoides
Wild emmer AABB TR39477 TR TRC
Triticum turgidum ssp. dicoccoides
Wild emmer AABB TTD-22 TD TDC
T. monococcum ssp. monococcum
EinkornDomesticated
AA IG132864 TM TMC
Triticum aestivum ssp. aestivum
Bread wheat AABBDD Bolal TA TAC
Triticum aestivum ssp. aestivum
Bread wheat AABBDD Tosunbey Tosun TosunC
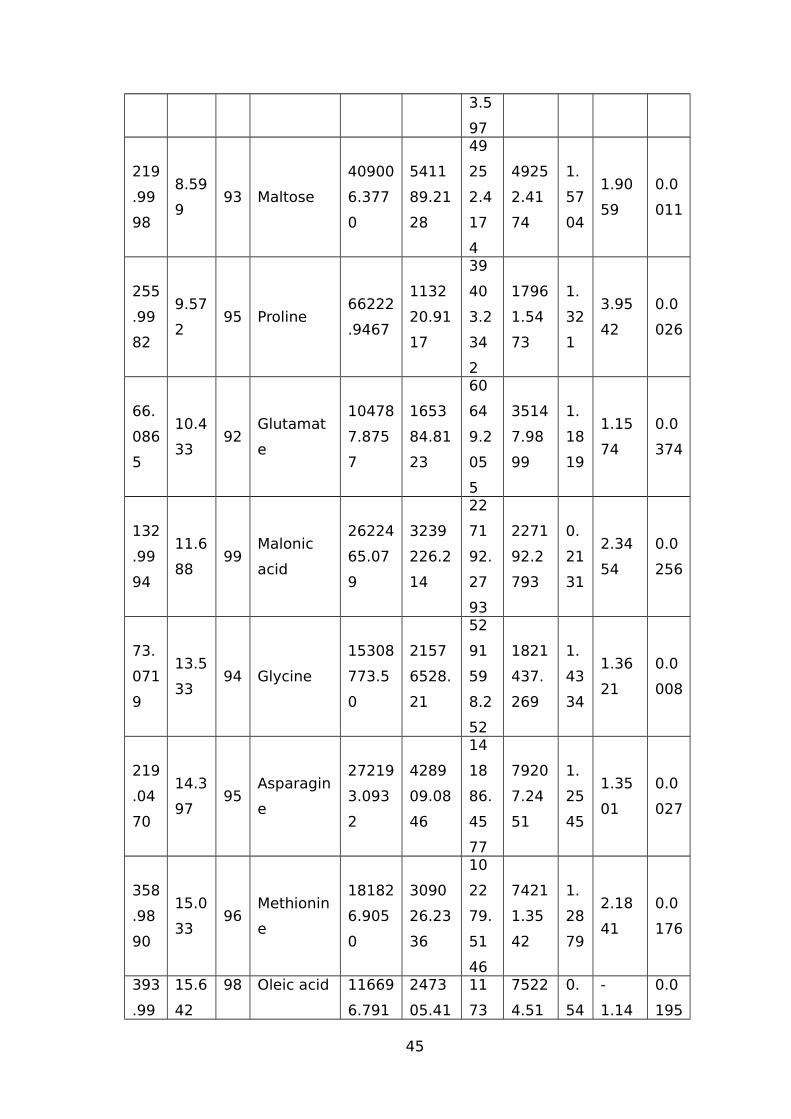
3.5
97
219
.99
98
8.59
993 Maltose
40900
6.377
0
5411
89.21
28
49
25
2.4
17
4
4925
2.41
74
1.
57
04
1.90
59
0.0
011
255
.99
82
9.57
295 Proline
66222
.9467
1132
20.91
17
39
40
3.2
34
2
1796
1.54
73
1.
32
1
3.95
42
0.0
026
66.
086
5
10.4
3392
Glutamat
e
10478
7.875
7
1653
84.81
23
60
64
9.2
05
5
3514
7.98
99
1.
18
19
1.15
74
0.0
374
132
.99
94
11.6
8899
Malonic
acid
26224
65.07
9
3239
226.2
14
22
71
92.
27
93
2271
92.2
793
0.
21
31
2.34
54
0.0
256
73.
071
9
13.5
3394 Glycine
15308
773.5
0
2157
6528.
21
52
91
59
8.2
52
1821
437.
269
1.
43
34
1.36
21
0.0
008
219
.04
70
14.3
9795
Asparagin
e
27219
3.093
2
4289
09.08
46
14
18
86.
45
77
7920
7.24
51
1.
25
45
1.35
01
0.0
027
358
.98
90
15.0
3396
Methionin
e
18182
6.905
0
3090
26.23
36
10
22
79.
51
46
7421
1.35
42
1.
28
79
2.18
41
0.0
176
393
.99
15.6
42
98 Oleic acid 11669
6.791
2473
05.41
11
73
7522
4.51
0.
54
-
1.14
0.0
195
45
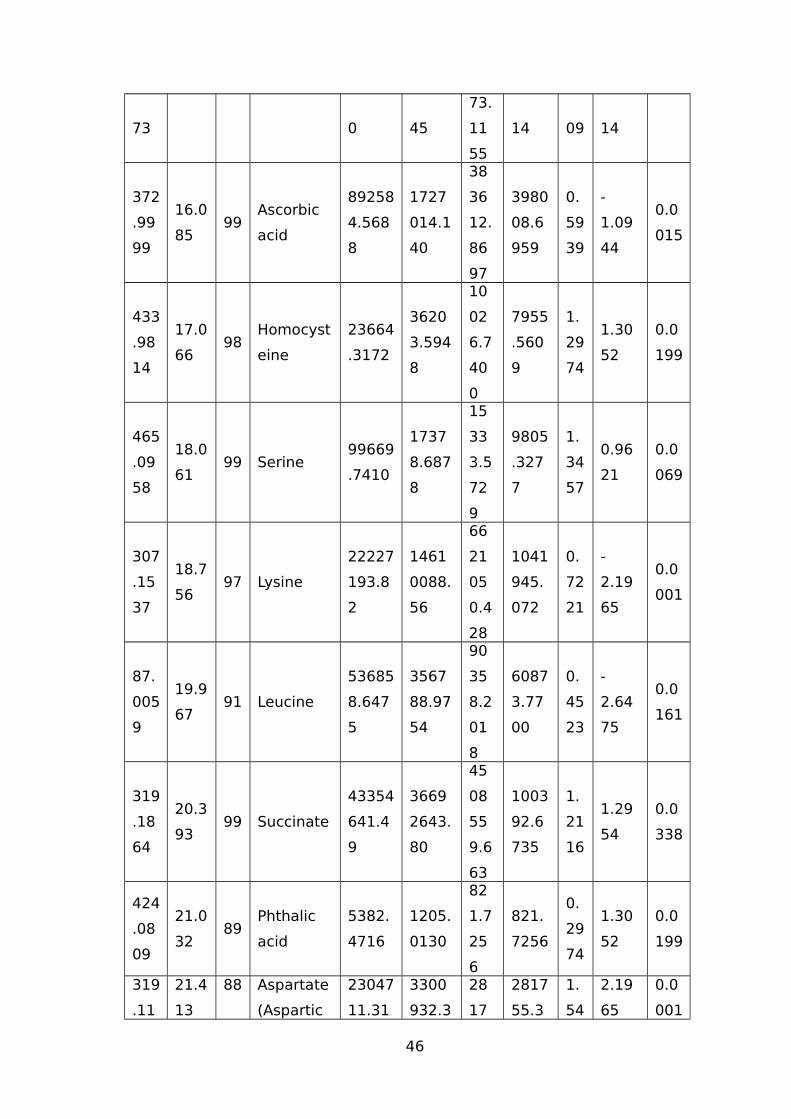
73 0 45
73.
11
55
14 09 14
372
.99
99
16.0
8599
Ascorbic
acid
89258
4.568
8
1727
014.1
40
38
36
12.
86
97
3980
08.6
959
0.
59
39
-
1.09
44
0.0
015
433
.98
14
17.0
6698
Homocyst
eine
23664
.3172
3620
3.594
8
10
02
6.7
40
0
7955
.560
9
1.
29
74
1.30
52
0.0
199
465
.09
58
18.0
6199 Serine
99669
.7410
1737
8.687
8
15
33
3.5
72
9
9805
.327
7
1.
34
57
0.96
21
0.0
069
307
.15
37
18.7
5697 Lysine
22227
193.8
2
1461
0088.
56
66
21
05
0.4
28
1041
945.
072
0.
72
21
-
2.19
65
0.0
001
87.
005
9
19.9
6791 Leucine
53685
8.647
5
3567
88.97
54
90
35
8.2
01
8
6087
3.77
00
0.
45
23
-
2.64
75
0.0
161
319
.18
64
20.3
9399 Succinate
43354
641.4
9
3669
2643.
80
45
08
55
9.6
63
1003
92.6
735
1.
21
16
1.29
54
0.0
338
424
.08
09
21.0
3289
Phthalic
acid
5382.
4716
1205.
0130
82
1.7
25
6
821.
7256
0.
29
74
1.30
52
0.0
199
319
.11
21.4
13
88 Aspartate
(Aspartic
23047
11.31
3300
932.3
28
17
2817
55.3
1.
54
2.19
65
0.0
001
46
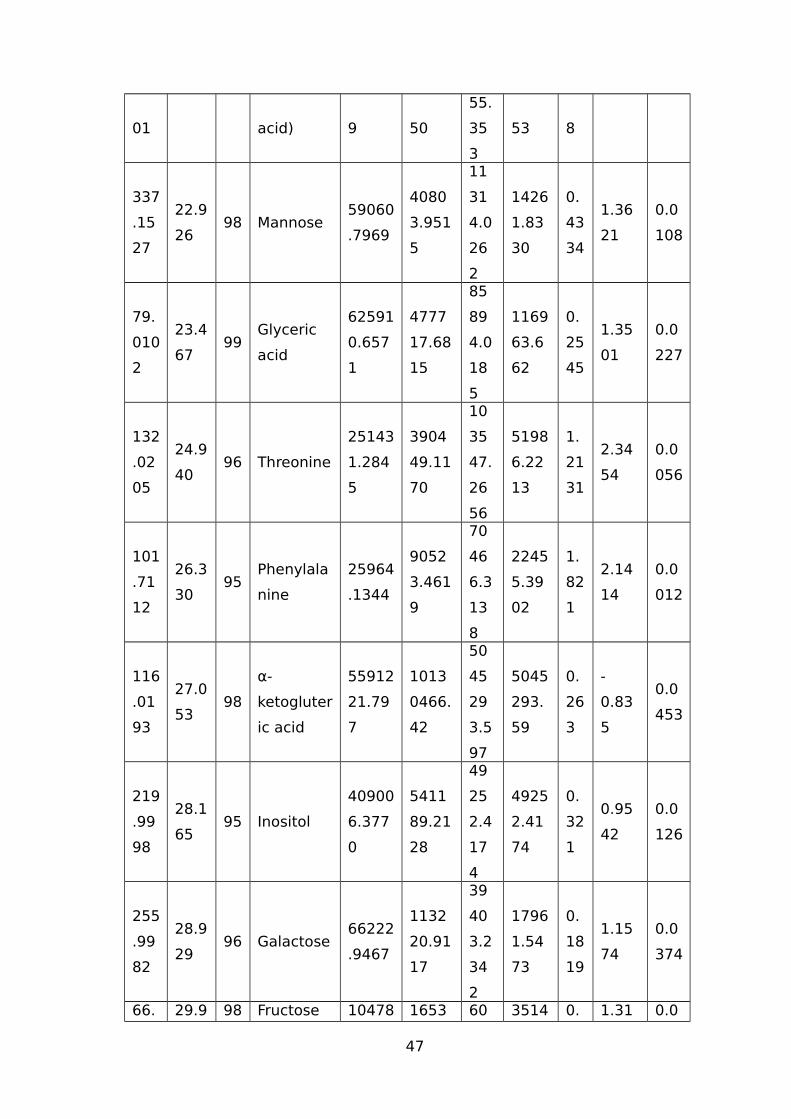
01 acid) 9 50
55.
35
3
53 8
337
.15
27
22.9
2698 Mannose
59060
.7969
4080
3.951
5
11
31
4.0
26
2
1426
1.83
30
0.
43
34
1.36
21
0.0
108
79.
010
2
23.4
6799
Glyceric
acid
62591
0.657
1
4777
17.68
15
85
89
4.0
18
5
1169
63.6
62
0.
25
45
1.35
01
0.0
227
132
.02
05
24.9
4096 Threonine
25143
1.284
5
3904
49.11
70
10
35
47.
26
56
5198
6.22
13
1.
21
31
2.34
54
0.0
056
101
.71
12
26.3
3095
Phenylala
nine
25964
.1344
9052
3.461
9
70
46
6.3
13
8
2245
5.39
02
1.
82
1
2.14
14
0.0
012
116
.01
93
27.0
5398
α-
ketogluter
ic acid
55912
21.79
7
1013
0466.
42
50
45
29
3.5
97
5045
293.
59
0.
26
3
-
0.83
5
0.0
453
219
.99
98
28.1
6595 Inositol
40900
6.377
0
5411
89.21
28
49
25
2.4
17
4
4925
2.41
74
0.
32
1
0.95
42
0.0
126
255
.99
82
28.9
2996 Galactose
66222
.9467
1132
20.91
17
39
40
3.2
34
2
1796
1.54
73
0.
18
19
1.15
74
0.0
374
66. 29.9 98 Fructose 10478 1653 60 3514 0. 1.31 0.0
47
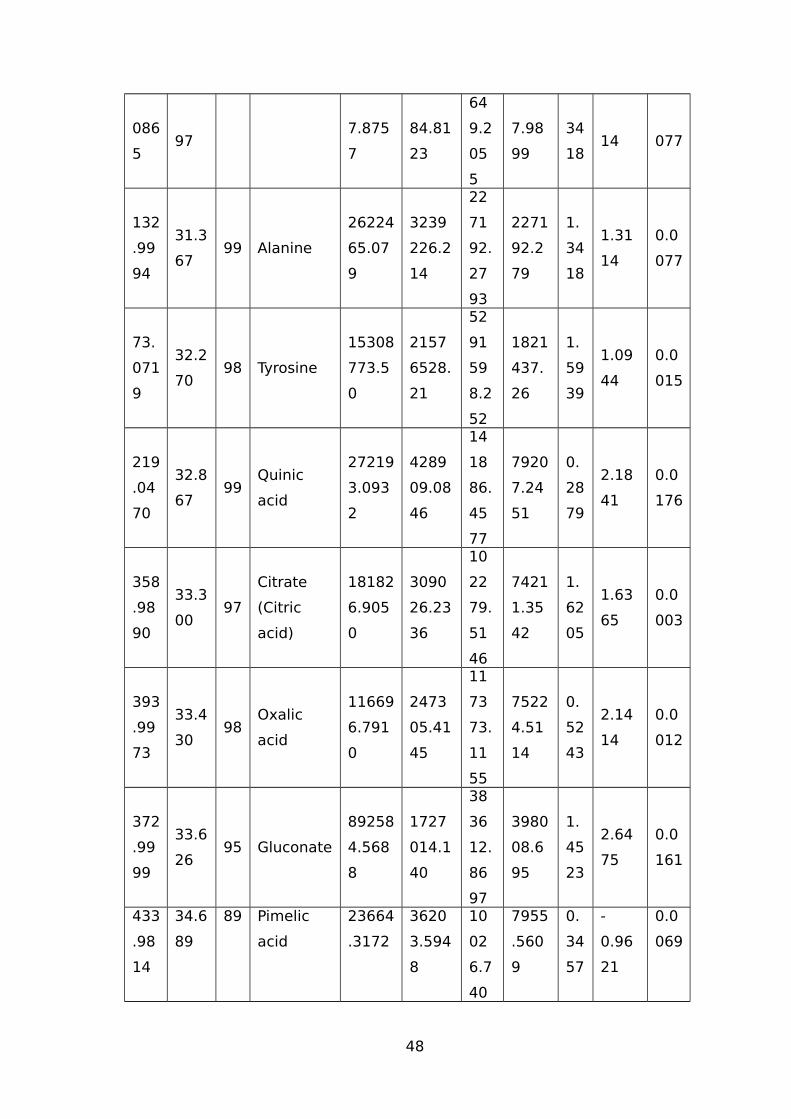
086
597
7.875
7
84.81
23
64
9.2
05
5
7.98
99
34
1814 077
132
.99
94
31.3
6799 Alanine
26224
65.07
9
3239
226.2
14
22
71
92.
27
93
2271
92.2
79
1.
34
18
1.31
14
0.0
077
73.
071
9
32.2
7098 Tyrosine
15308
773.5
0
2157
6528.
21
52
91
59
8.2
52
1821
437.
26
1.
59
39
1.09
44
0.0
015
219
.04
70
32.8
6799
Quinic
acid
27219
3.093
2
4289
09.08
46
14
18
86.
45
77
7920
7.24
51
0.
28
79
2.18
41
0.0
176
358
.98
90
33.3
0097
Citrate
(Citric
acid)
18182
6.905
0
3090
26.23
36
10
22
79.
51
46
7421
1.35
42
1.
62
05
1.63
65
0.0
003
393
.99
73
33.4
3098
Oxalic
acid
11669
6.791
0
2473
05.41
45
11
73
73.
11
55
7522
4.51
14
0.
52
43
2.14
14
0.0
012
372
.99
99
33.6
2695 Gluconate
89258
4.568
8
1727
014.1
40
38
36
12.
86
97
3980
08.6
95
1.
45
23
2.64
75
0.0
161
433
.98
14
34.6
89
89 Pimelic
acid
23664
.3172
3620
3.594
8
10
02
6.7
40
7955
.560
9
0.
34
57
-
0.96
21
0.0
069
48
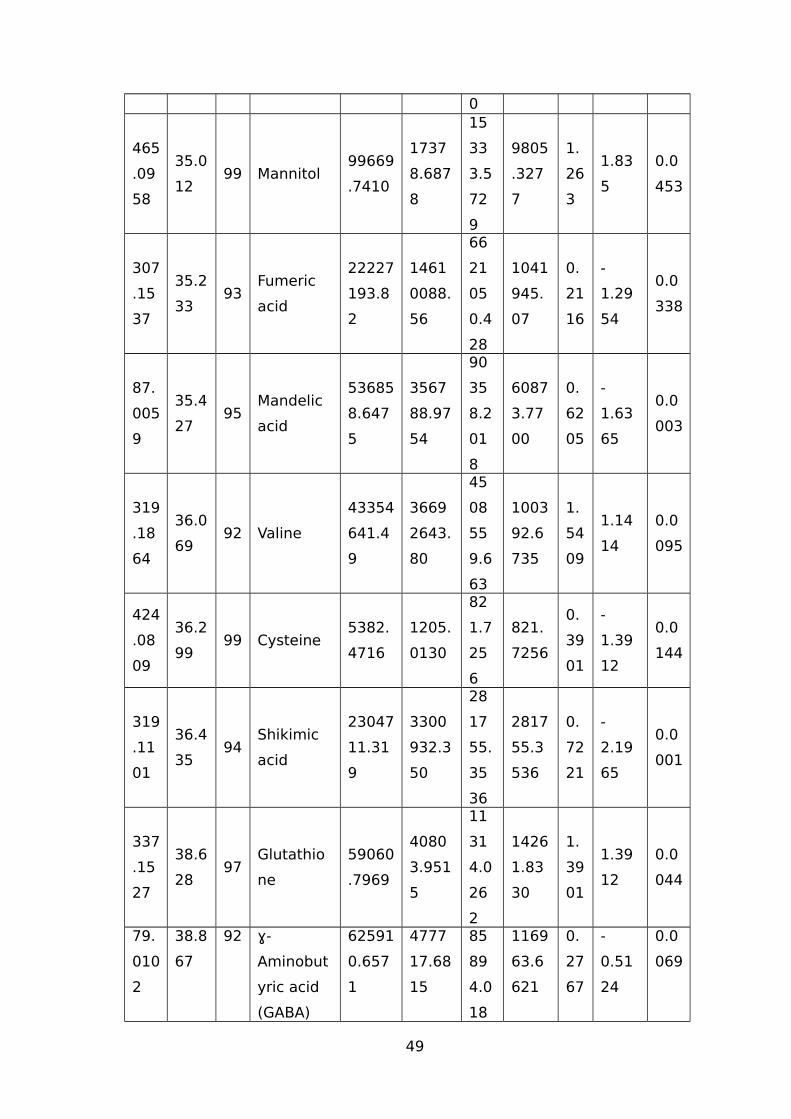
0
465
.09
58
35.0
1299 Mannitol
99669
.7410
1737
8.687
8
15
33
3.5
72
9
9805
.327
7
1.
26
3
1.83
5
0.0
453
307
.15
37
35.2
3393
Fumeric
acid
22227
193.8
2
1461
0088.
56
66
21
05
0.4
28
1041
945.
07
0.
21
16
-
1.29
54
0.0
338
87.
005
9
35.4
2795
Mandelic
acid
53685
8.647
5
3567
88.97
54
90
35
8.2
01
8
6087
3.77
00
0.
62
05
-
1.63
65
0.0
003
319
.18
64
36.0
6992 Valine
43354
641.4
9
3669
2643.
80
45
08
55
9.6
63
1003
92.6
735
1.
54
09
1.14
14
0.0
095
424
.08
09
36.2
9999 Cysteine
5382.
4716
1205.
0130
82
1.7
25
6
821.
7256
0.
39
01
-
1.39
12
0.0
144
319
.11
01
36.4
3594
Shikimic
acid
23047
11.31
9
3300
932.3
50
28
17
55.
35
36
2817
55.3
536
0.
72
21
-
2.19
65
0.0
001
337
.15
27
38.6
2897
Glutathio
ne
59060
.7969
4080
3.951
5
11
31
4.0
26
2
1426
1.83
30
1.
39
01
1.39
12
0.0
044
79.
010
2
38.8
67
92 ɣ-
Aminobut
yric acid
(GABA)
62591
0.657
1
4777
17.68
15
85
89
4.0
18
1169
63.6
621
0.
27
67
-
0.51
24
0.0
069
49
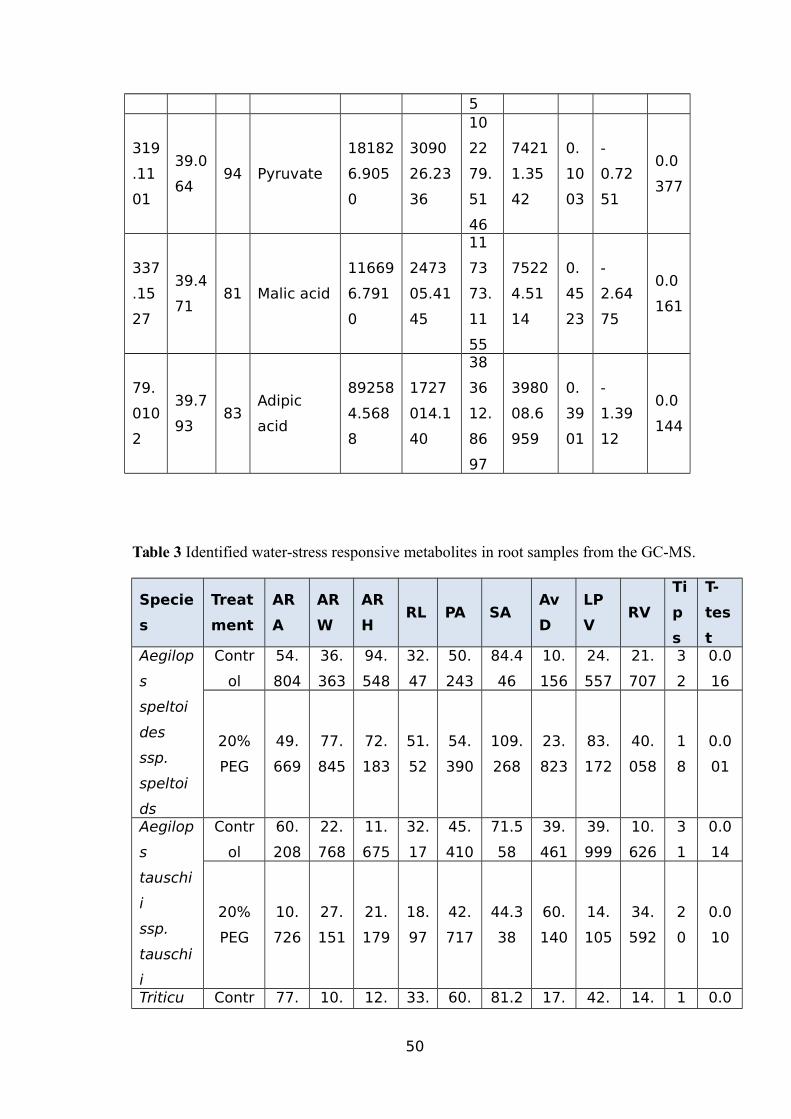
5
319
.11
01
39.0
6494 Pyruvate
18182
6.905
0
3090
26.23
36
10
22
79.
51
46
7421
1.35
42
0.
10
03
-
0.72
51
0.0
377
337
.15
27
39.4
7181 Malic acid
11669
6.791
0
2473
05.41
45
11
73
73.
11
55
7522
4.51
14
0.
45
23
-
2.64
75
0.0
161
79.
010
2
39.7
9383
Adipic
acid
89258
4.568
8
1727
014.1
40
38
36
12.
86
97
3980
08.6
959
0.
39
01
-
1.39
12
0.0
144
Table 3 Identified water-stress responsive metabolites in root samples from the GC-MS.
Specie
s
Treat
ment
AR
A
AR
W
AR
HRL PA SA
Av
D
LP
VRV
Ti
p
s
T-
tes
tAegilop
s
speltoi
des
ssp.
speltoi
ds
Contr
ol
54.
804
36.
363
94.
548
32.
47
50.
243
84.4
46
10.
156
24.
557
21.
707
3
2
0.0
16
20%
PEG
49.
669
77.
845
72.
183
51.
52
54.
390
109.
268
23.
823
83.
172
40.
058
1
8
0.0
01
Aegilop
s
tauschi
i
ssp.
tauschi
i
Contr
ol
60.
208
22.
768
11.
675
32.
17
45.
410
71.5
58
39.
461
39.
999
10.
626
3
1
0.0
14
20%
PEG
10.
726
27.
151
21.
179
18.
97
42.
717
44.3
38
60.
140
14.
105
34.
592
2
0
0.0
10
Triticu Contr 77. 10. 12. 33. 60. 81.2 17. 42. 14. 1 0.0
50
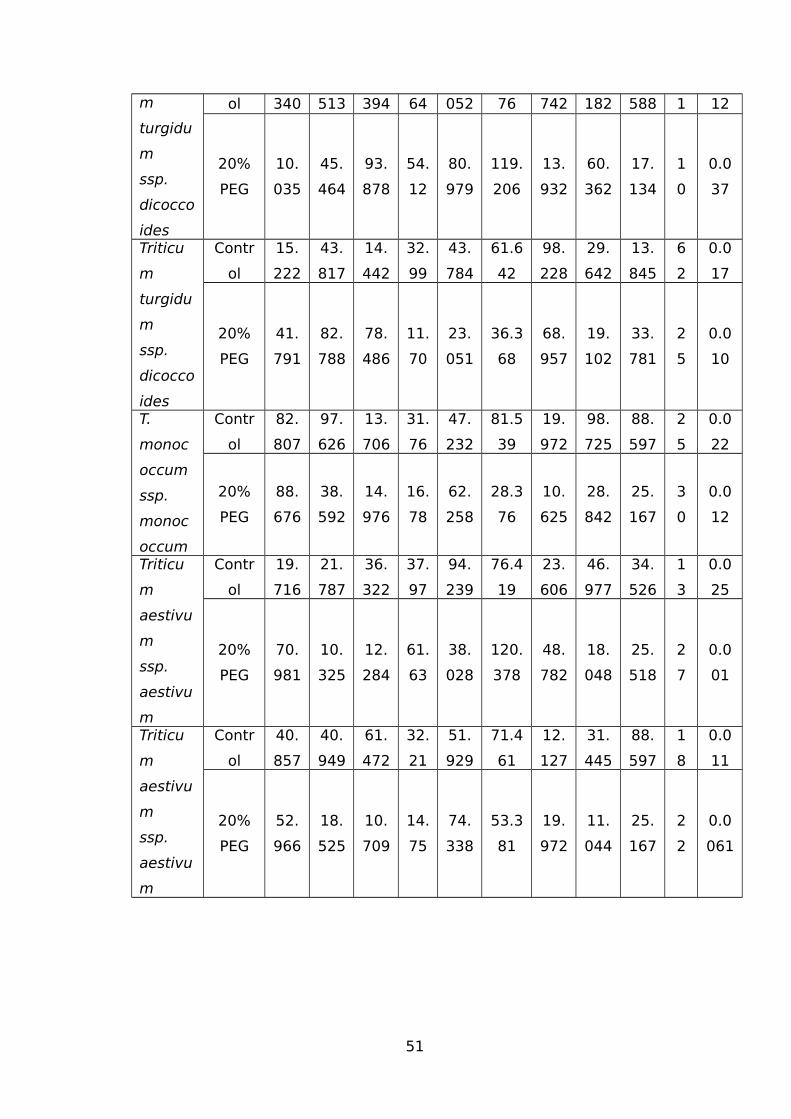
m
turgidu
m
ssp.
dicocco
ides
ol 340 513 394 64 052 76 742 182 588 1 12
20%
PEG
10.
035
45.
464
93.
878
54.
12
80.
979
119.
206
13.
932
60.
362
17.
134
1
0
0.0
37
Triticu
m
turgidu
m
ssp.
dicocco
ides
Contr
ol
15.
222
43.
817
14.
442
32.
99
43.
784
61.6
42
98.
228
29.
642
13.
845
6
2
0.0
17
20%
PEG
41.
791
82.
788
78.
486
11.
70
23.
051
36.3
68
68.
957
19.
102
33.
781
2
5
0.0
10
T.
monoc
occum
ssp.
monoc
occum
Contr
ol
82.
807
97.
626
13.
706
31.
76
47.
232
81.5
39
19.
972
98.
725
88.
597
2
5
0.0
22
20%
PEG
88.
676
38.
592
14.
976
16.
78
62.
258
28.3
76
10.
625
28.
842
25.
167
3
0
0.0
12
Triticu
m
aestivu
m
ssp.
aestivu
m
Contr
ol
19.
716
21.
787
36.
322
37.
97
94.
239
76.4
19
23.
606
46.
977
34.
526
1
3
0.0
25
20%
PEG
70.
981
10.
325
12.
284
61.
63
38.
028
120.
378
48.
782
18.
048
25.
518
2
7
0.0
01
Triticu
m
aestivu
m
ssp.
aestivu
m
Contr
ol
40.
857
40.
949
61.
472
32.
21
51.
929
71.4
61
12.
127
31.
445
88.
597
1
8
0.0
11
20%
PEG
52.
966
18.
525
10.
709
14.
75
74.
338
53.3
81
19.
972
11.
044
25.
167
2
2
0.0
061
51
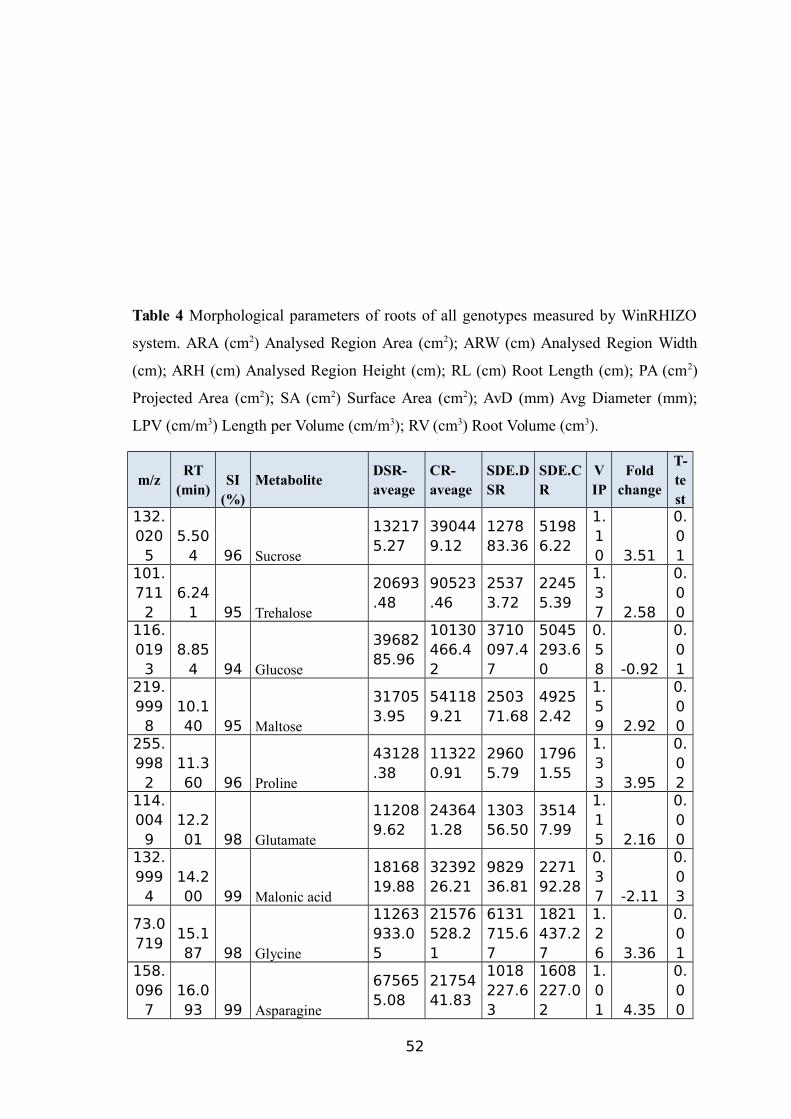
Table 4 Morphological parameters of roots of all genotypes measured by WinRHIZO
system. ARA (cm2) Analysed Region Area (cm2); ARW (cm) Analysed Region Width
(cm); ARH (cm) Analysed Region Height (cm); RL (cm) Root Length (cm); PA (cm2)
Projected Area (cm2); SA (cm2) Surface Area (cm2); AvD (mm) Avg Diameter (mm);
LPV (cm/m3) Length per Volume (cm/m3); RV (cm3) Root Volume (cm3).
m/zRT
(min)SI
(%)Metabolite
DSR-aveage
CR-aveage
SDE.DSR
SDE.CR
VIP
Foldchange
T-test
132.020
55.50
4 96 Sucrose
132175.27
390449.12
127883.36
51986.22
1.10 3.51
0.01
101.711
26.24
1 95 Trehalose
20693.48
90523.46
25373.72
22455.39
1.37 2.58
0.00
116.019
38.85
4 94 Glucose
3968285.96
10130466.42
3710097.47
5045293.60
0.58 -0.92
0.01
219.999
810.140 95 Maltose
317053.95
541189.21
250371.68
49252.42
1.59 2.92
0.00
255.998
211.360 96 Proline
43128.38
113220.91
29605.79
17961.55
1.33 3.95
0.02
114.004
912.201 98 Glutamate
112089.62
243641.28
130356.50
35147.99
1.15 2.16
0.00
132.999
414.200 99 Malonic acid
1816819.88
3239226.21
982936.81
227192.28
0.37 -2.11
0.03
73.0719
15.187 98 Glycine
11263933.05
21576528.21
6131715.67
1821437.27
1.26 3.36
0.01
158.096
716.093 99 Asparagine
675655.08
2175441.83
1018227.63
1608227.02
1.01 4.35
0.00
52
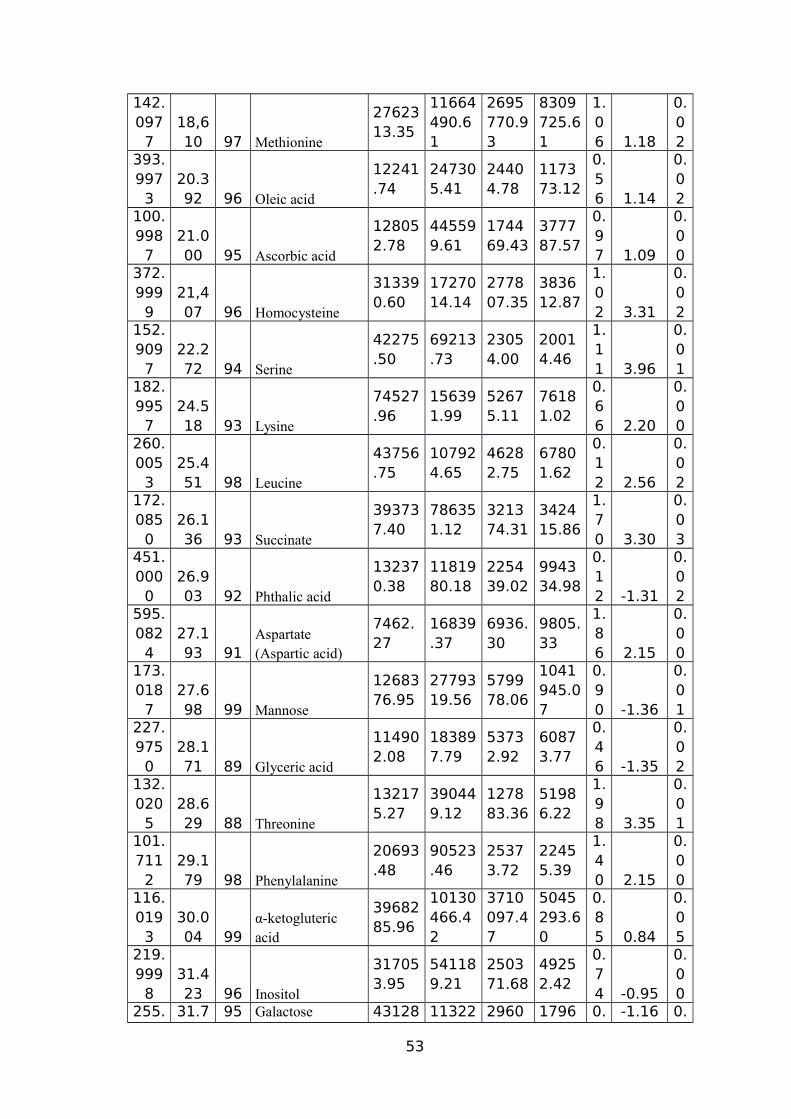
142.097
718,610 97 Methionine
2762313.35
11664490.61
2695770.93
8309725.61
1.06 1.18
0.02
393.997
320.392 96 Oleic acid
12241.74
247305.41
24404.78
117373.12
0.56 1.14
0.02
100.998
721.000 95 Ascorbic acid
128052.78
445599.61
174469.43
377787.57
0.97 1.09
0.00
372.999
921,407 96 Homocysteine
313390.60
1727014.14
277807.35
383612.87
1.02 3.31
0.02
152.909
722.272 94 Serine
42275.50
69213.73
23054.00
20014.46
1.11 3.96
0.01
182.995
724.518 93 Lysine
74527.96
156391.99
52675.11
76181.02
0.66 2.20
0.00
260.005
325.451 98 Leucine
43756.75
107924.65
46282.75
67801.62
0.12 2.56
0.02
172.085
026.136 93 Succinate
393737.40
786351.12
321374.31
342415.86
1.70 3.30
0.03
451.000
026.903 92 Phthalic acid
132370.38
1181980.18
225439.02
994334.98
0.12 -1.31
0.02
595.082
427.193 91
Aspartate (Aspartic acid)
7462.27
16839.37
6936.30
9805.33
1.86 2.15
0.00
173.018
727.698 99 Mannose
1268376.95
2779319.56
579978.06
1041945.07
0.90 -1.36
0.01
227.975
028.171 89 Glyceric acid
114902.08
183897.79
53732.92
60873.77
0.46 -1.35
0.02
132.020
528.629 88 Threonine
132175.27
390449.12
127883.36
51986.22
1.98 3.35
0.01
101.711
229.179 98 Phenylalanine
20693.48
90523.46
25373.72
22455.39
1.40 2.15
0.00
116.019
330.004 99
α-ketogluteric acid
3968285.96
10130466.42
3710097.47
5045293.60
0.85 0.84
0.05
219.999
831.423 96 Inositol
317053.95
541189.21
250371.68
49252.42
0.74 -0.95
0.00
255. 31.7 95 Galactose 43128 11322 2960 1796 0. -1.16 0.
53
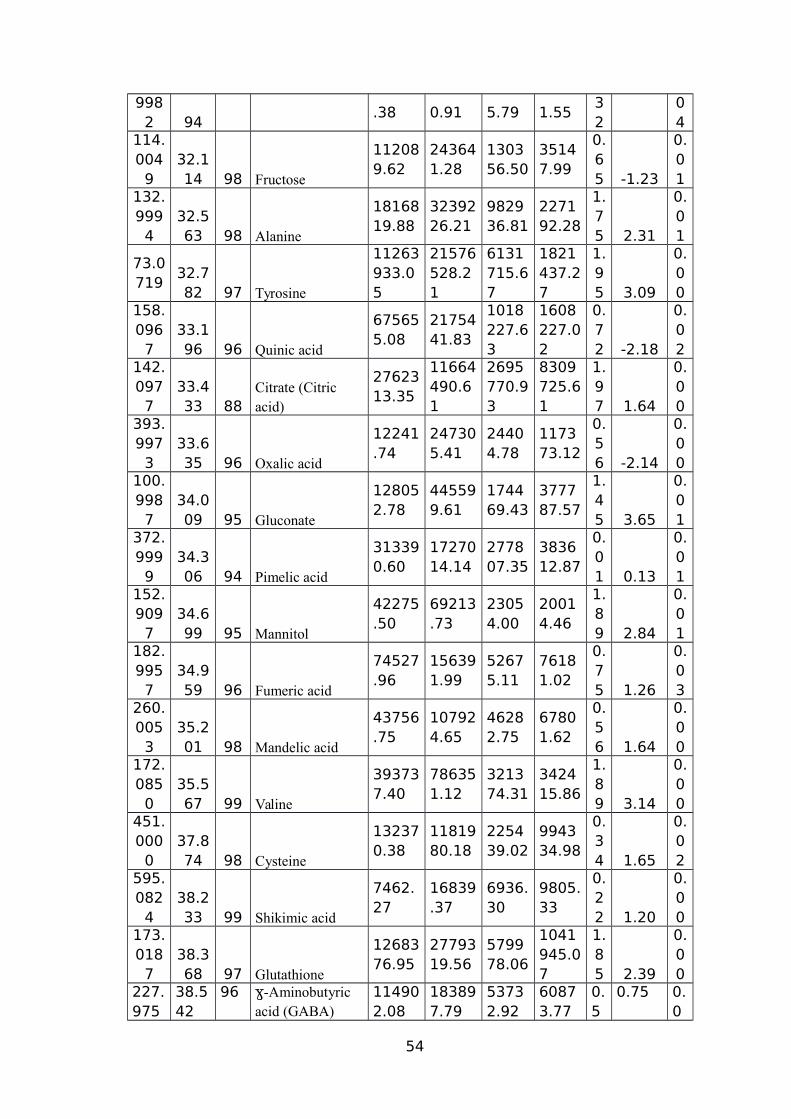
9982 94
.38 0.91 5.79 1.5532
04
114.004
932.114 98 Fructose
112089.62
243641.28
130356.50
35147.99
0.65 -1.23
0.01
132.999
432.563 98 Alanine
1816819.88
3239226.21
982936.81
227192.28
1.75 2.31
0.01
73.0719
32.782 97 Tyrosine
11263933.05
21576528.21
6131715.67
1821437.27
1.95 3.09
0.00
158.096
733.196 96 Quinic acid
675655.08
2175441.83
1018227.63
1608227.02
0.72 -2.18
0.02
142.097
733.433 88
Citrate (Citric acid)
2762313.35
11664490.61
2695770.93
8309725.61
1.97 1.64
0.00
393.997
333.635 96 Oxalic acid
12241.74
247305.41
24404.78
117373.12
0.56 -2.14
0.00
100.998
734.009 95 Gluconate
128052.78
445599.61
174469.43
377787.57
1.45 3.65
0.01
372.999
934.306 94 Pimelic acid
313390.60
1727014.14
277807.35
383612.87
0.01 0.13
0.01
152.909
734.699 95 Mannitol
42275.50
69213.73
23054.00
20014.46
1.89 2.84
0.01
182.995
734.959 96 Fumeric acid
74527.96
156391.99
52675.11
76181.02
0.75 1.26
0.03
260.005
335.201 98 Mandelic acid
43756.75
107924.65
46282.75
67801.62
0.56 1.64
0.00
172.085
035.567 99 Valine
393737.40
786351.12
321374.31
342415.86
1.89 3.14
0.00
451.000
037.874 98 Cysteine
132370.38
1181980.18
225439.02
994334.98
0.34 1.65
0.02
595.082
438.233 99 Shikimic acid
7462.27
16839.37
6936.30
9805.33
0.22 1.20
0.00
173.018
738.368 97 Glutathione
1268376.95
2779319.56
579978.06
1041945.07
1.85 2.39
0.00
227.975
38.542
96 -Aminobutyric ɣacid (GABA)
114902.08
183897.79
53732.92
60873.77
0.5
0.75 0.0
54
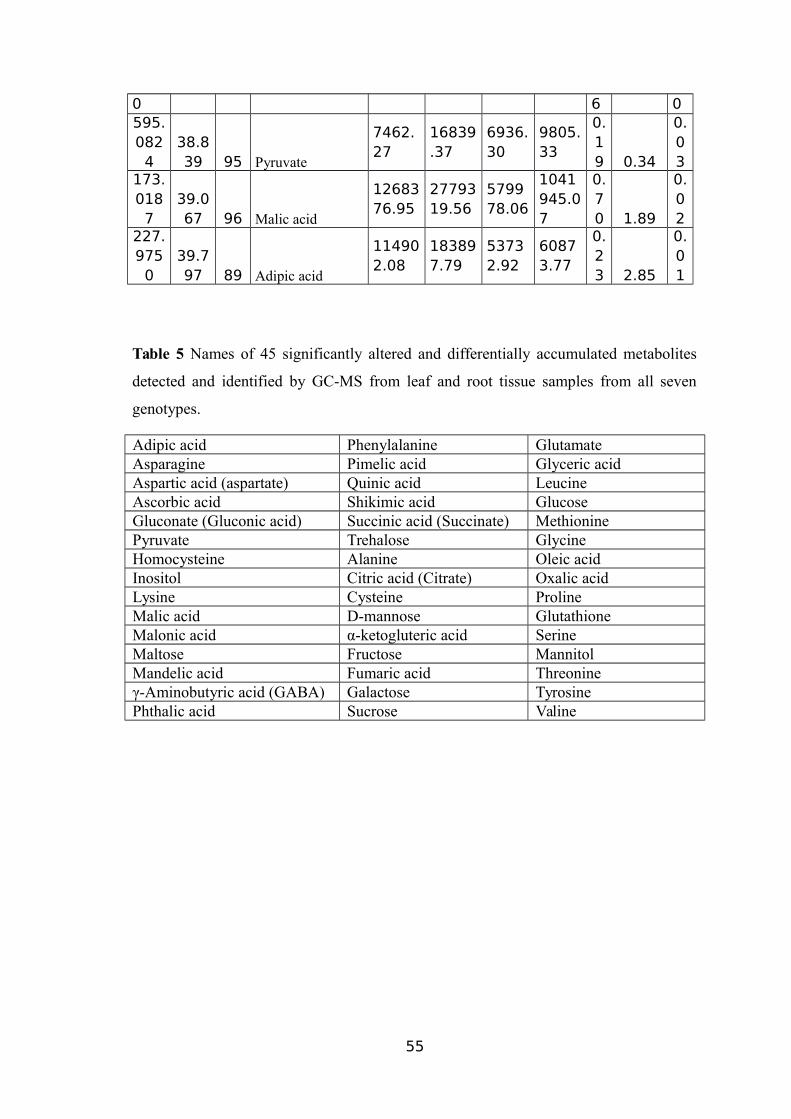
0 6 0595.082
438.839 95 Pyruvate
7462.27
16839.37
6936.30
9805.33
0.19 0.34
0.03
173.018
739.067 96 Malic acid
1268376.95
2779319.56
579978.06
1041945.07
0.70 1.89
0.02
227.975
039.797 89 Adipic acid
114902.08
183897.79
53732.92
60873.77
0.23 2.85
0.01
Table 5 Names of 45 significantly altered and differentially accumulated metabolites
detected and identified by GC-MS from leaf and root tissue samples from all seven
genotypes.
Adipic acid Phenylalanine GlutamateAsparagine Pimelic acid Glyceric acidAspartic acid (aspartate) Quinic acid LeucineAscorbic acid Shikimic acid GlucoseGluconate (Gluconic acid) Succinic acid (Succinate) MethioninePyruvate Trehalose GlycineHomocysteine Alanine Oleic acidInositol Citric acid (Citrate) Oxalic acidLysine Cysteine ProlineMalic acid D-mannose GlutathioneMalonic acid α-ketogluteric acid SerineMaltose Fructose MannitolMandelic acid Fumaric acid Threonineγ-Aminobutyric acid (GABA) Galactose TyrosinePhthalic acid Sucrose Valine
55
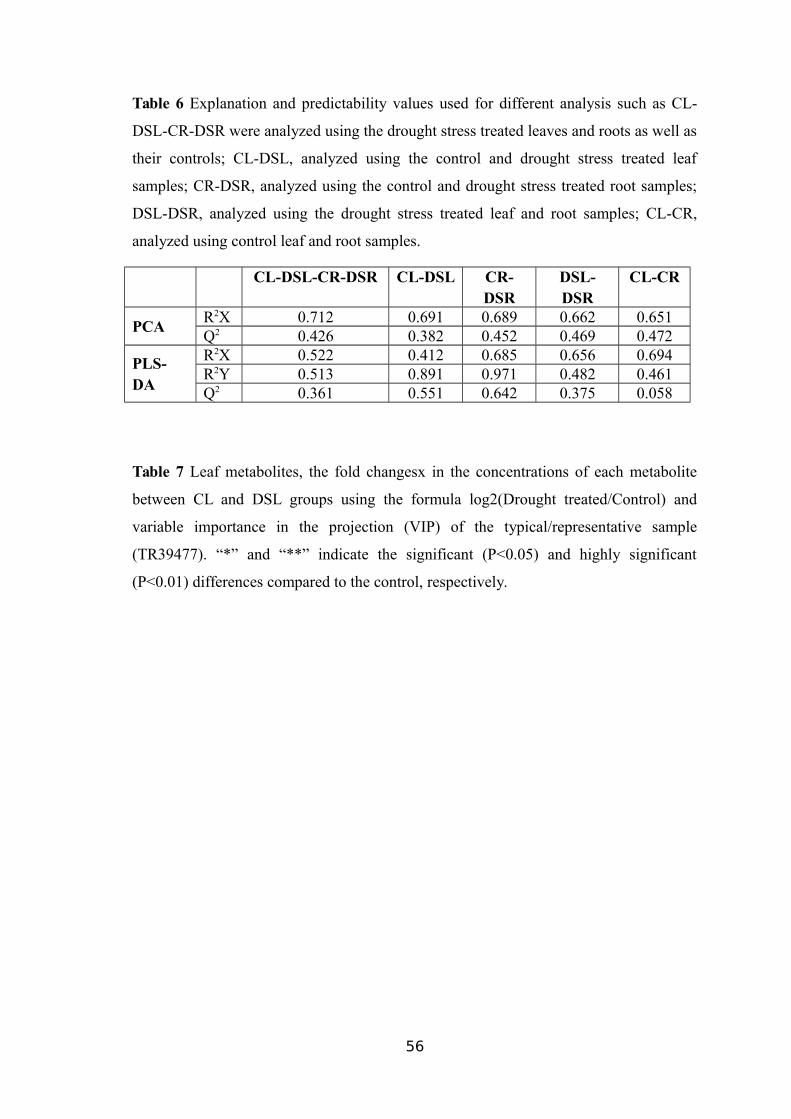
Table 6 Explanation and predictability values used for different analysis such as CL-
DSL-CR-DSR were analyzed using the drought stress treated leaves and roots as well as
their controls; CL-DSL, analyzed using the control and drought stress treated leaf
samples; CR-DSR, analyzed using the control and drought stress treated root samples;
DSL-DSR, analyzed using the drought stress treated leaf and root samples; CL-CR,
analyzed using control leaf and root samples.
CL-DSL-CR-DSR CL-DSL CR-DSR
DSL-DSR
CL-CR
PCAR2X 0.712 0.691 0.689 0.662 0.651Q2 0.426 0.382 0.452 0.469 0.472
PLS-DA
R2X 0.522 0.412 0.685 0.656 0.694R2Y 0.513 0.891 0.971 0.482 0.461Q2 0.361 0.551 0.642 0.375 0.058
Table 7 Leaf metabolites, the fold changesx in the concentrations of each metabolite
between CL and DSL groups using the formula log2(Drought treated/Control) and
variable importance in the projection (VIP) of the typical/representative sample
(TR39477). “*” and “**” indicate the significant (P<0.05) and highly significant
(P<0.01) differences compared to the control, respectively.
56
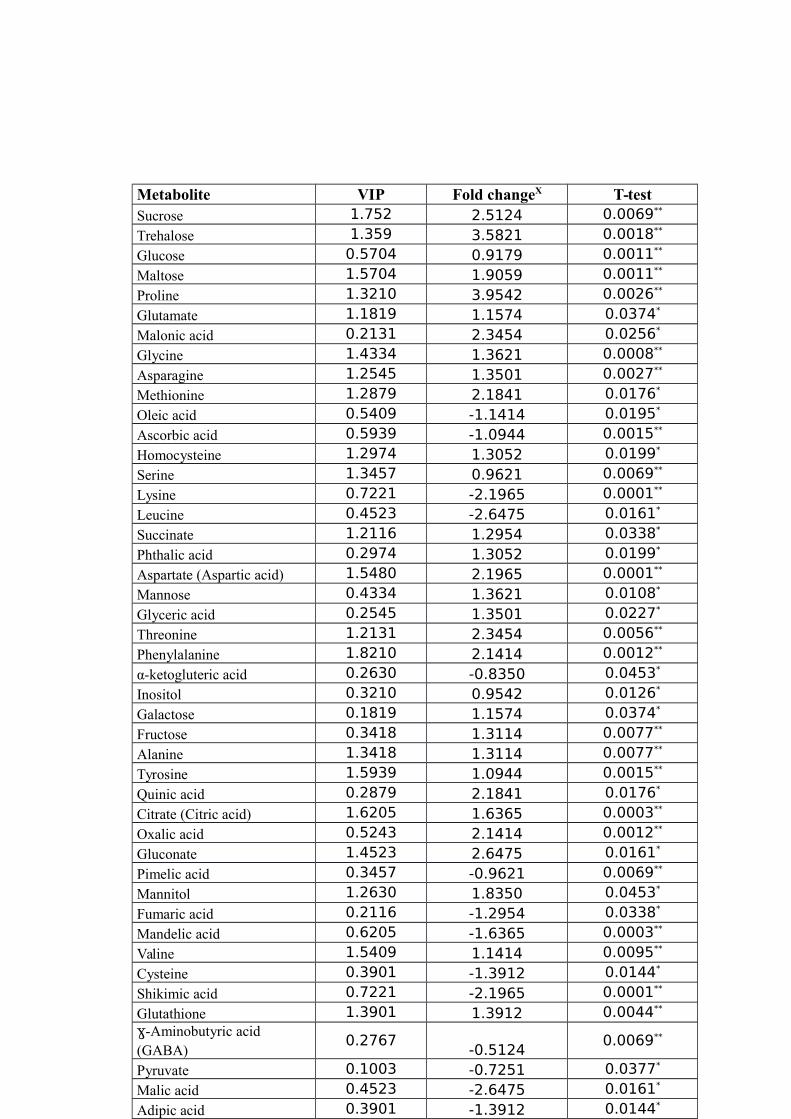
57
Metabolite VIP Fold changeX T-testSucrose 1.752 2.5124 0.0069**
Trehalose 1.359 3.5821 0.0018**
Glucose 0.5704 0.9179 0.0011**
Maltose 1.5704 1.9059 0.0011**
Proline 1.3210 3.9542 0.0026**
Glutamate 1.1819 1.1574 0.0374*
Malonic acid 0.2131 2.3454 0.0256*
Glycine 1.4334 1.3621 0.0008**
Asparagine 1.2545 1.3501 0.0027**
Methionine 1.2879 2.1841 0.0176*
Oleic acid 0.5409 -1.1414 0.0195*
Ascorbic acid 0.5939 -1.0944 0.0015**
Homocysteine 1.2974 1.3052 0.0199*
Serine 1.3457 0.9621 0.0069**
Lysine 0.7221 -2.1965 0.0001**
Leucine 0.4523 -2.6475 0.0161*
Succinate 1.2116 1.2954 0.0338*
Phthalic acid 0.2974 1.3052 0.0199*
Aspartate (Aspartic acid) 1.5480 2.1965 0.0001**
Mannose 0.4334 1.3621 0.0108*
Glyceric acid 0.2545 1.3501 0.0227*
Threonine 1.2131 2.3454 0.0056**
Phenylalanine 1.8210 2.1414 0.0012**
α-ketogluteric acid 0.2630 -0.8350 0.0453*
Inositol 0.3210 0.9542 0.0126*
Galactose 0.1819 1.1574 0.0374*
Fructose 0.3418 1.3114 0.0077**
Alanine 1.3418 1.3114 0.0077**
Tyrosine 1.5939 1.0944 0.0015**
Quinic acid 0.2879 2.1841 0.0176*
Citrate (Citric acid) 1.6205 1.6365 0.0003**
Oxalic acid 0.5243 2.1414 0.0012**
Gluconate 1.4523 2.6475 0.0161*
Pimelic acid 0.3457 -0.9621 0.0069**
Mannitol 1.2630 1.8350 0.0453*
Fumaric acid 0.2116 -1.2954 0.0338*
Mandelic acid 0.6205 -1.6365 0.0003**
Valine 1.5409 1.1414 0.0095**
Cysteine 0.3901 -1.3912 0.0144*
Shikimic acid 0.7221 -2.1965 0.0001**
Glutathione 1.3901 1.3912 0.0044**
-Aminobutyric acid ɣ(GABA)
0.2767-0.5124
0.0069**
Pyruvate 0.1003 -0.7251 0.0377*
Malic acid 0.4523 -2.6475 0.0161*
Adipic acid 0.3901 -1.3912 0.0144*
Table 8 Root metabolites, the fold changesx in the concentrations of each metabolite
between CR and DSR groups using the formula log2 (Drought treated/Control) and
variable importance in the projection (VIP) of the typical/representative sample
(TR39477). “*” and “**” indicate the significance (P<0.05) and highly significance
(P<0.01) level.
58
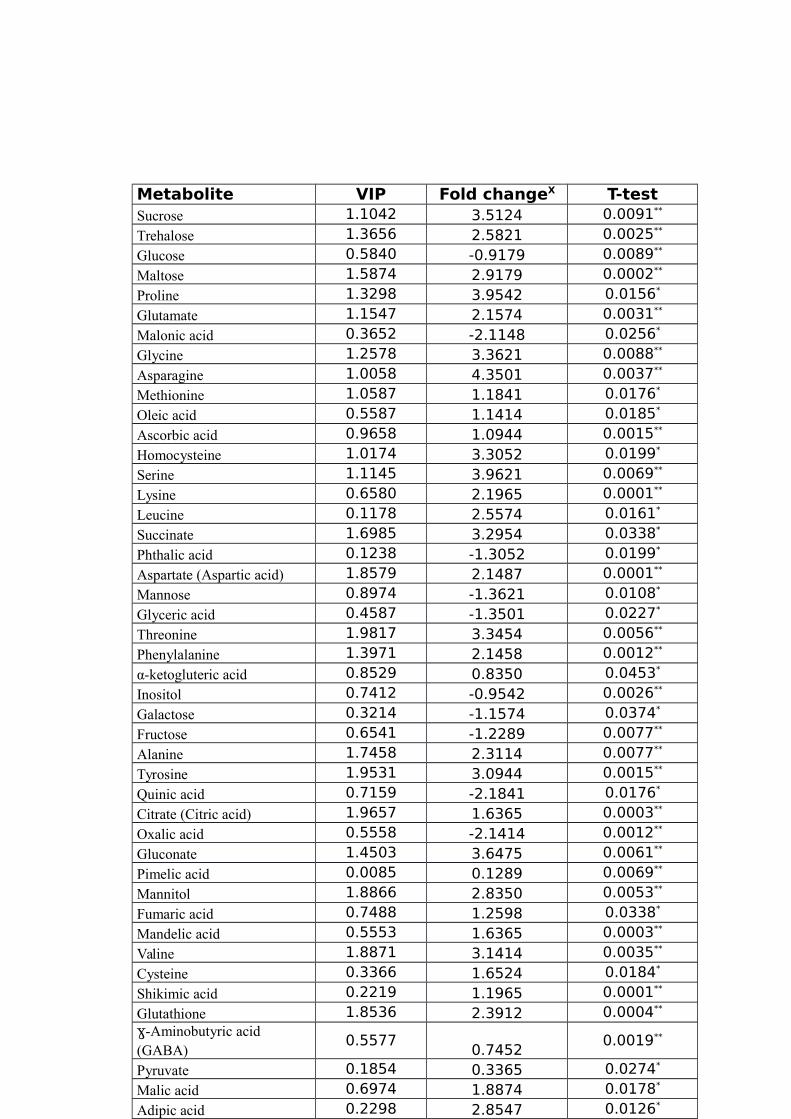
59
Metabolite VIP Fold changeX T-testSucrose 1.1042 3.5124 0.0091**
Trehalose 1.3656 2.5821 0.0025**
Glucose 0.5840 -0.9179 0.0089**
Maltose 1.5874 2.9179 0.0002**
Proline 1.3298 3.9542 0.0156*
Glutamate 1.1547 2.1574 0.0031**
Malonic acid 0.3652 -2.1148 0.0256*
Glycine 1.2578 3.3621 0.0088**
Asparagine 1.0058 4.3501 0.0037**
Methionine 1.0587 1.1841 0.0176*
Oleic acid 0.5587 1.1414 0.0185*
Ascorbic acid 0.9658 1.0944 0.0015**
Homocysteine 1.0174 3.3052 0.0199*
Serine 1.1145 3.9621 0.0069**
Lysine 0.6580 2.1965 0.0001**
Leucine 0.1178 2.5574 0.0161*
Succinate 1.6985 3.2954 0.0338*
Phthalic acid 0.1238 -1.3052 0.0199*
Aspartate (Aspartic acid) 1.8579 2.1487 0.0001**
Mannose 0.8974 -1.3621 0.0108*
Glyceric acid 0.4587 -1.3501 0.0227*
Threonine 1.9817 3.3454 0.0056**
Phenylalanine 1.3971 2.1458 0.0012**
α-ketogluteric acid 0.8529 0.8350 0.0453*
Inositol 0.7412 -0.9542 0.0026**
Galactose 0.3214 -1.1574 0.0374*
Fructose 0.6541 -1.2289 0.0077**
Alanine 1.7458 2.3114 0.0077**
Tyrosine 1.9531 3.0944 0.0015**
Quinic acid 0.7159 -2.1841 0.0176*
Citrate (Citric acid) 1.9657 1.6365 0.0003**
Oxalic acid 0.5558 -2.1414 0.0012**
Gluconate 1.4503 3.6475 0.0061**
Pimelic acid 0.0085 0.1289 0.0069**
Mannitol 1.8866 2.8350 0.0053**
Fumaric acid 0.7488 1.2598 0.0338*
Mandelic acid 0.5553 1.6365 0.0003**
Valine 1.8871 3.1414 0.0035**
Cysteine 0.3366 1.6524 0.0184*
Shikimic acid 0.2219 1.1965 0.0001**
Glutathione 1.8536 2.3912 0.0004**
-Aminobutyric acid ɣ(GABA)
0.55770.7452
0.0019**
Pyruvate 0.1854 0.3365 0.0274*
Malic acid 0.6974 1.8874 0.0178*
Adipic acid 0.2298 2.8547 0.0126*
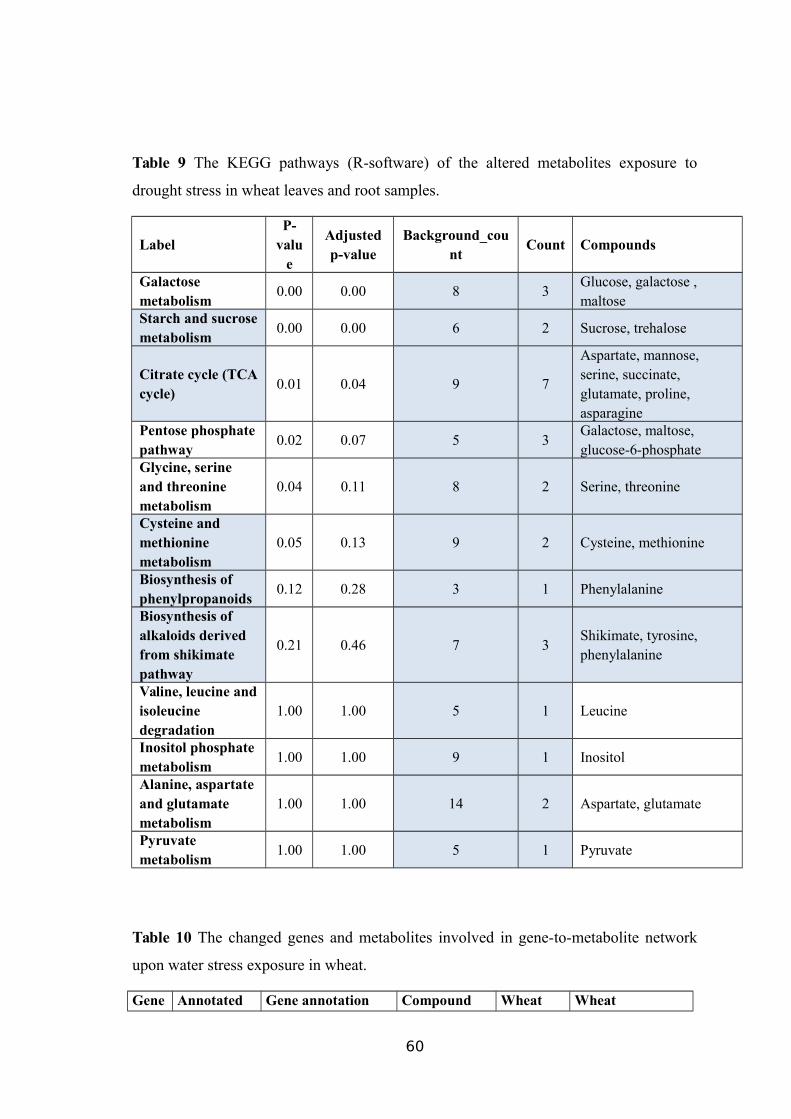
Table 9 The KEGG pathways (R-software) of the altered metabolites exposure to
drought stress in wheat leaves and root samples.
LabelP-
value
Adjustedp-value
Background_count
Count Compounds
Galactose metabolism
0.00 0.00 8 3Glucose, galactose , maltose
Starch and sucrosemetabolism
0.00 0.00 6 2 Sucrose, trehalose
Citrate cycle (TCAcycle)
0.01 0.04 9 7
Aspartate, mannose, serine, succinate, glutamate, proline, asparagine
Pentose phosphatepathway
0.02 0.07 5 3Galactose, maltose, glucose-6-phosphate
Glycine, serine and threonine metabolism
0.04 0.11 8 2 Serine, threonine
Cysteine and methionine metabolism
0.05 0.13 9 2 Cysteine, methionine
Biosynthesis of phenylpropanoids
0.12 0.28 3 1 Phenylalanine
Biosynthesis of alkaloids derived from shikimate pathway
0.21 0.46 7 3Shikimate, tyrosine, phenylalanine
Valine, leucine andisoleucine degradation
1.00 1.00 5 1 Leucine
Inositol phosphate metabolism
1.00 1.00 9 1 Inositol
Alanine, aspartate and glutamate metabolism
1.00 1.00 14 2 Aspartate, glutamate
Pyruvate metabolism
1.00 1.00 5 1 Pyruvate
Table 10 The changed genes and metabolites involved in gene-to-metabolite network
upon water stress exposure in wheat.
Gene Annotated Gene annotation Compound Wheat Wheat
60
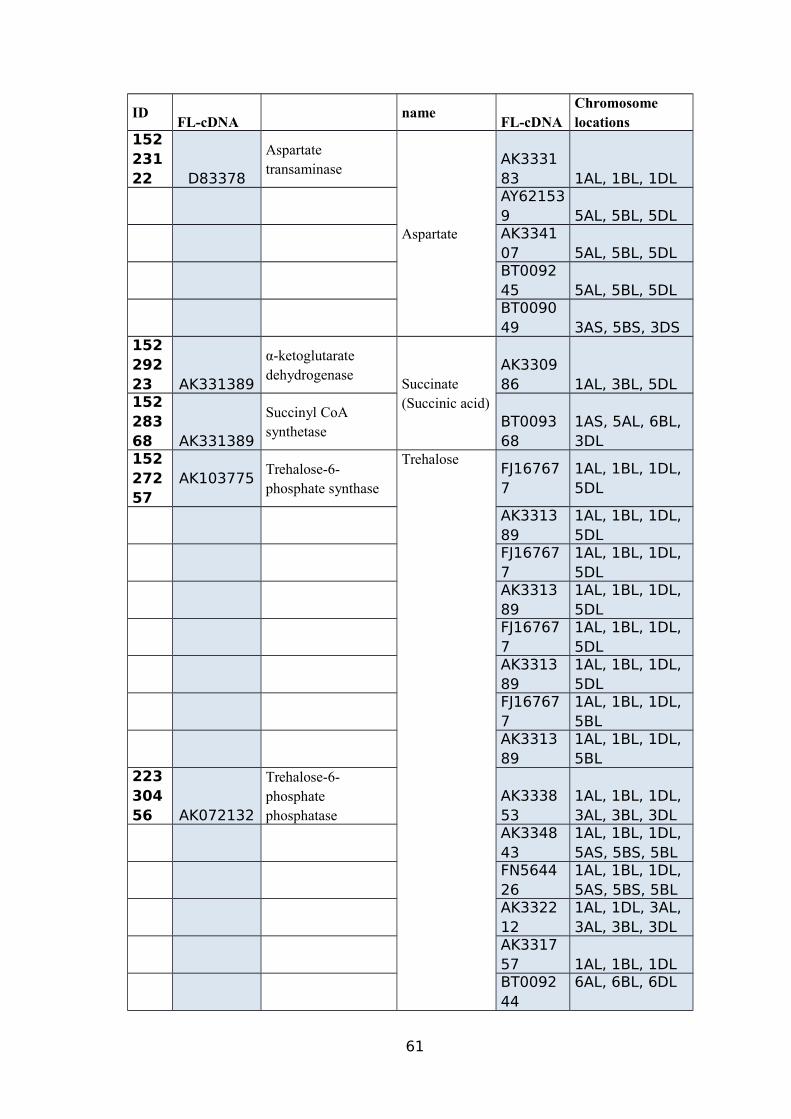
IDFL-cDNA
nameFL-cDNA
Chromosome locations
15223122 D83378
Aspartate transaminase
Aspartate
AK333183 1AL, 1BL, 1DL
AY621539 5AL, 5BL, 5DL
AK334107 5AL, 5BL, 5DL
BT009245 5AL, 5BL, 5DL
BT009049 3AS, 5BS, 3DS
15229223 AK331389
α-ketoglutarate dehydrogenase
Succinate (Succinic acid)
AK330986 1AL, 3BL, 5DL
15228368 AK331389
Succinyl CoA synthetase
BT009368
1AS, 5AL, 6BL, 3DL
15227257
AK103775Trehalose-6-phosphate synthase
TrehaloseFJ167677
1AL, 1BL, 1DL, 5DL
AK331389
1AL, 1BL, 1DL, 5DL
FJ167677
1AL, 1BL, 1DL, 5DL
AK331389
1AL, 1BL, 1DL, 5DL
FJ167677
1AL, 1BL, 1DL, 5DL
AK331389
1AL, 1BL, 1DL, 5DL
FJ167677
1AL, 1BL, 1DL, 5BL
AK331389
1AL, 1BL, 1DL, 5BL
22330456 AK072132
Trehalose-6-phosphate phosphatase
AK333853
1AL, 1BL, 1DL, 3AL, 3BL, 3DL
AK334843
1AL, 1BL, 1DL, 5AS, 5BS, 5BL
FN564426
1AL, 1BL, 1DL, 5AS, 5BS, 5BL
AK332212
1AL, 1DL, 3AL, 3AL, 3BL, 3DL
AK331757 1AL, 1BL, 1DL
BT009244
6AL, 6BL, 6DL
61
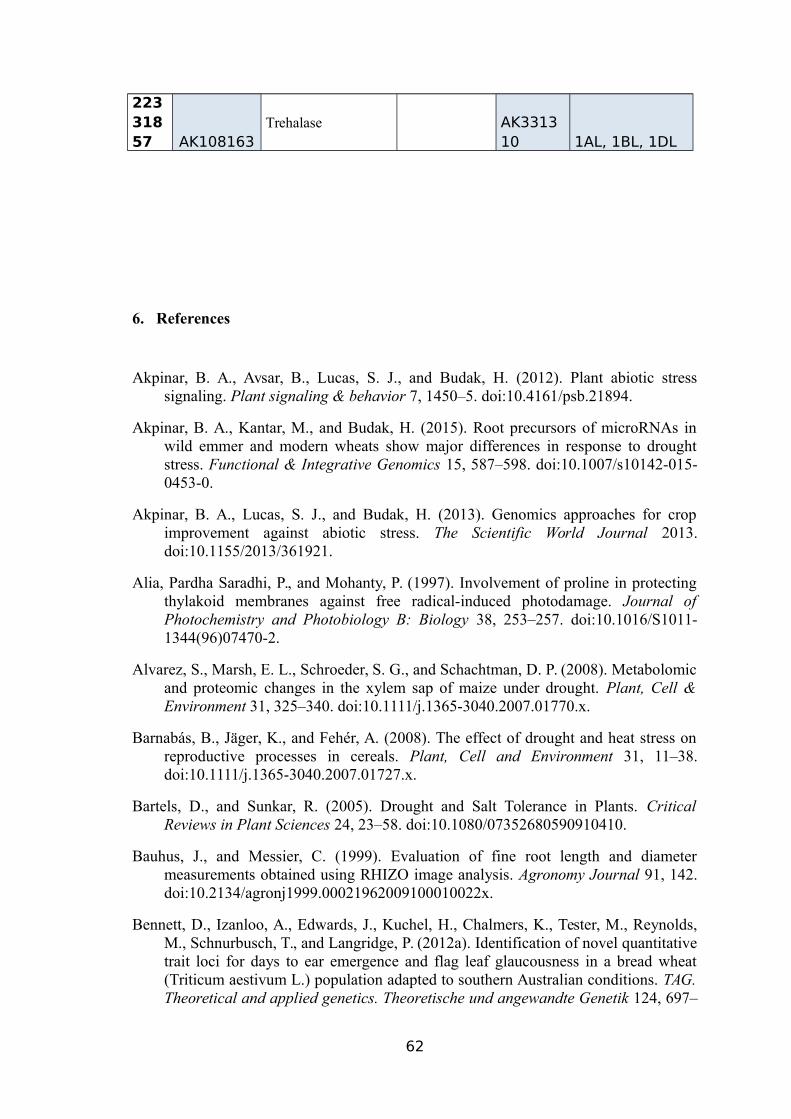
22331857 AK108163
Trehalase AK331310 1AL, 1BL, 1DL
6. References
Akpinar, B. A., Avsar, B., Lucas, S. J., and Budak, H. (2012). Plant abiotic stresssignaling. Plant signaling & behavior 7, 1450–5. doi:10.4161/psb.21894.
Akpinar, B. A., Kantar, M., and Budak, H. (2015). Root precursors of microRNAs inwild emmer and modern wheats show major differences in response to droughtstress. Functional & Integrative Genomics 15, 587–598. doi:10.1007/s10142-015-0453-0.
Akpinar, B. A., Lucas, S. J., and Budak, H. (2013). Genomics approaches for cropimprovement against abiotic stress. The Scientific World Journal 2013.doi:10.1155/2013/361921.
Alia, Pardha Saradhi, P., and Mohanty, P. (1997). Involvement of proline in protectingthylakoid membranes against free radical-induced photodamage. Journal ofPhotochemistry and Photobiology B: Biology 38, 253–257. doi:10.1016/S1011-1344(96)07470-2.
Alvarez, S., Marsh, E. L., Schroeder, S. G., and Schachtman, D. P. (2008). Metabolomicand proteomic changes in the xylem sap of maize under drought. Plant, Cell &Environment 31, 325–340. doi:10.1111/j.1365-3040.2007.01770.x.
Barnabás, B., Jäger, K., and Fehér, A. (2008). The effect of drought and heat stress onreproductive processes in cereals. Plant, Cell and Environment 31, 11–38.doi:10.1111/j.1365-3040.2007.01727.x.
Bartels, D., and Sunkar, R. (2005). Drought and Salt Tolerance in Plants. CriticalReviews in Plant Sciences 24, 23–58. doi:10.1080/07352680590910410.
Bauhus, J., and Messier, C. (1999). Evaluation of fine root length and diametermeasurements obtained using RHIZO image analysis. Agronomy Journal 91, 142.doi:10.2134/agronj1999.00021962009100010022x.
Bennett, D., Izanloo, A., Edwards, J., Kuchel, H., Chalmers, K., Tester, M., Reynolds,M., Schnurbusch, T., and Langridge, P. (2012a). Identification of novel quantitativetrait loci for days to ear emergence and flag leaf glaucousness in a bread wheat(Triticum aestivum L.) population adapted to southern Australian conditions. TAG.Theoretical and applied genetics. Theoretische und angewandte Genetik 124, 697–
62
711. doi:10.1007/s00122-011-1740-3.
Bennett, D., Izanloo, A., Reynolds, M., Kuchel, H., Langridge, P., and Schnurbusch, T.(2012b). Genetic dissection of grain yield and physical grain quality in bread wheat(Triticum aestivum L.) under water-limited environments. TAG. Theoretical andapplied genetics. Theoretische und angewandte Genetik 125, 255–71.doi:10.1007/s00122-012-1831-9.
Bennett, D., Reynolds, M., Mullan, D., Izanloo, A., Kuchel, H., Langridge, P., andSchnurbusch, T. (2012c). Detection of two major grain yield QTL in bread wheat(Triticum aestivum L.) under heat, drought and high yield potential environments.TAG. Theoretical and applied genetics. Theoretische und angewandte Genetik 125,1473–85. doi:10.1007/s00122-012-1927-2.
Berkman, P. J., Skarshewski, A., Lorenc, M. T., Lai, K., Duran, C., Ling, E. Y. S.,Stiller, J., Smits, L., Imelfort, M., Manoli, S., et al. (2011). Sequencing andassembly of low copy and genic regions of isolated Triticum aestivumchromosome arm 7DS. Plant Biotechnology Journal 9, 768–775.doi:10.1111/j.1467-7652.2010.00587.x.
Bonneau, J., Taylor, J., Parent, B., Bennett, D., Reynolds, M., Feuillet, C., Langridge, P.,and Mather, D. (2013). Multi-environment analysis and improved mapping of ayield-related QTL on chromosome 3B of wheat. TAG. Theoretical and appliedgenetics. Theoretische und angewandte Genetik 126, 747–61. doi:10.1007/s00122-012-2015-3.
Boutraa, T., Akhkha, A., Al-Shoaibi, A. A., and Alhejeli, A. M. (2010). Effect of waterstress on growth and water use efficiency (WUE) of some wheat cultivars(Triticum durum) grown in Saudi Arabia. Journal of Taibah University for Science3, 39–48. doi:10.1016/S1658-3655(12)60019-3.
Boyer, J. S. (1982). Plant productivity and environment. Science (New York, N.Y.) 218,443–448. doi:10.1126/science.218.4571.443.
Boyer, J. S., James, R. A., Munns, R., Condon, T. (A. G. ., and Passioura, J. B. (2008).Osmotic adjustment leads to anomalously low estimates of relative water contentin wheat and barley. Functional Plant Biology 35, 1172. doi:10.1071/FP08157.
Bray, E. A., Bailey-Serres, J., and Weretilnyk, E. (2000). “Responses to abioticstresses,” in Biochemistry and Molecular Biology of Plants, eds. W. Gruissem, B.Buchannan, and R. Jones (Rockville, MD.: American Society of PlantPhysiologists), 1158–1249.
Breen, J., Wicker, T., Shatalina, M., Frenkel, Z., Bertin, I., Philippe, R., Spielmeyer, W.,Šimková, H., Šafář, J., Cattonaro, F., et al. (2013). A physical map of the short armof wheat chromosome 1A. PLoS ONE 8. doi:10.1371/journal.pone.0080272.
Brenchley, R., Spannagl, M., Pfeifer, M., Barker, G. L. a, D’Amore, R., Allen, A. M.,McKenzie, N., Kramer, M., Kerhornou, A., Bolser, D., et al. (2012). Analysis ofthe bread wheat genome using whole-genome shotgun sequencing. Nature 491,705–710. doi:10.1038/nature11650.
Brini, F., Gaxiola, R. a, Berkowitz, G. a, and Masmoudi, K. (2005). Cloning and
63
characterization of a wheat vacuolar cation/proton antiporter and pyrophosphataseproton pump. Plant physiology and biochemistry : PPB / Société française de physiologie végétale 43, 347–54. doi:10.1016/j.plaphy.2005.02.010.
Budak, H., Akpinar, B. A., Unver, T., and Turktas, M. (2013a). Proteome changes inwild and modern wheat leaves upon drought stress by two-dimensionalelectrophoresis and nanoLC-ESI–MS/MS. Plant Molecular Biology 83, 89–103.doi:10.1007/s11103-013-0024-5.
Budak, H., Hussain, B., Khan, Z., Ozturk, N. Z., and Ullah, N. (2015a). From Geneticsto Functional Genomics: Improvement in Drought Signaling and Tolerance inWheat. Frontiers in Plant Science 6, 1012. doi:10.3389/fpls.2015.01012.
Budak, H., Kantar, M., Bulut, R., and Akpinar, B. A. (2015b). Stress responsivemiRNAs and isomiRs in cereals. Plant Science 235, 1–13.doi:10.1016/j.plantsci.2015.02.008.
Budak, H., Kantar, M., and Kurtoglu, K. Y. (2013b). Drought tolerance in modern andwild wheat. TheScientificWorldJournal 2013, 548246. doi:10.1155/2013/548246.
Cavalcanti, J. H. F., Esteves-Ferreira, A. A., Quinhones, C. G. S., Pereira-Lima, I. A.,Nunes-Nesi, A., Fernie, A. R., and Araújo, W. L. (2014). Evolution and functionalimplications of the tricarboxylic acid cycle as revealed by phylogenetic analysis.Genome biology and evolution 6, 2830–48. doi:10.1093/gbe/evu221.
Charlton, A. J., Donarski, J. A., Harrison, M., Jones, S. A., Godward, J., Oehlschlager,S., Arques, J. L., Ambrose, M., Chinoy, C., Mullineaux, P. M., et al. (2008).Responses of the pea (Pisum sativum L.) leaf metabolome to drought stressassessed by nuclear magnetic resonance spectroscopy. Metabolomics 4, 312–327.doi:10.1007/s11306-008-0128-0.
Chauhan, H., and Khurana, P. (2011). Use of doubled haploid technology fordevelopment of stable drought tolerant bread wheat (Triticum aestivum L.)transgenics. Plant Biotechnology Journal 9, 408–417. doi:10.1111/j.1467-7652.2010.00561.x.
Chen, H., Jiang, S., Zheng, J., and Lin, Y. (2013). Improving panicle exsertion of ricecytoplasmic male sterile line by combination of artificial microRNA and artificialtarget mimic. Plant Biotechnology Journal 11, 336–343. doi:10.1111/pbi.12019.
Chen, H., and Xiong, L. (2005). Pyridoxine is required for post-embryonic rootdevelopment and tolerance to osmotic and oxidative stresses. The Plant journal : for cell and molecular biology 44, 396–408. doi:10.1111/j.1365-313X.2005.02538.x.
Choulet, F., Alberti, A., Theil, S., Glover, N., Barbe, V., Daron, J., Pingault, L.,Sourdille, P., Couloux, A., Paux, E., et al. (2014). Structural and functionalpartitioning of bread wheat chromosome 3B. Science (New York, N.Y.) 345,1249721. doi:10.1126/science.1249721.
Comas, L. H., Becker, S. R., Cruz, V. M. V, Byrne, P. F., and Dierig, D. A. (2013). Roottraits contributing to plant productivity under drought. Frontiers in plant science 4,442. doi:10.3389/fpls.2013.00442.
64
Dong, P., Wei, Y. M., Chen, G. Y., Li, W., Wang, J. R., Nevo, E., and Zheng, Y. L.(2009). EST-SSR diversity correlated with ecological and genetic factors of wildemmer wheat in Israel. Hereditas 146, 1–10. doi:10.1111/j.1601-5223.2009.02098.x.
Dubcovsky, J., and Dvorak, J. (2007). Genome plasticity a key factor in the success ofpolyploid wheat under domestication. Science (New York, N.Y.) 316, 1862–1866.doi:10.1126/science.1143986.
Ergen, N. Z., and Budak, H. (2009). Sequencing over 13 000 expressed sequence tagsfrom six subtractive cDNA libraries of wild and modern wheats following slowdrought stress. Plant, cell & environment 32, 220–36. doi:10.1111/j.1365-3040.2008.01915.x.
Ergen, N. Z., Thimmapuram, J., Bohnert, H. J., and Budak, H. (2009). Transcriptomepathways unique to dehydration tolerant relatives of modern wheat. Functional&integrative genomics 9, 377–96. doi:10.1007/s10142-009-0123-1.
Fahima, T., Röder, M. S., Wendehake, K., Kirzhner, V. M., and Nevo, E. (2002).Microsatellite polymorphism in natural populations of wild emmer wheat, Triticumdicoccoides, in Israel. Theoretical and Applied Genetics 104, 17–29.doi:10.1007/s001220200002.
Fahima, T., Sun, G. L., Beharav, A., Krugman, T., Beiles, A., and Nevo, E. (1999).RAPD polymorphism of wild emmer wheat populations, Triticum dicoccoides, inIsrael. Theor Appl Genet, 434–447.
Feldman, M. (2001). “Origin of cultivated wheat,” in The World Wheat Book: A Historyof Wheat Breeding, Volume 1, eds. A. Bonjean and W. Angus (Paris: LavoisierPublishing), 3–56.
Feldman, M., and Sears, E. R. (1981). The Wild Gene Resources of Wheat. ScientificAmerican 244, 102–112.
Fiehn, O., Kopka, J., Dörmann, P., Altmann, T., Trethewey, R. N., and Willmitzer, L.(2000). Metabolite profiling for plant functional genomics. Nature biotechnology18, 1157–61. doi:10.1038/81137.
Fleury, D., Jefferies, S., Kuchel, H., and Langridge, P. (2010). Genetic and genomictools to improve drought tolerance in wheat. Journal of experimental botany 61,3211–22. doi:10.1093/jxb/erq152.
Golldack, D., Li, C., Mohan, H., and Probst, N. (2014). Tolerance to drought and saltstress in plants: Unraveling the signaling networks. Frontiers in plant science 5,151. doi:10.3389/fpls.2014.00151.
Guimarães, E. R., Mutton, M. A., Mutton, M. J. R., Ferro, M. I. T., Ravaneli, G. C., andSilva, J. A. da (2008). Free proline accumulation in sugarcane under waterrestriction and spittlebug infestation. Scientia Agricola 65, 628–633.doi:10.1590/S0103-90162008000600009.
Guo, P., Baum, M., Grando, S., Ceccarelli, S., Bai, G., Li, R., Von Korff, M., Varshney,R. K., Graner, A., and Valkoun, J. (2009). Differentially expressed genes betweendrought-tolerant and drought-sensitive barley genotypes in response to drought
65
stress during the reproductive stage. Journal of Experimental Botany 60, 3531–3544. doi:10.1093/jxb/erp194.
Habash, D. Z., Kehel, Z., and Nachit, M. (2009). Genomic approaches for designingdurum wheat ready for climate change with a focus on drought. Journal ofexperimental botany 60, 2805–15. doi:10.1093/jxb/erp211.
Hernandez, P., Martis, M., Dorado, G., Pfeifer, M., Gálvez, S., Schaaf, S., Jouve, N.,Šimková, H., Valárik, M., Doležel, J., et al. (2012). Next-generation sequencingand syntenic integration of flow-sorted arms of wheat chromosome 4A exposes thechromosome structure and gene content. Plant Journal 69, 377–386.doi:10.1111/j.1365-313X.2011.04808.x.
Himmelbauer, M. L., Loiskandl, ¡AFF1¿W., and Kastanek, ¡AFF1¿F. (2004). Estimatinglength, average diameter and surface area of roots using two different Imageanalyses systems. Plant and Soil 260, 111–120.doi:10.1023/B:PLSO.0000030171.28821.55.
Hoekstra, F. A., Golovina, E. A., Buitink, J., Tanford, C., Oliver, M. ., Bewley, J. .,Ingram, J., Bartels, D., Bartels, D., al., et, et al. (2001). Mechanisms of plantdesiccation tolerance. Trends in plant science 6, 431–8. doi:10.1016/S1360-1385(01)02052-0.
Hoisington, D., and Ortiz, R. (2008). Research and field monitoring on transgenic cropsby the Centro Internacional de Mejoramiento de Maíz y Trigo (CIMMYT).Euphytica 164, 893–902. doi:10.1007/s10681-007-9633-x.
Izanloo, A., Condon, A. G., Langridge, P., Tester, M., and Schnurbusch, T. (2008).Different mechanisms of adaptation to cyclic water stress in two South Australianbread wheat cultivars. Journal of experimental botany 59, 3327–46.doi:10.1093/jxb/ern199.
Jacobs, A., Lunde, C., Bacic, A., Tester, M., and Roessner, U. (2007). The impact ofconstitutive heterologous expression of a moss Na+ transporter on themetabolomes of rice and barley. Metabolomics 3, 307–317. doi:10.1007/s11306-007-0056-4.
Jain, M. (2013). Emerging Role of Metabolic Pathways in Abiotic Stress Tolerance.Journal of Plant Biochemistry & Physiology 2013, 1–2. doi:10.4172/2329-9029.1000108.
James, R. A., Davenport, R. J., and Munns, R. (2006). Physiological characterization oftwo genes for Na+ exclusion in durum wheat, Nax1 and Nax2. Plant physiology142, 1537–1547. doi:10.1104/pp.106.086538.
Jiang, T., Fountain, J., Davis, G., Kemerait, R., Scully, B., Lee, R. D., and Guo, B.(2012). Root Morphology and Gene Expression Analysis in Response to DroughtStress in Maize (Zea mays). Plant Molecular Biology Reporter 30, 360–369.doi:10.1007/s11105-011-0347-9.
Kantar, M., Lucas, S. J., and Budak, H. (2011a). Drought stress: molecular genetics andgenomics approaches. Advances in Botanical Research. Available at:http://research.sabanciuniv.edu/16615/ [Accessed March 1, 2016].
66
Kantar, M., Lucas, S. J., and Budak, H. (2010). miRNA expression patterns of Triticumdicoccoides in response to shock drought stress. Planta 233, 471–484.doi:10.1007/s00425-010-1309-4.
Kantar, M., Lucas, S. J., Budak, H., and Sciences, N. (2011b). Plant responses todrought and salinity stress - developments in a post-genomic era. 1st ed. Elsevierdoi:10.1016/B978-0-12-387692-8.00013-8.
Kawaura, K., Mochida, K., Enju, A., Totoki, Y., Toyoda, A., Sakaki, Y., Kai, C., Kawai,J., Hayashizaki, Y., Seki, M., et al. (2009). Assessment of adaptive evolutionbetween wheat and rice as deduced from full-length common wheat cDNAsequence data and expression patterns. BMC genomics 10, 271. doi:10.1186/1471-2164-10-271.
Kopka, J. (2006). Current challenges and developments in GC-MS based metaboliteprofiling technology. Journal of biotechnology 124, 312–22.doi:10.1016/j.jbiotec.2005.12.012.
Krugman, T., Chagué, V., Peleg, Z., Balzergue, S., Just, J., Korol, A. B., Nevo, E.,Saranga, Y., Chalhoub, B., and Fahima, T. (2010). Multilevel regulation andsignalling processes associated with adaptation to terminal drought in wild emmerwheat. Functional and Integrative Genomics 10, 167–186. doi:10.1007/s10142-010-0166-3.
Krugman, T., Peleg, Z., Quansah, L., Chagué, V., Korol, A. B., Nevo, E., Saranga, Y.,Fait, A., Chalhoub, B., and Fahima, T. (2011). Alteration in expression of hormone-related genes in wild emmer wheat roots associated with drought adaptationmechanisms. Functional and Integrative Genomics 11, 565–583.doi:10.1007/s10142-011-0231-6.
Kurtoglu, K. Y., Kantar, M., and Budak, H. (2014). New wheat microRNA using whole-genome sequence. Functional and Integrative Genomics 14, 363–379.doi:10.1007/s10142-013-0357-9.
Kuzuoglu-Ozturk, D., Cebeci Yalcinkaya, O., Akpinar, B. A., Mitou, G., Korkmaz, G.,Gozuacik, D., and Budak, H. (2012). Autophagy-related gene, TdAtg8, in wildemmer wheat plays a role in drought and osmotic stress response. Planta 236,1081–92. doi:10.1007/s00425-012-1657-3.
Less, H., and Galili, G. (2008). Principal transcriptional programs regulating plantamino acid metabolism in response to abiotic stresses. Plant physiology 147, 316–30. doi:10.1104/pp.108.115733.
Lopes, C. T., Franz, M., Kazi, F., Donaldson, S. L., Morris, Q., and Bader, G. D. (2010).Cytoscape Web: an interactive web-based network browser. Bioinformatics 26,2347–2348. doi:10.1093/bioinformatics/btq430.
Lucas, S., Dogan, E., and Budak, H. (2011a). TMPIT1 from wild emmer wheat: firstcharacterisation of a stress-inducible integral membrane protein. Gene 483, 22–8.doi:10.1016/j.gene.2011.05.003.
Lucas, S., Durmaz, E., Akpınar, B. A., and Budak, H. (2011b). The drought responsedisplayed by a DRE-binding protein from Triticum dicoccoides. Plant physiology
67
and biochemistry : PPB / Société française de physiologie végétale 49, 346–51.doi:10.1016/j.plaphy.2011.01.016.
Lucas, S. J., Akpinar, B. A., Kantar, M., Weinstein, Z., Aydino lu, F., Šafář, J., Šimková,ǧH., Frenkel, Z., Korol, A., Magni, F., et al. (2013). Physical Mapping Integratedwith Syntenic Analysis to Characterize the Gene Space of the Long Arm of WheatChromosome 1A. PLoS ONE 8. doi:10.1371/journal.pone.0059542.
Lucas, S. J., and Budak, H. (2012). Sorting the wheat from the Chaff: IdentifyingmiRNAs in genomic survey sequences of Triticum aestivum chromosome 1AL.PLoS ONE 7. doi:10.1371/journal.pone.0040859.
Mahajan, S., and Tuteja, N. (2005). Cold, salinity and drought stresses: an overview.Archives of biochemistry and biophysics 444, 139–58.doi:10.1016/j.abb.2005.10.018.
Malatrasi, M., Corradi, M., Svensson, J. T., Close, T. J., Gulli, M., and Marmiroli, N.(2006). A branched-chain amino acid aminotransferase gene isolated fromHordeum vulgare is differentially regulated by drought stress. TAG. Theoreticaland applied genetics. Theoretische und angewandte Genetik 113, 965–76.doi:10.1007/s00122-006-0339-6.
Middleton, C. P., Senerchia, N., Stein, N., Akhunov, E. D., Keller, B., Wicker, T., andKilian, B. (2014). Sequencing of chloroplast genomes from wheat, barley, rye andtheir relatives provides a detailed insight into the evolution of the Triticeae tribe.PloS one 9, e85761. doi:10.1371/journal.pone.0085761.
Munns, R., James, R. a, Sirault, X. R. R., Furbank, R. T., and Jones, H. G. (2010). Newphenotyping methods for screening wheat and barley for beneficial responses towater deficit. Journal of experimental botany 61, 3499–507.doi:10.1093/jxb/erq199.
Nanjo, T., Kobayashi, M., Yoshiba, Y., Sanada, Y., Wada, K., Tsukaya, H., Kakubari, Y.,Yamaguchi-Shinozaki, K., and Shinozaki, K. (1999). Biological functions ofproline in morphogenesis and osmotolerance revealed in antisense transgenicArabidopsis thaliana. The Plant journal : for cell and molecular biology 18, 185–93. Available at: http://www.ncbi.nlm.nih.gov/pubmed/10363370 [AccessedOctober 12, 2016].
Nevo, E. (2004). “Genomic diversity in nature and domestication,” in Diversity andEvolution of Plants. Genotypic and Phenotypic Variation in Higher Plants, ed. R.Henry (Wallingford, UK: CAB Publ CAB International), 287–316.
Nevo, E., and Beiles, A. (1989). Genetic diversity of wild emmer wheat in Israel andTurkey - Structure, evolution, and application in breeding. Theoretical and AppliedGenetics 77, 421–455. doi:10.1007/BF00305839.
Nevo, E., Beiles, A., Gutterman, Y., Storch, N., and Kaplan, D. (1984). “Geneticresources of wild cereals in Israel and vicinity. I. Phenotypic variation within andbetween populations of wild wheat, Triticum dicoccoides,” in Euphytica (Haifa),717–735.
Nevo, E., and Chen, G. (2010). Drought and salt tolerances in wild relatives for wheat
68
and barley improvement. Plant, cell & environment 33, 670–85.doi:10.1111/j.1365-3040.2009.02107.x.
Nevo, E., Golenberg, E., Beiles, A., Brown, A. H. D., and Zohary, D. (1982). Geneticdiversity and environmental associations of wild wheat, Triticum dicoccoides, inIsrael. Theoretical and Applied Genetics 62, 241–254. doi:10.1007/BF00276247.
Norouzi, M., Toorchi, M., Salekdeh, G. H., Mohammadi, S. A., Nishabouri, M. R., andAharizad, S. (2008). Effect of water deficit on growth, grain yield and osmoticadjustment in rapeseed. 6.
Oestreicher, G., Hogue, P., and Singer, T. P. (1973). Regulation of SuccinateDehydrogenase in Higher Plants: II. Activation by Substrates, Reduced CoenzymeQ, Nucleotides, and Anions. Plant physiology 52, 622–6. Available at:http://www.ncbi.nlm.nih.gov/pubmed/16658618 [Accessed June 25, 2016].
Orata, F. (2012). Advanced Gas Chromatography - Progress in Agricultural,Biomedical and Industrial Applications. , ed. M. Ali Mohd InTechdoi:10.5772/2518.
Paux, E., Sourdille, P., Salse, J., Saintenac, C., Choulet, F., Leroy, P., Korol, A.,Michalak, M., Kianian, S., Spielmeyer, W., et al. (2008). A physical map of the 1-gigabase bread wheat chromosome 3B. Science (New York, N.Y.) 322, 101–104.doi:10.1126/science.1161847.
Peleg, Z., Fahima, T., Abbo, S., Krugman, T., Nevo, E., Yakir, D., and Saranga, Y.(2005). Genetic diversity for drought resistance in wild emmer wheat and itsecogeographical associations. Plant, Cell and Environment 28, 176–191.doi:10.1111/j.1365-3040.2005.01259.x.
Peleg, Z., Saranga, Y., Krugman, T., Abbo, S., Nevo, E., and Fahima, T. (2008). Allelicdiversity associated with aridity gradient in wild emmer wheat populations. Plant,Cell and Environment 31, 39–49. doi:10.1111/j.1365-3040.2007.01731.x.
Pellegrineschi, A., Reynolds, M., Pacheco, M., Brito, R. M., Almeraya, R., Yamaguchi-Shinozaki, K., and Hoisington, D. (2004). Stress-induced expression in wheat ofthe Arabidopsis thaliana DREB1A gene delays water stress symptoms undergreenhouse conditions. Genome / National Research Council Canada = Genome /Conseil national de recherches Canada 47, 493–500. doi:10.1139/g03-140.
Peng, J. H., Sun, D., and Nevo, E. (2011a). Domestication evolution, genetics andgenomics in wheat. Molecular Breeding 28, 281–301. doi:10.1007/s11032-011-9608-4.
Peng, J., Sun, D., and Nevo, E. (2011b). Invited Review Article Wild emmer wheat ,Triticum dicoccoides , occupies a pivotal position in wheat domestication process.5, 1127–1143.
Philippe, R., Paux, E., Bertin, I., Sourdille, P., Choulet, F., Laugier, C., Simková, H.,Safář, J., Bellec, A., Vautrin, S., et al. (2013). A high density physical map ofchromosome 1BL supports evolutionary studies, map-based cloning andsequencing in wheat. Genome biology 14, R64. doi:10.1186/gb-2013-14-6-r64.
Poursarebani, N., Nussbaumer, T., Šimková, H., Šafář, J., Witsenboer, H., Van Oeveren,
69
J., Doležel, J., Mayer, K. F. X., Stein, N., and Schnurbusch, T. (2014). Whole-genome profiling and shotgun sequencing delivers an anchored, gene-decorated,physical map assembly of bread wheat chromosome 6A. Plant Journal 79, 334–347. doi:10.1111/tpj.12550.
Qin, F., Shinozaki, K., and Yamaguchi-Shinozaki, K. (2011). Achievements andchallenges in understanding plant abiotic stress responses and tolerance. Plant &cell physiology 52, 1569–82. doi:10.1093/pcp/pcr106.
Raats, D., Frenkel, Z., Krugman, T., Dodek, I., Sela, H., Simková, H., Magni, F.,Cattonaro, F., Vautrin, S., Bergès, H., et al. (2013). The physical map of wheatchromosome 1BS provides insights into its gene space organization and evolution.Genome biology 14, R138. doi:10.1186/gb-2013-14-12-r138.
Ramakrishna, A., and Ravishankar, G. A. (2011). Influence of abiotic stress signals onsecondary metabolites in plants. Plant signaling & behavior 6, 1720–31.doi:10.4161/psb.6.11.17613.
Rampino, P., Pataleo, S., Gerardi, C., Mita, G., and Perrotta, C. (2006). Drought stressresponse in wheat: physiological and molecular analysis of resistant and sensitivegenotypes. Plant, cell & environment 29, 2143–52. doi:10.1111/j.1365-3040.2006.01588.x.
Rauf, S., and Sadaqat, H. A. (2007). Effects of varied water regimes on root length, drymatter partitioning and endogenous plant growth regulators in sunflower (Helianthus annuus L.). Journal of Plant Interactions 2, 41–51.doi:10.1080/17429140701422512.
Redillas, M. C. F. R., Park, S.-H., Lee, J. W., Kim, Y. S., Jeong, J. S., Jung, H., Bang, S.W., Hahn, T.-R., and Kim, J.-K. (2012). Accumulation of trehalose increasessoluble sugar contents in rice plants conferring tolerance to drought and salt stress.Plant Biotechnology Reports 6, 89–96. doi:10.1007/s11816-011-0210-3.
Reynolds, M. P., and Condon, A. G. (2007). “Quantifying potential genetic gains inwheat yield using conceptual model of drought adaptation,” in Wheat productionin stressed environments, eds. H. T. Buck, J. E. Nisi, and N. Salomon (Dordrecht),331–340.
Richards, R. A., Rebetzke, G. J., Watt, M., Condon, A. G., Spielmeyer, W., andDolferus, R. (2010). Breeding for improved water productivity in temperatecereals: Phenotyping, quantitative trait loci, markers and the selection environment.Functional Plant Biology 37, 85–97. doi:10.1071/FP09219.
Rizhsky, L., Liang, H., Shuman, J., Shulaev, V., Davletova, S., and Mittler, R. (2004).When defense pathways collide. The response of Arabidopsis to a combination ofdrought and heat stress. Plant physiology 134, 1683–96.doi:10.1104/pp.103.033431.
Salekdeh, G. H., Reynolds, M., Bennett, J., and Boyer, J. (2009). Conceptual frameworkfor drought phenotyping during molecular breeding. Trends in Plant Science 14,488–496. doi:10.1016/j.tplants.2009.07.007.
Sanchez, D. H., Schwabe, F., Erban, A., Udvardi, M. K., and Kopka, J. (2012).
70
Comparative metabolomics of drought acclimation in model and forage legumes.Plant, cell & environment 35, 136–49. doi:10.1111/j.1365-3040.2011.02423.x.
Schnall, J. A., and Quatrano, R. S. (1992). Abscisic Acid Elicits the Water-StressResponse in Root Hairs of Arabidopsis thaliana. Plant physiology 100, 216–8.Available at: http://www.pubmedcentral.nih.gov/articlerender.fcgi?artid=1075540&tool=pmcentrez&rendertype=abstract [Accessed May 21, 2015].
Shannon, P., Markiel, A., Ozier, O., Baliga, N. S., Wang, J. T., Ramage, D., Amin, N.,Schwikowski, B., and Ideker, T. (2003). Cytoscape: A Software Environment forIntegrated Models of Biomolecular Interaction Networks. Genome Research 13,2498–2504. doi:10.1101/gr.1239303.
Sharma, S. S., and Dietz, K.-J. (2006). The significance of amino acids and amino acid-derived molecules in plant responses and adaptation to heavy metal stress. Journalof experimental botany 57, 711–26. doi:10.1093/jxb/erj073.
Shinozaki, K., and Yamaguchi-Shinozaki, K. (2007). Gene networks involved indrought stress response and tolerance. in Journal of Experimental Botany, 221–227. doi:10.1093/jxb/erl164.
Somers, D. J., Isaac, P., and Edwards, K. (2004). A high-density microsatelliteconsensus map for bread wheat (Triticum aestivum L.). TAG. Theoretical andapplied genetics. Theoretische und angewandte Genetik 109, 1105–14.doi:10.1007/s00122-004-1740-7.
Szabados, L., and Savouré, A. (2010). Proline: a multifunctional amino acid. Trends inplant science 15, 89–97. doi:10.1016/j.tplants.2009.11.009.
Tanaka, T., Kobayashi, F., Joshi, G. P., Onuki, R., Sakai, H., Kanamori, H., Wu, J.,Šimková, H., Nasuda, S., Endo, T. R., et al. (2014). Next-generation surveysequencing and the molecular organization of wheat chromosome 6B. DNAResearch 21, 103–114. doi:10.1093/dnares/dst041.
Tang, H., Sezen, U., and Paterson, A. H. (2010). Domestication and plant genomes.Current Opinion in Plant Biology 13, 160–166. doi:10.1016/j.pbi.2009.10.008.
Taylor, N. L., Heazlewood, J. L., Day, D. A., and Millar, A. H. (2004). Lipoic acid-dependent oxidative catabolism of alpha-keto acids in mitochondria providesevidence for branched-chain amino acid catabolism in Arabidopsis. Plantphysiology 134, 838–48. doi:10.1104/pp.103.035675.
Tester, M., and Langridge, P. (2010). Breeding technologies to increase crop productionin a changing world. Science (New York, N.Y.) 327, 818–822.doi:10.1126/science.1183700.
Tilman, D., Cassman, K. G., Matson, P. A., Naylor, R., and Polasky, S. (2002).Agricultural sustainability and intensive production practices. Nature 418, 671–677. doi:10.1038/nature01014.
Tretter, L., and Adam-Vizi, V. (2005). Alpha-ketoglutarate dehydrogenase: a target andgenerator of oxidative stress. Philosophical transactions of the Royal Society ofLondon. Series B, Biological sciences 360, 2335–45. doi:10.1098/rstb.2005.1764.
71
Turner, N. C. (1979). “Drought resistance and adaptation to water deficits in cropplants.,” in Stress physiology in crop plants, eds. H. Mussel and C. R. Staples (NewYork: John Wiley & Sons), 343–372.
Urano, K., Maruyama, K., Ogata, Y., Morishita, Y., Takeda, M., Sakurai, N., Suzuki, H.,Saito, K., Shibata, D., Kobayashi, M., et al. (2009). Characterization of the ABA-regulated global responses to dehydration in Arabidopsis by metabolomics. ThePlant journal : for cell and molecular biology 57, 1065–78. doi:10.1111/j.1365-313X.2008.03748.x.
Valliyodan, B., and Nguyen, H. T. (2006). Understanding regulatory networks andengineering for enhanced drought tolerance in plants. Current Opinion in PlantBiology 9, 189–195. doi:10.1016/j.pbi.2006.01.019.
Vartanian, N., Marcotte, L., and Giraudat, J. (1994). Drought rhizogenesis inarabidopsis thaliana (differential responses of hormonal mutants). Plant physiology104, 761–767. Available at: http://www.pubmedcentral.nih.gov/articlerender.fcgi?artid=159256&tool=pmcentrez&rendertype=abstract [Accessed May 21, 2015].
Vitulo, N., Albiero, A., Forcato, C., Campagna, D., Dal Pero, F., Bagnaresi, P.,Colaiacovo, M., Faccioli, P., Lamontanara, A., Šimková, H., et al. (2011). Firstsurvey of the wheat chromosome 5A composition through a next generationsequencing approach. PLoS ONE 6. doi:10.1371/journal.pone.0026421.
Wang, J., Qi, P., Wei, Y., Liu, D., Fedak, G., and Zheng, Y. (2010). Molecularcharacterization and functional analysis of elite genes in wheat and its relatedspecies. 89, 539–554.
Wang, J.-R., Wei, Y.-M., Long, X.-Y., Yan, Z.-H., Nevo, E., Baum, B. R., and Zheng, Y.-L. (2008). Molecular evolution of dimeric alpha-amylase inhibitor genes in wildemmer wheat and its ecological association. BMC evolutionary biology 8, 91.doi:10.1186/1471-2148-8-91.
Wang, M.-B., and Zhang, Q. (2009). Issues in using the WinRHIZO system todetermine physical characteristics of plant fine roots. Acta Ecologica Sinica 29,136–138. doi:10.1016/j.chnaes.2009.05.007.
Wang, R. R. C., and Lu, B. (2014). Biosystematics and evolutionary relationships ofperennial Triticeae species revealed by genomic analyses. Journal of Systematicsand Evolution 52, 697–705. doi:10.1111/jse.12084.
Wang, W., Vinocur, B., and Altman, A. (2003). Plant responses to drought, salinity andextreme temperatures: Towards genetic engineering for stress tolerance. Planta218, 1–14. doi:10.1007/s00425-003-1105-5.
Wang, Y., Xu, L., Shen, H., Wang, J., Liu, W., Zhu, X., Wang, R., Sun, X., and Liu, L.(2015). Metabolomic analysis with GC-MS to reveal potential metabolites andbiological pathways involved in Pb &Cd stress response of radish roots. Scientificreports 5, 18296. doi:10.1038/srep18296.
Warren, C. R., Aranda, I., and Cano, F. J. (2011). Metabolomics demonstrates divergentresponses of two Eucalyptus species to water stress. Metabolomics 8, 186–200.doi:10.1007/s11306-011-0299-y.
72
Wei, B., Jing, R., Wang, C., Chen, J., Mao, X., Chang, X., and Jia, J. (2008). Dreb1genes in wheat (Triticum aestivum L.): development of functional markers andgene mapping based on SNPs. Molecular Breeding 23, 13–22.doi:10.1007/s11032-008-9209-z.
Witcombe, J. R., Hollington, P. a, Howarth, C. J., Reader, S., and Steele, K. a (2008).Breeding for abiotic stresses for sustainable agriculture. Philosophical transactionsof the Royal Society of London. Series B, Biological sciences 363, 703–16.doi:10.1098/rstb.2007.2179.
Witt, S., Galicia, L., Lisec, J., Cairns, J., Tiessen, A., Araus, J. L., Palacios-Rojas, N.,and Fernie, A. R. (2012). Metabolic and phenotypic responses of greenhouse-grown maize hybrids to experimentally controlled drought stress. Molecular plant5, 401–17. doi:10.1093/mp/ssr102.
Xie, W., and Nevo, E. (2008). Wild emmer: genetic resources, gene mapping andpotential for wheat improvement. Euphytica 164, 603–614. doi:10.1007/s10681-008-9703-8.
Xiong, L., Wang, R.-G., Mao, G., and Koczan, J. M. (2006). Identification of droughttolerance determinants by genetic analysis of root response to drought stress andabscisic Acid. Plant physiology 142, 1065–74. doi:10.1104/pp.106.084632.
Yamaguchi, J. (2002). Measurement of root diameter in field-grown crops under amicroscope without washing. Soil Science and Plant Nutrition 48, 625–629.doi:10.1080/00380768.2002.10409248.
Zaher-Ara, T., Boroomand, N., and Sadat-Hosseini, M. (2016). Physiological andmorphological response to drought stress in seedlings of ten citrus. Trees 30, 985–993. doi:10.1007/s00468-016-1372-y.
73