Embed Size (px)
Citation preview
1/84
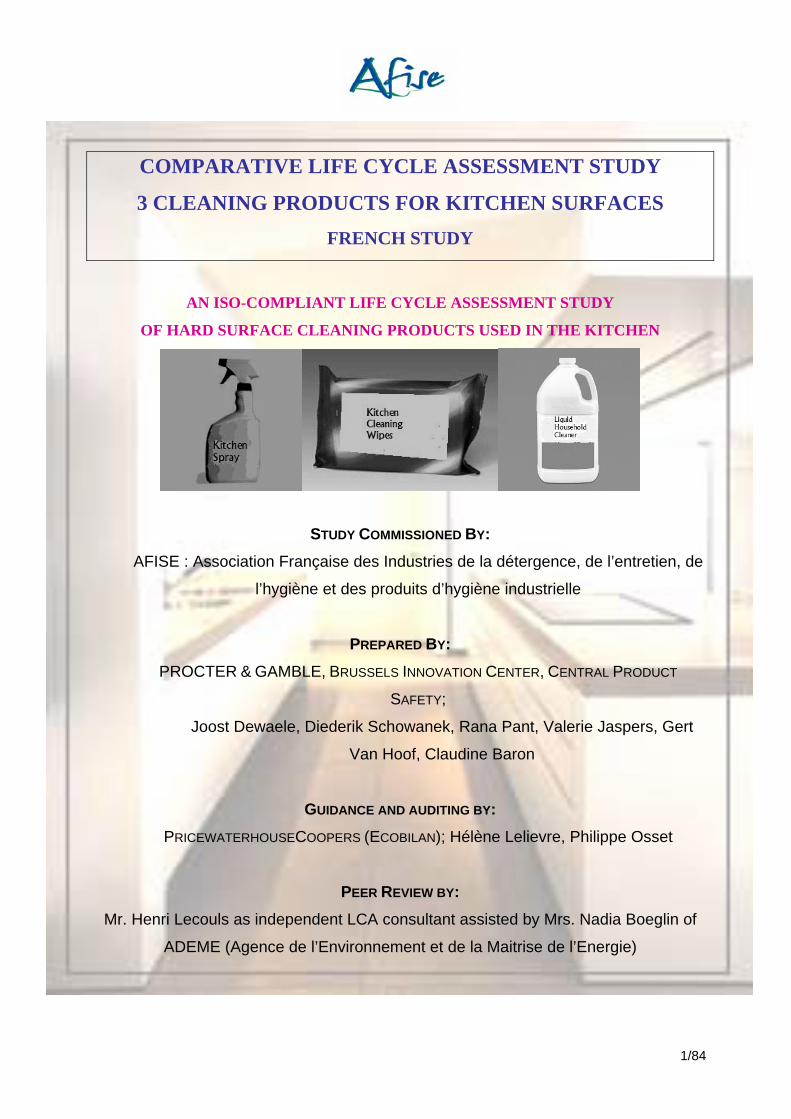
COMPARATIVE LIFE CYCLE ASSESSMENT STUDY
3 CLEANING PRODUCTS FOR KITCHEN SURFACES FRENCH STUDY
AN ISO-COMPLIANT LIFE CYCLE ASSESSMENT STUDY
OF HARD SURFACE CLEANING PRODUCTS USED IN THE KITCHEN
STUDY COMMISSIONED BY: AFISE : Association Française des Industries de la détergence, de l’entretien, de
l’hygiène et des produits d’hygiène industrielle
PREPARED BY: PROCTER & GAMBLE, BRUSSELS INNOVATION CENTER, CENTRAL PRODUCT
SAFETY;
Joost Dewaele, Diederik Schowanek, Rana Pant, Valerie Jaspers, Gert
Van Hoof, Claudine Baron
GUIDANCE AND AUDITING BY: PRICEWATERHOUSECOOPERS (ECOBILAN); Hélène Lelievre, Philippe Osset
PEER REVIEW BY: Mr. Henri Lecouls as independent LCA consultant assisted by Mrs. Nadia Boeglin of
ADEME (Agence de l’Environnement et de la Maitrise de l’Energie)

2/84
December 2004
Executive summary
Today, consumers are offered a range of product alternatives for regular maintenance of their hard
surfaces in the kitchen. Although these products are not used for identical cleaning exercises only, a
life-cycle-assessment (LCA) study was performed on three market relevant kitchen cleaning products:
kitchen cleaning wipes, kitchen cleaning spray and liquid household cleaner (LHC) product in a bottle.
An important driver for this study was the increased pan-European concern related to solid waste
generated by disposable (household) products.
Main methodological challenges for this study were the choices related to the functional unit (FU) and
the selection of relevant environmental indicators.
The FU was defined as ‘product used for 1 year of surface cleaning for one household (floors
excluded)’. For each product variant, the FU was based on actual consumer habits-and-practices
studies, subsequently recalibrated with sales figures relevant to France. Considering all variables and
making best use of the data available, 1 base scenario was identified to best represent the situation in
France.
The environmental evaluation was based on a broad set of 10 environmental indicators. This LCA
study evaluated in-depth the different waste aspects of the three product systems in a cradle-to-grave
perspective, with particular focus on household waste and total residual solid waste (after waste
treatment). In parallel to the waste parameters, primary energy and water consumption were selected
as life cycle inventory (LCI) based indicators. Climate change, acidification (air), photochemical smog
creation, human toxicity, aquatic eco-toxicity and eutrophication were evaluated as life cycle impact
assessment (LCIA) indicators.
The end result shows a mixed pattern for the base scenario, where none of the product systems
considered can be seen as environmentally superior on all indicators.
With regards to solid waste, the study confirms that spray or liquid household cleaner product produce
less household waste than wipes (spray produces 3 times less, LHC 6 times less household waste). It
should be noted however, that after treatment of the total solid waste with the current infrastructure in
France (i.e., in the true ‘cradle-to-grave’ sense), the difference in total residual solid waste left by the
three products becomes much smaller (spray and LHC produce 35% less compared to wipes).
With respect to resource consumption, the spray and wipe product are consuming significantly lower
water quantities (3 times) compared to LHC product (mix of dilute and pure use). This is directly linked
to the assumption on water consumption during the use phase. The spray product is consuming the
lowest amount of primary energy (26 and 48% less than wipes, LHC).
3/84
Life Cycle Impact Assessment (LCIA) indicators have shown no significant1 differences in the three
products for their potential contribution to climate change, air acidification and human toxicity.
Significant differences have been identified for the following impact categories:
-The study has revealed the household cleaner to be the most preferred systems with respect to its
potential contribution to photochemical oxidant formation (potential contribution of LHC is only 7% that
of the other 2 product alternatives).
-Environmental benefits for the wipe product were revealed with respect to lower contributions to
aquatic eco-toxicity (potential contribution is only 67% that of Spray and LHC).
-Furthermore, lower contribution of wipe product is noticed for its eutrophication potential, when
compared to both spray product (4 times that of wipes) and LHC (7 times that of wipes).
To evaluate both uncertainty in data and potential effects of alternative product design scenario’s, 10
sensitivity analyses have been performed on the most critical parameters in the study.
Although the sensitivity analyses significantly affect many of the environmental categories, the overall
conclusion that none of the products is overall environmentally superior (better in all environmental
categories) was always confirmed.
2 sensitivity analyses deserve particular interest. The first is related to uncertainty in product
equivalence (or how much spray and LHC product is required to perform the equivalent task of 1 wipe).
Due to data uncertainty in habits and practices studies, a sensitivity analyses was developed where one
assumes equal lotion volume requirement for all products. This extreme and penalizing-to-wipes
scenario would result in the wipe product alternative to score the worst on 7 and 8 indicators versus
LHC and spray product respectively.
A second scenario addressed the uncertainty in volume and temperature of the water used in the
cleaning phase of the LHC product. The available data, which was not specific to kitchen surfaces only,
was replaced by assumptions to develop another conservative-to-wipes sensitivity analysis. This
scenario did not change the conclusion that the LHC product remains the product with the highest water
consumption. It did however affect the energy consumption: rather than being the product alternative
that used the most energy, this scenario would predict LHC product users to use the least amount of
energy.
Further building on information retrieved from both the base scenario and the sensitivity analyses,
improvement opportunities were identified, which could be realized through changing consumer habits
(e.g. using less and colder water), and/or through improved eco-design of the products themselves (e.g.
refill bottles without trigger for the spray).
1 Differences in environmental indicators values > 20% are considered to be significant.

4/84
This LCA study has followed the guidelines as described by the ISO14040-series. The report contains
3 parts: a public report, public annexes, and a confidential annex containing product information
proprietary to Procter & Gamble. All parts have been made available to the peer review.
Key words⎯ eco-design, home care, household cleaning products, kitchen cleaning, life-cycle inventory, life-
cycle assessment, life-cycle impact assessment, liquid household cleaners, surfactants, spray, wipes.
5/84
Table of Content 1. Introduction .......................................................................................................................................................................8
1.1. Context of the Study.......................................................................................................................................................9
1.2. Structure and Use of the report ....................................................................................................................................10
2. Goal and Scope Definition .............................................................................................................................................11 2.1. Goal Definition..............................................................................................................................................................11
2.1.1. Definition of the Objectives..................................................................................................................................11
2.1.2. Parties Involved...................................................................................................................................................11
2.1.3. Indication that the study has been conducted following ISO 14040 series .........................................................12
2.2. Scope Definition ...........................................................................................................................................................13
2.2.1. Products description............................................................................................................................................13
2.2.2. Temporal coverage..............................................................................................................................................14
2.2.3. Geographical coverage .......................................................................................................................................14
2.2.4. Technology coverage ..........................................................................................................................................14
2.2.5. Coverage of environmental indicators.................................................................................................................15
2.2.5.1. Solid waste parameters................................................................................................................................ 15
2.2.5.2. Indicators related to water and energy resource usage ............................................................................... 16
2.2.5.3. Life Cycle Impact Assessment Categories................................................................................................... 16
2.3. Functional Unit..............................................................................................................................................................17
2.3.1. Description of the Functional Unit .......................................................................................................................17
2.3.2. Reference Flows..................................................................................................................................................17
2.4. System Boundaries ......................................................................................................................................................19
2.4.1. Economy-environment system boundary: Flow diagrams...................................................................................19
2.4.2. Unit Processes excluded from the life cycle assessment....................................................................................23
2.4.3. Allocation (boundaries with other systems).........................................................................................................24
2.4.4. Modeling of energy recovery and recycling.........................................................................................................24
2.4.5. Calculation software ............................................................................................................................................24
2.5. Critical review considerations.......................................................................................................................................24
3. Life Cycle Inventories.....................................................................................................................................................25 3.1. Data sources and main assumptions ...........................................................................................................................25
3.1.1. Data sources related to Energy and Transport ...................................................................................................25
3.1.2. Data sources related to packaging and wipe materials production .....................................................................27
3.1.3. Data sources for chemical product ingredients ...................................................................................................28
3.1.4. Data sources for wipe manufacturing..................................................................................................................28
3.1.5. Distribution phase................................................................................................................................................28
3.1.6. Use phase ...........................................................................................................................................................29
3.1.7. End-of-life treatment ............................................................................................................................................30
3.1.7.1. Waste infrastructure in France: .................................................................................................................... 31
1323.1.7.2. Energy recovery ....................................................................................................................................... 32
3.1.7.3. Material recycling.......................................................................................................................................... 33
3.2. Results of the Life Cycle Inventories ............................................................................................................................33
3.2.1. Overview of results (see Annex 5) ......................................................................................................................33
3.2.2. Calculation with respect to indoor air emissions of VOC.....................................................................................34
3.3. Environmental indicators based on LCI values ............................................................................................................35
3.3.1. Waste indicators..................................................................................................................................................35
3.3.2. Resource indicators.............................................................................................................................................35

6/84
4. Life Cycle Impact Assessment ......................................................................................................................................36 4.1. Comparison of three product systems..........................................................................................................................36
4.2. LCIA for Wipe product system......................................................................................................................................37
4.3. LCIA for Spray product system ....................................................................................................................................37
4.4. LCIA for LHC product system.......................................................................................................................................37
5. Interpretation...................................................................................................................................................................38 5.1. Contribution analysis ....................................................................................................................................................38
5.1.1. Waste throughout the kitchen cleaning life-cycle ................................................................................................38
5.1.1.1. Summary of the results................................................................................................................................. 38
5.1.1.2. Interpretation ................................................................................................................................................ 39
5.1.2. Resource consumption parameters ....................................................................................................................41
5.1.2.1. Water consumption over the life cycle.......................................................................................................... 41
5.1.2.2. Primary Energy consumption over the life cycle .......................................................................................... 42
5.1.3. Life Cycle Impact Assessment ............................................................................................................................43
5.1.3.1. Summary of results....................................................................................................................................... 43
5.1.3.2. Interpretation ................................................................................................................................................ 44
5.1.4. Summary .............................................................................................................................................................45
5.2. Sensitivity analyses and simulations ............................................................................................................................47
5.2.1. Equivalent product consumption .........................................................................................................................47
5.2.2. Temperature and volume of water consumed in the use phase .........................................................................49
5.2.2.1. Low water volume used in cleaning phase of LHC ...................................................................................... 49
5.2.2.2. Cold water for LHC during cleaning ............................................................................................................. 51
5.2.2.3. Warm water usage for rinsing ...................................................................................................................... 52
5.2.2.4. Energy source for heating of water .............................................................................................................. 53
5.2.3. Percentage of lotion that evaporates from wipes (during use and in the bin) .....................................................55
5.2.3.1. Full evaporation of wipe lotion...................................................................................................................... 55
5.2.3.2. Zero evaporation of wipe lotion .................................................................................................................... 56
5.2.4. Wipe material.......................................................................................................................................................57
5.2.4.1. Energy requirement for the cellulosic fiber making process:........................................................................ 57
5.2.4.2. Ratio of Polypropylene to cellulose based material...................................................................................... 58
5.2.5. Spray Refill bottles ..............................................................................................................................................59
5.2.6. Summary of the Sensitivity analyses...................................................................................................................60
5.3. Assumptions and uncertainty .......................................................................................................................................65
5.4. Limitations of the study.................................................................................................................................................66
6. Conclusions ....................................................................................................................................................................67 6.1. Product comparison based on the base scenario ........................................................................................................67
6.2. Conclusions from the sensitivity analyses....................................................................................................................68
6.3. Potential improvement areas with respect to consumer habits ....................................................................................70
6.4. Potential improvement areas for development of future products................................................................................71
7. Critical review performed by Mr. Henri Lecouls, assisted by ADEME.......................................................................72
7/84
Annexes
ANNEXES PUBLICALLY AVAILABLE:
Annex 1: Life Cycle Impact assessment methodologies (3pages)
Annex 5: Life Cycle Inventories of the three product systems (41pages)
Annex 9: Calculation method of energy usage and environmental emissions of the waste water treatment plants (8 pages)
Annex 10: Landfill of household waste with leachates and landfill gas treatment (5 pages)
Annex 11: Revue critique de l’ ACV comparative de trois produits de nettoyage domestique (8 pages)
CONFIDENTIAL ANNEXES - AVAILABLE FOR THE PEER REVIEW:
Annex 2: Product Formulation / Package definitions (8pages)
Annex 3: Description of kitchen cleaning Habits & Practices (5pages)
Annex 4: Wipe evaporation profile (2pages)
Annex 6: Wipe manufacturing (5 pages)
Annex 7: Process flow charts (3 pages)
Annex 8: Life cycle inventories for chemical ingredients (2 pages)
List of Figures
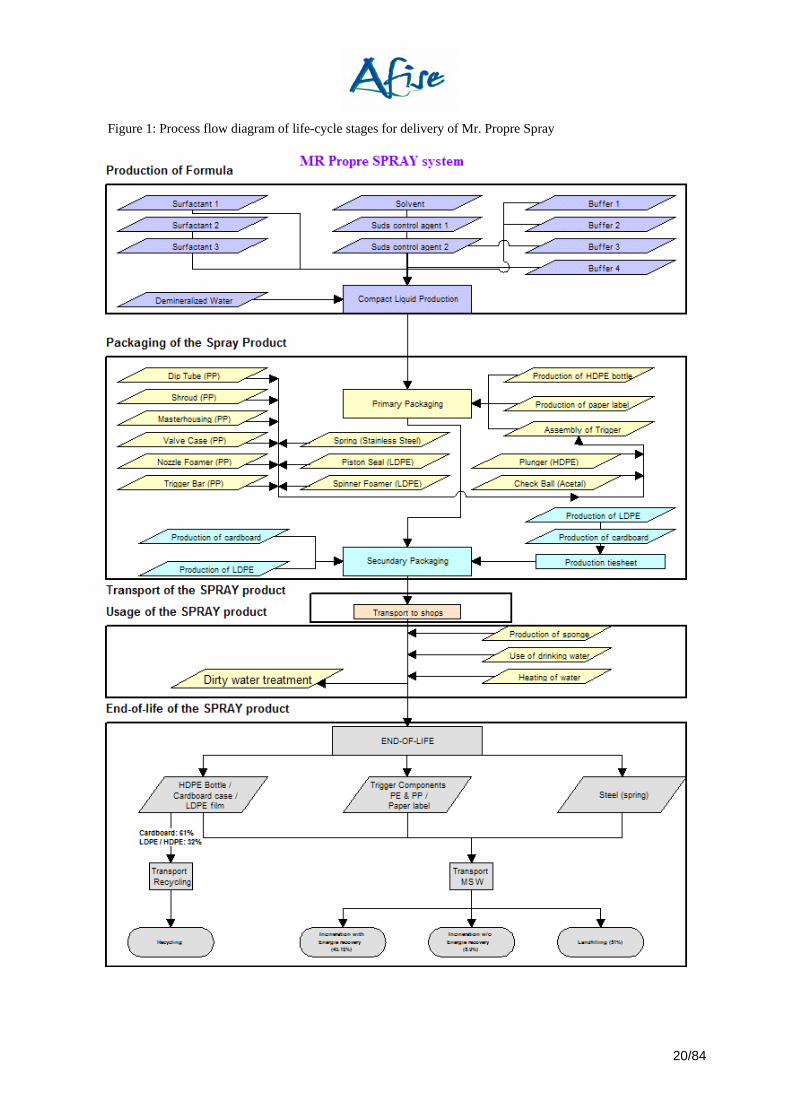
Figure 1: Process flow diagram of life-cycle stages for delivery of Mr. Propre Spray ....................................................................20
Figure 2: Process flow diagram of the life-cycle stages for delivery of Mr. Propre Wipes..............................................................21
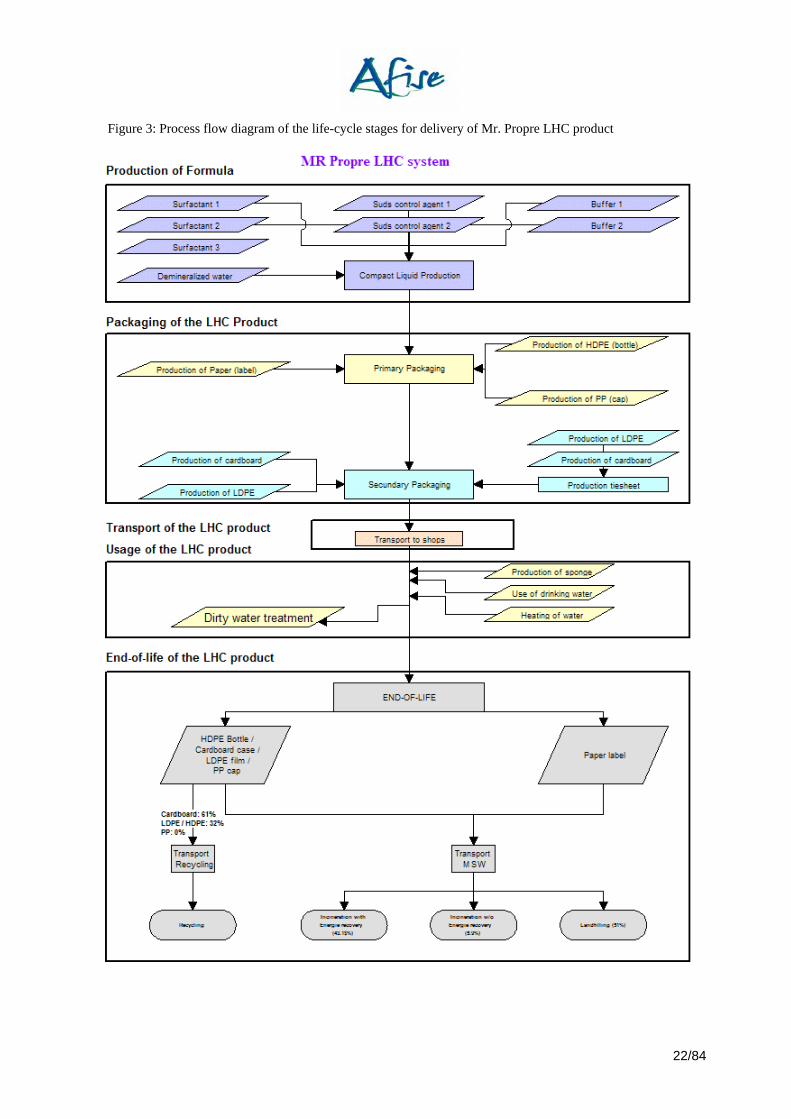
Figure 3: Process flow diagram of the life-cycle stages for delivery of Mr. Propre LHC product ...................................................22
Figure 4: Consideration of energy recovery for incinerated waste .................................................................................................33
Figure 5: Recycling modeling .........................................................................................................................................................33
Figure 9: Relative environmental impact of three assessed product systems ...............................................................................44
Figure 10: Sensitivity analysis: effect of alternative product consumption scenario.......................................................................48
Figure 11: Sensitivity analysis: effect of cold water cleaning water................................................................................................51
Figure 12: Sensitivity analysis: Effect of warm water rinse ............................................................................................................53
Figure 14: Sensitivity analysis: Effect of full evaporation ...............................................................................................................56
Figure 15: Sensitivity analysis: Effect of zero evaporation .............................................................................................................57
Figure 16: Sensitivity analysis: Effect of increased energy consumption.......................................................................................58
Figure 17: Sensitivity analysis: Effect of refill bottles for spray product..........................................................................................58
8/84
List of Tables
Table 1: Product information: three kitchen cleaning products assessed ......................................................................................13
Table 2: Overview of the selected environmental indicators ..........................................................................................................15
Table 3: Product consumption based on Habits & Practices study................................................................................................18
Table 4: Product consumption scaled to sales numbers for the functional unit & rinsing habits....................................................18
Table 5: Unit Processes excluded from the life cycle assessment.................................................................................................23
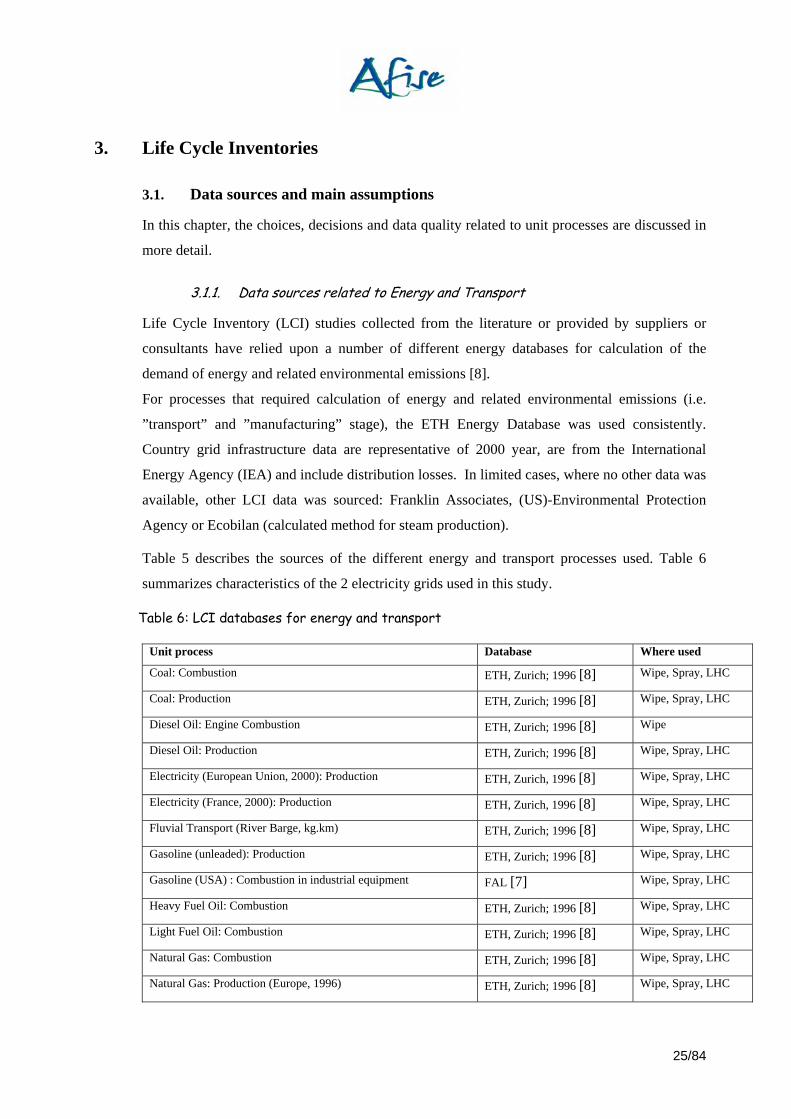
Table 6: LCI databases for energy and transport ...........................................................................................................................25
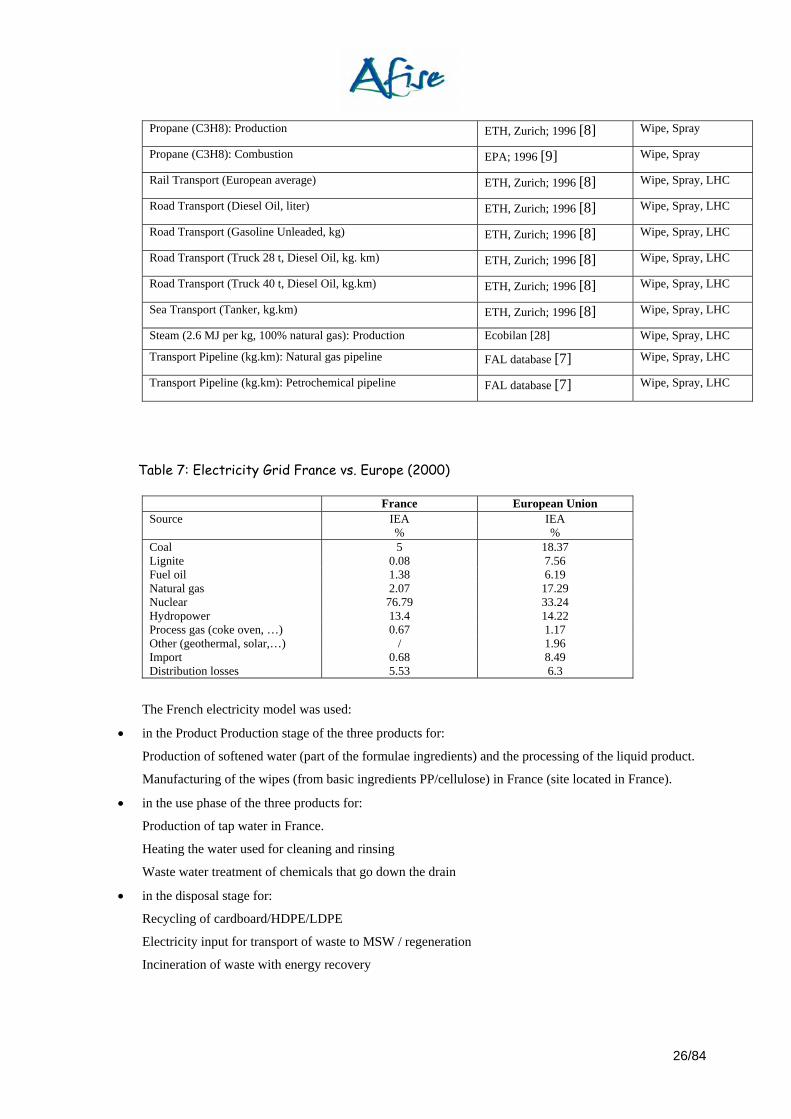
Table 7: Electricity Grid France vs. Europe (2000) ........................................................................................................................26
Table 8: LCI databases for production of materials........................................................................................................................27
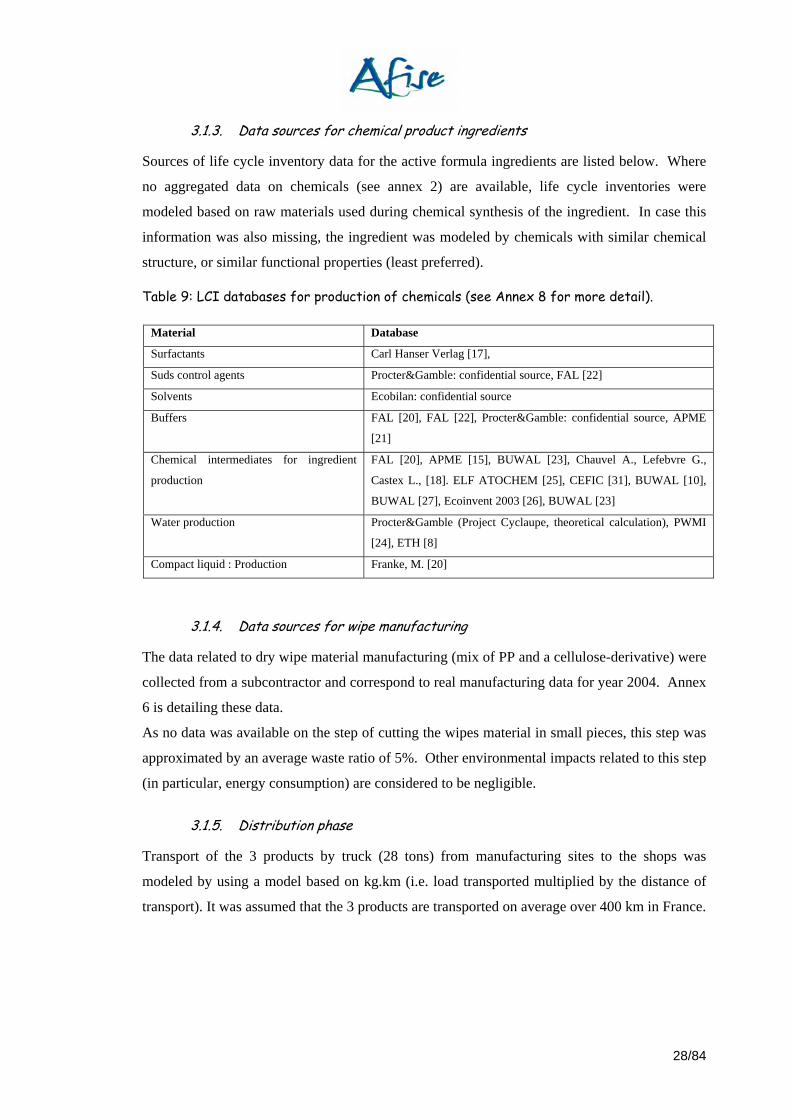
Table 9: LCI databases for production of chemicals (see Annex 8 for more detail).......................................................................28
Table 10: LCI databases for end-of-life ..........................................................................................................................................31
Table 11: Recycling rates ...............................................................................................................................................................32
Table 12: Treatment of Municipal Solid Waste...............................................................................................................................32
Table 13: Inventory of maximum VOC's released into the environment during the use phase only ..............................................34
Table 14: Total LCIA for 1 year of kitchen cleaning in France (Wipes vs. Spray vs. LHC) ............................................................36
Table 15: LCIA for Wipes: contribution per life cycle stage............................................................................................................37
Table 16: LCIA for Spray: contribution per life cycle stage ............................................................................................................37
Table 17: LCIA for LHC: contribution per life cycle stage...............................................................................................................37
Table 18: Waste produced during 1 year of kitchen cleaning in France per household.................................................................39
Table 19: Total Residual solid waste throughout the life-cycle stages...........................................................................................39
Table 20: Relative water consumption throughout the kitchen cleaning life cycle .........................................................................41
Table 21: Relative energy consumption throughout the kitchen cleaning life cycle .......................................................................42
Table 22: Absolute LCIA values for 1 year of kitchen cleaning with 3 alternative product systems...............................................43
Table 23: comparison of three product systems (compared to the average impact value)............................................................46
Table 24: alternative scenario for product consumption.................................................................................................................47
Table 25: Sensitivity analysis: Absolute indicator values ...............................................................................................................48
Table 26: Water volume and temperature sensitivity analysis .......................................................................................................49
Table 27: Sensitivity analysis: Absolute indicator values ...............................................................................................................50
Table 28: Sensitivity analysis: Overview table ...............................................................................................................................50
Table 29: Sensitivity analysis: Absolute indicator values ...............................................................................................................51
Table 30: Sensitivity analysis: Absolute indicator values ...............................................................................................................52
Table 31: Sensitivity analysis: Absolute indicator values ...............................................................................................................54
Table 32: evaporation scenarios subject to sensitivity analysis .....................................................................................................55
Table 33: Sensitivity analysis: Absolute indicator values ...............................................................................................................55
Table 34: Sensitivity analysis: Absolute indicator values ...............................................................................................................56
Table 35: Sensitivity analysis: Absolute indicator values ...............................................................................................................57
Table 36: Sensitivity analysis: absolute indicator values................................................................................................................58
Table 37: Sensitivity analysis: absolute indicator values................................................................................................................60
Table 38: Comparison of the averaged sensitivity analysis to base scenario results ....................................................................61
Table 39: Minimum category values for the 10 SA's and the corresponding scenario...................................................................61
Table 40: Maximum category values for the 10 SA's and the corresponding scenario..................................................................61
Table 41: Clarification of the corresponding sensitivity analysis ....................................................................................................61
Table 42: Overview of the 10 SA's and the changed variables ......................................................................................................64
Table 43: Overview of main assumptions in the study ...................................................................................................................65
Table 44: Potential development areas for three compared kitchen cleaning products.................................................................71
1

9/84
Introduction
1.1. Context of the Study
Today, wipes are present on the consumer goods market in a wide variety of executions (e.g. baby care,
home care, fabric care, personal hygiene, facial care, deodorants, etc…). These products are developed
based on a specific consumer interest and therefore provide a set of benefits not matched by product
alternatives. This study was focused on wipes used for cleaning of kitchen surfaces, excluding cleaning
of floor surfaces.
The fundamental consumer need in the surface cleaning category is, and always has been, better end
results with less effort. The recognition that this can be achieved beyond just the chemistry of the
cleaner, as it is the case for the sprays introduced a few years ago, is now driving the penetration of non-
woven substrates. Thanks to the combination of non-woven substrates together with the industry’s
traditional expertise in chemistry, the consumer is now being presented with solutions to his / her
cleaning needs: reduced job complexity, versatility of the use, convenience, hygiene, less effort and
better end results.
A typical aspect of wipes is the limited number of uses (single or a few), and disposal to the grey (i.e.
non-recycled) fraction of the household solid waste. Because of an increased awareness and concern
for solid waste generated in European countries, it is important to develop a good understanding of the
solid waste aspect, and even more importantly a broad picture of the entire environmental fingerprint of
wipes in comparison with more conventional product alternatives.
Life Cycle Assessment (LCA), as a reputed environmental tool, can provide more insight into the different
dimensions of the environmental profile of products, processes and services. It is highly suitable to
compare potential environmental impacts of alternative product options. In combination with societal and
economic considerations, LCA can be used to assess the sustainability of a product.
Procter & Gamble is routinely executing LCA studies on its main products and technologies, with the aim
of developing a thorough environmental understanding and to guide product design towards solutions
with reduced environmental impacts. This comparative ISO LCA study on kitchen cleaning was
developed for AFISE, based on an existing study developed in 2003 by the P&G ETC LCA Team. The
LCA consultant bureau Ecobilan-PwC was involved by AFISE in the study to coach and audit the LCA
model and database selection, and to provide the most suitable and up-to-date datasets for France, as to
best represent the market situation.
10/84
1.2. Structure and Use of the report
First part of the document is the overall study report. It comprises the background of the study along with
the study itself in accordance with the guidelines as described by ISO 14040 series, i.e. Goal and Scope
definition, Inventory Analyses, Life Cycle Impact Assessment and Interpretation of the results.
The Second part of the study comprises a series of Annexes as referred to in the study report. This
complementary information is provided to both peer reviewer and the public audience (Annex 1, 5, 9, 10,
11).
A Third part of the report is a series of Annexes that provides detailed technical information with respect
to product formulation and consumer habits of the tested products. As being part of Procter & Gamble’s
Intellectual Property, this information is not disclosed to the public audience. All information herein
described however, is accessible to persons involved in the peer review process (Annex 2, 3, 4, 6, 7, 8).
The LCA study report and disclosed annexes are publicly accessible via AFISE under conditions as laid
out in a separate agreement between AFISE and Procter & Gamble EUROCOR.
11/84
2. Goal and Scope Definition
2.1. Goal Definition
2.1.1. Definition of the Objectives
The objective of this study is to quantify the potential environmental impacts of various kitchen
cleaning products (floors excluded) in France relative to one another.
The results of this in depth LCI and LCIA analysis are intended to provide broad perspective on
environmental information to an audience including product designers, the detergent sector
management, suppliers, interested consumers and non-governmental organizations.
This study can be used to outline the differences in environmental profile associated with the
choice of a certain product type, the relevance of its underlying processes as well as to identify
key improvement areas.
The strength of LCA is in providing a way of evaluating the entire life cycle of products
covering multiple environmental indicators, rather than to focus on one single aspect of interest.
Thus, a problem shifting from one environmental area to another can be identified and tackled.
2.1.2. Parties Involved
This ISO-compliant LCA study was performed on behalf of the French Detergent Industry
Association (AFISE), as a response to a number of media articles on waste related to wipes
usage. The information contained in the LCA can be used to further analyze the sustainability
proposition of different product categories.
Member companies of AFISE were involved in the study design, and support the outcome as
generally representative for the market of wipes, sprays and Classical Liquid Household
Cleaners in France.
The present report was released in december 2004. Summary of parties involved:
• LCA commissioner: French Detergent Industry Association (AFISE); represented by
Ms. Claude Perrin.
• LCA Researchers: Procter & Gamble Eurocor, Temselaan, B-1853 Strombeek-Bever,
Belgium. The study was performed by following members of the LCA-team: Joost
Dewaele, Rana Pant, Gert Van Hoof and Valerie Jaspers under the supervision of
Diederik Schowanek. Procter&Gamble has a long history in using LCA for product
support. Different environmental scientist of P&G have contributed to development of
the ISO-guidelines, and have developed strong links with SETAC (Society for
Environmental Toxicology and Chemistry).
12/84
• Study coaching and auditing: Ecobilan-PricewaterhouseCoopers LCA consultants Ms.
Helene Lelievre and Mr. Philippe Osset have provided guiding support (methods,
databases, assumptions, system boundaries, etc.), review and quality assurance.
• Critical Review, as recommended by ISO guidelines [3]: Mr. Henri Lecouls, former
employee of ATOCHEM, now acting as a free consultant, also actively involved in
development of ISO14040 standards. Reviewer was further assisted by Mrs. Nadia
Boeglin of ADEME (Agence de l’Environnement et de la Maitrise de l’Energie)
Target audience: non-governmental organizations, product designers of AFISE member
companies, interested consumers, supplier companies.
2.1.3. Indication that the study has been conducted following ISO 14040 series
Since the publication of the Society of Environmental Toxicology and Chemistry code-of-
conduct [1] LCA standardisation has taken place within ISO with the 14040 series [2-5]. This
report has been conducted following these ISO guidelines.
Life-Cycle Assessment (LCA) is a systematic set of procedures for compiling and examining
the inputs and outputs of materials and energy and the associated environmental impacts
directly attributable to the functioning of a product or service system throughout its life cycle.
The series include: ISO 14040:1997: Environmental management -- Life cycle assessment -- Principles and
framework ISO 14041:1998: Environmental management -- Life cycle assessment -- Goal and scope
definition and inventory analysis
ISO 14042:2000: Environmental management -- Life cycle assessment -- Life cycle impact
assessment
ISO 14043:2000: Environmental management -- Life cycle assessment -- Life cycle
interpretation
ISO/TR 14047:2003: Environmental management -- Life cycle impact assessment --
Examples of application of ISO 14042
ISO/TS 14048:2002: Environmental management -- Life cycle assessment -- Data
documentation format
ISO/TR 14049:2000: Environmental management -- Life cycle assessment -- Examples of
application of ISO 14041 to goal and scope definition and inventory analysis

13/84
2.2. Scope Definition
The scope of the study is to perform a comparative life cycle assessment of 3 alternative
cleaning products & their respective methods used to clean identical kitchen cleaning surfaces
in France (floor cleaning excluded).
2.2.1. Products description
The following three product alternatives are representative for the overall French kitchen
cleaning market in 2004: (for more details, see Annex 2,3)
Table 1: Product information: three kitchen cleaning products assessed
Product Spray Wipes Liquid Household Cleaner
Picture
French 2003 sales per category [36]
23.6% 24.4% 39.9%
Brand evaluated (Market share in France 2004) [37]
Mr. Propre (ranked as number 4
in France)
Mr. Propre (number 1 in France)
Mr. Propre (ranked as number 2 in
France) Product variant (package with highest sales in France)
Kitchen Spray (500ml Spray Bottle)
Kitchen wipes (Refill pack : 30 wipes, 1 wipe =
450cm2)
LHC Lemon (1.5 Liter bottle)
Ingredients (labeled)
520g product <5% anionic surfactant, nonionic surfactant, soap
334.5g product <5% amphoteric surfactant
1520g product Anionic surfactant, soap, <5%
nonionic surfactant, preservative
Materials used • Primary Packaging =mix 37.5g HDPE/ 0.7g paper/ 21.5g PP/ 1.1g LDPE/ 0.0023g acetal/
0.9g Steel • Secondary +Tertiary
Packaging =mix 31,18g cardboard 0.49g LDPE
• Wipe non-woven =mix 50.22g PP-33.48g cellulose
• Primary Packaging =mix 1.37g PET / 0.34g PP /
6.79g PE • Secondary +Tertiary
Packaging =mix 39.2g cardboard 0.52g LDPE/
• Primary Packaging =mix 78g HDPE/ 2,6g paper/
6,2g PP • Secondary +Tertiary
Packaging =mix 51,6g cardboard 0.81g LDPE
Water Usage in cleaning habits
No water used for cleaning
No water used for cleaning
3,93L of water used for cleaning @ 41,5°C
30% of the product users2
Water Usage in rinse habits
1L of water used during rinsing step @ 12°C (cold tap
water) 48% of product users
1L of water used during rinsing step @ 12°C (cold tap water)
9% of product users
1L of water used during rinsing @ 12°C (cold tap water)
70% of product users
2 70% of the consumers that use LHC, rinse their kitchen surfaces with cold water after the cleaning job. This
percentage is very close to the number of people that use neat (undiluted) product for cleaning (75%). Those 30% of
consumers that do not rinse, very often use heated water during the cleaning job.
14/84
Although owned and commercialized by Procter & Gamble, it was agreed within the French
Detergent Industry Association (AFISE) that these products can be considered representative of
the French market and its member companies (Colgate- Palmolive, Eau Ecarlate, Lever
Fabergé and Reckitt Benckiser,…) for the purpose of the LCA. Product groups that represent a
low market share i.e. gels, creams, powders, paste and dishwashing liquids (total share of
12.1%), are not considered to be relevant for this study.
2.2.2. Temporal coverage
Because of inherent limitations of LCA with regards to data availability and quality, results are
showing the energy and material flows as well as potential environmental impacts of the
situation at the time the study was performed. Next to ever changing life-cycle-inventory data
sets on energy market, end-of-life treatments and manufacturing processes, the main factors of
impact or those related to consumer habits and changing product design. Although it seems
reasonable to estimate time-frame for the study to be valid throughout the next 2-3 years, it
needs to be considered at all times whether the packaging materials, formula ingredients and/or
consumption patterns are still relevant at time of interest. Most relevant consumer studies were
performed in between 2000-2003. Material choices and formula ingredients were based on
2004 data. All information on data sources is capture in Annex 2&3.
2.2.3. Geographical coverage
Given that a number of processes covered within the system boundaries are very particular to
France, e.g. recycling rates, municipal solid waste treatment and transport distances, the overall
study is only valid for France. Although these processes are not the main drivers of
environmental impact, extrapolations to other countries is not recommended without revision of
the input data. Although predominantly sourced in France, some of the data with respect to
consumer habits were based on studies performed in United Kingdom. As consumer habits are
not expected to differ too much within these countries, this is not considered as a main concern.
More information is to be found in annex 2&3.
2.2.4. Technology coverage
The comparison of three alternatives is based on selected cleaning products from the
Procter&Gamble Company (see Table 1). Chemical ingredients and packaging materials are
based on those used for the 2004 product formulations and package definition of the “Liquid
15/84
Household Cleaner” variant. As the “LHC” variant is the most widely used product for this
usage & function -and since the brands used represent a significant market share all 3 products
are considered to be representative for the French market in 2004. Technical information on
package definitions and formulae ingredients is described in Annex 2.
2.2.5. Coverage of environmental indicators
In order to inform a broad audience, a wide set of environmentally relevant indicators was
selected. As these indicators are considered to be of different nature, they were separated in 3
indicator groups. For calculation and interpretation, this study followed the structure of the
Handbook of life cycle assessment [38]. Following table gives an overview of the selected
indicators:
Table 2: Overview of the selected environmental indicators
Indicator Group Indicator Calculation Interpretation
Waste indicators Household Waste
Total Residual Solid Waste
(Total Solid Waste)
(Packaging Waste)
Chapter 3.2 Chapter 5.1.1
Resource indicators Total Water Consumption
Total Primary Energy Consumption
Chapter 3.2 Chapter 5.1.2
Chapter 5.1.3
Life Cycle Impact
indicator
Climate Change
Air Acidification
(Ozone Depletion)
Photochemical Smog
Human Toxicity
Aquatic Eco-toxicity
Eutrophication
Chapter 4 Chapter 5.1.4
(indicator): these indicators are calculated but not further referred to in the interpretation. Explanation is given in chapter 5.
2.2.5.1. Solid waste parameters
During the practice of kitchen cleaning, waste is being produced in all different life cycle
stages. Some of the solid waste produced is rather obvious in the eyes of the consumers, like
the solid waste produced after the use phase; i.e. empty packages and discarded wipes. Other
types of solid waste are very real but less apparent, like the solid waste (ashes) from the
production of electricity, combustion of fuel, or the solid waste produced during the waste water
treatment (sludge).
For the interpretation of this study regards to the impact on the solid waste handling or the
environment it is important to distinguish these waste definitions. The following four solid
waste parameters of the three product categories were calculated and evaluated:

16/84
• Household waste (kg): The amount of solid waste that is produced at the consumer’s
home during use and disposal of the products. The volume or weight of this waste may
have an impact on the financial contribution the households need to pay with regards to
waste collection, and is therefore very relevant. It includes the weight of the primary
packaging, the wipe material and the polyurethane sponge.
• Total residual solid waste (kg): The actual amount of total solid waste after treatment
that is released back into the environment system after recycling and incineration of all
forms of solid waste produced during the entire life cycle. This represents the amount
of solid waste in a true ‘cradle to grave’ sense.
• Total solid waste (kg): The total amount of solid waste produced before recycling and
treatment. It includes the household waste from the use stage (which is handled by the
consumers) plus the industrial process waste produced during the life cycle stages
preceding the use phase and sludge (both usually not “visible” to the consumers).
• Packaging waste (kg): This includes the total weight of primary, secondary and
transport packaging materials equivalent to the functional unit. A part of packaging
waste is accounted for as household waste as well.
2.2.5.2. Indicators related to water and energy resource usage
Beyond this information retrieved from life cycle impact assessment methods, other key
environmental information is retrieved through relevant life cycle inventory data like energy
and water consumption (as these are indicative for resource use efficiency).
2.2.5.3. Life Cycle Impact Assessment Categories
Intent is to provide a wide perspective environmental fingerprint of related products by
calculating the results for a relevant mix of environmental indicators, i.e. air acidification,
climate change, photochemical smog, ozone depletion, eutrophication, human and aquatic
toxicity (= the baseline impact categories as referred in the Handbook on Life Cycle
Assessment [38] except for “Impact of land use”). For the methodologies used and emissions
accounted for, see Annex 1.
17/84
2.3. Functional Unit
2.3.1. Description of the Functional Unit
• The function studied in the LCA is that of kitchen surface cleaning.
• The functional unit is therefore defined as “1 year of kitchen cleaning in France for 1
household”, cleaned in such a way that an independent panel would judge the kitchen
to be sufficiently clean and fresh. (This definition of cleanliness may be different from
the average cleanliness of an average French kitchen).
• The functional unit covers cleaning involves cleaning of all kitchen hard surfaces, but
excludes floor (since this requires other product types/cleaning methods). Hence,
included are worktop, cooker top, kitchen cabinets, freezer, refrigerator, micro-wave,
kitchen table, kitchen sink, wall tiles and cooker hood.
• In order to perform a comparative LCA, the 3 product variants are assumed to perform
identical household tasks. Taking this approach does not imply that wipes, spray of
LHC are substitutes for all type of cleaning jobs. Occasionally, -particularly when used
neat- LHC is used for heavier cleaning jobs compared to wipes.
• Because of different cleaning ingredients and cleaning habits, cleaning performance of
the 3 compared products is not necessarily absolutely technically identical. Hence, the
type of dirt (particulate matter, food stains, grease, etc…) cleaned with each of the 3
products may be slightly different but was used as the functional unit due to absence of
more reliable data. A small performance difference is not considered a problem for the
study since consumer research has shown that with all product types the kitchen is
perceived as sufficiently clean and hygienic. .
2.3.2. Reference Flows
Reference flows for the described functional unit are required for both the cleaning and rinsing
habits. Reference flows for cleaning habits are based on the amount of products consumed over
one year. Estimated product consumption numbers are taken as basis for comparing kitchen
cleaning for the chosen functional unit. Product consumption estimates are primarily sourced
through the Product Research Departments within Research & Development Organizations.
This information is retrieved through placing of products in consumer homes (Annex 3 details
the so-called Habits & Practices studies). Table 3 describes these product consumption
estimates.

18/84
Table 3: Product consumption based on Habits & Practices study
Product Consumption per household3 Wipes Spray LHC + Bucket
Habits & Practices: product used / week 13 wipes 216 ml 208 ml
Product usage scaled relative to 1 wipe 1 wipe 16,6ml 16,0ml
Herein, the estimated weekly product consumption is an overestimation of the real-life product
consumption pattern since products are given for free in the tests. However, as the
overestimation is considered equal for a product with similar function, the relative product
consumption can be considered as accurate.
In order to re-scale to actual product consumption in the market, we need to take into account
actual sales numbers. As we know the LHC bottle product is being used beyond the scope of
kitchen cleaning only, we cannot estimate the actual consumption based on sales numbers for
this product. The wipes however are mainly used in kitchen only (except for bathroom wipes
which are not taken into account). As sales numbers in France correspond to usage of 7
wipes/(week.household) amongst wipe users, all other numbers (spray and LHC) are scaled
relative to this number (i.e. for a full replacement scenario).
Reference flows for rinsing habits show the number of rinses performed per 100 cleaning jobs
(%). This number is also based on P&G habits and practices studies.
Table 4: Product consumption scaled to sales numbers for the functional unit & rinsing habits
Product Consumption per Wipes Spray LHC Consumption scaled to wipe sales/yr 365 wipes/yr 6049 ml/yr 5840 ml/yr
Expressed in volume units/yr4 4070 ml/yr 6049 ml/yr 5840 ml/yr
Rinsing habits (rinses per 100 jobs) 9% 48% 70%
To note: more information on Habits & Practices study (Procter & Gamble) are described in Annex 3.
3 Wipe product consumption in the habit and practices studies is expressed as a number of wipes used per time unit,
whereas spray and LHC product consumption is typically expressed as the volume of product used per time unit. 4 Wipe product consumption can also be expressed as the volume of wipe lotion used per time unit (see table 3)
19/84
2.4. System Boundaries
2.4.1. Economy-environment system boundary: Flow diagrams
The objective of the following schemes is to present the considered system and its boundaries
for each of the products assessed. The systems have been structured similarly and comprise
following stages in the life cycle of kitchen cleaning:
• Production of the primary product: sourcing and production of raw materials &
ingredients + processing of the raw materials into a product.
• Production of the packaging material.
• Transport of the products to the shop.
• Usage of this product in consumer homes. In the use phase, three steps are to be
differentiated for all 3 compared products: cleaning, rinsing and drying of the hard
surface. Although drying habits have a potential impact on a variety of
environmental impact indicators, absence of relevant LCI-data and material
information (paper, cloth…) have led to not including this in the study. As drying
is mostly done in combination with products that leave surfaces wet after cleaning
or rinsing (mainly LHC and spray), the environmental impact of this additional step
should be the highest for these two product categories (annex 3 describes the drying
habits & practices). The use phase also includes the life cycle of the sponge (spray
and LHC) and the heating of the water for LHC. The waste water treatment of
products that go down-the-drain is considered to be part of the cleaning or rinsing
step and is therefore also accounted for in the use phase in this LCA.
• End-of-life stage of the product materials. This takes into account the recycling
figures and solid waste infrastructure in France.
Following flow charts shows the unit- or aggregated processes and the economic flows in
between them. The environmental interventions5 are not shown. Energy/fuel flows are omitted
because of readability (more detailed flow charts are captured in Annex 7).
5 Environmental interventions are flows crossing the boundary between the economy (product system) and the
environment. Hence, they are flows of materials leaving the product system which are discarded into the environment
without subsequent human transformation [38]
20/84
Figure 1: Process flow diagram of life-cycle stages for delivery of Mr. Propre Spray

21/84
Figure 2: Process flow diagram of the life-cycle stages for delivery of Mr. Propre Wipes
22/84
Figure 3: Process flow diagram of the life-cycle stages for delivery of Mr. Propre LHC product

23/84
2.4.2. Unit Processes excluded from the life cycle assessment
With respect to production of chemical ingredients, at least 99.3% of the product composition
was taken into account. The ingredient production not accounted for in this life cycle
assessment were perfume and dye materials. In addition to these product ingredients, some unit
processes were excluded from the life cycle analysis. The description of the unit processes
excluded from the study and the rationale behind this is detailed in below table:
Table 5: Unit Processes excluded from the life cycle assessment
System Excluded Rationale Relevant to all systems
• All contributions from production infrastructure
• Transportation of product ingredients from
production site to manufacturing site. • Transportation of packaging parts from
production site to manufacturing site of products
• Assembly of the packaging (bottles and
flow-wrap) • Consumer transportation to retailer
• Drying step in use phase
• Dye and perfume is not taken into account
for raw material production (the sum of the two ingredients represents a maximum level in the formulae of 0.7%)
• Printing of the packaging (plastic film or
paper label)
• Capital goods for production are excluded in LCA
• To be neglected for this study
• To be neglected for this study
• No information available
• To be neglected (as combined
with other shopping) • Insufficient LCI data and
information on consumer habits available
• No LCI data available related to production of these ingredients
• Quantities assumed to be very
low
Relevant to Wipes product
• Transport of fibers to wipe manufacturing • Use of biocide ingredients in production of
the wipe material (pulp).
• No information available • Each of the 3 biocides
ingredients used are present at very low concentration and no information was available (when calculated as product ingredients, they represent only <0.003% in the product formulation)
Relevant to LHC product
• Production and use of a bucket
• No information available + assumed to have a long lifetime

24/84
2.4.3. Allocation (boundaries with other systems)
Allocation has been avoided as much as possible. The single process which needs an allocation
rule is the use of the polyurethane sponge in the rinsing step. 50% of the sponge usage is
allocated to kitchen cleaning while other 50% is allocated to dish washing (outside the system
boundaries).
2.4.4. Modeling of energy recovery and recycling
The modeling of sub-systems related to end of life of wipes, packaging and sponge is detailed
in section 3.1.7. In particular, the methodological choices regarding energy recovery when a
waste is incinerated with energy recovery and regarding material recycling (HDPE bottle,
cardboard…) are presented.
2.4.5. Calculation software
The data are entered in TEAM™, commercial software developed by Ecobilan-
PricewaterhouseCoopers. Individual data modules for each unit process or series of unit
processes (see ISO 14040 definition 3.18) are available from DEAM™, the database delivered
with TEAM™ or from internal data. The format of these modules is compliant with the
recently developed SPOLD 99 format (Society for the Promotion of Life Cycle Development
[6]) and can be exported as such. Information on the origin of the data, the time period of data
collection, the geography, how representative, judgements and assumptions, type of
technology, literature or private sources, etc. may be entered as a reference in each module.
2.5. Critical review considerations
An external critical review was carried out by an independent LCA expert Mr. Henri Lecouls,
assisted by Mrs. Nadia Bouglin of ADEME (Agence de l’Environnement et de la Maitrise de
l’Energie). The peer reviewer comments and the author’s answers to these remarks are
presented in section 7 of this report. The French version of this review report is available in
Annex 11.
25/84
3. Life Cycle Inventories
3.1. Data sources and main assumptions
In this chapter, the choices, decisions and data quality related to unit processes are discussed in
more detail.
3.1.1. Data sources related to Energy and Transport
Life Cycle Inventory (LCI) studies collected from the literature or provided by suppliers or
consultants have relied upon a number of different energy databases for calculation of the
demand of energy and related environmental emissions [8].
For processes that required calculation of energy and related environmental emissions (i.e.
”transport” and ”manufacturing” stage), the ETH Energy Database was used consistently.
Country grid infrastructure data are representative of 2000 year, are from the International
Energy Agency (IEA) and include distribution losses. In limited cases, where no other data was
available, other LCI data was sourced: Franklin Associates, (US)-Environmental Protection
Agency or Ecobilan (calculated method for steam production).
Table 5 describes the sources of the different energy and transport processes used. Table 6
summarizes characteristics of the 2 electricity grids used in this study.
Table 6: LCI databases for energy and transport
Unit process Database Where used
Coal: Combustion ETH, Zurich; 1996 [8] Wipe, Spray, LHC
Coal: Production ETH, Zurich; 1996 [8] Wipe, Spray, LHC
Diesel Oil: Engine Combustion ETH, Zurich; 1996 [8] Wipe
Diesel Oil: Production ETH, Zurich; 1996 [8] Wipe, Spray, LHC
Electricity (European Union, 2000): Production ETH, Zurich, 1996 [8] Wipe, Spray, LHC
Electricity (France, 2000): Production ETH, Zurich, 1996 [8] Wipe, Spray, LHC
Fluvial Transport (River Barge, kg.km) ETH, Zurich; 1996 [8] Wipe, Spray, LHC
Gasoline (unleaded): Production ETH, Zurich; 1996 [8] Wipe, Spray, LHC
Gasoline (USA) : Combustion in industrial equipment FAL [7] Wipe, Spray, LHC
Heavy Fuel Oil: Combustion ETH, Zurich; 1996 [8] Wipe, Spray, LHC
Light Fuel Oil: Combustion ETH, Zurich; 1996 [8] Wipe, Spray, LHC
Natural Gas: Combustion ETH, Zurich; 1996 [8] Wipe, Spray, LHC
Natural Gas: Production (Europe, 1996) ETH, Zurich; 1996 [8] Wipe, Spray, LHC
26/84
Propane (C3H8): Production ETH, Zurich; 1996 [8] Wipe, Spray
Propane (C3H8): Combustion EPA; 1996 [9] Wipe, Spray
Rail Transport (European average) ETH, Zurich; 1996 [8] Wipe, Spray, LHC
Road Transport (Diesel Oil, liter) ETH, Zurich; 1996 [8] Wipe, Spray, LHC
Road Transport (Gasoline Unleaded, kg) ETH, Zurich; 1996 [8] Wipe, Spray, LHC
Road Transport (Truck 28 t, Diesel Oil, kg. km) ETH, Zurich; 1996 [8] Wipe, Spray, LHC
Road Transport (Truck 40 t, Diesel Oil, kg.km) ETH, Zurich; 1996 [8] Wipe, Spray, LHC
Sea Transport (Tanker, kg.km) ETH, Zurich; 1996 [8] Wipe, Spray, LHC
Steam (2.6 MJ per kg, 100% natural gas): Production Ecobilan [28] Wipe, Spray, LHC
Transport Pipeline (kg.km): Natural gas pipeline FAL database [7] Wipe, Spray, LHC
Transport Pipeline (kg.km): Petrochemical pipeline FAL database [7] Wipe, Spray, LHC
Table 7: Electricity Grid France vs. Europe (2000)
France European Union Source IEA IEA % % Coal 5 18.37 Lignite 0.08 7.56 Fuel oil 1.38 6.19 Natural gas 2.07 17.29 Nuclear 76.79 33.24 Hydropower 13.4 14.22 Process gas (coke oven, …) 0.67 1.17 Other (geothermal, solar,…) / 1.96 Import 0.68 8.49 Distribution losses 5.53 6.3
The French electricity model was used:
• in the Product Production stage of the three products for:
Production of softened water (part of the formulae ingredients) and the processing of the liquid product.
Manufacturing of the wipes (from basic ingredients PP/cellulose) in France (site located in France).
• in the use phase of the three products for:
Production of tap water in France.
Heating the water used for cleaning and rinsing
Waste water treatment of chemicals that go down the drain
• in the disposal stage for:
Recycling of cardboard/HDPE/LDPE
Electricity input for transport of waste to MSW / regeneration
Incineration of waste with energy recovery

27/84
European electricity model was used:
• in the Product Production phase:
Manufacturing and processing of all chemical ingredients with relation to the various product ingredients
/ wipe material ingredients
• in the Packaging stage:
Production of packaging ingredients
• in the distribution phase:
Electricity input for diesel oil production in system that describes transport of product to shelf
3.1.2. Data sources related to packaging and wipe materials production
Sources of life cycle inventory data on packaging materials and processing of these materials
into the end product are presented in table 7.
Table 8: LCI databases for production of materials
Material Database Where used
Pulp (Sulphite, Bleached with Mg(HSO3)2):
Production
BUWAL [10] Wipe
Process of cellulose derived wipe material H. Firgo, M. Eibl, D.Eichinger [11] Wipe
Polyethylene Terephthalate (PET, Film):
Production
APME [12] Wipe
Low Density Polyethylene (LDPE, Linear):
Production
APME [13] Wipe
Polyethylene (PE): Extrusion BUWAL [10] Wipe, Spray, LHC
Polypropylene (PP): Production APME [13] Wipe, Spray, LHC
Polypropylene (PP): Extrusion in OPP APME [14] Wipe
Low Density Polyethylene (LDPE): Production APME [12] Wipe, Spray, LHC
Corrugated Cardboard (Recycled Fibers):
Production
BUWAL [10] Wipe, Spray, LHC
Cardboard (Recycled, Grey Board): Production BUWAL [10] Wipe, Spray, LHC
Paper (Kraft, Bleached): Production BUWAL [10] Spray, LHC
Polyurethane (PUR, Flexible Foam): Production APME [15] Wipe, Spray, LHC
High Density Polyethylene (HDPE): Production APME [13] Spray, LHC
HDPE: Molding by Injection APME [14] Spray, LHC
Polyoxymethylene (POM): Production Ecobilan: confidential source Spray
Steel Plate (100% recycled): Production BUWAL [10] Spray
Polypropylene (PP): Molding by Injection APME [14] Spray, LHC
28/84
3.1.3. Data sources for chemical product ingredients
Sources of life cycle inventory data for the active formula ingredients are listed below. Where
no aggregated data on chemicals (see annex 2) are available, life cycle inventories were
modeled based on raw materials used during chemical synthesis of the ingredient. In case this
information was also missing, the ingredient was modeled by chemicals with similar chemical
structure, or similar functional properties (least preferred).
Table 9: LCI databases for production of chemicals (see Annex 8 for more detail).
3.1.4. Data sources for wipe manufacturing
The data related to dry wipe material manufacturing (mix of PP and a cellulose-derivative) were
collected from a subcontractor and correspond to real manufacturing data for year 2004. Annex
6 is detailing these data.
As no data was available on the step of cutting the wipes material in small pieces, this step was
approximated by an average waste ratio of 5%. Other environmental impacts related to this step
(in particular, energy consumption) are considered to be negligible.
3.1.5. Distribution phase
Transport of the 3 products by truck (28 tons) from manufacturing sites to the shops was
modeled by using a model based on kg.km (i.e. load transported multiplied by the distance of
transport). It was assumed that the 3 products are transported on average over 400 km in France.
Material Database
Surfactants Carl Hanser Verlag [17],
Suds control agents Procter&Gamble: confidential source, FAL [22]
Solvents Ecobilan: confidential source
Buffers FAL [20], FAL [22], Procter&Gamble: confidential source, APME
[21]
Chemical intermediates for ingredient
production
FAL [20], APME [15], BUWAL [23], Chauvel A., Lefebvre G.,
Castex L., [18]. ELF ATOCHEM [25], CEFIC [31], BUWAL [10],
BUWAL [27], Ecoinvent 2003 [26], BUWAL [23]
Water production Procter&Gamble (Project Cyclaupe, theoretical calculation), PWMI
[24], ETH [8]
Compact liquid : Production Franke, M. [20]
29/84
3.1.6. Use phase
The use phase of the 3 products includes the cleaning and rinse step (includes consumption of
water and the life cycle of a sponge) followed by the treatment of the waste water by a standard
municipal facility.
• Detailed information related to cleaning and rinsing habits are captured in table 1 p.11 and
Annex 3. These sources of information list the conditions and assumptions per product category
with relation to: -The volume, temperature of tap water used (if any), and the percentage of people that use water
during the cleaning step
-The volume, temperature of tap water used (if any), and the percentage of people that use water
during the rinsing step
For domestic water heating during the use phase, the share of electric water heaters was
estimated at 41.9% in France in 1993 [40]. Therefore, in the study scenario, a mix of 50%-50%
was assumed for electric to natural gas driven water heaters. The energy needed to do so is
calculated based on the specific heat of pure water: to heat 1g of water with 1°C, 4,18Joule is
required. For electric water heaters the French electricity model was used (see table 6).
• Waste water treatment: It is considered that all products along with the rinsing water that ends
up onto the cleaned surface finally is discharged to the sewer (via sponge and rinsing water).
The waste water treatment model for France assumes wastewater handling by primary (35%)
and/or secondary treatment (62%) possibly followed by tertiary treatment (3%) [41]. Both the
removal through biodegradation and sorption (to calculate chemical discharge), and the removal
through sorption on the sludge only (calculate dry sludge production) are taken into account.
Removal by primary treatment was estimated using various sources of information [42;43] or
was estimated with the mathematical model SIMPLETREAT [44]. Removal by secondary
treatment was derived from the EU ecolabel Detergent Ingredient Database [45]. It was
assumed that removals in secondary and tertiary treatment would be the same. The amount of
sludge formed in each type of treatment was assumed to equal the amount of ingredient
removed by sorption. For more detailed information on the waste water treatment model, see
[45]. For more information on the energy feedstock, energy requirements and environmental
emissions (CH4 and CO2) associated with the treatment of organic and inorganic ingredients,
see Annex 9.
• For those product formulations with VOC-ingredients, it is assumed that 100% of the VOC
ingredients are emitted into the air during the use phase. Hence, no VOC-ingredient will be
treated in the waste water treatment. This way, the untreated VOC-ingredients are fully
accounted for in the photochemical smog parameter. Therefore, the calculation can be seen as a
30/84
worst case scenario calculation. Except for the VOC-ingredients, all LHC and Spray product is
assumed to go to the cleaned surface and is thus treated in the waste water treatment. For the
wipe product, the situation is somehow different. It is considered that some part of the wipe
lotion stays on the wipe after usage (50% of remaining lotion quantity). After disposal of the
wipe, further evaporation of that lotion fraction will occur in the dust bin (25% of total lotion
quantity). The effects of these processes are taken into account both in disposal (lotion on wipe
treated as municipal solid waste) and the use phase (emissions to air) (more information on
wipe evaporation is described in Annex4).
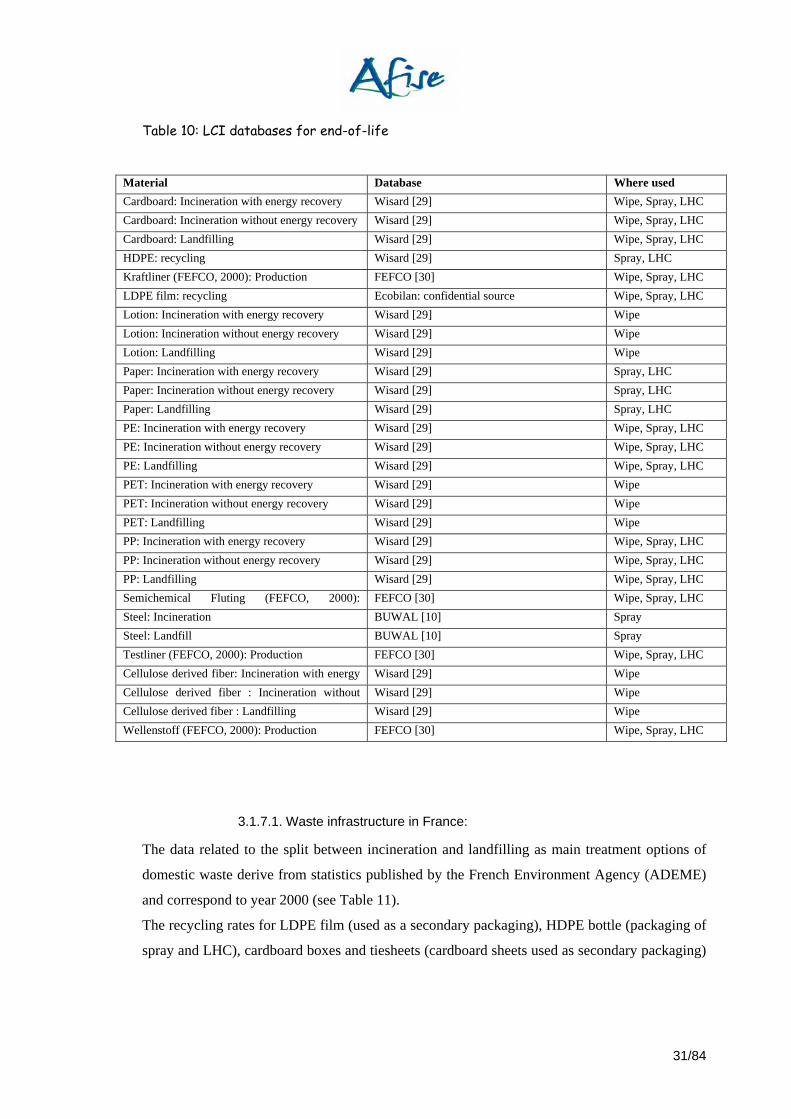
3.1.7. End-of-life treatment
The WISARD6 software, developed by Ecobilan was used to model the incineration and
landfilling of a given material. This software is a life cycle tool for waste management that
allows the modeling of the treatment of a waste fraction based on its composition and net
calorific value characteristics.
The WISARD software has been successfully critically-reviewed in France and England &
Wales in 1999. More than 40 representatives from waste management companies, local
authorities and environmental groups as well as Life Cycle Assessment (LCA) experts took part
to this 6-month long exercise. The tool is based on Ecobilan’s 10-year experience of the field
with different waste operators, local communities and official bodies in Europe, New-Zealand
and the United States. For information related to landfilling, see Annex 10.
6 WISARD: Waste – Integrated Systems Assessment for Recovery and Disposal
31/84
Table 10: LCI databases for end-of-life
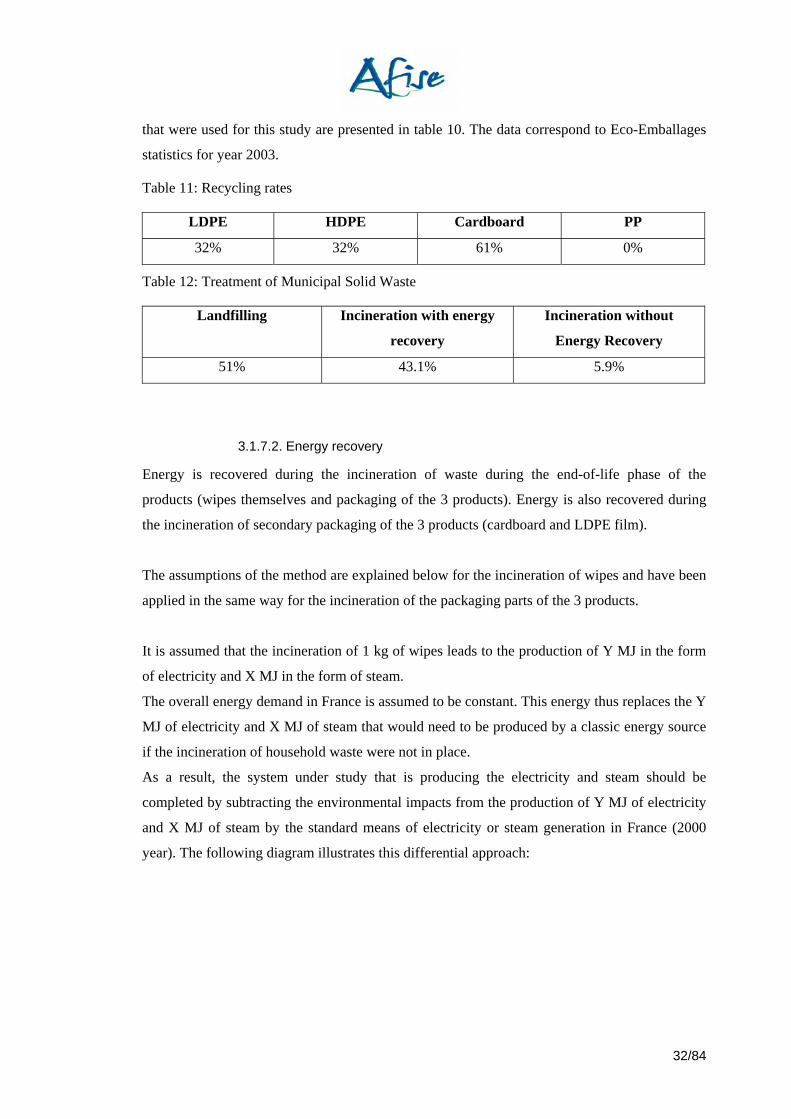
3.1.7.1. Waste infrastructure in France:
The data related to the split between incineration and landfilling as main treatment options of
domestic waste derive from statistics published by the French Environment Agency (ADEME)
and correspond to year 2000 (see Table 11).
The recycling rates for LDPE film (used as a secondary packaging), HDPE bottle (packaging of
spray and LHC), cardboard boxes and tiesheets (cardboard sheets used as secondary packaging)
Material Database Where used Cardboard: Incineration with energy recovery Wisard [29] Wipe, Spray, LHC Cardboard: Incineration without energy recovery Wisard [29] Wipe, Spray, LHC Cardboard: Landfilling Wisard [29] Wipe, Spray, LHC HDPE: recycling Wisard [29] Spray, LHC Kraftliner (FEFCO, 2000): Production FEFCO [30] Wipe, Spray, LHC LDPE film: recycling Ecobilan: confidential source Wipe, Spray, LHC Lotion: Incineration with energy recovery Wisard [29] Wipe Lotion: Incineration without energy recovery Wisard [29] Wipe Lotion: Landfilling Wisard [29] Wipe Paper: Incineration with energy recovery Wisard [29] Spray, LHC Paper: Incineration without energy recovery Wisard [29] Spray, LHC Paper: Landfilling Wisard [29] Spray, LHC PE: Incineration with energy recovery Wisard [29] Wipe, Spray, LHC PE: Incineration without energy recovery Wisard [29] Wipe, Spray, LHC PE: Landfilling Wisard [29] Wipe, Spray, LHC PET: Incineration with energy recovery Wisard [29] Wipe PET: Incineration without energy recovery Wisard [29] Wipe PET: Landfilling Wisard [29] Wipe PP: Incineration with energy recovery Wisard [29] Wipe, Spray, LHC PP: Incineration without energy recovery Wisard [29] Wipe, Spray, LHC PP: Landfilling Wisard [29] Wipe, Spray, LHC Semichemical Fluting (FEFCO, 2000): FEFCO [30] Wipe, Spray, LHC Steel: Incineration BUWAL [10] Spray Steel: Landfill BUWAL [10] Spray Testliner (FEFCO, 2000): Production FEFCO [30] Wipe, Spray, LHC Cellulose derived fiber: Incineration with energy Wisard [29] Wipe Cellulose derived fiber : Incineration without Wisard [29] Wipe Cellulose derived fiber : Landfilling Wisard [29] Wipe Wellenstoff (FEFCO, 2000): Production FEFCO [30] Wipe, Spray, LHC
32/84
that were used for this study are presented in table 10. The data correspond to Eco-Emballages
statistics for year 2003.
Table 11: Recycling rates
LDPE HDPE Cardboard PP
32% 32% 61% 0%
Table 12: Treatment of Municipal Solid Waste
Landfilling Incineration with energy
recovery
Incineration without
Energy Recovery
51% 43.1% 5.9%
3.1.7.2. Energy recovery
Energy is recovered during the incineration of waste during the end-of-life phase of the
products (wipes themselves and packaging of the 3 products). Energy is also recovered during
the incineration of secondary packaging of the 3 products (cardboard and LDPE film).
The assumptions of the method are explained below for the incineration of wipes and have been
applied in the same way for the incineration of the packaging parts of the 3 products.
It is assumed that the incineration of 1 kg of wipes leads to the production of Y MJ in the form
of electricity and X MJ in the form of steam.
The overall energy demand in France is assumed to be constant. This energy thus replaces the Y
MJ of electricity and X MJ of steam that would need to be produced by a classic energy source
if the incineration of household waste were not in place.
As a result, the system under study that is producing the electricity and steam should be
completed by subtracting the environmental impacts from the production of Y MJ of electricity
and X MJ of steam by the standard means of electricity or steam generation in France (2000
year). The following diagram illustrates this differential approach:
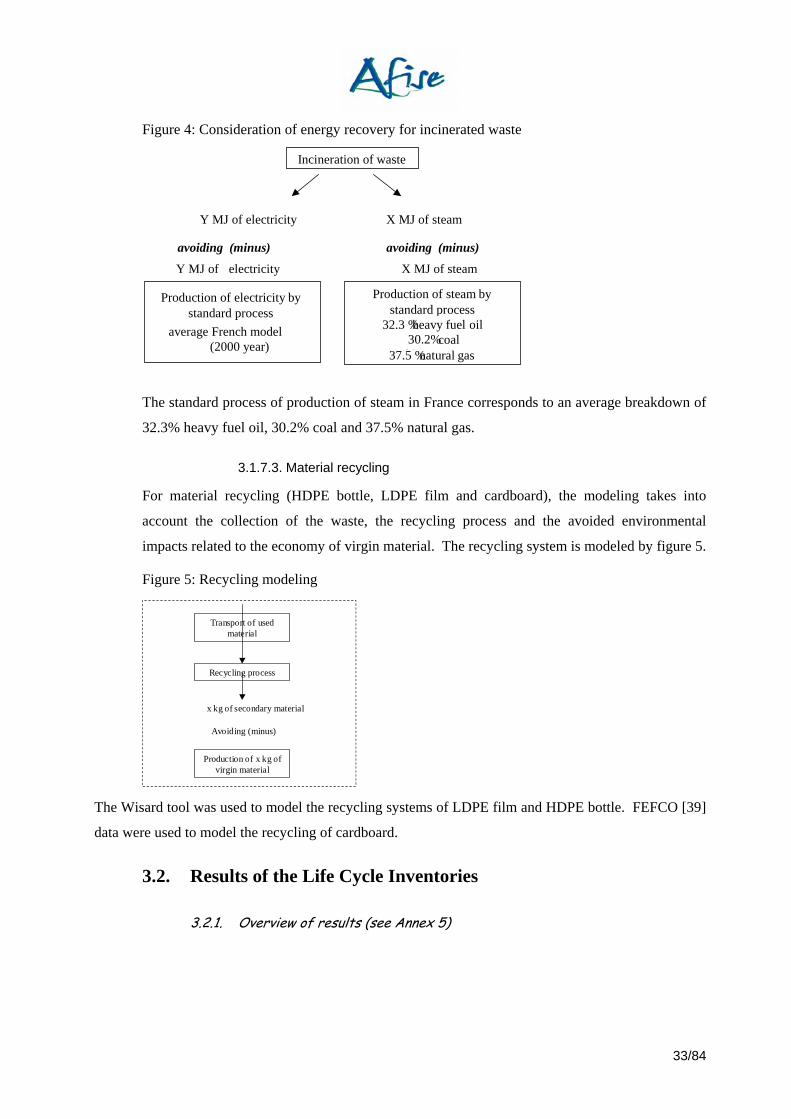
33/84
Figure 4: Consideration of energy recovery for incinerated waste Incineration of waste
Y MJ of electricity X MJ of steam
Production of electricity by standard process
average French model (2000 year)
avoiding (minus)
Production of steam by standard process
32.3 % heavy fuel oil 30.2% %
coal 37.5 % natural gas
X MJ of steam Y MJ of electricity
avoiding (minus)
The standard process of production of steam in France corresponds to an average breakdown of
32.3% heavy fuel oil, 30.2% coal and 37.5% natural gas.
3.1.7.3. Material recycling
For material recycling (HDPE bottle, LDPE film and cardboard), the modeling takes into
account the collection of the waste, the recycling process and the avoided environmental
impacts related to the economy of virgin material. The recycling system is modeled by figure 5.
Figure 5: Recycling modeling
The Wisard tool was used to model the recycling systems of LDPE film and HDPE bottle. FEFCO [39]
data were used to model the recycling of cardboard.
3.2. Results of the Life Cycle Inventories
3.2.1. Overview of results (see Annex 5)
Transport of used material
Recycling process
Production of x kg of virgin material
Avoiding (minus)
x kg of secondary material

34/84
3.2.2. Calculation with respect to indoor air emissions of VOC
Although VOC emissions by building materials, paints, wood burning and tobacco smoke are
considered as the major contributors to indoor air quality problems such as Sick-Building-Syndrome,
VOC emissions by household products also are in the public debate. Therefore, this LCA will address
the maximum quantity of VOC-chemicals released into the environment during the use phase (in the
consumer’s home) over the total functional unit and per single cleaning job (Table 13).
By assuming that all VOC’s in the products will be emitted spontaneously into the kitchen indoor air
when the products are used, a worst case scenario is assumed: In reality at least some of the emissions
will not take place indoor (e.g. in the case of wipes when the dust bin is collected and emptied and the
waste is disposed off on a landfill or for spray/LHC after partially being disposed off down the drain).
Table 13: Inventory of maximum VOC's released into indoor air during the use phase only
Wipes Spray LHC
VOC ingredients Per FU Per job (*2) Per FU Per job (*2) Per FU Per job (*2)
Solvent 1 (g) 324.69 0.89 / / / /
Solvent 2 (g) 81.17 0.22 302.33 0.90 / /
Perfume (*1) 7.31 0.020 24.18 0.072 35.19 0.096
Total VOC’s 413 1.13 327 0.97 35 0.096 *1In the other parts of the LCA, it was assumed that during the use phase, perfume materials are discharged in the sewer with
the cleaning and rinsing water. Hence, the amount of perfume not removed by the waste water treatment plant is considered as
water emission. The emissions of the other solvents are considered as fully evaporating during the use phase, and hence are
fully considered as air emissions. For more details on the used solvents, see Annex 2.
*2 Although LCA results are typically reported over the entire functional unit, for indoor air pollution exposure is important.
Therefore, it was chosen to also report the VOC’s released during the use phase per job. It is during the occasion of a cleaning
job that the consumers are exposed to the cleaning ingredients. The definition of what is a job and how much product is used
per job can be found in Annex 3.
The highest quantities of VOC-ingredients are released during use of wipes and spray products. Hereby
wipes are releasing 25% more VOC’s over one year when compared to spray. VOC’s released into the
environment during use of LHC is only 10% of that of wipes or spray.
Whether VOC emissions in the reported quantities and qualities are capable to affect indoor air quality
is best addressed in the context of classical consumer and/or occupational safety assessments, with the
appropriate tools used in these disciplines. In order to facilitate such potential future exposure modelling
and risk assessment calculations, this LCA wanted to contribute to the debate by providing conservative
data based on product composition and worst case assumptions on the release scenario. The assessment
of the indoor air quality lies beyond the scope of this LCA.
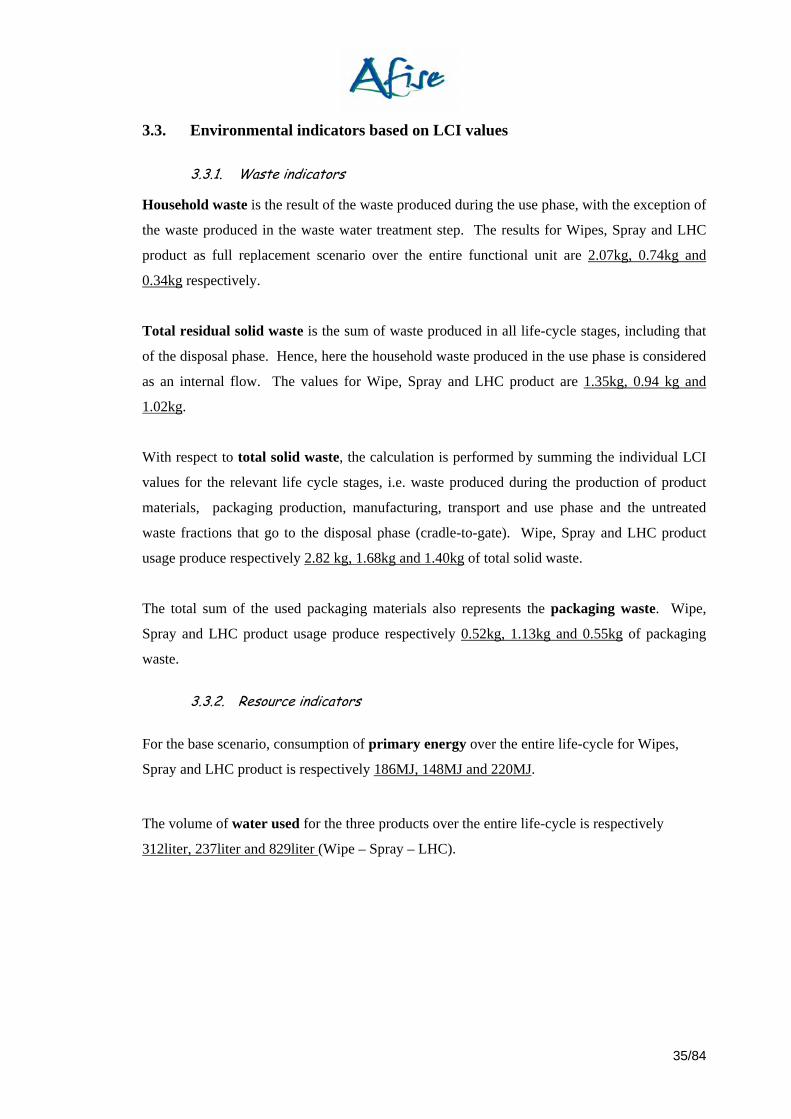
35/84
3.3. Environmental indicators based on LCI values
3.3.1. Waste indicators
Household waste is the result of the waste produced during the use phase, with the exception of
the waste produced in the waste water treatment step. The results for Wipes, Spray and LHC
product as full replacement scenario over the entire functional unit are 2.07kg, 0.74kg and
0.34kg respectively.
Total residual solid waste is the sum of waste produced in all life-cycle stages, including that
of the disposal phase. Hence, here the household waste produced in the use phase is considered
as an internal flow. The values for Wipe, Spray and LHC product are 1.35kg, 0.94 kg and
1.02kg.
With respect to total solid waste, the calculation is performed by summing the individual LCI
values for the relevant life cycle stages, i.e. waste produced during the production of product
materials, packaging production, manufacturing, transport and use phase and the untreated
waste fractions that go to the disposal phase (cradle-to-gate). Wipe, Spray and LHC product
usage produce respectively 2.82 kg, 1.68kg and 1.40kg of total solid waste.
The total sum of the used packaging materials also represents the packaging waste. Wipe,
Spray and LHC product usage produce respectively 0.52kg, 1.13kg and 0.55kg of packaging
waste.
3.3.2. Resource indicators
For the base scenario, consumption of primary energy over the entire life-cycle for Wipes,
Spray and LHC product is respectively 186MJ, 148MJ and 220MJ.
The volume of water used for the three products over the entire life-cycle is respectively
312liter, 237liter and 829liter (Wipe – Spray – LHC).
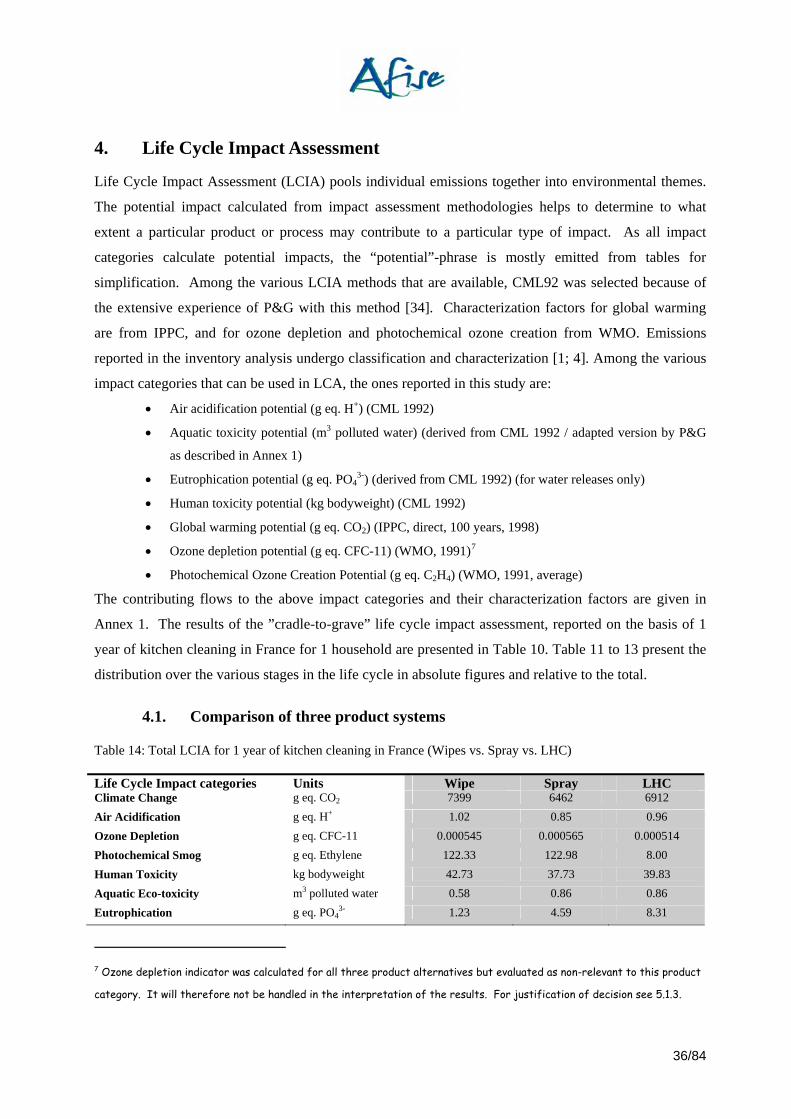
36/84
4. Life Cycle Impact Assessment
Life Cycle Impact Assessment (LCIA) pools individual emissions together into environmental themes.
The potential impact calculated from impact assessment methodologies helps to determine to what
extent a particular product or process may contribute to a particular type of impact. As all impact
categories calculate potential impacts, the “potential”-phrase is mostly emitted from tables for
simplification. Among the various LCIA methods that are available, CML92 was selected because of
the extensive experience of P&G with this method [34]. Characterization factors for global warming
are from IPPC, and for ozone depletion and photochemical ozone creation from WMO. Emissions
reported in the inventory analysis undergo classification and characterization [1; 4]. Among the various
impact categories that can be used in LCA, the ones reported in this study are:
• Air acidification potential (g eq. H+) (CML 1992)
• Aquatic toxicity potential (m3 polluted water) (derived from CML 1992 / adapted version by P&G
as described in Annex 1)
• Eutrophication potential (g eq. PO43-) (derived from CML 1992) (for water releases only)
• Human toxicity potential (kg bodyweight) (CML 1992)
• Global warming potential (g eq. CO2) (IPPC, direct, 100 years, 1998)
• Ozone depletion potential (g eq. CFC-11) (WMO, 1991)7
• Photochemical Ozone Creation Potential (g eq. C2H4) (WMO, 1991, average)
The contributing flows to the above impact categories and their characterization factors are given in
Annex 1. The results of the ”cradle-to-grave” life cycle impact assessment, reported on the basis of 1
year of kitchen cleaning in France for 1 household are presented in Table 10. Table 11 to 13 present the
distribution over the various stages in the life cycle in absolute figures and relative to the total.
4.1. Comparison of three product systems
Table 14: Total LCIA for 1 year of kitchen cleaning in France (Wipes vs. Spray vs. LHC)
Life Cycle Impact categories Units Wipe Spray LHC Climate Change g eq. CO2 7399 6462 6912 Air Acidification g eq. H+ 1.02 0.85 0.96 Ozone Depletion g eq. CFC-11 0.000545 0.000565 0.000514 Photochemical Smog g eq. Ethylene 122.33 122.98 8.00 Human Toxicity kg bodyweight 42.73 37.73 39.83 Aquatic Eco-toxicity m3 polluted water 0.58 0.86 0.86 Eutrophication g eq. PO4
3- 1.23 4.59 8.31
7 Ozone depletion indicator was calculated for all three product alternatives but evaluated as non-relevant to this product
category. It will therefore not be handled in the interpretation of the results. For justification of decision see 5.1.3.
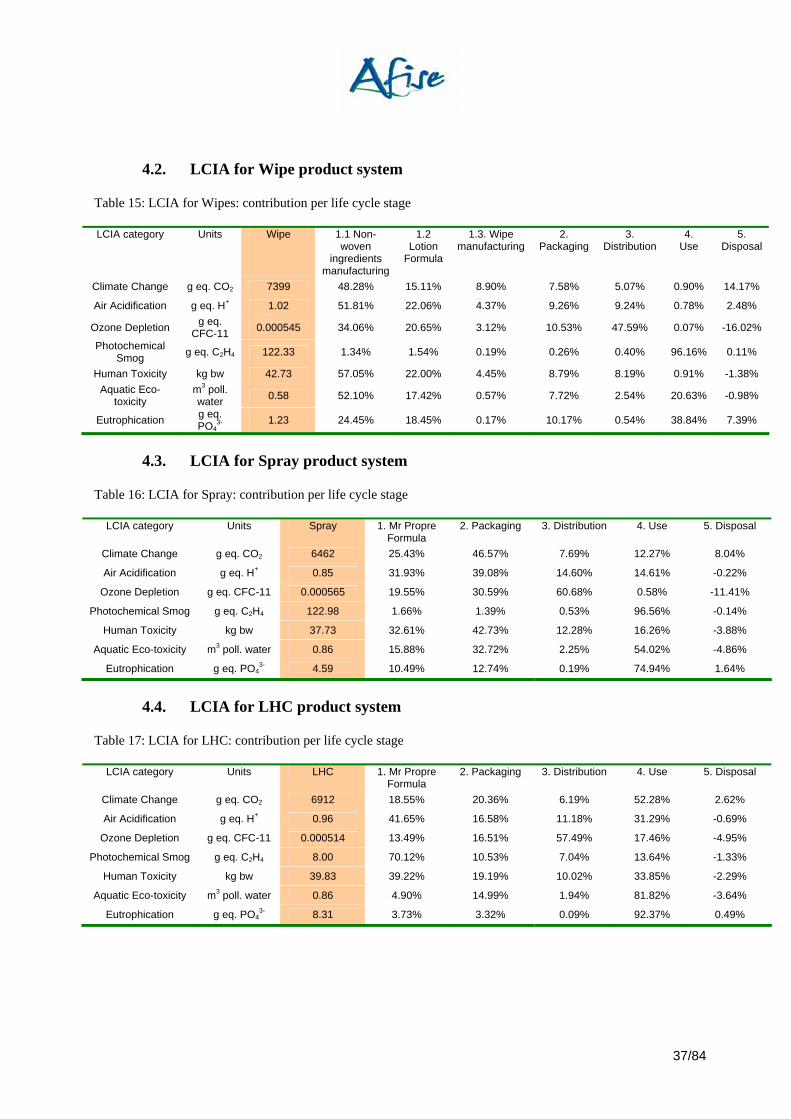
37/84
4.2. LCIA for Wipe product system
Table 15: LCIA for Wipes: contribution per life cycle stage
LCIA category Units Wipe 1.1 Non-woven
ingredients manufacturing
1.2 Lotion
Formula
1.3. Wipe manufacturing
2. Packaging
3. Distribution
4. Use
5. Disposal
Climate Change g eq. CO2 7399 48.28% 15.11% 8.90% 7.58% 5.07% 0.90% 14.17%
Air Acidification g eq. H+ 1.02 51.81% 22.06% 4.37% 9.26% 9.24% 0.78% 2.48%
Ozone Depletion g eq. CFC-11 0.000545 34.06% 20.65% 3.12% 10.53% 47.59% 0.07% -16.02%
Photochemical Smog g eq. C2H4 122.33 1.34% 1.54% 0.19% 0.26% 0.40% 96.16% 0.11%
Human Toxicity kg bw 42.73 57.05% 22.00% 4.45% 8.79% 8.19% 0.91% -1.38% Aquatic Eco-
toxicity m3 poll. water 0.58 52.10% 17.42% 0.57% 7.72% 2.54% 20.63% -0.98%
Eutrophication g eq. PO4
3- 1.23 24.45% 18.45% 0.17% 10.17% 0.54% 38.84% 7.39%
4.3. LCIA for Spray product system
Table 16: LCIA for Spray: contribution per life cycle stage
LCIA category Units Spray 1. Mr Propre Formula
2. Packaging 3. Distribution 4. Use 5. Disposal
Climate Change g eq. CO2 6462 25.43% 46.57% 7.69% 12.27% 8.04%
Air Acidification g eq. H+ 0.85 31.93% 39.08% 14.60% 14.61% -0.22%
Ozone Depletion g eq. CFC-11 0.000565 19.55% 30.59% 60.68% 0.58% -11.41%
Photochemical Smog g eq. C2H4 122.98 1.66% 1.39% 0.53% 96.56% -0.14%
Human Toxicity kg bw 37.73 32.61% 42.73% 12.28% 16.26% -3.88%
Aquatic Eco-toxicity m3 poll. water 0.86 15.88% 32.72% 2.25% 54.02% -4.86%
Eutrophication g eq. PO43- 4.59 10.49% 12.74% 0.19% 74.94% 1.64%
4.4. LCIA for LHC product system
Table 17: LCIA for LHC: contribution per life cycle stage
LCIA category Units LHC 1. Mr Propre Formula
2. Packaging 3. Distribution 4. Use 5. Disposal
Climate Change g eq. CO2 6912 18.55% 20.36% 6.19% 52.28% 2.62%
Air Acidification g eq. H+ 0.96 41.65% 16.58% 11.18% 31.29% -0.69%
Ozone Depletion g eq. CFC-11 0.000514 13.49% 16.51% 57.49% 17.46% -4.95%
Photochemical Smog g eq. C2H4 8.00 70.12% 10.53% 7.04% 13.64% -1.33%
Human Toxicity kg bw 39.83 39.22% 19.19% 10.02% 33.85% -2.29%
Aquatic Eco-toxicity m3 poll. water 0.86 4.90% 14.99% 1.94% 81.82% -3.64%
Eutrophication g eq. PO43- 8.31 3.73% 3.32% 0.09% 92.37% 0.49%
38/84
5. Interpretation
The ISO standard on life cycle interpretation [5] describes the interpretation phase as the step of a LCA
in which the results of the LCI and LCIA are summarized and discussed as a basis for conclusions,
recommendations and decision-making in accordance with the goal and scope definition.
The interpretation phase contains procedural steps (completeness check, consistency check) as well as
numerical steps. Amongst the numerical steps, one may distinguish contribution analysis, perturbation
analysis, uncertainty analysis, comparative analysis and discernibility analysis. A detailed description of
these numerical approaches is given in [35].
For the interpretation phase of this LCA study, a comparative contribution and an uncertainty analysis is
performed. All interpretation is done based on the perspective of either wipe, spray or LHC users, i.e. a
full replacement scenario for kitchen surface cleaning. Taking this approach does not imply that wipes,
spray of LHC are substitutes for all type of cleaning jobs. In this direct comparative study, intermediate
scenario’s (i.e. people who use e.g. 50% wipes, 30% spray and 20% LHC for this functional unit) would
have no added value to study the potential impacts on the environment. The latter approach would be
mainly interesting from a market and time trend point of view.
5.1. Contribution analysis
As indicated in chapter 2.2.5 of the scope definition, the environmental indicators selected were
organized in 3 separate groups, i.e. waste, resource consumption and LCIA indicators. This structure is
maintained in the interpretation of the results. The overall profile is summarized in chapter 5.1.4.
5.1.1. Waste throughout the kitchen cleaning life-cycle
5.1.1.1. Summary of the results
The choice of waste parameters was considered in part 2.2.5.3. Calculation and results are
displayed in chapter 3.3.1. The study has looked at 4 waste parameters of which we consider 2
truly relevant for discussion, i.e. household waste and total residual solid waste8.
8 Household waste (kg): The amount of solid waste that is produced at the consumer’s home during use and disposal of the products. The
volume or weight of this waste may have an impact on the financial contribution the households need to pay with regards to waste collection,
and is therefore very relevant. It includes the weight of the primary packaging, the wipe material and the polyurethane sponge.
Total residual solid waste (kg): The actual amount of total solid waste after treatment that is released back into the environment system after
recycling and incineration of all forms of solid waste produced during the entire life cycle. This represents the amount of solid waste in a true
‘cradle to grave’ sense.
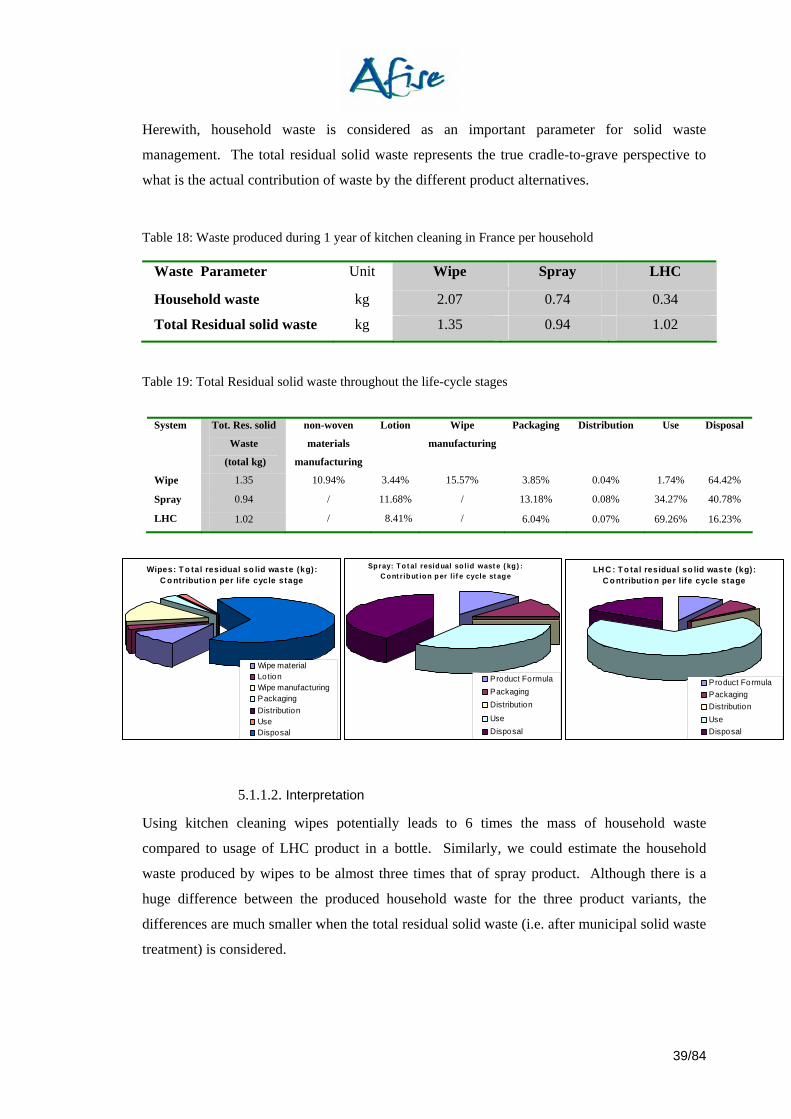
39/84
Herewith, household waste is considered as an important parameter for solid waste
management. The total residual solid waste represents the true cradle-to-grave perspective to
what is the actual contribution of waste by the different product alternatives.
Table 18: Waste produced during 1 year of kitchen cleaning in France per household
Waste Parameter Unit Wipe Spray LHC
Household waste kg 2.07 0.74 0.34
Total Residual solid waste kg 1.35 0.94 1.02
Table 19: Total Residual solid waste throughout the life-cycle stages
5.1.1.2. Interpretation
Using kitchen cleaning wipes potentially leads to 6 times the mass of household waste
compared to usage of LHC product in a bottle. Similarly, we could estimate the household
waste produced by wipes to be almost three times that of spray product. Although there is a
huge difference between the produced household waste for the three product variants, the
differences are much smaller when the total residual solid waste (i.e. after municipal solid waste
treatment) is considered.
System Tot. Res. solid
Waste
(total kg)
non-woven
materials
manufacturing
Lotion Wipe
manufacturing
Packaging Distribution Use Disposal
Wipe 1.35 10.94% 3.44% 15.57% 3.85% 0.04% 1.74% 64.42%
Spray 0.94 / 11.68% / 13.18% 0.08% 34.27% 40.78%
LHC 1.02 / 8.41% / 6.04% 0.07% 69.26% 16.23%
Wipes: T o tal residual so lid waste (kg) : C o ntributio n per life cycle stage
Wipe materialLotionWipe manufacturingPackagingDistributionUseDisposal
Sp ray: To t al resid ual so lid wast e ( kg ) : C ont r ib ut io n p er l if e cycle st age
Product FormulaPackagingDistributionUseDisposal
LH C : T o tal residual so lid waste (kg) : C o ntribut io n per life cycle stage
Product FormulaPackagingDistributionUseDisposal
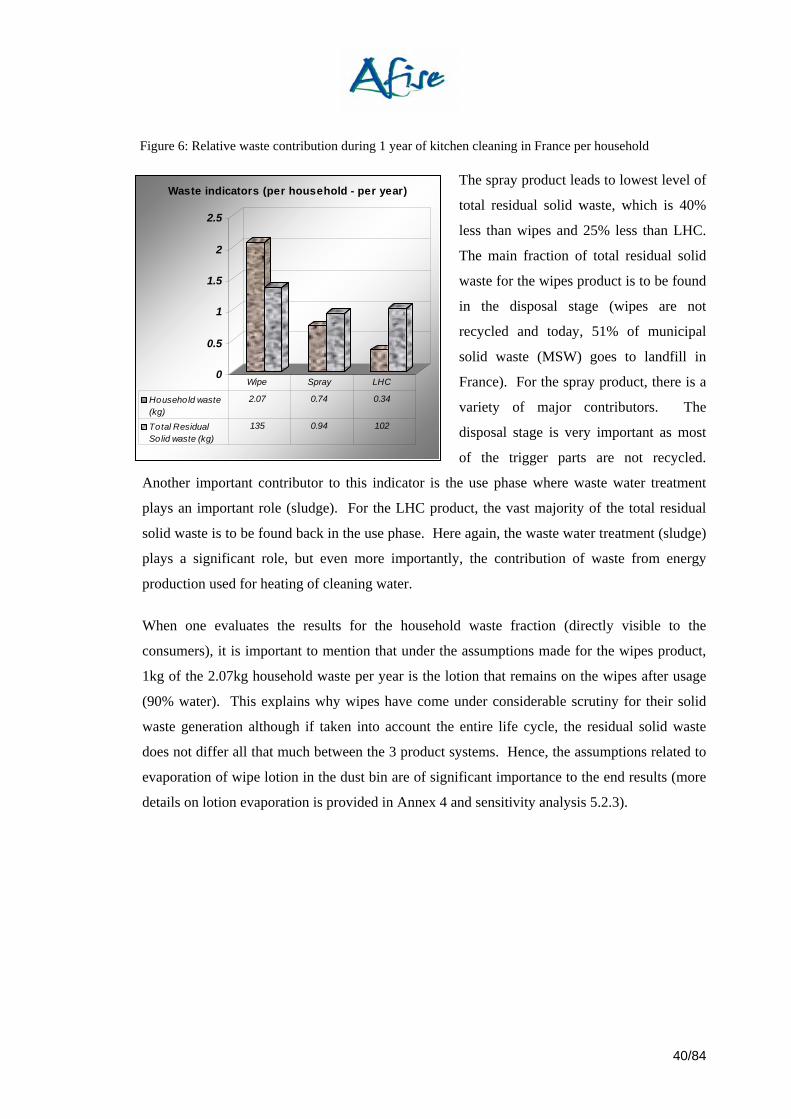
40/84
The spray product leads to lowest level of
total residual solid waste, which is 40%
less than wipes and 25% less than LHC.
The main fraction of total residual solid
waste for the wipes product is to be found
in the disposal stage (wipes are not
recycled and today, 51% of municipal
solid waste (MSW) goes to landfill in
France). For the spray product, there is a
variety of major contributors. The
disposal stage is very important as most
of the trigger parts are not recycled.
Another important contributor to this indicator is the use phase where waste water treatment
plays an important role (sludge). For the LHC product, the vast majority of the total residual
solid waste is to be found back in the use phase. Here again, the waste water treatment (sludge)
plays a significant role, but even more importantly, the contribution of waste from energy
production used for heating of cleaning water.
When one evaluates the results for the household waste fraction (directly visible to the
consumers), it is important to mention that under the assumptions made for the wipes product,
1kg of the 2.07kg household waste per year is the lotion that remains on the wipes after usage
(90% water). This explains why wipes have come under considerable scrutiny for their solid
waste generation although if taken into account the entire life cycle, the residual solid waste
does not differ all that much between the 3 product systems. Hence, the assumptions related to
evaporation of wipe lotion in the dust bin are of significant importance to the end results (more
details on lotion evaporation is provided in Annex 4 and sensitivity analysis 5.2.3).
0
0.5
1
1.5
2
2.5
Waste indicators (per household - per year)
Household waste(kg)
2.07 0.74 0.34
Total ResidualSolid waste (kg)
1.35 0.94 1.02
Wipe Spray LHC
Figure 6: Relative waste contribution during 1 year of kitchen cleaning in France per household
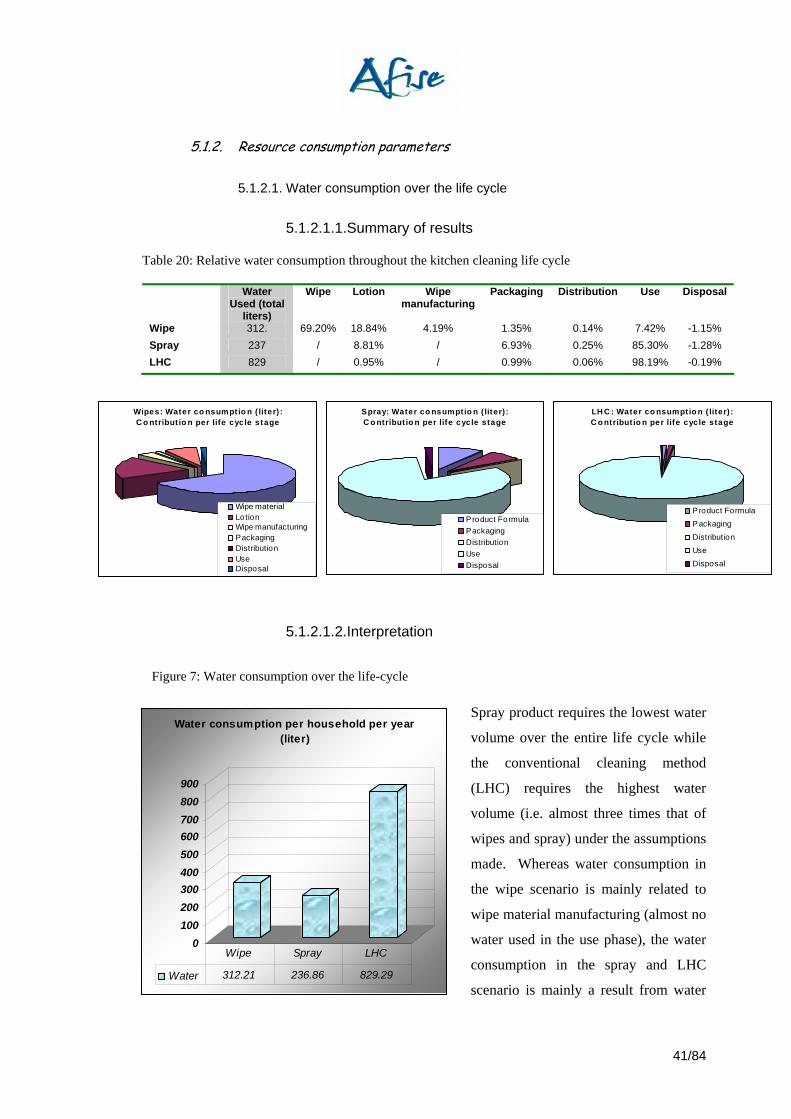
41/84
5.1.2. Resource consumption parameters
5.1.2.1. Water consumption over the life cycle
5.1.2.1.1.Summary of results
Table 20: Relative water consumption throughout the kitchen cleaning life cycle
Water Used (total
liters)
Wipe Lotion Wipe manufacturing
Packaging Distribution Use Disposal
Wipe 312. 69.20% 18.84% 4.19% 1.35% 0.14% 7.42% -1.15% Spray 237 / 8.81% / 6.93% 0.25% 85.30% -1.28% LHC 829 / 0.95% / 0.99% 0.06% 98.19% -0.19%
5.1.2.1.2.Interpretation
Spray product requires the lowest water
volume over the entire life cycle while
the conventional cleaning method
(LHC) requires the highest water
volume (i.e. almost three times that of
wipes and spray) under the assumptions
made. Whereas water consumption in
the wipe scenario is mainly related to
wipe material manufacturing (almost no
water used in the use phase), the water
consumption in the spray and LHC
scenario is mainly a result from water
Figure 7: Water consumption over the life-cycle
Wipes: Water co nsumptio n ( liter) : C o ntributio n per life cycle stage
Wipe materialLotionWipe manufacturingPackagingDistributionUseDisposal
Spray: Water co nsumptio n ( liter) : C o ntribut io n per life cycle stage
Product FormulaPackagingDistributionUseDisposal
LH C : Water co nsumpt io n ( liter) : C o ntribut io n per life cycle stage
Product FormulaPackaging
DistributionUseDisposal
0100200300400500600700800900
Water consumption per household per year (liter)
Water 312.21 236.86 829.29
Wipe Spray LHC
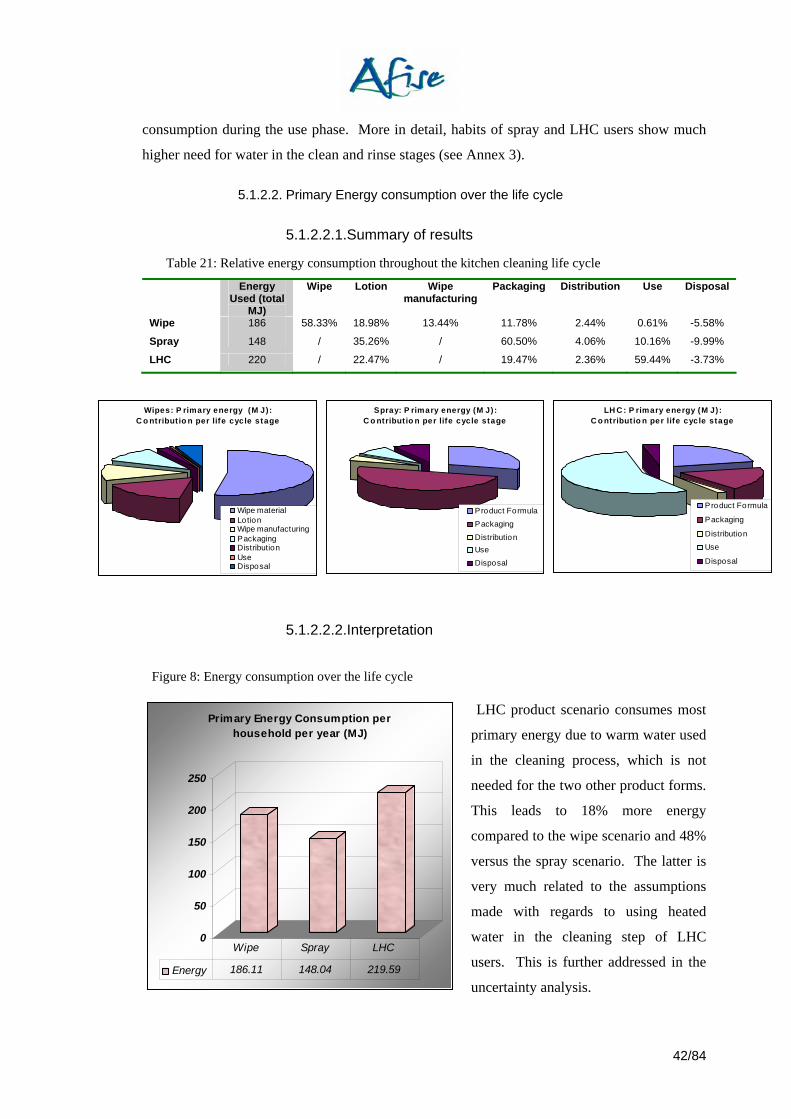
42/84
consumption during the use phase. More in detail, habits of spray and LHC users show much
higher need for water in the clean and rinse stages (see Annex 3).
5.1.2.2. Primary Energy consumption over the life cycle
5.1.2.2.1.Summary of results
Table 21: Relative energy consumption throughout the kitchen cleaning life cycle
Energy Used (total
MJ)
Wipe Lotion Wipe manufacturing
Packaging Distribution Use Disposal
Wipe 186 58.33% 18.98% 13.44% 11.78% 2.44% 0.61% -5.58%
Spray 148 / 35.26% / 60.50% 4.06% 10.16% -9.99%
LHC 220 / 22.47% / 19.47% 2.36% 59.44% -3.73%
5.1.2.2.2.Interpretation
LHC product scenario consumes most
primary energy due to warm water used
in the cleaning process, which is not
needed for the two other product forms.
This leads to 18% more energy
compared to the wipe scenario and 48%
versus the spray scenario. The latter is
very much related to the assumptions
made with regards to using heated
water in the cleaning step of LHC
users. This is further addressed in the
uncertainty analysis.
Figure 8: Energy consumption over the life cycle
Wipes: P rimary energy (M J): C o ntributio n per life cycle stage
Wipe materialLotionWipe manufacturingPackagingDistributionUseDisposal
Spray: P rimary energy (M J): C o ntribut io n per life cycle stage
Product FormulaPackaging
DistributionUseDisposal
LH C : P rimary energy (M J): C o ntribut io n per life cycle stage
Product Formula
Packaging
Distribution
Use
Disposal
0
50
100
150
200
250
Primary Energy Consumption per household per year (MJ)
Energy 186.11 148.04 219.59
Wipe Spray LHC
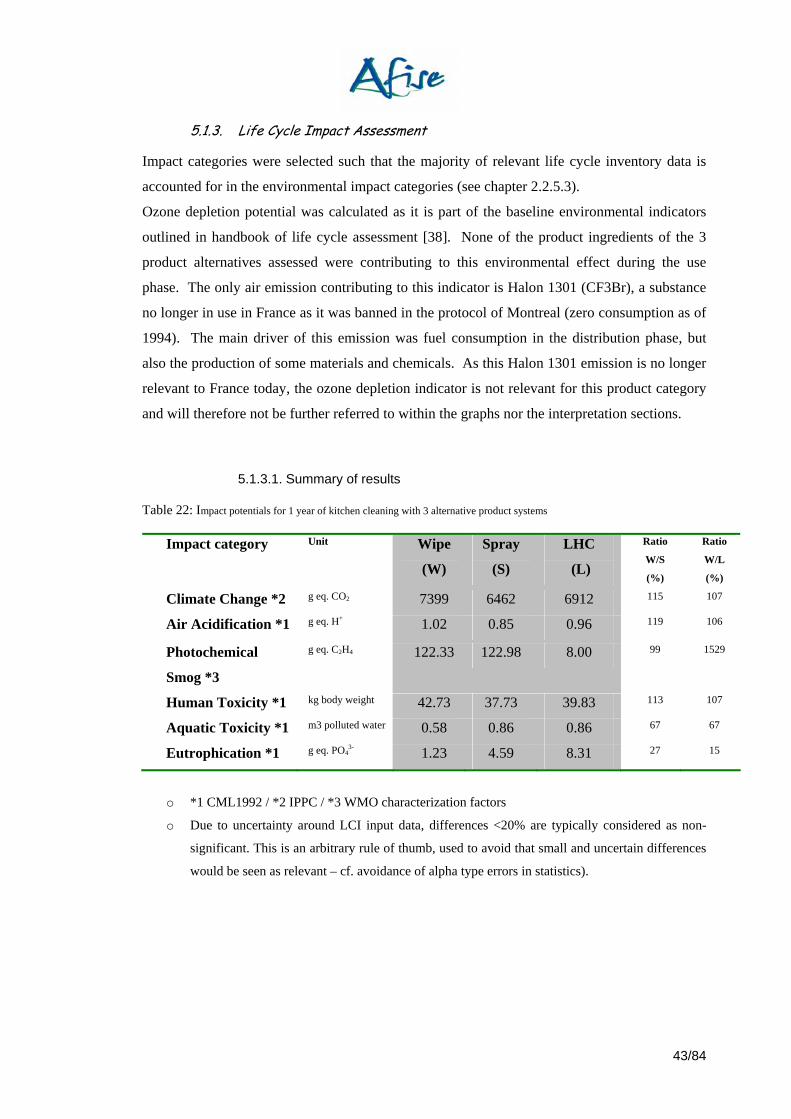
43/84
5.1.3. Life Cycle Impact Assessment
Impact categories were selected such that the majority of relevant life cycle inventory data is
accounted for in the environmental impact categories (see chapter 2.2.5.3).
Ozone depletion potential was calculated as it is part of the baseline environmental indicators
outlined in handbook of life cycle assessment [38]. None of the product ingredients of the 3
product alternatives assessed were contributing to this environmental effect during the use
phase. The only air emission contributing to this indicator is Halon 1301 (CF3Br), a substance
no longer in use in France as it was banned in the protocol of Montreal (zero consumption as of
1994). The main driver of this emission was fuel consumption in the distribution phase, but
also the production of some materials and chemicals. As this Halon 1301 emission is no longer
relevant to France today, the ozone depletion indicator is not relevant for this product category
and will therefore not be further referred to within the graphs nor the interpretation sections.
5.1.3.1. Summary of results
Table 22: Impact potentials for 1 year of kitchen cleaning with 3 alternative product systems
Impact category Unit Wipe
(W)
Spray
(S)
LHC
(L)
Ratio
W/S
(%)
Ratio
W/L
(%)
Climate Change *2 g eq. CO2 7399 6462 6912 115 107
Air Acidification *1 g eq. H+ 1.02 0.85 0.96 119 106
Photochemical
Smog *3
g eq. C2H4 122.33 122.98 8.00 99 1529
Human Toxicity *1 kg body weight 42.73 37.73 39.83 113 107
Aquatic Toxicity *1 m3 polluted water 0.58 0.86 0.86 67 67
Eutrophication *1 g eq. PO43- 1.23 4.59 8.31 27 15
o *1 CML1992 / *2 IPPC / *3 WMO characterization factors
o Due to uncertainty around LCI input data, differences <20% are typically considered as non-
significant. This is an arbitrary rule of thumb, used to avoid that small and uncertain differences
would be seen as relevant – cf. avoidance of alpha type errors in statistics).

44/84
5.1.3.2. Interpretation
Figure 9: Relative environmental impact of three assessed product systems
For the graphical
presentation, a spiderweb
chart is used, with all
relevant indicators on
different axes. Each
indicator is expressed relative
to an arbitrarily chosen
benchmark product, for
which the score is set at
100% on all axes. In this
study, the Spray product was
chosen as reference product category for displaying the LCIA indicators.
Climate change
As the differences in contribution to global warming potential between the product alternatives
is smaller then 20%, the difference is seen as non-significant. With respect to the life cycle
stages that drive the potential impact on climate change, production of product (or lotion)
ingredients for all 3 products is relatively important. However, the main contributors to climate
change are (table 11-13):
o for Wipes: raw materials of the wipe (cellulose fiber more in particular)
o for Spray: HDPE bottle and trigger elements (or packaging materials in general)
o for LHC: heating of water during the use phase
Air acidification
No significant differences noticed with regards to air acidification. Nitrogen and sulphur oxides
during production of ingredients and packaging materials are the main drivers.
Photochemical smog
Two chemical ingredients present in the Spray formula and the Wipe lotion are accounted for as
VOCs. in the LCA-model. As they are considered to be discharged directly to air (through
evaporation), they heavily contribute to the score. Therefore, with respect to photochemical
smog potential, LHC is by far the most preferred system.
Environmental Impact indicators
0%
50%
100%
150%
200%Climate Change
Air Acidification
PhotochemicalSmog
Human Toxicity
Aquatic Toxicity
Eutrophication
WipesSprayLHC
45/84
Human toxicity
With regards to human toxicity, no system is distinctly different either. Main contributors are
nitrogen and sulphur oxides. Here as well, production of ingredients and packaging materials
are the main drivers.
Aquatic eco-toxicity
With respect to potential impact on aquatic eco-toxicity, the wipe product shows to have the
best profile. The main contributing life cycle stages for the three products are:
- LHC: the use phase (product ingredients that go down the drain)
- Spray: the use phase (see LHC), but also making of packaging materials
- Wipes: wipe material ingredients (use phase is less important: again because of two
main chemicals that go immediately to the air phase).
Eutrophication
Wipes appear to have by far the best profile with respect to potential impact on eutrophication
(only 15% and 27% of the indicator value of respective the LHC and spray system). The results
are very much driven by the chemicals that are present in the respective product alternatives. It
should be pointed out that the COD during waste water treatment is the decisive factor of the
eutrophication parameter (because of absence of N/P ingredients in all products) (calculation
according to the CML92 model). The lower impact of wipes compared to the other two
products is due to the fact that an important part of the chemicals used in the cleaning step
remain on the wipe and finally either evaporate or end up in the municipal solid waste instead
of being released in the water as it is the case for the other 2 products.
5.1.4. Summary
An easy-to-understand overview table, by which the environmental impact of all 3 product
systems is compared, is shown by Table 22. This table is based on a method where a
classification for all 3 product alternatives and for each life cycle indicator score is done versus
‘average of class’ as benchmark. Classification is done into 3 classes; high, medium and low.
We (arbitrarily) classify ‘high’ as 120%, and ‘low’ as 80% of the benchmark, respectively.
This 20 % difference in either direction should take care of most of the uncertainty in a well
performed LCA (see above). The table comprises the 10 selected environmental indicators as
outlined in chapters 5.1.1 through 5.1.3. As this “average-of-class”-scenario does not represent
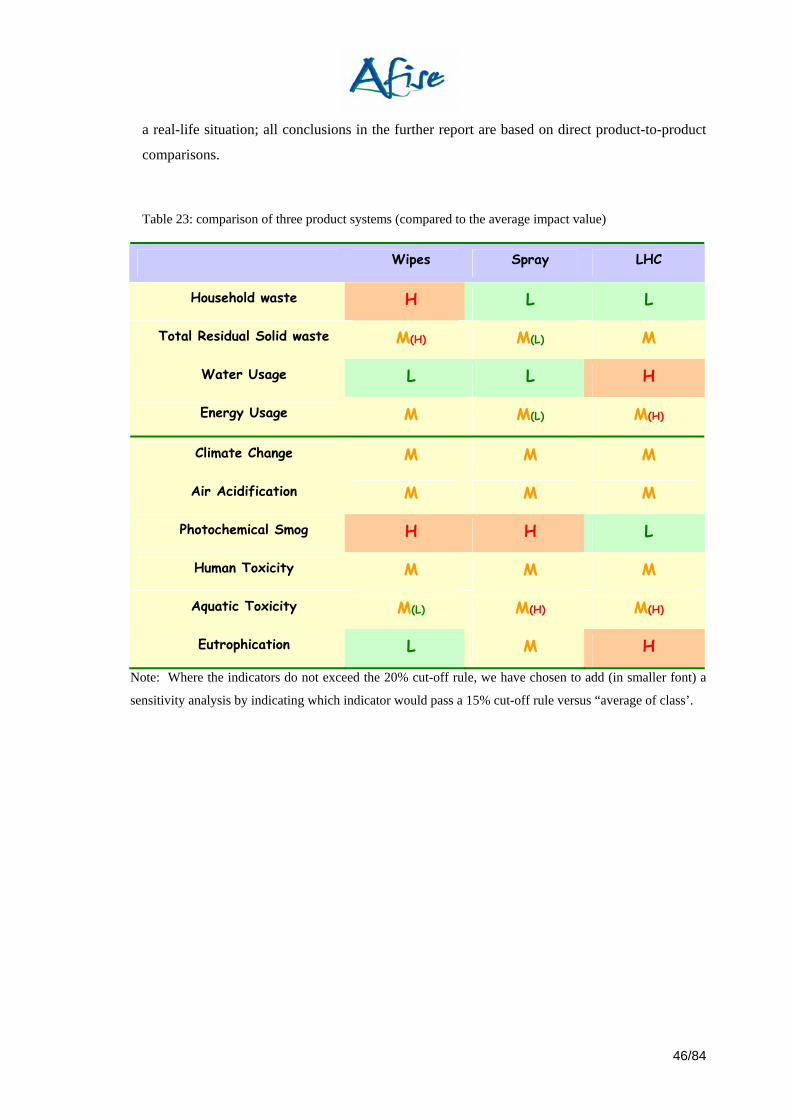
46/84
a real-life situation; all conclusions in the further report are based on direct product-to-product
comparisons.
Table 23: comparison of three product systems (compared to the average impact value)
Wipes Spray LHC
Household waste H L L
Total Residual Solid waste M(H) M(L) M
Water Usage L L H
Energy Usage M M(L) M(H)
Climate Change M M M
Air Acidification M M M
Photochemical Smog H H L
Human Toxicity M M M
Aquatic Toxicity M(L) M(H) M(H)
Eutrophication L M H
Note: Where the indicators do not exceed the 20% cut-off rule, we have chosen to add (in smaller font) a
sensitivity analysis by indicating which indicator would pass a 15% cut-off rule versus “average of class’.

47/84
5.2. Sensitivity analyses and simulations
The objective of this analysis is to test how a change on the input parameters propagates across
the entire system and by how much indicators change. Based on proposition of Ecobilan -
PricewaterhouseCoopers and Procter & Gamble, five elements (5.2.1 to 5.2.5) of the study were
highlighted as being subject to this analysis. A final chapter (5.2.6) summarizes and further
clarifies the interpretation of the sensitivity analysis. The selection of scenario’s included
aspects such as, data availability and quality, strength or weakness of assumptions made, could
have a different option been chosen with the same or similar degree of justification, potential
product changes.
The effect of changing the chosen elements by 1 or 2 alternative values and/or scenario’s is
assessed on all chosen impact categories and life cycle inventory indicators with relation to
solid waste, water and energy consumption.
For each scenario, the absolute indicator values will be displayed in a summary table. The
standard or reference scenario results will be shown on green background whilst the results of
the new scenario will be displayed on grey background if not affected. The results of the new
scenario, affected by more then 10% -when compared to the reference scenario- will be
displayed on orange background. Following the summary table, the results will be interpreted
in more detail where appropriate.
5.2.1. Equivalent product consumption
Habits & practices study are the basis for product consumption values and subsequently for
calculation of the reference flows (see 2.3.2). As no standard error is available on the given
values, we have approached the uncertainty analysis for this based on considering a different
scenario. In this alternative scenario, it is assumed that for cleaning with Spray and LHC, equal
aliquots of product are required as the amount of lotion present on 1 wipe. Hence, as 1 fresh
wipe contains 11.15ml of lotion, we could assume (7wipes/week) 78.05ml of Spray and LHC
are required to perform the same function as wipe users during 1 week (i.e. a decrease of 30%
of Spray and LHC volume). This change can be considered to be a worst case scenario for
wipes.
Table 24: alternative scenario for product consumption
Wipes Spray LHC
Base scenario 4070 ml/yr 6049 ml/yr 5840 ml/yr
Alternative scenario 4070 ml/yr 4070 ml/yr 4070 ml/yr
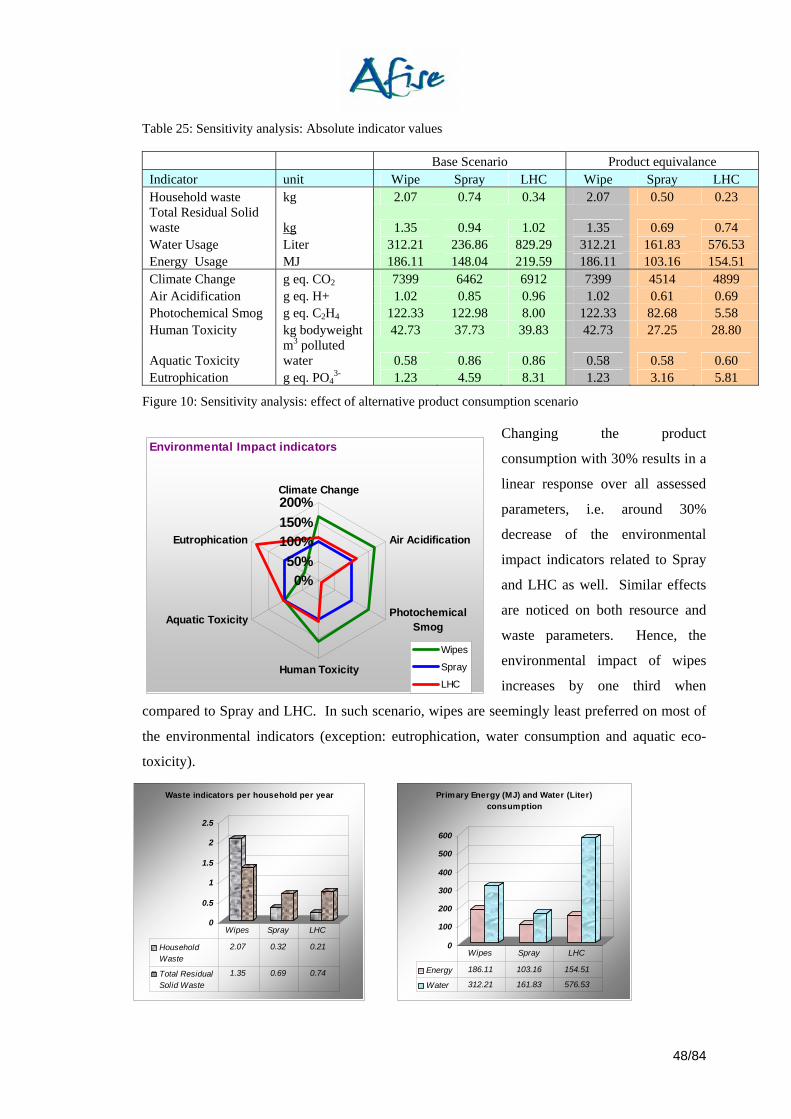
48/84
Table 25: Sensitivity analysis: Absolute indicator values
Base Scenario Product equivalance Indicator unit Wipe Spray LHC Wipe Spray LHC Household waste kg 2.07 0.74 0.34 2.07 0.50 0.23 Total Residual Solid waste kg 1.35 0.94 1.02 1.35 0.69 0.74 Water Usage Liter 312.21 236.86 829.29 312.21 161.83 576.53 Energy Usage MJ 186.11 148.04 219.59 186.11 103.16 154.51 Climate Change g eq. CO2 7399 6462 6912 7399 4514 4899 Air Acidification g eq. H+ 1.02 0.85 0.96 1.02 0.61 0.69 Photochemical Smog g eq. C2H4 122.33 122.98 8.00 122.33 82.68 5.58 Human Toxicity kg bodyweight 42.73 37.73 39.83 42.73 27.25 28.80
Aquatic Toxicity m3 polluted water 0.58 0.86 0.86 0.58 0.58 0.60
Eutrophication g eq. PO43- 1.23 4.59 8.31 1.23 3.16 5.81
Figure 10: Sensitivity analysis: effect of alternative product consumption scenario
Changing the product
consumption with 30% results in a
linear response over all assessed
parameters, i.e. around 30%
decrease of the environmental
impact indicators related to Spray
and LHC as well. Similar effects
are noticed on both resource and
waste parameters. Hence, the
environmental impact of wipes
increases by one third when
compared to Spray and LHC. In such scenario, wipes are seemingly least preferred on most of
the environmental indicators (exception: eutrophication, water consumption and aquatic eco-
toxicity).
0
0.5
1
1.5
2
2.5
Waste indicators per household per year
HouseholdWaste
2.07 0.32 0.21
Total ResidualSolid Waste
1.35 0.69 0.74
Wipes Spray LHC
0
100
200
300
400
500
600
Primary Energy (MJ) and Water (Liter) consumption
Energy 186.11 103.16 154.51
Water 312.21 161.83 576.53
Wipes Spray LHC
Environmental Impact indicators
0%50%
100%150%200%Climate Change
Air Acidification
PhotochemicalSmog
Human Toxicity
Aquatic Toxicity
Eutrophication
Wipes
Spray
LHC

49/84
5.2.2. Temperature and volume of water consumed in the use phase
As the information on water volume and temperature with respect to rinsing and cleaning habits
is rather limited, the uncertainty is addressed in 3 separate water consumption scenario’s as
displayed in table below. Also, a separate scenario was developed related to the energy source
used for heating of the water.
Table 26: Water volume and temperature sensitivity analysis
Water Temperature(°C) and volume
(Liter) see Annex 3
LHC cleaning
(30% of
households )
Wipes rinse
(9% of
households)
Spray rinse
(48% of
households )
LHC rinse
(70% of
households )
Base scenario (reference) 41.5°C / 4 L 12°C / 1L 12°C / 1L 12°C / 1L
1. LHC using less water in cleaning 41.5°C / 1 L 12°C / 1L 12°C / 1L 12°C / 1L
2. Cold water during LHC cleaning 12°C / 4L 12°C / 1L 12°C 2 / 1L 12°C / 1L
3. Heated water 41.5°C / 4L 41.5°C / 1L 41.5°C / 1L 41.5°C / 1L
5.2.2.1. Low water volume used in cleaning phase of LHC
The water consumption in the base scenario estimates 30% of the households (those people that
use diluted product) to use 4 Liters of heated water during the cleaning exercise. The other 70%
of households –that use neat product- only use water for rinsing, i.e. 1 Liter of cold water per
job (ref. Annex 3).
Herein, the volume of the cleaning water used for the LHC product is based on habits and
practices information for overall LHC product usage, i.e. no differentiation between floor
cleaning and other kitchen surfaces (all other data is specific to kitchen surfaces only,
excluding floors). Although uncertain whether this averaged value counts for other-then-floor
surfaces only, this single source of objective information related to LHC water consumption
was used for developing the base scenario.
To evaluate the uncertainty, an alternative scenario is developed where it is assumed the water
volume used in the cleaning exercise (for 30% of the households) is equal to that used for
rinsing (70% of the houdeholds). Although the usage if 1L of water during the cleaning phase
is regarded as relevant to a significant number of French households, this volume should be
seen as a worst-case (from a spray and wipe product point of view) scenario when representing
overall French habits. This significant (4 times) reduction in water consumption (for 30% of
the consumers that use diluted product) is of course immediately noticed in the life-cycle water
consumption and other indicators.
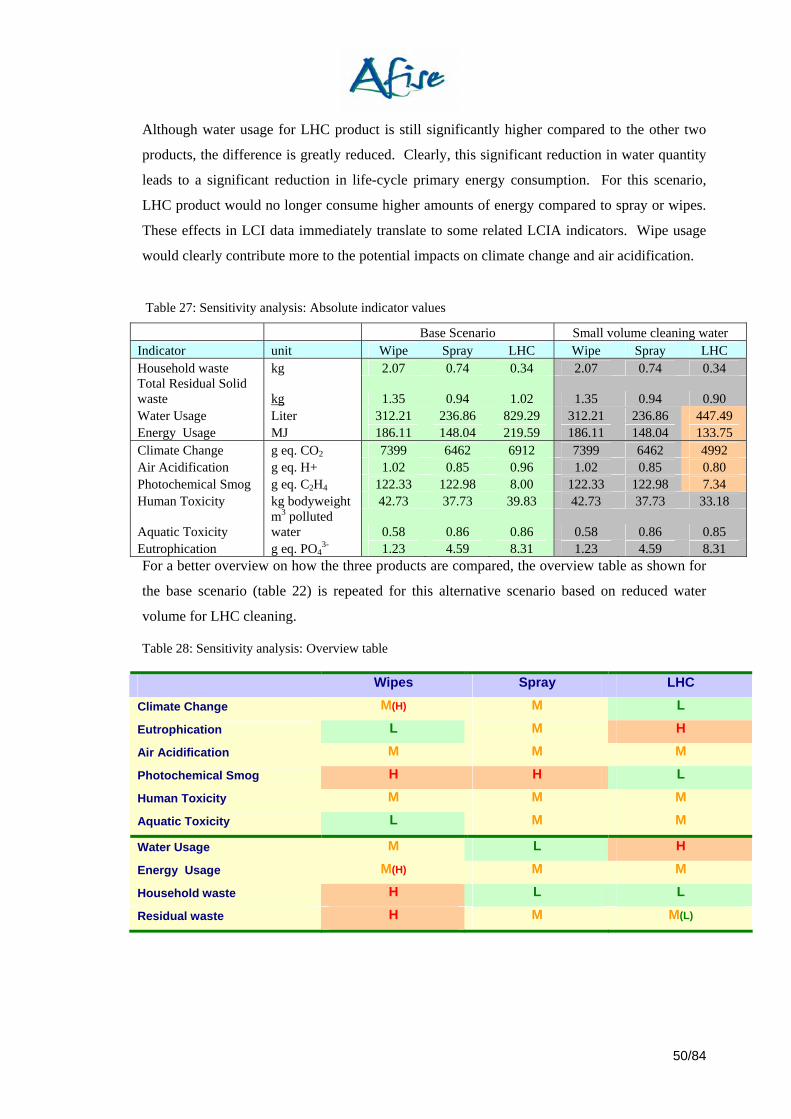
50/84
Although water usage for LHC product is still significantly higher compared to the other two
products, the difference is greatly reduced. Clearly, this significant reduction in water quantity
leads to a significant reduction in life-cycle primary energy consumption. For this scenario,
LHC product would no longer consume higher amounts of energy compared to spray or wipes.
These effects in LCI data immediately translate to some related LCIA indicators. Wipe usage
would clearly contribute more to the potential impacts on climate change and air acidification.
Table 27: Sensitivity analysis: Absolute indicator values
Base Scenario Small volume cleaning water Indicator unit Wipe Spray LHC Wipe Spray LHC Household waste kg 2.07 0.74 0.34 2.07 0.74 0.34 Total Residual Solid waste kg 1.35 0.94 1.02 1.35 0.94 0.90 Water Usage Liter 312.21 236.86 829.29 312.21 236.86 447.49 Energy Usage MJ 186.11 148.04 219.59 186.11 148.04 133.75 Climate Change g eq. CO2 7399 6462 6912 7399 6462 4992 Air Acidification g eq. H+ 1.02 0.85 0.96 1.02 0.85 0.80 Photochemical Smog g eq. C2H4 122.33 122.98 8.00 122.33 122.98 7.34 Human Toxicity kg bodyweight 42.73 37.73 39.83 42.73 37.73 33.18
Aquatic Toxicity m3 polluted water 0.58 0.86 0.86 0.58 0.86 0.85
Eutrophication g eq. PO43- 1.23 4.59 8.31 1.23 4.59 8.31
For a better overview on how the three products are compared, the overview table as shown for
the base scenario (table 22) is repeated for this alternative scenario based on reduced water
volume for LHC cleaning.
Table 28: Sensitivity analysis: Overview table
Wipes Spray LHC
Climate Change M(H) M L
Eutrophication L M H
Air Acidification M M M
Photochemical Smog H H L
Human Toxicity M M M
Aquatic Toxicity L M M
Water Usage M L H
Energy Usage M(H) M M
Household waste H L L
Residual waste H M M(L)
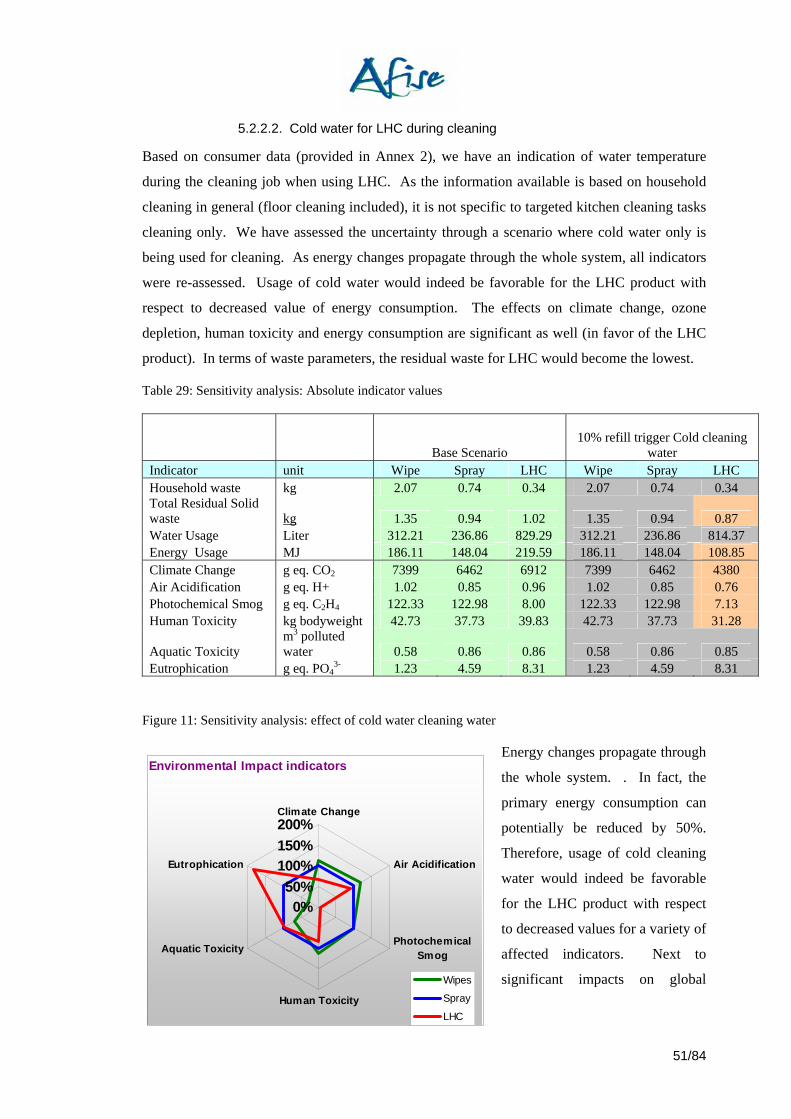
51/84
5.2.2.2. Cold water for LHC during cleaning
Based on consumer data (provided in Annex 2), we have an indication of water temperature
during the cleaning job when using LHC. As the information available is based on household
cleaning in general (floor cleaning included), it is not specific to targeted kitchen cleaning tasks
cleaning only. We have assessed the uncertainty through a scenario where cold water only is
being used for cleaning. As energy changes propagate through the whole system, all indicators
were re-assessed. Usage of cold water would indeed be favorable for the LHC product with
respect to decreased value of energy consumption. The effects on climate change, ozone
depletion, human toxicity and energy consumption are significant as well (in favor of the LHC
product). In terms of waste parameters, the residual waste for LHC would become the lowest.
Table 29: Sensitivity analysis: Absolute indicator values
Base Scenario
10% refill trigger Cold cleaning
water Indicator unit Wipe Spray LHC Wipe Spray LHC Household waste kg 2.07 0.74 0.34 2.07 0.74 0.34 Total Residual Solid waste kg 1.35 0.94 1.02 1.35 0.94 0.87 Water Usage Liter 312.21 236.86 829.29 312.21 236.86 814.37 Energy Usage MJ 186.11 148.04 219.59 186.11 148.04 108.85 Climate Change g eq. CO2 7399 6462 6912 7399 6462 4380 Air Acidification g eq. H+ 1.02 0.85 0.96 1.02 0.85 0.76 Photochemical Smog g eq. C2H4 122.33 122.98 8.00 122.33 122.98 7.13 Human Toxicity kg bodyweight 42.73 37.73 39.83 42.73 37.73 31.28
Aquatic Toxicity m3 polluted water 0.58 0.86 0.86 0.58 0.86 0.85
Eutrophication g eq. PO43- 1.23 4.59 8.31 1.23 4.59 8.31
Figure 11: Sensitivity analysis: effect of cold water cleaning water
Energy changes propagate through
the whole system. . In fact, the
primary energy consumption can
potentially be reduced by 50%.
Therefore, usage of cold cleaning
water would indeed be favorable
for the LHC product with respect
to decreased values for a variety of
affected indicators. Next to
significant impacts on global
Environmental Impact indicators
0%50%
100%150%200%Climate Change
Air Acidification
PhotochemicalSmog
Human Toxicity
Aquatic Toxicity
Eutrophication
Wipes
Spray
LHC

52/84
0
200
400
600
800
1000
Primary Energy (MJ) and Water (Liter) consumption
Energy 186.108 148.042 108.851
Water 312.205 236.855 814.369
Wipes Spray LHC
warming potential and air acidification, decreases in human toxicity and photochemical smog
are remarkable as well. With respect to waste parameters, the total residual solid waste for
LHC would become the lowest.
5.2.2.3. Warm water usage for rinsing
Based on unprecise product research information, usage of cold tap water in the rinse phase was
assumed. However, as no quantitative data is available, a sensitivity scenario is developed
where rinsing water temperature is assumed equal as the cleaning water temperature. Following
charts evaluate how the use of heated water during the rinse phase will propagate during the
life-cycle or how the environmental profile of the three products are compared in this scenario.
Table 30: Sensitivity analysis: Absolute indicator values
Base Scenario Warm Rinse Indicator unit Wipe Spray LHC Wipe Spray LHC Household waste kg 2.07 0.74 0.34 2.07 0.74 0.34 Total Residual Solid waste kg 1.35 0.94 1.02 1.36 1.00 1.11 Water Usage Liter 312.21 236.86 829.29 312.93 243.02 839.64 Energy Usage MJ 186.11 148.04 219.59 191.16 191.18 285.72 Climate Change g eq. CO2 7399 6462 6912 7515 7450 8428 Air Acidification g eq. H+ 1.02 0.85 0.96 1.02 0.93 1.08 Photochemical Smog g eq. C2H4 122.33 122.98 8.00 122.37 123.32 8.54 Human Toxicity kg bodyweight 42.73 37.73 39.83 43.12 41.07 44.98
Aquatic Toxicity m3 polluted water 0.58 0.86 0.86 0.58 0.86 0.87
Eutrophication g eq. PO43- 1.23 4.59 8.31 1.23 4.59 8.31
0
0.5
1
1.5
2
2.5
Waste indicators per household per year
HouseholdWaste
2.07 0.74 0.34
Total ResidualSolid Waste
1.3519 0.93961 0.865381
Wipes Spray LHC
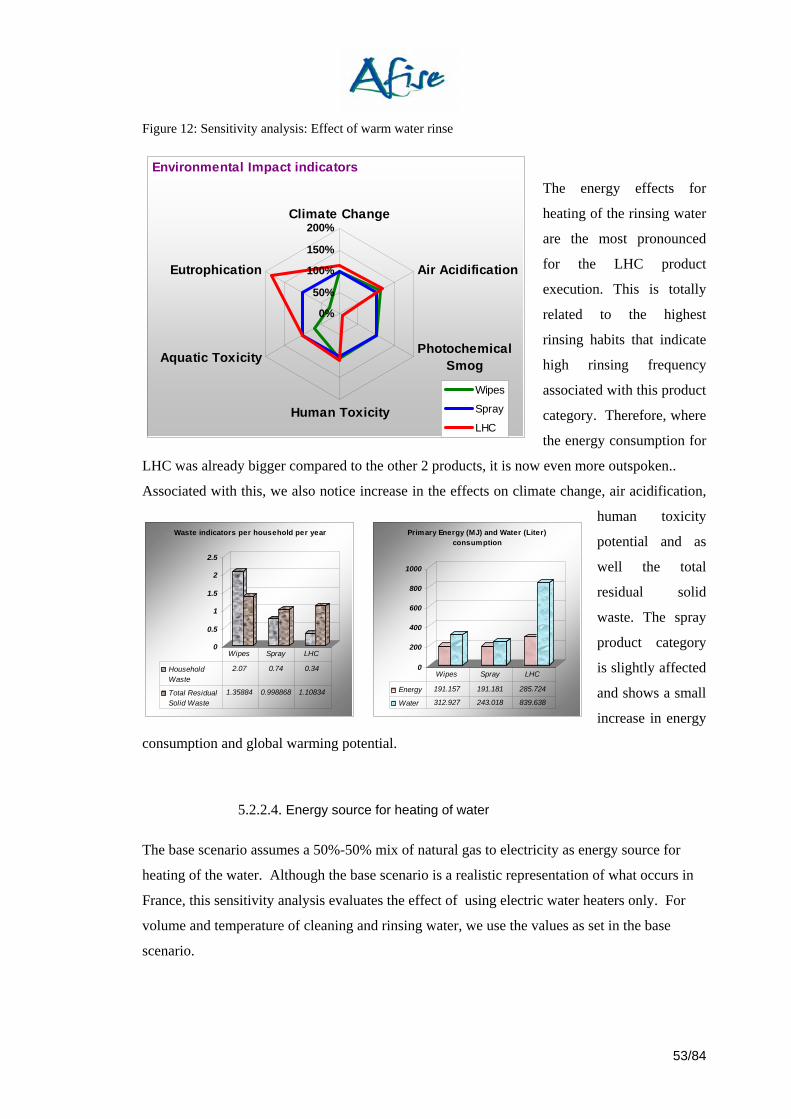
53/84
Figure 12: Sensitivity analysis: Effect of warm water rinse
The energy effects for
heating of the rinsing water
are the most pronounced
for the LHC product
execution. This is totally
related to the highest
rinsing habits that indicate
high rinsing frequency
associated with this product
category. Therefore, where
the energy consumption for
LHC was already bigger compared to the other 2 products, it is now even more outspoken..
Associated with this, we also notice increase in the effects on climate change, air acidification,
human toxicity
potential and as
well the total
residual solid
waste. The spray
product category
is slightly affected
and shows a small
increase in energy
consumption and global warming potential.
5.2.2.4. Energy source for heating of water
The base scenario assumes a 50%-50% mix of natural gas to electricity as energy source for
heating of the water. Although the base scenario is a realistic representation of what occurs in
France, this sensitivity analysis evaluates the effect of using electric water heaters only. For
volume and temperature of cleaning and rinsing water, we use the values as set in the base
scenario.
0
0.5
1
1.5
2
2.5
Waste indicators per household per year
HouseholdWaste
2.07 0.74 0.34
Total ResidualSolid Waste
1.35884 0.998868 1.10834
Wipes Spray LHC
0
200
400
600
800
1000
Primary Energy (MJ) and Water (Liter) consumption
Energy 191.157 191.181 285.724
Water 312.927 243.018 839.638
Wipes Spray LHC
Environmental Impact indicators
0%
50%
100%
150%
200%Climate Change
Air Acidification
PhotochemicalSmog
Human Toxicity
Aquatic Toxicity
Eutrophication
Wipes
Spray
LHC
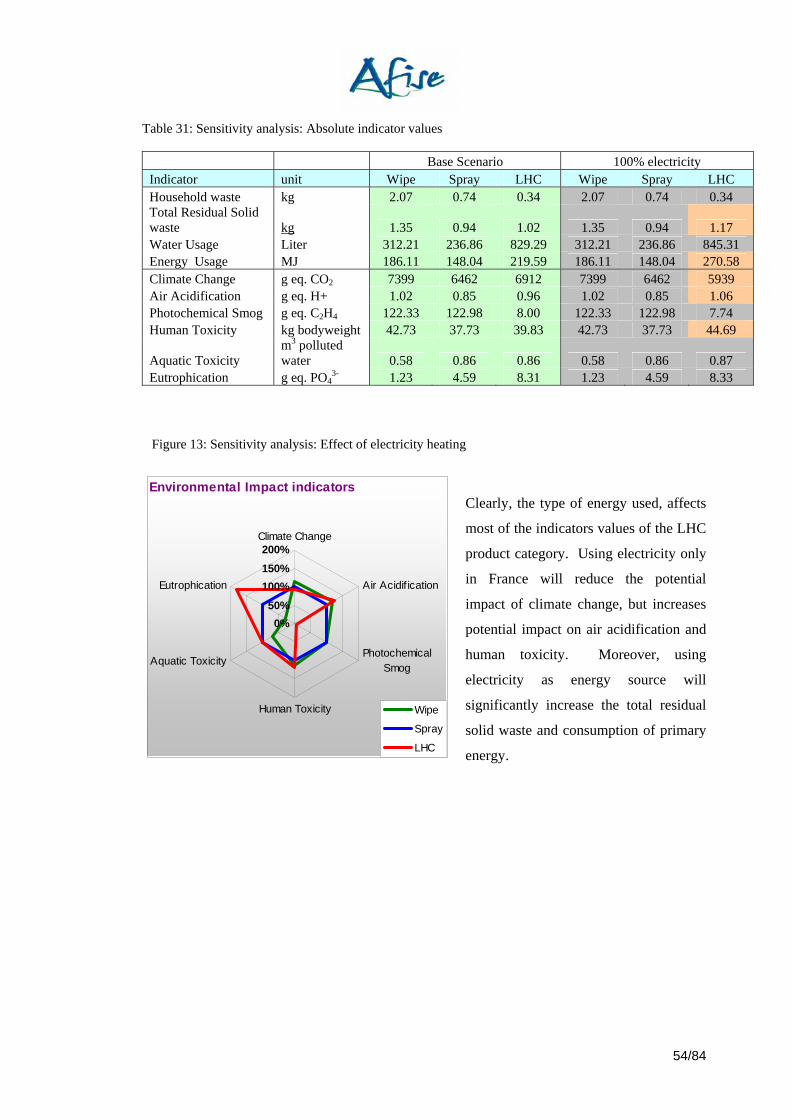
54/84
Table 31: Sensitivity analysis: Absolute indicator values
Base Scenario 100% electricity Indicator unit Wipe Spray LHC Wipe Spray LHC Household waste kg 2.07 0.74 0.34 2.07 0.74 0.34 Total Residual Solid waste kg 1.35 0.94 1.02 1.35 0.94 1.17 Water Usage Liter 312.21 236.86 829.29 312.21 236.86 845.31 Energy Usage MJ 186.11 148.04 219.59 186.11 148.04 270.58 Climate Change g eq. CO2 7399 6462 6912 7399 6462 5939 Air Acidification g eq. H+ 1.02 0.85 0.96 1.02 0.85 1.06 Photochemical Smog g eq. C2H4 122.33 122.98 8.00 122.33 122.98 7.74 Human Toxicity kg bodyweight 42.73 37.73 39.83 42.73 37.73 44.69
Aquatic Toxicity m3 polluted water 0.58 0.86 0.86 0.58 0.86 0.87
Eutrophication g eq. PO43- 1.23 4.59 8.31 1.23 4.59 8.33
Clearly, the type of energy used, affects
most of the indicators values of the LHC
product category. Using electricity only
in France will reduce the potential
impact of climate change, but increases
potential impact on air acidification and
human toxicity. Moreover, using
electricity as energy source will
significantly increase the total residual
solid waste and consumption of primary
energy.
Environmental Impact indicators
0%50%
100%150%200%
Climate Change
Air Acidif ication
PhotochemicalSmog
Human Toxicity
Aquatic Toxicity
Eutrophication
Wipe
Spray
LHC
Figure 13: Sensitivity analysis: Effect of electricity heating
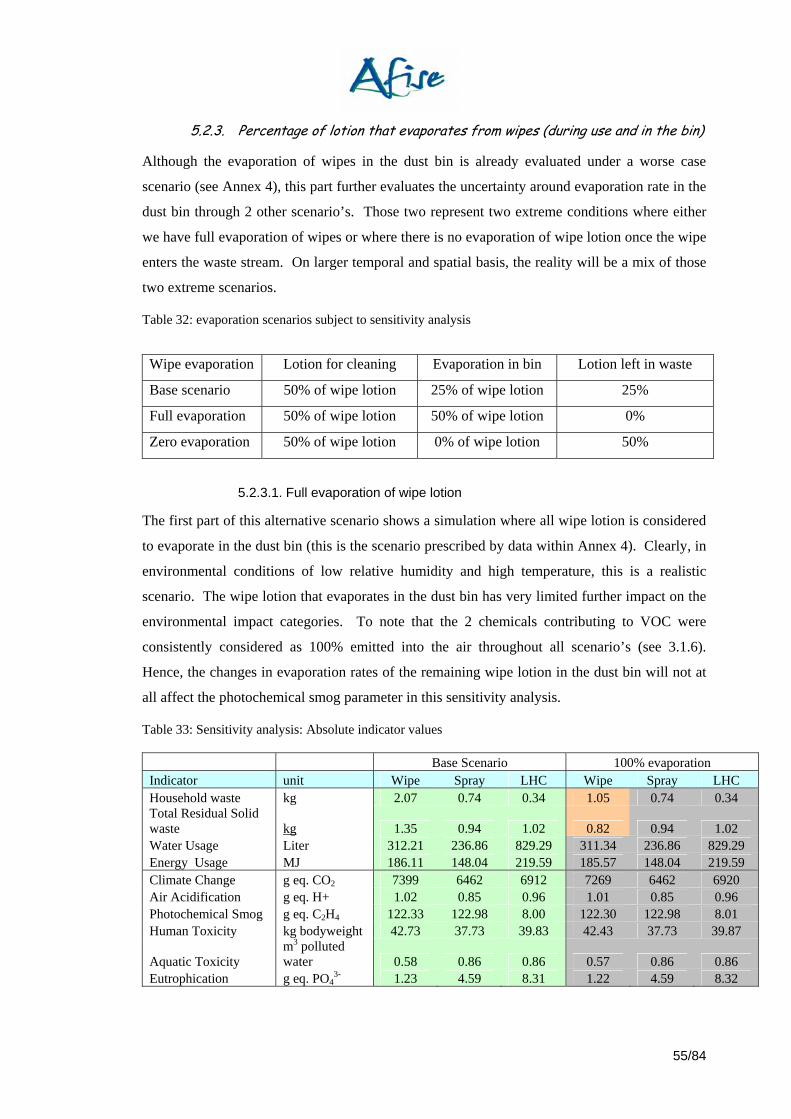
55/84
5.2.3. Percentage of lotion that evaporates from wipes (during use and in the bin)
Although the evaporation of wipes in the dust bin is already evaluated under a worse case
scenario (see Annex 4), this part further evaluates the uncertainty around evaporation rate in the
dust bin through 2 other scenario’s. Those two represent two extreme conditions where either
we have full evaporation of wipes or where there is no evaporation of wipe lotion once the wipe
enters the waste stream. On larger temporal and spatial basis, the reality will be a mix of those
two extreme scenarios.
Table 32: evaporation scenarios subject to sensitivity analysis
5.2.3.1. Full evaporation of wipe lotion
The first part of this alternative scenario shows a simulation where all wipe lotion is considered
to evaporate in the dust bin (this is the scenario prescribed by data within Annex 4). Clearly, in
environmental conditions of low relative humidity and high temperature, this is a realistic
scenario. The wipe lotion that evaporates in the dust bin has very limited further impact on the
environmental impact categories. To note that the 2 chemicals contributing to VOC were
consistently considered as 100% emitted into the air throughout all scenario’s (see 3.1.6).
Hence, the changes in evaporation rates of the remaining wipe lotion in the dust bin will not at
all affect the photochemical smog parameter in this sensitivity analysis.
Table 33: Sensitivity analysis: Absolute indicator values
Base Scenario 100% evaporation Indicator unit Wipe Spray LHC Wipe Spray LHC Household waste kg 2.07 0.74 0.34 1.05 0.74 0.34 Total Residual Solid waste kg 1.35 0.94 1.02 0.82 0.94 1.02 Water Usage Liter 312.21 236.86 829.29 311.34 236.86 829.29 Energy Usage MJ 186.11 148.04 219.59 185.57 148.04 219.59 Climate Change g eq. CO2 7399 6462 6912 7269 6462 6920 Air Acidification g eq. H+ 1.02 0.85 0.96 1.01 0.85 0.96 Photochemical Smog g eq. C2H4 122.33 122.98 8.00 122.30 122.98 8.01 Human Toxicity kg bodyweight 42.73 37.73 39.83 42.43 37.73 39.87
Aquatic Toxicity m3 polluted water 0.58 0.86 0.86 0.57 0.86 0.86
Eutrophication g eq. PO43- 1.23 4.59 8.31 1.22 4.59 8.32
Wipe evaporation Lotion for cleaning Evaporation in bin Lotion left in waste
Base scenario 50% of wipe lotion 25% of wipe lotion 25%
Full evaporation 50% of wipe lotion 50% of wipe lotion 0%
Zero evaporation 50% of wipe lotion 0% of wipe lotion 50%
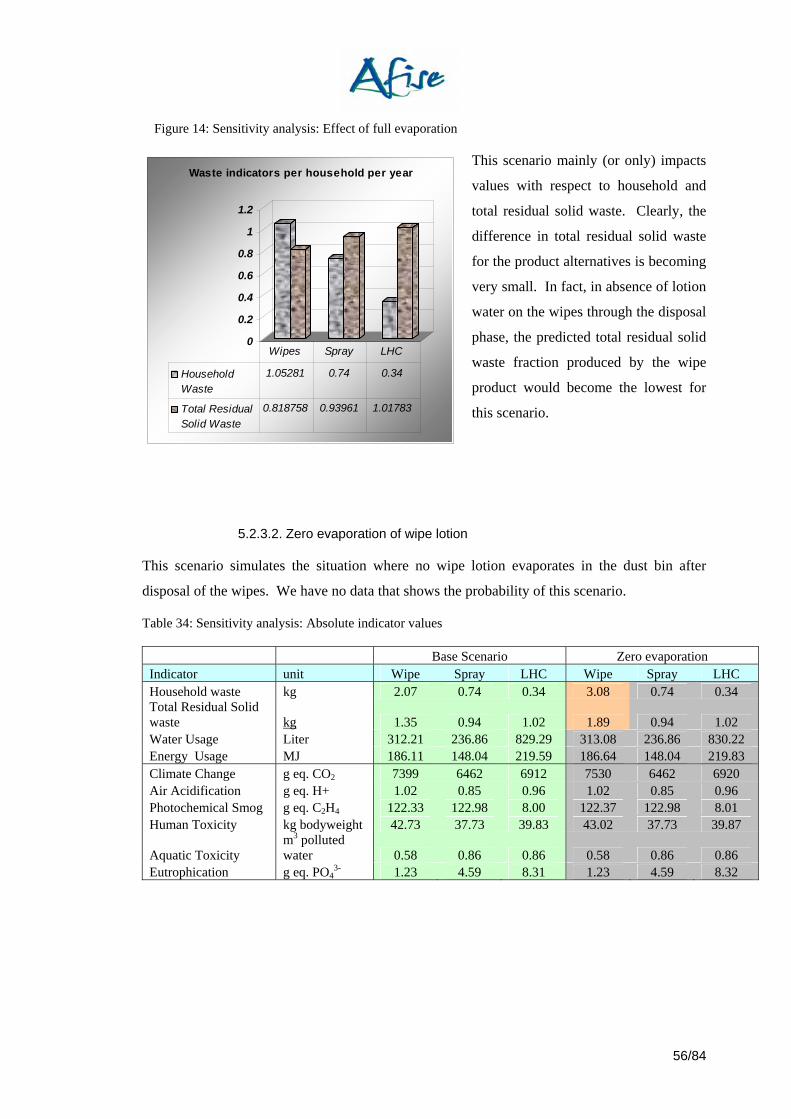
56/84
Figure 14: Sensitivity analysis: Effect of full evaporation
This scenario mainly (or only) impacts
values with respect to household and
total residual solid waste. Clearly, the
difference in total residual solid waste
for the product alternatives is becoming
very small. In fact, in absence of lotion
water on the wipes through the disposal
phase, the predicted total residual solid
waste fraction produced by the wipe
product would become the lowest for
this scenario.
5.2.3.2. Zero evaporation of wipe lotion
This scenario simulates the situation where no wipe lotion evaporates in the dust bin after
disposal of the wipes. We have no data that shows the probability of this scenario.
Table 34: Sensitivity analysis: Absolute indicator values
Base Scenario Zero evaporation Indicator unit Wipe Spray LHC Wipe Spray LHC Household waste kg 2.07 0.74 0.34 3.08 0.74 0.34 Total Residual Solid waste kg 1.35 0.94 1.02 1.89 0.94 1.02 Water Usage Liter 312.21 236.86 829.29 313.08 236.86 830.22 Energy Usage MJ 186.11 148.04 219.59 186.64 148.04 219.83 Climate Change g eq. CO2 7399 6462 6912 7530 6462 6920 Air Acidification g eq. H+ 1.02 0.85 0.96 1.02 0.85 0.96 Photochemical Smog g eq. C2H4 122.33 122.98 8.00 122.37 122.98 8.01 Human Toxicity kg bodyweight 42.73 37.73 39.83 43.02 37.73 39.87
Aquatic Toxicity m3 polluted water 0.58 0.86 0.86 0.58 0.86 0.86
Eutrophication g eq. PO43- 1.23 4.59 8.31 1.23 4.59 8.32
0
0.2
0.4
0.6
0.8
1
1.2
Waste indicators per household per year
HouseholdWaste
1.05281 0.74 0.34
Total ResidualSolid Waste
0.818758 0.93961 1.01783
Wipes Spray LHC

57/84
Figure 15: Sensitivity analysis: Effect of zero evaporation
As in previous scenario, there is no
change in effect on environmental
impact assessment indicators. In terms
of waste parameters, an increase of
wipe waste is noticed for both
household and total residual solid
waste. In this scenario, total residual
solid waste is twice that of spray and is
60% higher in mass compared to the
residual waste fraction of the LHC
product.
5.2.4. Wipe material
As further referred to within Annex 6, the life cycle inventory choice for the cellulosic material
is one of the main elements in the environmental profile of the wipe product. Two elements in
this process are further addressed:
5.2.4.1. Energy requirement for the cellulosic fiber making process:
Although the expected energy requirement for the optimized cellulosic fiber making process
[11] is estimated at 21MJ per kg of fiber, energy requirement for pilot plant tests in 1996 were
consuming 47MJ for the same unit (1kg fiber). The uncertainty on energy requirement was
assessed for the latter value of 47MJ. Table 35: Sensitivity analysis: Absolute indicator values
Base Scenario High energy for wipe fibre Indicator unit Wipe Spray LHC Wipe Spray LHC Household waste kg 2.07 0.74 0.34 2.07 0.74 0.34 Total Residual Solid waste kg 1.35 0.94 1.02 1.44 0.94 1.02 Water Usage Liter 312.21 236.86 829.29 315.02 236.86 830.22 Energy Usage MJ 186.11 148.04 219.59 211.82 148.04 219.83 Climate Change g eq. CO2 7399 6462 6912 8694 6462 6920 Air Acidification g eq. H+ 1.02 0.85 0.96 1.17 0.85 0.96 Photochemical Smog g eq. C2H4 122.33 122.98 8.00 122.78 122.98 8.01 Human Toxicity kg bodyweight 42.73 37.73 39.83 50.04 37.73 39.87
Aquatic Toxicity m3 polluted water 0.58 0.86 0.86 0.58 0.86 0.86
Eutrophication g eq. PO43- 1.23 4.59 8.31 1.23 4.59 8.32
0
0.5
1
1.52
2.5
3
3.5
Waste indicators per household per year
HouseholdWaste
3.082112 0.74 0.34
Total ResidualSolid Waste
1.88505 0.93961 1.01783
Wipes Spray LHC
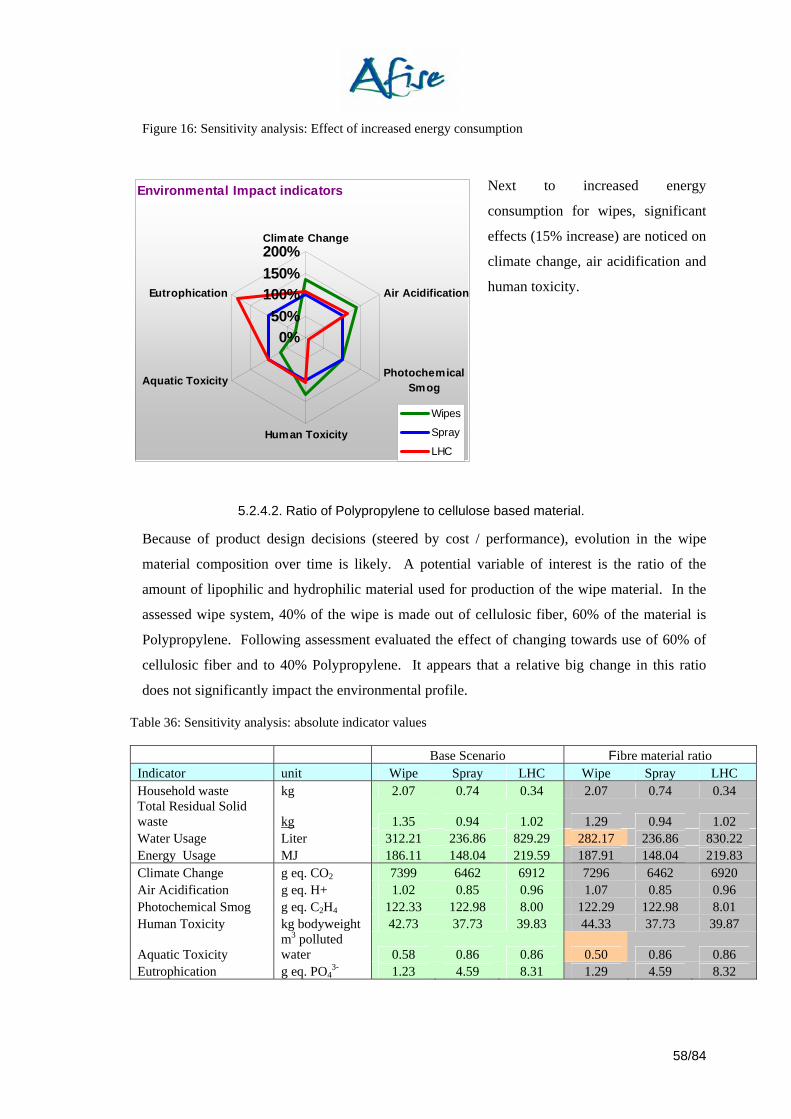
58/84
Figure 16: Sensitivity analysis: Effect of increased energy consumption
Next to increased energy
consumption for wipes, significant
effects (15% increase) are noticed on
climate change, air acidification and
human toxicity.
5.2.4.2. Ratio of Polypropylene to cellulose based material.
Because of product design decisions (steered by cost / performance), evolution in the wipe
material composition over time is likely. A potential variable of interest is the ratio of the
amount of lipophilic and hydrophilic material used for production of the wipe material. In the
assessed wipe system, 40% of the wipe is made out of cellulosic fiber, 60% of the material is
Polypropylene. Following assessment evaluated the effect of changing towards use of 60% of
cellulosic fiber and to 40% Polypropylene. It appears that a relative big change in this ratio
does not significantly impact the environmental profile.
Table 36: Sensitivity analysis: absolute indicator values
Base Scenario Fibre material ratio Indicator unit Wipe Spray LHC Wipe Spray LHC Household waste kg 2.07 0.74 0.34 2.07 0.74 0.34 Total Residual Solid waste kg 1.35 0.94 1.02 1.29 0.94 1.02 Water Usage Liter 312.21 236.86 829.29 282.17 236.86 830.22 Energy Usage MJ 186.11 148.04 219.59 187.91 148.04 219.83 Climate Change g eq. CO2 7399 6462 6912 7296 6462 6920 Air Acidification g eq. H+ 1.02 0.85 0.96 1.07 0.85 0.96 Photochemical Smog g eq. C2H4 122.33 122.98 8.00 122.29 122.98 8.01 Human Toxicity kg bodyweight 42.73 37.73 39.83 44.33 37.73 39.87
Aquatic Toxicity m3 polluted water 0.58 0.86 0.86 0.50 0.86 0.86
Eutrophication g eq. PO43- 1.23 4.59 8.31 1.29 4.59 8.32
Environmental Impact indicators
0%50%
100%150%200%Climate Change
Air Acidification
PhotochemicalSmog
Human Toxicity
Aquatic Toxicity
Eutrophication
Wipes
Spray
LHC
59/84
For the wipe product category, 65% of the primary energy is consumed through production of
wipe material. With respect to primary energy consumption, we have not yet split-up into
renewable and non-renewable energy. Our data estimates 84% of the cellulosic fibre is
produced with help of renewable energy sources, whilst primary energy consumption for
polypropylene production is mainly (99%) based on non-renewable energy. As there is no
significant difference in total primary energy consumption for both fibre types, the standard
scenario would predict 19% of the wipe material energy to be related to renewable sources. In
case of the alternative cellulose/PP ratio scenario, 29% of the primary energy consumption
would be generated by renewable sources. Although this would predict substantial differences,
we need to emphasize the differences in the underlying life cycle inventories. Whilst PP
inventory averages 79% of European PP production (1999), the cellulose LCI is based on 1
production site in Germany (1996).
In the context of renewable resources, we could also consider the use of agro-bio ingredients.
In the current study, formula ingredients represent respectively 19%, 35% and 22% of the life
cycle primary energy consumption for wipes, spray and LHC product. Although few
opportunities can be found for spray and LHC product, use of bio-ethanol is a potential
candidate to replace the current ethanol as a key wipe ingredient. Changing to use of bio-
ethanol would lead to 10% reduction in use of non-renewable energy for the wipe scenario.
5.2.5. Spray Refill bottles
Another sensitivity analysis is performed on the spray system which evaluates the scenario of
reducing the impact of waste produced by the spray trigger. Rather then having the spray
bottles available with trigger element included, it might be feasible to place household products
on the market without the trigger element. In that case, the HDPE-bottle can be considered as a
refill bottle, where simply the consumer needs to put the trigger of his/her previous bottle on the
newly purchases system without trigger system. The scenario evaluated, is such where
consumers would purchase 9 refill bottles for 1 bottle with trigger element (90% refill bottles).
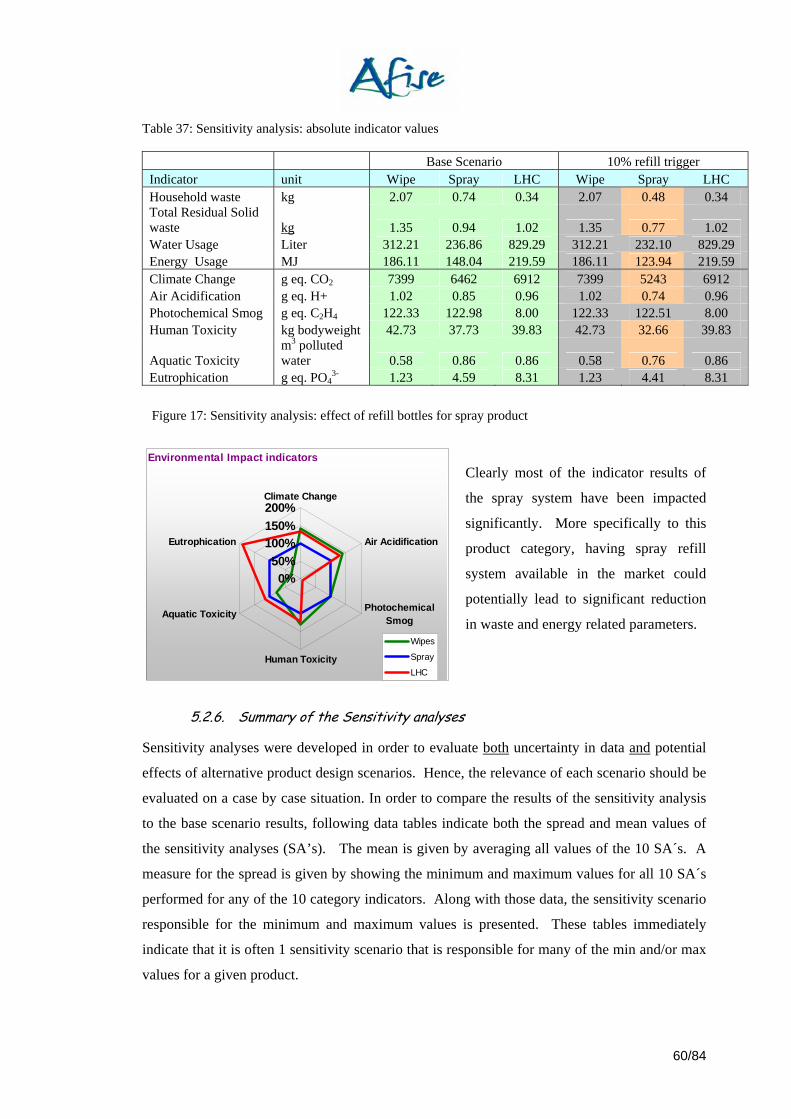
60/84
Table 37: Sensitivity analysis: absolute indicator values
Base Scenario 10% refill trigger Indicator unit Wipe Spray LHC Wipe Spray LHC Household waste kg 2.07 0.74 0.34 2.07 0.48 0.34 Total Residual Solid waste kg 1.35 0.94 1.02 1.35 0.77 1.02 Water Usage Liter 312.21 236.86 829.29 312.21 232.10 829.29 Energy Usage MJ 186.11 148.04 219.59 186.11 123.94 219.59 Climate Change g eq. CO2 7399 6462 6912 7399 5243 6912 Air Acidification g eq. H+ 1.02 0.85 0.96 1.02 0.74 0.96 Photochemical Smog g eq. C2H4 122.33 122.98 8.00 122.33 122.51 8.00 Human Toxicity kg bodyweight 42.73 37.73 39.83 42.73 32.66 39.83
Aquatic Toxicity m3 polluted water 0.58 0.86 0.86 0.58 0.76 0.86
Eutrophication g eq. PO43- 1.23 4.59 8.31 1.23 4.41 8.31
.
Clearly most of the indicator results of
the spray system have been impacted
significantly. More specifically to this
product category, having spray refill
system available in the market could
potentially lead to significant reduction
in waste and energy related parameters.
5.2.6. Summary of the Sensitivity analyses
Sensitivity analyses were developed in order to evaluate both uncertainty in data and potential
effects of alternative product design scenarios. Hence, the relevance of each scenario should be
evaluated on a case by case situation. In order to compare the results of the sensitivity analysis
to the base scenario results, following data tables indicate both the spread and mean values of
the sensitivity analyses (SA’s). The mean is given by averaging all values of the 10 SA´s. A
measure for the spread is given by showing the minimum and maximum values for all 10 SA´s
performed for any of the 10 category indicators. Along with those data, the sensitivity scenario
responsible for the minimum and maximum values is presented. These tables immediately
indicate that it is often 1 sensitivity scenario that is responsible for many of the min and/or max
values for a given product.
Figure 17: Sensitivity analysis: effect of refill bottles for spray product
Environmental Impact indicators
0%50%
100%150%200%Climate Change
Air Acidification
PhotochemicalSmog
Human Toxicity
Aquatic Toxicity
Eutrophication
Wipes
Spray
LHC
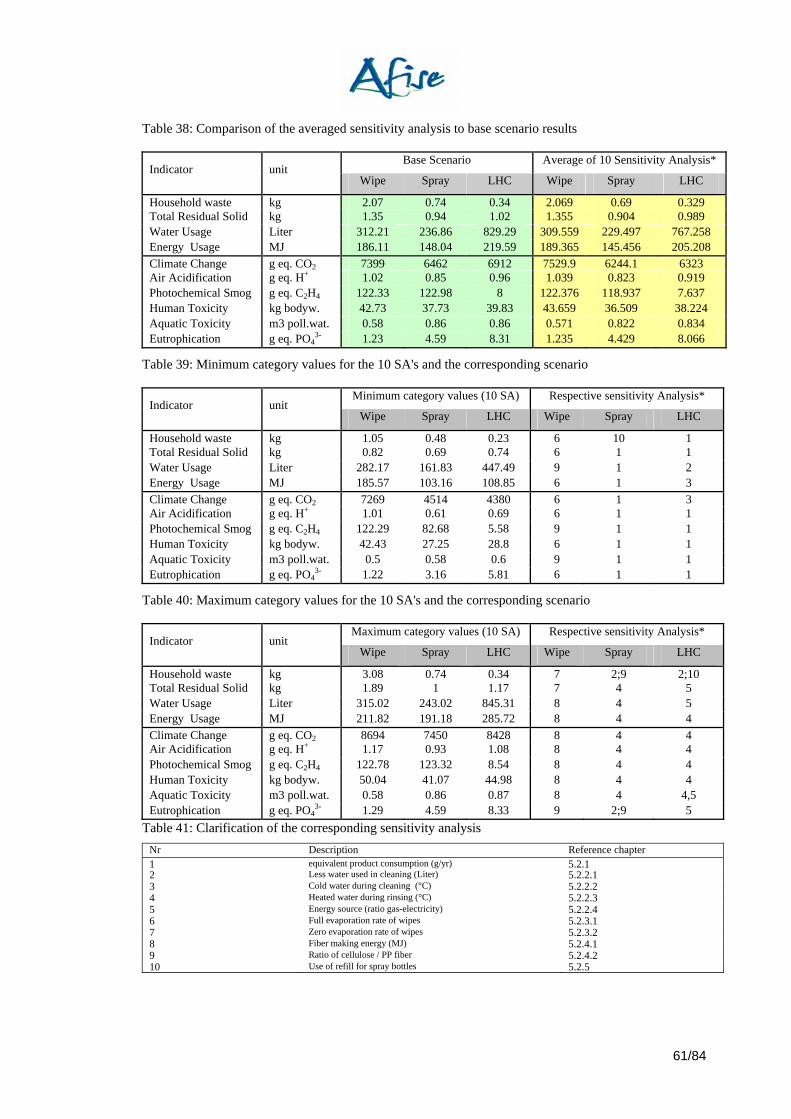
61/84
Table 38: Comparison of the averaged sensitivity analysis to base scenario results
Base Scenario Average of 10 Sensitivity Analysis* Indicator unit
Wipe Spray LHC Wipe Spray LHC
Household waste kg 2.07 0.74 0.34 2.069 0.69 0.329 Total Residual Solid kg 1.35 0.94 1.02 1.355 0.904 0.989 Water Usage Liter 312.21 236.86 829.29 309.559 229.497 767.258 Energy Usage MJ 186.11 148.04 219.59 189.365 145.456 205.208 Climate Change g eq. CO2 7399 6462 6912 7529.9 6244.1 6323 Air Acidification g eq. H+ 1.02 0.85 0.96 1.039 0.823 0.919 Photochemical Smog g eq. C2H4 122.33 122.98 8 122.376 118.937 7.637 Human Toxicity kg bodyw. 42.73 37.73 39.83 43.659 36.509 38.224 Aquatic Toxicity m3 poll.wat. 0.58 0.86 0.86 0.571 0.822 0.834 Eutrophication g eq. PO4
3- 1.23 4.59 8.31 1.235 4.429 8.066
Table 39: Minimum category values for the 10 SA's and the corresponding scenario
Minimum category values (10 SA) Respective sensitivity Analysis* Indicator unit
Wipe Spray LHC Wipe Spray LHC
Household waste kg 1.05 0.48 0.23 6 10 1 Total Residual Solid kg 0.82 0.69 0.74 6 1 1 Water Usage Liter 282.17 161.83 447.49 9 1 2 Energy Usage MJ 185.57 103.16 108.85 6 1 3 Climate Change g eq. CO2 7269 4514 4380 6 1 3 Air Acidification g eq. H+ 1.01 0.61 0.69 6 1 1 Photochemical Smog g eq. C2H4 122.29 82.68 5.58 9 1 1 Human Toxicity kg bodyw. 42.43 27.25 28.8 6 1 1 Aquatic Toxicity m3 poll.wat. 0.5 0.58 0.6 9 1 1 Eutrophication g eq. PO4
3- 1.22 3.16 5.81 6 1 1
Table 40: Maximum category values for the 10 SA's and the corresponding scenario
Maximum category values (10 SA) Respective sensitivity Analysis* Indicator unit
Wipe Spray LHC Wipe Spray LHC
Household waste kg 3.08 0.74 0.34 7 2;9 2;10 Total Residual Solid kg 1.89 1 1.17 7 4 5 Water Usage Liter 315.02 243.02 845.31 8 4 5 Energy Usage MJ 211.82 191.18 285.72 8 4 4 Climate Change g eq. CO2 8694 7450 8428 8 4 4 Air Acidification g eq. H+ 1.17 0.93 1.08 8 4 4 Photochemical Smog g eq. C2H4 122.78 123.32 8.54 8 4 4 Human Toxicity kg bodyw. 50.04 41.07 44.98 8 4 4 Aquatic Toxicity m3 poll.wat. 0.58 0.86 0.87 8 4 4,5 Eutrophication g eq. PO4
3- 1.29 4.59 8.33 9 2;9 5 Table 41: Clarification of the corresponding sensitivity analysis
Nr Description Reference chapter 1 equivalent product consumption (g/yr) 5.2.1 2 Less water used in cleaning (Liter) 5.2.2.1 3 Cold water during cleaning (°C) 5.2.2.2 4 Heated water during rinsing (°C) 5.2.2.3 5 Energy source (ratio gas-electricity) 5.2.2.4 6 Full evaporation rate of wipes 5.2.3.1 7 Zero evaporation rate of wipes 5.2.3.2 8 Fiber making energy (MJ) 5.2.4.1 9 Ratio of cellulose / PP fiber 5.2.4.2 10 Use of refill for spray bottles 5.2.5
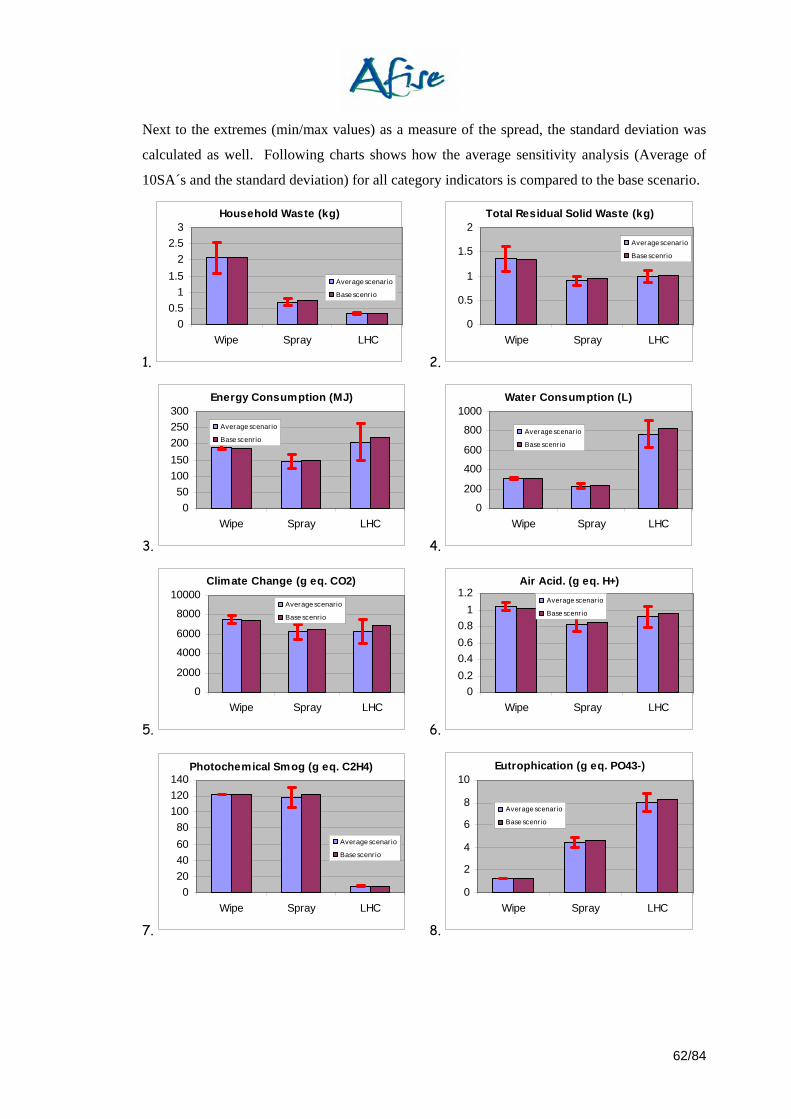
62/84
Next to the extremes (min/max values) as a measure of the spread, the standard deviation was
calculated as well. Following charts shows how the average sensitivity analysis (Average of
10SA´s and the standard deviation) for all category indicators is compared to the base scenario.
1.
Household Waste (kg)
00.5
11.5
22.5
3
Wipe Spray LHC
Average scenar io
Base scenr io
2.
Total Residual Solid Waste (kg)
0
0.5
1
1.5
2
Wipe Spray LHC
Average scenar io
Base scenrio
3.
Energy Consumption (MJ)
050
100150200250300
Wipe Spray LHC
Average scenar io
Base scenr io
4.
Water Consumption (L)
0
200
400
600
800
1000
Wipe Spray LHC
Average scenario
Base scenrio
5.
Climate Change (g eq. CO2)
0
2000
4000
6000
8000
10000
Wipe Spray LHC
Average scenario
Base scenrio
6.
Air Acid. (g eq. H+)
00.20.40.60.8
11.2
Wipe Spray LHC
Average scenar io
Base scenr io
7.
Photochemical Smog (g eq. C2H4)
020406080
100120140
Wipe Spray LHC
Average scenar io
Base scenr io
8.
Eutrophication (g eq. PO43-)
0
2
4
6
8
10
Wipe Spray LHC
Average scenario
Base scenr io

63/84
9.
Human Tox. (kg bw)
0
10
20
30
40
50
Wipe Spray LHC
Average scenar io
Base scenr io
10.
Aquatic Eco-tox. (m3 pw)
0
0.2
0.4
0.6
0.8
1
Wipe Spray LHC
Average scenario
Base scenrio
The spread for some of the category indicators -for one or more products- indicates some level
of uncertainty in the developed base scenario. In most cases, the end conclusion based on the
base scenario is not affected. In two cases, where the base scenario predicts a significant
difference based on an arbitrary chosen significance interval of 20%, the averaged sensitivity
analysis turns this into not significant differences:
• Where the base scenario predicts 32% more Total Residual solid waste for wipes versus
LHC product, the difference becomes non-significant.
• Where the base scenario predicts a 48% difference in energy consumption between
LHC and the spray product, this approach indicates the difference to be non-significant.
Following paragraph further clarifies the decisions taken with respect to data uncertainty. For
all study parameters where no or uncertain data was available, an alternative scenario was
performed based on best availability data. Where no data was available (realistic assumptions
are made for the base scenario), a sensitivity scenario was developed with large range (e.g. 0-
100%). Where data was based on uncertain study material, a sensitivity scenario was
performed in concurrence with the critical review consultants and Ecobilan-PwC. Some of the
scenarios developed were not designed to evaluate the sensitivity of the uncertain parameter as
a full range. Therefore, the choices made are unidirectionally affecting the environmental
impacts of one or more particular products. Hereby, the sensitivity analysis is intended to
demonstrate the sensitivity of the parameter affected and not to show the absolute minimum or
maximum values for the different products for each of the category indicators. Following table
summarizes how the base scenario variables are affected for development of the 10 sensitivity
scenarios. The color coding indicates how the parameter is likely to under (green)- or
overestimate (red) the environmental impact based on value judgment of the authors reflecting
the best available data at hand. The yellow color indicates a level of uncertainty in the data
(unclear whether it under- or overestimates).
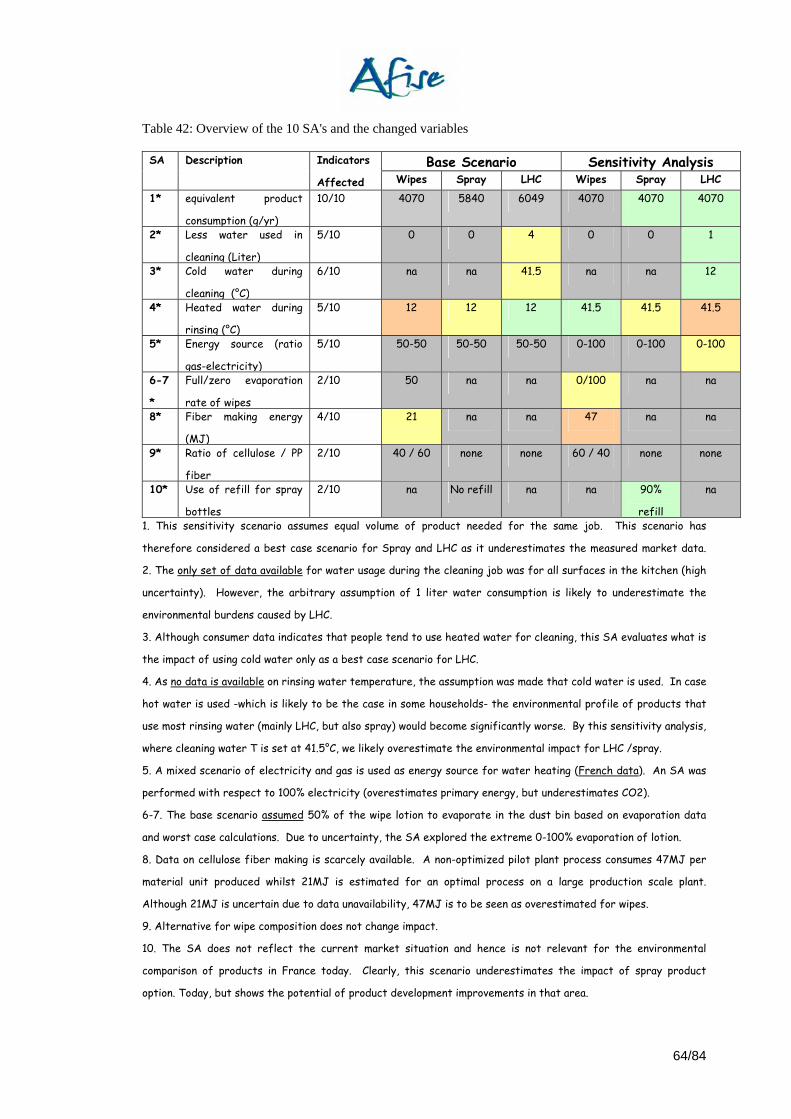
64/84
Table 42: Overview of the 10 SA's and the changed variables
Base Scenario Sensitivity Analysis SA Description Indicators
Affected Wipes Spray LHC Wipes Spray LHC
1* equivalent product
consumption (g/yr)
10/10 4070 5840 6049 4070 4070 4070
2* Less water used in
cleaning (Liter)
5/10 0 0 4 0 0 1
3* Cold water during
cleaning (°C)
6/10 na na 41.5 na na 12
4* Heated water during
rinsing (°C)
5/10 12 12 12 41.5 41.5 41.5
5* Energy source (ratio
gas-electricity)
5/10 50-50 50-50 50-50 0-100 0-100 0-100
6-7
*
Full/zero evaporation
rate of wipes
2/10 50 na na 0/100 na na
8* Fiber making energy
(MJ)
4/10 21 na na 47 na na
9* Ratio of cellulose / PP
fiber
2/10 40 / 60 none none 60 / 40 none none
10* Use of refill for spray
bottles
2/10 na No refill na na 90%
refill
na
1. This sensitivity scenario assumes equal volume of product needed for the same job. This scenario has
therefore considered a best case scenario for Spray and LHC as it underestimates the measured market data.
2. The only set of data available for water usage during the cleaning job was for all surfaces in the kitchen (high
uncertainty). However, the arbitrary assumption of 1 liter water consumption is likely to underestimate the
environmental burdens caused by LHC.
3. Although consumer data indicates that people tend to use heated water for cleaning, this SA evaluates what is
the impact of using cold water only as a best case scenario for LHC.
4. As no data is available on rinsing water temperature, the assumption was made that cold water is used. In case
hot water is used -which is likely to be the case in some households- the environmental profile of products that
use most rinsing water (mainly LHC, but also spray) would become significantly worse. By this sensitivity analysis,
where cleaning water T is set at 41.5°C, we likely overestimate the environmental impact for LHC /spray.
5. A mixed scenario of electricity and gas is used as energy source for water heating (French data). An SA was
performed with respect to 100% electricity (overestimates primary energy, but underestimates CO2).
6-7. The base scenario assumed 50% of the wipe lotion to evaporate in the dust bin based on evaporation data
and worst case calculations. Due to uncertainty, the SA explored the extreme 0-100% evaporation of lotion.
8. Data on cellulose fiber making is scarcely available. A non-optimized pilot plant process consumes 47MJ per
material unit produced whilst 21MJ is estimated for an optimal process on a large production scale plant.
Although 21MJ is uncertain due to data unavailability, 47MJ is to be seen as overestimated for wipes.
9. Alternative for wipe composition does not change impact.
10. The SA does not reflect the current market situation and hence is not relevant for the environmental
comparison of products in France today. Clearly, this scenario underestimates the impact of spray product
option. Today, but shows the potential of product development improvements in that area.
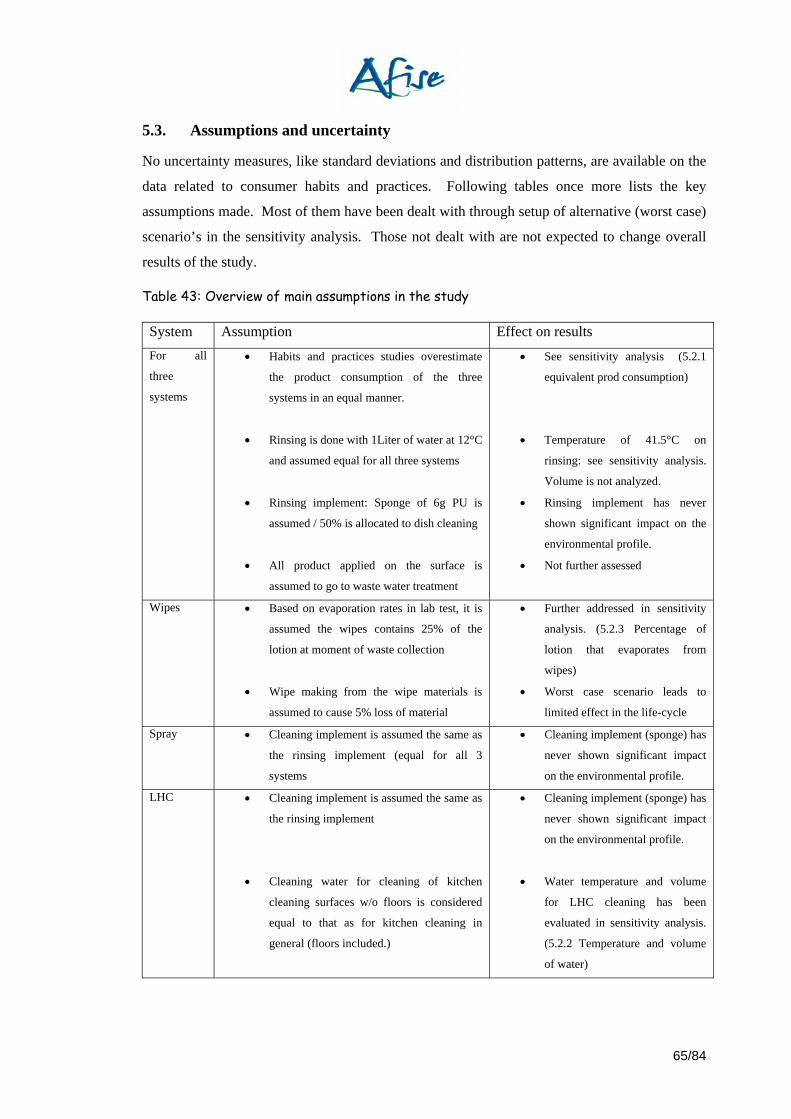
65/84
5.3. Assumptions and uncertainty
No uncertainty measures, like standard deviations and distribution patterns, are available on the
data related to consumer habits and practices. Following tables once more lists the key
assumptions made. Most of them have been dealt with through setup of alternative (worst case)
scenario’s in the sensitivity analysis. Those not dealt with are not expected to change overall
results of the study.
Table 43: Overview of main assumptions in the study
System Assumption Effect on results For all
three
systems
• Habits and practices studies overestimate
the product consumption of the three
systems in an equal manner.
• Rinsing is done with 1Liter of water at 12°C
and assumed equal for all three systems
• Rinsing implement: Sponge of 6g PU is
assumed / 50% is allocated to dish cleaning
• All product applied on the surface is
assumed to go to waste water treatment
• See sensitivity analysis (5.2.1
equivalent prod consumption)
• Temperature of 41.5°C on
rinsing: see sensitivity analysis.
Volume is not analyzed.
• Rinsing implement has never
shown significant impact on the
environmental profile.
• Not further assessed
Wipes • Based on evaporation rates in lab test, it is
assumed the wipes contains 25% of the
lotion at moment of waste collection
• Wipe making from the wipe materials is
assumed to cause 5% loss of material
• Further addressed in sensitivity
analysis. (5.2.3 Percentage of
lotion that evaporates from
wipes)
• Worst case scenario leads to
limited effect in the life-cycle
Spray • Cleaning implement is assumed the same as
the rinsing implement (equal for all 3
systems
• Cleaning implement (sponge) has
never shown significant impact
on the environmental profile.
LHC • Cleaning implement is assumed the same as
the rinsing implement
• Cleaning water for cleaning of kitchen
cleaning surfaces w/o floors is considered
equal to that as for kitchen cleaning in
general (floors included.)
• Cleaning implement (sponge) has
never shown significant impact
on the environmental profile.
• Water temperature and volume
for LHC cleaning has been
evaluated in sensitivity analysis.
(5.2.2 Temperature and volume
of water)
66/84
5.4. Limitations of the study
Because of unavailability of appropriate and standardized test methods, it was not possible to
precisely quantify the performance of each product (i.e. the surface that a product can clean)
and that consequently an approach based on habits and practice was used by default.
The drying habits (e.g. by wiping with a dry cloth or paper towel after cleaning and rinsing)
have not been included within the scope of this study. Specifically, as wipe users leave the
surface rather dry after the cleaning step, the drying step is mostly relevant to the Spray and
LHC product execution. Therefore, the environmental impact of last two products may have
been somewhat underestimated.
As indicated in the sensitivity study 5.2.2.1 and the assumptions in 5.3, the volume of the
cleaning water used for the LHC product is based on habits and practices information that is
based on the overall LHC product usage, i.e. including the usage for floor cleaning.
The present study remains a technical assessment of the environmental profile of various
kitchen cleaning products due to limitations related to LCA. Other aspects, e.g. performance
and cost, were ignored. These aspects however play an essential role in consumer preference. A
sustainability assessment, including economical and social (consumer benefits) aspects
associated with kitchen cleaning may be another tool for assessing these product alternatives.
Eco-toxicity and human toxicity parameter: the LCA methodology for these two toxicity
parameters is under fast scientific evolution and cannot be considered as fully mature. Results
should be interpreted with great caution.
Only those parameters from the life cycle inventory that are considered are most important to
the various stakeholders or have the biggest potential impact on the environment are considered.
There is no intent to deliberately not show potential LCI-values that would favour any of the
three products assessed (Annex 5).
67/84
6. Conclusions
The base scenario has demonstrated that none of the three kitchen cleaning products evaluated –floor
cleaning excluded- are significantly better or worse for all of the 10 environmental indicators assessed.
This has led us to conclude that none of the products assessed can be labeled as overall better or worse
for the environment. The base scenario is designed to represent the consumer habits of the average
consumer in France based on the best data available today. To take into account varying consumer
habits and other uncertainties in the data used, several sensitivity analyses were conducted.
The sensitivity analyses have revealed that data uncertainty with respect to product consumption,
cleaning habits, lotion evaporation from the wipe and cellulose production could significantly impact
the result of the study. However, none of the sensitivity analyses resulted in a situation where one
product would be the best with respect to all environmental indicators.
6.1. Product comparison based on the base scenario
The 3 products systems - although very different in delivery method and product formulation – show
both strengths and weaknesses with respect to the various environmental indicators. Due to data
uncertainty, a 20% margin is chosen as arbitrary cut-off rule to define what is similar or what is
different when indicator values of individual products are compared.
Those indicators with similar results are climate change potential, air acidification potential and
human toxicity potential. Yet, different life cycle stages contribute differently for the 3 products.
Next to the similarities there are some noteworthy differences in the impact assessment categories:
• Photochemical smog creation potential: Although wipes and spray behave similarly, LHC
contributes much less to this indicator. This is very much related to 2 chemical ingredients that
are considered as VOC in the spray and wipe products which are not present in the LHC
product execution. Hence, contribution to photochemical oxidant formation of LHC is only 7%
of that of the other 2 products.
• Aquatic eco-toxicity potential: Due to a lower fraction of chemicals that goes down the drain
with wipes, the potential effect is only 67% of the potential impact of Spray and LHC product.
• Eutrophication potential: For the same reason as mentioned for aquatic toxicity indicator, the
potential impact of Spray and LHC product is almost 4 and 7 times that of the wipe product.

68/84
Regarding the inventory indicator results, the following differences can be observed:
• Household waste for wipes –not surprisingly- is higher when compared to the Spray product (3
times) and even more so when compared to LHC (6 times). Important factor for the quantity of
generated household waste for wipes is the moisture content of the wipes at moment of
disposal.
• Total Residual solid waste produced after treatment by the municipalities (in a true cradle-to-
grave sense) is more comparable for the three products systems. Wipes produce 44% more total
residual solid waste when compared to Spray, 32% more when compared to the LHC product.
Notably, the different life cycle stages contribute very differently for the three compared
products. Main contributing stages for:
o Wipe: Disposal stage where the wipe material is considered as non recyclable fraction
o Spray: Disposal stage where the trigger materials are considered as non recyclable.
o LHC: Use stage where waste water treatment (sludge) and energy for water heating
play an important role
• Water consumption: LHC product is consuming significantly more water (3 times) when
compared to Spray and Wipe product. This is directly linked to the assumption on water
consumption during the use phase. Wipe product on its turn consumes 32% more water when
compared to Spray.
• Energy consumption: LHC product is consuming 18% more primary energy when compared
to Wipe product (non-significant). Compared to Spray product, primary energy consumption of
LHC is however 48% higher. This is directly linked to the heated water consumption in the
LHC cleaning step. Wipe product consumption potentially leads to 26% more primary energy
consumption when compared to Spray.
6.2. Conclusions from the sensitivity analyses
Beyond the settings of the base scenario, impact of data uncertainty and alternative product scenario’s
were assessed in the sensitivity analyses.
69/84
1. An important analysis dealt with the data uncertainty related to the equivalent product
consumption of all three product alternatives (chapter 5.2.1). The reference flows chosen based on
product consumption values through consumer habits can be considered as realistic. However, a
sensitivity scenario was developed in which the assumption was made that each product alternative
requires the same volume of liquid product (i.e. volume of wipe lotion = volume of LHC/Spray
product) . This scenario, which is seen by the authors as a true worst case for wipes, assumes the
consumption for spray and LHC to be reduced by 20%. Simultaneously, all 10 environmental
indicators would decrease by 20% as well. Hence, this scenario would result in the wipe product
alternative to score the worst on 7 and 8 indicators versus LHC and spray product respectively.
Technical studies that further clarify the product consumption equivalence would be a valuable
addition to confirm the results of this study.
2. A second series of sensitivity scenarios was reflecting the data uncertainty on variables related to
water volume and temperature in the cleaning and rinsing habits for spray and LHC.
One uncertainty was related to the water volume used in the cleaning step of LHC product users.
This scenario, that reduced the water volume used from 4 to 1 Liter in the cleaning phase (applied to
the 30% of people that use diluted product) of the LHC users, led to a 46% reduction of water
consumption for LHC, but did not change the conclusion that the LHC product remains the product
with the highest water consumption. It did however affect the energy consumption, as this is
directly linked to heating of the water. Rather then being the product alternative that used the most
energy, this scenario would predict LHC product users to use the least amount of energy. Similar
effects were seen for the global warming and air acidification potentials.
Another uncertainty was related to the water temperature of the water in the cleaning step for LHC.
The temperature (41.5°C) variable based on habits studies was replaced by cold tap water (12°C).
This temperature is underestimating the average consumer habits but the sensitivity of this variable
is shown through reduction of LHC energy consumption by 50%. Also, significant reductions
(>20%) were seen in climate change, air acidification, photochemical smog and human toxicity
potential!
Hereby, we confirmed that many of the environmental indicators for the LHC product category are
driven by the consumer rinsing and cleaning habits. More precise data with regards to water
volume and temperature would enable us to better address the uncertainty there.
3. Another variable of uncertainty was the evaporation profile of the wipe product in the dust bin.
The base scenario (50% of the wipe lotion evaporates in the dust bin) was selected based on
technical data. The sensitivity analysis, which explored two extremes (0-100% evaporation)
70/84
indicated the evaporation profile to highly impact the ranking of the products regarding otal residual
solid waste. In case all lotion would evaporate from the wipes, there would no longer be a
difference in total residual solid waste for the 3 alternatives. In case no evaporation of lotion would
occur at all, the use of wipes would lead to the highest level of total residual solid waste by a high
margin compared to the other two variants. We have reason to believe that more accurate data with
respect to the evaporation of lotion might indicate the total residual solid waste of wipe product
category to be lower than assumed in the base scenario.
4. Data uncertainty related to energy consumption of the cellullosic fiber making indicated an
increase in potential primary energy consumption for the wipe product scenario with up to 17%.
5. Although not reflecting the current market situation, another scenario was developed to evaluate
product design opportunities of a refill package for spray showing a significant decrease in several
of the indicators.
6.3. Potential improvement areas with respect to consumer habits
As the main results of this comparative study are driven by consumer habits, there are of course a
number of environmental opportunities that relate back to these habits.
• For all 3 products, rinsing and cleaning habits are driving a significant part of the environmental
profile. In this respect, careful use of water is an important factor. In more detail, it is
recommended to the product consumers to use minimum amount of water and to use non-heated
water where possible. Those two factors drive energy consumption and immediately affect a
number of environmental indicators. Please note that this is mainly valid for the LHC product
category, where highest rinsing frequency and high water volumes in the cleaning phase are used.
• With respect to the wipe product usage, using the wipes to their full extent will reduce waste and
overall environmental impact.
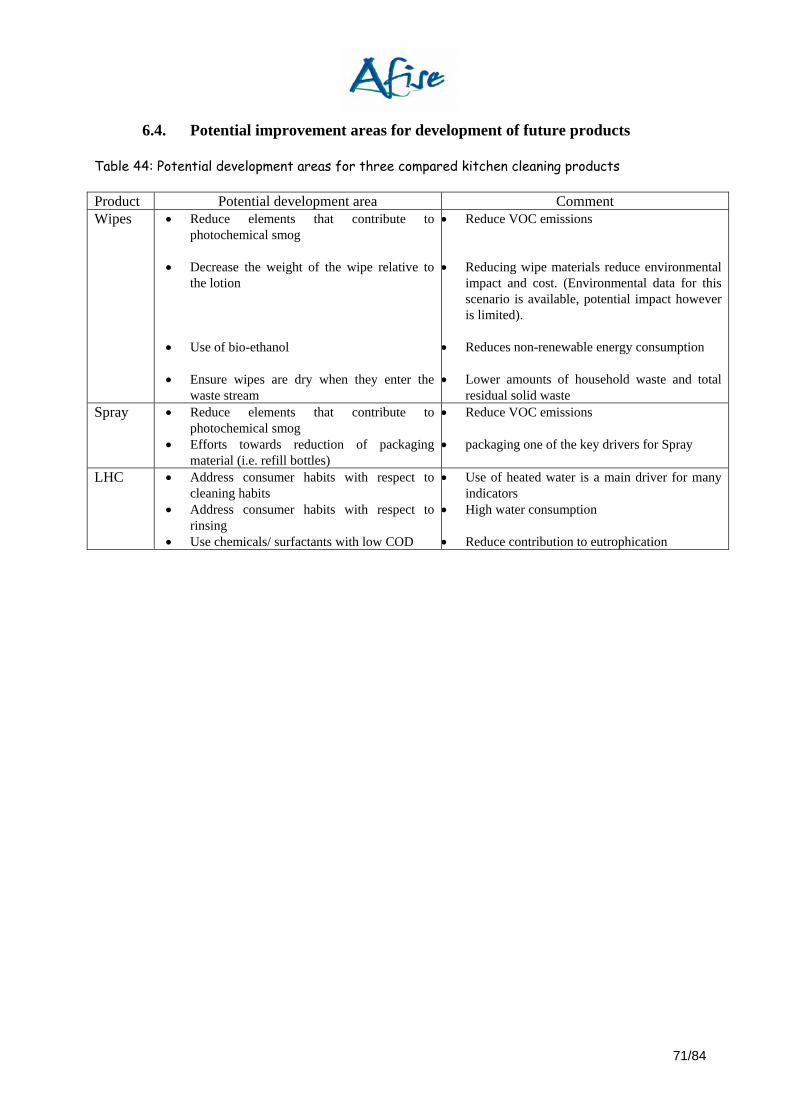
71/84
6.4. Potential improvement areas for development of future products
Table 44: Potential development areas for three compared kitchen cleaning products
Product Potential development area Comment Wipes • Reduce elements that contribute to
photochemical smog • Decrease the weight of the wipe relative to
the lotion • Use of bio-ethanol
• Ensure wipes are dry when they enter the
waste stream
• Reduce VOC emissions • Reducing wipe materials reduce environmental
impact and cost. (Environmental data for this scenario is available, potential impact however is limited).
• Reduces non-renewable energy consumption
• Lower amounts of household waste and total
residual solid waste Spray • Reduce elements that contribute to
photochemical smog • Efforts towards reduction of packaging
material (i.e. refill bottles)
• Reduce VOC emissions • packaging one of the key drivers for Spray
LHC • Address consumer habits with respect to cleaning habits
• Address consumer habits with respect to rinsing
• Use chemicals/ surfactants with low COD
• Use of heated water is a main driver for many indicators
• High water consumption
• Reduce contribution to eutrophication
72/84
7. Critical review performed by Mr. Henri Lecouls, assisted by ADEME
The English version of the critical review is currently under final writing. The French version is in annex 11, but
also reproduced hereafter
Annexe 11 Revue critique de l’Analyse du Cycle de Vie de
trois produits de nettoyage des surfaces de cuisines
Rapport de revue définitif transmis à l’AFISE le 24 janvier
2005
Cette revue critique est réalisée par M. Henri LECOULS expert ACV indépendant, assisté
de Mme Nadia BOEGLIN de l’ADEME
Deux rapports d’ACV successifs ont été soumis à la revue critique, en août et en octobre
2004, ils ont fait l’objet de deux rapports de revue critique intermédiaires en septembre
et en novembre 2004.
Le présent rapport de revue définitif est rédigé par les auteurs de la revue critique, en
tenant compte des améliorations qui ont été apportées aux premières études et des
réponses qui ont été faites, par les auteurs de l’ACV, aux questions posées dans les
rapports de revue intermédiaires.
Références :
Les références chiffrées (numéros de pages et de paragraphes) sont celles de l’étude de
décembre 2004, citée dans l’encadré ci-dessus.
Terminologie :
Dans ce rapport nous utilisons :
73/84
le mot « lingette » pour « wipe »
le mot « spray » est inchangé
les mots « liquide de nettoyage » pour « liquid household cleaner »
AVIS GENERAL :
Les différents chapitres de l’étude répondent bien aux exigences des normes de la série
14040, et notamment aux principes de transparence et de clarté.
Cependant, pour améliorer la pertinence du rapport final de l’étude, certains points
demandaient à être précisés ou améliorés et ont fait l’objet de recommandations, de
propositions ou de questions aux auteurs de l’étude, par écrit et verbalement. Les auteurs
ont, globalement, bien tenu compte des recommandations faites et apporté des réponses
satisfaisantes aux demandes de précision.
Ces points sont repris dans les chapitres suivants.
1 Changements substantiels :
1.1 Définition de l’objet de l’étude
La nouvelle version du rapport est explicite sur la nature du nettoyage objet des ACV réalisées :
titre et paragraphes introductifs et conclusifs indiquent bien que seul est concerné le nettoyage
des surfaces de travail des cuisines. Ceci est tout particulièrement important pour éviter toute
généralisation à d’autres applications, notamment en ce qui concerne les lingettes dédiées à
d’autres usages.
1.2 Polyvalence du liquide de nettoyage
Les auteurs de la revue critique ont souhaité que soit rappelé l’aspect multifonctionnel du liquide
de lavage : l’équivalence entre les 3 produits est une notion déterminante pour justifier l’étude
comparative. On pourrait considérer que le liquide de nettoyage sert à tout : cuisine, sols carrelés,
salle de bains ... et que les produits lingettes et spray viennent en complément dans des domaines
spécialisés, voire se surajoutent à l’usage du liquide en s’intercalant entre 2 utilisations
conventionnelles de ce dernier.

74/84
En réponse, les auteurs de l’étude justifient leurs choix pour le scénario de référence dans les
deux commentaires ci-dessous :
=> « On a ajouté (chapitres 2.3.1 et 5) une description pour souligner que les lingettes, le spray ou
le liquide ne sont pas des substituts dans tous les types de travaux de nettoyage. De temps en
temps - notamment quand il est utilisé pur - le liquide est utilisé pour des travaux de nettoyage
plus lourds que les lingettes. »
=> « Les informations qui indiquent quelles habitudes des consommateurs sont spécifiques aux
surfaces de cuisine seulement (à l’exclusion du nettoyage des sols) et quelles ne le sont pas
peuvent être trouvées dans l’analyse de sensibilité 5.2.2.1 et dans l’annexe III. Ces nombres sont
utilisés pour le scénario de base parce qu' ils représentent les meilleures données disponibles sur
les habitudes et les pratiques des consommateurs en France.
Pour les utilisations de liquide de nettoyage, l’estimation de la proportion des gens qui utilisent le
produit non dilué (75%) et du pourcentage des ménages qui rincent après le nettoyage (70%) est
basée sur des données spécifiques aux surfaces de cuisine seulement (à l’exclusion des sols). Par
conséquent le scénario de base suppose que 30% des personnes utilisent de l’eau pour le nettoyage
parce qu’elles utilisent le produit dilué. Et ceci peut être considéré comme relatif aux surfaces de
cuisine seulement (à l’exclusion des sols).
Par contre, la répartition de la température et du volume de l’eau utilisée pendant le nettoyage
avec du liquide de nettoyage est non spécifique des surfaces de cuisine seules. Ces valeurs
montrent que certains ménages utilisent de l’eau chaude, d’autres chauffent l’eau, et certains
l’utilisent même froide. Ces données indiquent aussi que certaines personnes utilisent un seau plein,
d’autres seulement la moitié ou moins. Par conséquent les valeurs de 41,5 °C et 4 litres d’eau sont
des valeurs moyennes. Seulement 0,53% des gens utilisent un seau plein.
Toutes les autres incertitudes relatives à la température et au volume d’eau sont traitées dans
l’analyse de sensibilité et reprises dans les conclusions au chapitre 2.3.1 . »
Commentaire des auteurs de la revue critique : les explications fournies ci-dessus permettent de
mieux appréhender les incertitudes inhérentes aux modes d’utilisation du liquide de nettoyage, qui
ont un effet très important sur les impacts de ce produit.
75/84
1.3 Rédaction de la conclusion finale et du résumé exécutif :
La conclusion finale chapitre 6 et le résumé page 2 sont les éléments les plus importants de l’étude
parce qu’ils serviront de support aux documents abrégés de communication. Leur rédaction doit
être soignée et leur contenu doit être le reflet exact des résultats de l’étude.
La revue critique a recommandé d’améliorer la rédaction de la conclusion finale qui restait trop
centrée sur les résultats du scénario de référence sans considérer les résultats de l’analyse de
sensibilité.
Les auteurs de l’étude ont tenu compte de cet avis, ils ont remanié la partie conclusion :
a) En introduisant le sous-chapitre 5.2.6 dans lequel les 10 scénarios de l’analyse de
sensibilité sont rassemblés et récapitulés sous différentes formes (écarts mini-maxi et
écarts types) et discutés.
b) En rédigeant une conclusion plus nuancée et plus complète dans laquelle :
=> les résultats du scénario de base sont exprimés en pourcentages exacts des
différences
=> le sous-chapitre 6.2 donne les conclusions de l’analyse de sensibilité
=> le sous-chapitre 6.3 dégage les possibilité d’améliorations liées aux habitudes
des consommateurs
Commentaire des auteurs de la revue critique : par rapport à l’édition initiale, la conclusion, qui a
été fortement approfondie, est maintenant satisfaisante.
Le résumé aussi (Executive summary page 2) a été amélioré en précision. Notons cependant qu’un
résumé ne peut pas exprimer toutes les nuances de l’étude, qui sont mieux rendues dans la partie
conclusion.
2 Autres améliorations apportées par la nouvelle version du
rapport :
76/84
2.1 Unité fonctionnelle : la présentation des flux de référence a été améliorée par les auteurs de
l’étude qui ont modifié le tableau 4 page 17, de façon à faire la comparaison sur une base de
volumes annuels.
Ainsi on voit mieux les ordres de grandeur de chaque variante.
2.2 Présentation et choix des indicateurs environnementaux
Sur proposition de la revue critique, les auteurs de l’étude ont :
=> amélioré la présentation des indicateurs en ajoutant le tableau 2 page 14 qui donne un
aperçu des indicateurs retenus
=> supprimé trois indicateurs - qui sont cependant calculés - mais ne sont pas repris dans
l’interprétation. Avec les commentaires suivants :
« Destruction de la couche d’ozone : nous avons évalué et décrit la pertinence de
l’indicateur de destruction de la couche d’ozone et l’avons supprimé de l’interprétation. Les
résultats figurent dans les calculs. Comme cela est expliqué dans la revue, l’indicateur ozone n’est
plus utile parce que les substances qui contribuent à cet indicateur ne sont plus utilisées dans
l’industrie (interdiction réglementaire). »
« Déchets solides : nous estimons que les paramètres de déchets solides les plus
importants dans cette étude sont les déchets solides résiduels et les déchets domestiques. Ils
sont présentés dans le rapport sur le tableau 18 page 38. En ce qui concerne les paramètres
déchets solides totaux et déchets d’emballages, nous pensons que les définitions sont correctes et
qu’ils sont importants pour certains lecteurs. Par conséquent, les définitions sont conservées et les
résultats sont présentés dans le texte, mais ils ne sont pas utilisés pour l’interprétation (parce que
moins importants) ».
2.3 Chauffage de l’eau : dans le scénario de référence les auteurs de l’étude ont
remplacé le modèle de chauffage initial, électrique à 100%, par un modèle mixte, 50% électrique /
50% au gaz naturel, plus proche de la réalité. Le scénario à 100% de chauffage électrique est
conservé dans l’analyse de sensibilité.
77/84
2.4 Recharges pour le spray : la revue critique avait proposé de prendre en compte
dans l’inventaire un pourcentage de recharges vendues sans la pompe-gachette « trigger ». Afin de
diminuer la quantité de déchets ménagers de la variante spray.
Réponse des auteurs de l’ACV : « Le spray n’est pas disponible sous forme de recharge en France,
mais nous le prenons en compte dans l’analyse de sensibilité, parce que ce produit est faisable
techniquement (chapitre 5.2.5, page 58) »
2.5 Production des substances de base, utilisation de ressources renouvelables :
La revue critique avait proposé de développer une réflexion sur les consommations d’énergie
renouvelable et non renouvelable, en examinant les possibilités d’utiliser plus de ressources
renouvelables à partir des filières « naturelles » agro-bio .
Les auteurs de l’ACV ont répondu : « Nous sommes d’accord qu’un ratio différent des 2 matériaux
des lingettes affectera le ratio des consommations d’énergie renouvelable et non renouvelable.
Cependant, l’indicateur de changement climatique rend compte de ce point en partie, à travers la
contribution aux émissions de CO2. Nous avons inclus dans le rapport (chapitre 5.2.4.2, page 57) la
proportion d’énergie renouvelable des deux matériaux des lingettes et la proportion de cette
énergie dans la consommation totale d’énergie du produit. »
« A propos de l’utilisation de ressources agro-bio, nous indiquons (chapitre 5.2.4.2, page 58) la
fraction d’énergie de l’éthanol (avec le bio-éthanol comme ingrédient alternatif) dans la
consommation d’énergie des lingettes (dont l’éthanol est le principal ingrédient), nous donnons
quelques explications sur le fait qu’aucune technologie ne peut fournir des lingettes efficaces qui
seraient produites avec des matières renouvelables seulement. »
2.6 Pourcentage de la lotion qui s’évapore des lingettes : les auteurs de l’étude ont
clarifié le scénario d’évaporation de la lotion par le commentaire ci-dessous :
« Conformément à une proposition d’Ecobilan, nous avons développé un scénario extrême pour les
COV des lingettes, c’est à dire que nous supposons que dans la phase d’utilisation la totalité des
COV s’évaporent rapidement de la lingette et sont toujours considérés comme étant émis à 100 %
dans l’air. Les scénarios d’évaporation 0 et 100 % sont relatifs à l’évaporation de l’eau de la lotion.
Donc les scénarios d’évaporation affectent principalement les paramètres de déchets solides.
L’hypothèse de cette analyse de sensibilité est soigneusement clarifiée au chapitre 3.1.6, page 28
du rapport. »
78/84
2.7 Présentation des résultats : la présentation des résultats dans le texte manquait
d’homogénéité
Réponse des auteurs de l’ACV : « Nous admettons qu’il y a une grande diversité de présentation
des résultats, mais nous avons amélioré la structure du rapport pour présenter les résultats par
groupe d’indicateurs d’une façon homogène paramètres déchets, paramètres ressources et
indicateurs d’impacts). Notre intention est de clarifier au mieux les résultats des différents
indicateurs. Un tableau récapitulatif permet au lecteur de retenir toutes les informations d’un
seul coup d’oeil à la fin. Nous pensons qu’en séparant les catégories d’indicateurs dans
l’interprétation, on souligne le fait que les indicateurs choisis ne peuvent pas être pondérés comme
s’ils étaient d’égale importance. Nous avons limité le nombre de décimales où elles ne sont pas
nécessaires (chapitre 5.1, pages 37 - 45) »
Commentaire des auteurs de la revue critique : la nouvelle présentation des résultats est plus
claire et plus homogène. Néanmoins la multiplication des graphiques (en particulier camembert 3D),
qui n’apportent selon nous que peu d’informations supplémentaires, nuisent à la bonne
compréhension des principaux résultats et à l’identification des éléments significatifs.
3 Réponses apportées aux autres questions soulevées par la revue critique et
n’ayant pas conduit à des modifications du rapport :
Les réponses ci-dessous ont été apportées par les auteurs de l’étude à certaines questions
posées par la revue critique : ces éléments de précision n’ont pas donné lieu à des modifications du
rapport mais ont été jugés satisfaisants par les auteurs de la revue critique :
3.1 Inventaire des déchets solides (cf. annexe 5, résultats des inventaires) Certains termes de l’inventaire des déchets solides, qui posaient problème, ont été clarifiés par
les auteurs de l’étude :
- Les déchets de mine « Waste (mining) », qui sont essentiellement des roches, ne sont pas
additionnés dans les déchets totaux « Total residual solid waste » parce que ces roches sont
79/84
« ramenées dans la mine à l’endroit d’où elles ont été extraites » et parce que « la quantité est si
importante que tout autre déchet le long du cycle de vie serait invisible dans le total »
- La quantité de boues de traitement de l’eau « Sludge » est supposée par hypothèse être
égale à la quantité d’ingrédients éliminés par adsorption. Le mode de calcul des boues est expliqué
au chapitre 3.1.6, page 28.
3.2 Consommation d’argile (cf. annexe 5, résultats des inventaires)
La consommation d’argile, parfois importante, que l’on note dans l’inventaire des ressources
de chaque produit, est justifiée par la création de couches intermédiaires dans les centres
d’enfouissement technique des déchets (les décharges). Ces quantités d’argile sont comptées
comme déchet non minéral (inerte).
3.3 Incinération avec récupération d’énergie (cf. sous-chapitre 3.1.7.3)
Le modèle de récupération de l’énergie prend bien en compte le fait qu’en France une
partie de la vapeur est récupérée et une partie ne l’est pas, par exemple en été.
3.4 Impact sanitaire des ingrédients
Bien qu’elles n’entrent pas formellement dans le cadre d’une ACV, deux problématiques
particulières ont été soulevées par les auteurs de la revue critique : la pollution de l’air intérieur
par les composés organiques volatils et les risques toxiques ou allergiques induits par les colorants
et parfums. Les auteurs de l’étude ont fourni en réponse un inventaire des émissions de COV et les
commentaires suivants que nous citons in extenso :
3.4.1 Inventaire des émissions de COV dans l’air intérieur
Les auteurs de l’étude ont rédigé un complément aux résultats de l’inventaire (sous-chapitre 3.2.2
tableau 13) donnant un chiffrage de la quantité maximum de COV (solvants et parfums) émis dans
l’air intérieur pendant l’utilisation des trois produits de nettoyage.
3.4.2 Commentaire des auteurs de l’étude sur la pollution de l’air intérieur
« Nous reconnaissons l’importance et l’intérêt du public pour la pollution de l’air intérieur. Evaluer
la pollution de l’air intérieur en quantifiant et en comparant les quantités de COV émis dans l’air
pendant le nettoyage de locaux est hors des possibilités de ce dossier d’ACV. Si ce critère est
80/84
pertinent, la pollution de l’air intérieur devrait être prise en compte, mais pas dans le contexte
d’une étude d’ACV (chapitre 3.1.6, page 27) »
«Les produits de nettoyage domestique sont soigneusement évalués et ne sont pas susceptibles de
provoquer des réactions asthmatiques ni des allergies de la peau. Nous ne sommes pas informés de
problèmes d’asthme causé par une utilisation convenable d’aucun de nos produits.
Les causes de l’asthme sont nombreuses et les asthmatiques doivent être particulièrement
prudents dans tout ce qu’ils font. L’asthme est une maladie chronique inflammatoire des voies
aériennes. C’est une maladie complexe dont les symptômes seuls ne permettent pas de connaître
sûrement la cause. Une variété de facteurs peut déclencher une réaction asthmatique chez celui
qui en souffre, par exemple une infection virale, des polluants de l’air, la fumée de cigarette, l’air
froid, l’exercice, les aéroallergènes courants (tels que le pollen), certains médicaments, des
conservateurs, et le stress émotionnel.
De plus, les COV sont une classe très diversifiée de substances chimiques, avec des propriétés
diverses. Un des solvants COV le plus utilisé dans les catégories de produits pour les
consommateurs est l’éthanol. Comme l’éthanol est soluble dans l’eau et facilement biodégradable,
sa durée de vie dans l’environnement est très brève contrairement à de nombreux autres COV.
Nous sommes bien entendu informés d’un article récent dans lequel certains COV mesurés dans
l’air intérieur sont associés à des symptômes respiratoires. Ces COV sont les benzène, toluène, m
- xylène, o,p - xylène, èthylbenzène, styrène et plusieurs chlorobenzènes. Ces ingrédients sont
typiquement non présents dans les produits de nettoyage domestique. »
3.4.3 Commentaire des auteurs de l’étude sur les colorants et parfums
« Les informations disponibles pour caractériser le profil de toxicité humaine des parfums et des
colorants sont très limitées. Nous n’avons pas d’informations pour caractériser ces ingrédients
dans les valeurs de toxicité humaine selon CML92. Donc il reste à examiner ce qui se passe dans le
traitement des eaux résiduaires. Concernant l’écotoxicité aquatique, nous avons inclus une étape
de traitement des eaux résiduaires, après laquelle nous avons caractérisé les parfums et les
colorants sur la base de facteurs de caractérisation génériques selon CML 92. Au delà de ces deux
indicateurs, les propriétés de santé humaine de ces substances chimiques sont hors du champ de
l’ACV »
« Les parfums sont des mixtures complexes de centaines de matières premières individuelles. Les
composants des parfums des produits d’entretien domestiques sont typiquement des matières
81/84
premières de parfums utilisées couramment que l’on retrouve dans de nombreux autres produits
de nettoyage domestique odorants, à des niveaux et des concentrations similaires.
Les parfums utilisés dans les produits de nettoyage domestiques se conforment typiquement aux
lignes directrices de l’IFRA (Association Internationale de Recherche sur les Parfums). L’IFRA
fixe des lignes directrices pour les applications avec contact (le produit reste sur la peau) et sans
contact (le produit est rincé), afin d’assurer une utilisation sans danger de nombreux types et
formes de produits de consommation. L’industrie des biens de consommation suit, ou dépasse,
les lignes directrices de l’IFRA relatives aux niveaux et/ou à la présence de matières premières
dans les parfums.
Les parfums dans les produits de nettoyages domestiques sont totalement évalués au point de vue
de la sécurité des consommateurs lorsque les voies d’exposition attendues sont la peau et
l’inhalation. Sur la base de ces évaluations, aucun problème de sécurité des consommateurs n’est
soulevé par l’exposition prévue aux parfums associée avec l’utilisation de produits de nettoyages
domestiques. »
4. Un point resté en suspens : comment permettre au lecteur la
bonne compréhension des ordres de grandeur présentés
Le tableau de synthèse des résultats met bien en lumière la contribution relative de chaque
produit aux indicateurs choisis. Cependant, il ne donne pas de points de référence permettant au
lecteur de juger de l’importance relative des différents impacts présentés : il aurait ainsi pu être
intéressant de mettre les impacts liés au nettoyage de la cuisine face au total de ceux générés
directement par un ménage ou encore de rapporter les impacts à une échelle de référence telle
l’équivalent habitant (normation)
Réponse des auteurs de l’ACV : « Nous avons décidé de ne pas conduire une étape de normation
parce que les données de référence pour certaines catégories d’impact calculées selon CML ne
sont pas disponibles pour la France. Et aussi, comme les valeurs de référence ne sont pas
disponibles pour indiquer l’importance relative des indicateurs de déchets et de ressources,
l’intérêt de cette étape est limitée dans ce cas. »
82/84
Commentaire des auteurs de la revue critique : tout en comprenant les difficultés d’accès à des
données de référence, la revue critique considère que cette réponse n’est pas satisfaisante : le
problème de la bonne compréhension des ordres de grandeur reste entier. Si les pistes proposées
par les auteurs de la revue critique n’ont pas été jugées exploitables ou intéressantes par les
auteurs de l’étude, charge à ces derniers de trouver d’autres solutions pour répondre au problème
posé.
5 Conclusion de la revue critique :
Des réponses acceptables ont été faites par les auteurs de l’étude, aux questions qui étaient
posées dans les rapports de revue intermédiaires.
Des améliorations notables ont été apportées au texte : en particulier, le titre de l’étude, son
champ et les conclusions sont plus clairs et plus précis.
Outre le résumé « executive summary », nécessairement succinct, nous recommandons aux
lecteurs de l’étude de prendre connaissance des conclusions ( au chapitre 6 du rapport ) ; nous
recommandons aussi aux commanditaires de l’étude de communiquer sur la base des conclusions du
rapport, car ces conclusions sont plus nuancées que le résumé et rendent mieux compte du très
riche contenu de l’étude présentée.
________________________________________
83/84
References [1] SETAC. 1993. Guidelines for Life Cycle Assessment: A code of Practice. Society of Environmental Toxicology and
Chemistry, Pensacola, FL., Sesimbra, Portugal.
[2] ISO 14040: 1997 (E). Environmental Management - Life Cycle Assessment - Principles and Framework. 1997(E)
[3] ISO 14041: 1998. Environmental Management - Life Cycle Assessment - Goal and Scope Definition and Inventory
Analysis.
[4] ISO 14042 : 2000 (E). Environmental Management - Life Cycle Assessment - Life Cycle Impact Assessment.
[5] ISO 14043 : 2000 (E). Environmental Management - Life Cycle Assessment - Life Cycle Interpretation.
[6] SPOLD (1997), The SPOLD file format, http//www.spold.org/publ/index.html, Society for promotion of life cycle
development, Brussels
[7] FAL, 1998, Franklin Associates USA LCI Database Documentation, Franklin Associates, Prairie Village, Kansas, USA
[8] ETH, 1996, Ökoinventare für Energiesysteme, ETH Zurich
[9] EPA, AP-42, Vol. I, CH1.5: Liquefied Petroleum Gas Combustion,
http://www.epa.gov/ttn/chief/ap42/ch01/final/c01s05.pdf
[10] BUWAL 250, 1996, Ökoinventare für Verpackungen, Schriftenreihe Umwelt 250, Bern
[11] H. Firgo, M. Eibl, D.Eichinger, lenzing AG,1996, : Lyocell: Ein okologische alternative, Lenzinger Berichte 75/96, p.
47-50
[12] Boustead, I.,2001, Ecoprofiles of the European plastics industry (APME), Pages 30 to 35
[13] Boustead, I.,2003, Ecoprofiles of the European plastics industry (APME), Pages 26 to 39
[14] Boustead, I.,1999, Ecoprofiles of the European plastics industry (APME)
[15] Boustead, I.,1997, Ecoprofiles of the European plastics industry (APME)
[16] http://www.apme.org
[17] Carl Hanser Verlag; 1995, Journal for Theory, Technology and Application of Surfactants
[18] Chauvel A., Lefebvre G., Castex; 1985;.L., Procédés de pétrochimie, page 9, volume 2, Paris, Ecole Nationale
Supérieure du Pétrole et des Moteurs, Technip,
[19] FAL, 2000, Franklin Associates USA LCI Database Documentation, Franklin Associates, confidential report for
Procter&Gamble from “life cycle inventory of two floor cleaning methods”
[20] Franke, M. et al., 1995, Tenside Surf. Det. 32, 6, pp. 508.; 1995
[21] Boustead I., 2002, Eco-profiles of the European plastics industry (APME),Polyvinyl Chloride
[22] FAL, 1992, Franklin Associates USA LCI Database Documentation, Franklin Associates, confidential report for
Procter&Gamble from “Resource and Environmental Analysis Profile of HSC and Mix-your-own cleaning system” Table:
B42
[23] BUWAL, 1994, Bern , Comparative environmental evaluation of construction paints and varnishes, Volume 2, Pages
70 to 71
[24] PWMI, April 1994, Eco-profiles of the European polymer industry, Report 6 (Polyvinyl Chloride), p.13
[25] ELF ATOCHEM, 1997, Mr. Lecouls: letter of 25 July expertise

84/84
[26] Althaus H.-J. Chudacoff M., Hischier R., Jungbluth N., Osses M., Primas A., 2003, Life Cycle Inventories of
Chemicals, Final report ecoinvent 2000, Swiss Centre for LCI, EMPA-DU
[27] BUWAL 132, February 1991, “Ökobilanz von Packstoffen, Schriftenreihe Umwelt Nr 132: Stand 1990”, pp A22, Bern
[28] Ecobilan; ORIGIN Project: new project Version: 0S403 Steam: Production Ecoview: new ecobalance Date: 16/8/99
[29] Wisard model, ORIGIN, Project: System Description, Version: Date: 31/3/4, Ecobilan
[30] FEFCO, December 2000 (fourth edition), European database for Corrugated Cardboard Life Cycle Studies, page 25-28
[31] Fawer, M., and Boustead, I., 1998, Ecoprofile of Hydrogen Peroxide, pp 8-11, CEFIC, Brussels
[32] Schul W., Hirschinger, F., and Schick, K.P., 1995, A life cycle inventory for the production of detergent range alcohol
ethoxylates in Europe, Tenside Surfactant and Detergent, 32 171-192
[33] OECD, Environmental data 1999
[34] Heijungs, R., G. J. B., G. Huppes, R. M. Lankreijer, H. A. Udo de Haes, A. Wegener Sleeswijk, A. M. M. Ansems, P.
G. Eggels, R. van Duin and H. P. de Goede, 1992, Environmental life cycle assessment of products, Guide LCA, CML
Leiden, the Netherlands
[35] Heijungs, R., and Kleijn, R., 2001, Numerical approaches towards life cycle interpretation, Int J LCA 6 (3), pp 141-148
[36] Nielsen, 2004, “valeur Super/Hypermarchés, hors hard discount – hors produits pour l’entretien des meubles, bois,
dépoussiérage, lingettes sols 07.02/06.03”
[37] Nielsen, 2004, Nielsen value share for July 03 to June 04
[38] Jeroen B. Guinee, Marieke Gorree, Reinout Heijungs, Gjalt Huppes, rene Kleijn, Arjan de koning, Lauran van Oers,
Anneke Wegener Sleeswijk, Sangwon Suh, Helias A. Udo de Haes, 2002, Handbook on Life Cycle Assessment;
operational Guide to the ISO Standards
[39] European Federation of Corrugated Board Manufacturers (FEFCO), 2003, “European database for corrugated board life
cycle studies”
[40] Electric water heating in EU countries, European Commission:
http://europa.eu.int/comm/energy_transport/atlas/htmlu/hotdintrotab.html
[41] Mance, G. 1993, Effluent and river quality: How UK compares with other EC countries. J. IWEM. 7: 592-598.
[42] De Oude, N.T. 1992, Anthropogenic compounds: Detergents. Springer-Verlag, Berlin, Heidelberg, New York.
[43] Feijtel, T.C.J., J.E. Struijs and E.Matthijs. 1999. Exposure modeling of detergent surfactant – prediction of 90th
percentile concentrations in the Netherlands. Environ. Toxicol. Chem. 18: 2645-2652.
[44] Struijs, J. 1996 SimpleTreat 3.0: a model to predict the distribution and elimination of chemicals by sewage treatment
plants. National Institute of Public Health and the environment (RIVM). Report 719101025. Bilthoven.
[45] Ecolabel. 1995. Commission decision of 25 July 1995 establishing the ecological criteria for the award of the
community eco-label to laundry detergents. Official Journal of the European Communities 95/365/EC.L217:0014-0030.
[46] Erwan Saouter, Gert Vanhoof, 2001, A Database for the Life-Cycle Assessment of Procter&Gamble laundry detergents,
Int. J. LCA (6) 2001