Embed Size (px)
Citation preview
sustainability
Article
Comparative Life Cycle Assessment (LCA) of TwoOn-Site Small-Scale Activated Sludge Total OxidationSystems in Plastic and Vibrated Reinforced Concrete
Giovanni De Feo *, Carmen Ferrara and Giovanni Iuliano
Department of Industrial Engineering, University of Salerno, via Giovanni Paolo II, 132-84084 Fisciano, Italy;[email protected] (C.F.); [email protected] (G.I.)* Correspondence: [email protected]; Tel.: +39-089-964113; Fax: +39-089-968738
Academic Editor: Marc A. RosenReceived: 11 December 2015; Accepted: 24 February 2016; Published: 26 February 2016
Abstract: This study proposes a comparison of the environmental impacts calculated with the LifeCycle Assessment (LCA) methodology of two on-site small-scale activated sludge total oxidationsystems in linear low-density polyethylene (LLDPE) and vibrated reinforced concrete (VRC). Theplants were designed to ensure a treatment capacity of 5, 10, 20 and 30 equivalent inhabitants (PE).The main aim of the study was to evaluate the incidence of construction, disposal and operationphases on the total impacts evaluated with three different methods: ReCiPe 2008, Ecological Footprintand IPCC 2007 100 years. The most significant phase for both treatment lines was the use phase,which contributed more than 80% to the total impacts. The construction phase was the second mostimpactful phase with an incidence less than 25% for both systems and for all the considered impactsassessment methods. The plant in LLDPE was more eco-friendly than that in (VRC). The plant inVRC was always most impactful, even comparing each single phase of the life cycle and for all thetreatment capacities taken into consideration. Finally, the obtained results were not dependent on theimpact assessment method considered.
Keywords: activated sludge; comparison; Ecological Footprint; IPCC; LCA; plastic; ReCiPe; totaloxidation; small-scale; vibrated reinforced concrete
1. Introduction
Sustainable wastewater management requires effective and efficient treatment systems. Optimaltreatment technologies are able to ensure high quality effluent as well as low environmental impacts.
In the light of the sustainability paradigm, the application of Life Cycle Assessment (LCA) isparticularly useful because it allows comparing the environmental performance of different treatmentsystems throughout their entire life cycle [1].
In the current literature, there are several scientific contributions on the application of LCA to thewastewater sector. They are focused on many different features.
One aspect concerns the environmental performance assessment of decentralized wastewatertreatment systems. In most countries, there are many sparsely populated areas, where it is notconvenient to realize a unique centralized wastewater treatment plant due to the difficulties in termsof sewerage connections [2].
Furthermore, in many cases, the construction of sewer infrastructures could generate significantenvironmental impacts, which could considerably contribute to total environmental loads of centralizedwastewater treatment plants [3,4]. For this reason, it is important to compare WWTPs decentralizedalternatives with LCA studies.
Sustainability 2016, 8, 212; doi:10.3390/su8030212 www.mdpi.com/journal/sustainability
Sustainability 2016, 8, 212 2 of 17
There are few studies dealing with the application of LCA to small treatment systems (<200 PE).The majority of studies are based on a comparative LCA between extensive treatment system (such asconstructed wetlands) and decentralized conventional intensive systems [5–10].
These studies suggest that natural treatments cause minor environmental impacts for all impactcategories, considering the whole life cycle when compared to conventional activated sludge systems.The main limitation for the application of extensive treatment systems is the need of large areas toassure an efficient treatment. Therefore, this technology can be a valuable treatment option in areaswhere there is an adequate areal availability for implementation [5–10].
In other studies, LCA was utilized to compare the environmental performances of conventionaland source separating systems where there is an upstream separation of wastewater flows after, afterwhich they are conveyed to different treatment alternatives [11–17].
On the one hand, some studies conclude that the separative systems have environmentaladvantages when compared with conventional systems by improving opportunities for nutrientrecycling and avoiding their direct release into the aquatic environment [12,13,15,17]. On the otherhand, Thibodeau et al. point out that the best environmental choice is the conventional treatmentsystem and that separative system technical improvements are needed in order to achieve betterenvironmental performance [16]. Finally, other studies show that the better environmental choicecould vary depending on the system scale and local site-specific conditions [2,11].
To the best of our knowledge, in LCA application to small treatment systems, there are no studiescomparing different decentralized intensive treatment systems with a capacity of less than hundred PE.
One of the key factors of the application of LCA to the wastewater sector concerns the choiceto include or not all the stages of the life cycle of treatment systems (construction, use and disposal)within the system boundaries.
Some authors do not consider the construction and disposal phases. They assume that thecontributions of these phases in terms of impacts are negligible if compared with the operational phase,especially in the light of a relatively long lifetime. However, this assumption is not always valid sinceit is possible to show that, for some treatment technologies, the contributions to the impacts of theconstruction phase are very significant, sometimes even higher than those of the operational phase.Some examples are constructed wetland systems, sand filtration processes, conventional treatmentswith the addition of microfiltration and ozonation processes [18,19].
The incidence of the construction phase on the total of impacts also depends on the scale of thetreatment plants, usually expressed in terms of the maximum number of population equivalent (PE)that the system is able to treat. In this regard, the study of Lundin and Morrison [13] shows that theenvironmental burdens of the construction phase of wastewater treatment systems are much lowerfor large-scale systems than small-scale systems. These scale economies are also applicable to theoperational phase [13].
Analogously, Doka [20] points out that the smaller the wastewater treatment plant (WWTP) is, themore the environmental impacts per inhabitant in terms of construction, operation and managementactivities increase. In addition, sewerage system utilization becomes less efficient [20].
Lorenzo-Toja et al. [21] obtained similar conclusions. The authors report that the size is the factorthat influences the efficiency of WWTPs the most. In fact, in terms of per capita contribution, smallerWWTPs generate higher impacts [21].
Finally, it results that it is not always correct to neglect the phases of construction and disposalwhen compared to the phase of use, because this strongly depends on the specific case.
The main aim of this study is to perform a comparative LCA of two on-site small-scale activatedsludge total oxidation systems in plastic and vibrated reinforced concrete in order to evaluatethe incidence of construction, disposal and operation on the total impacts evaluated with threedifferent methods.
Sustainability 2016, 8, 212 3 of 17
2. Material and Methods
2.1. Goal and Scope Definition
The main goal of the LCA study was to compare the environmental performance of the life cycleof two on-site small-scale activated sludge total oxidation systems in linear low-density polyethylene(LLDPE) and vibrated reinforced concrete (VRC). Both systems were sized to treat the wastewaterof 5, 10, 20, and 30 equivalent inhabitants (PE, population equivalent). They were able to produceeffluents complying with the emission limits for urban wastewater discharging into surface waterbodies provided by the Italian law [22] in accordance with the EU Water Framework Directive [23].
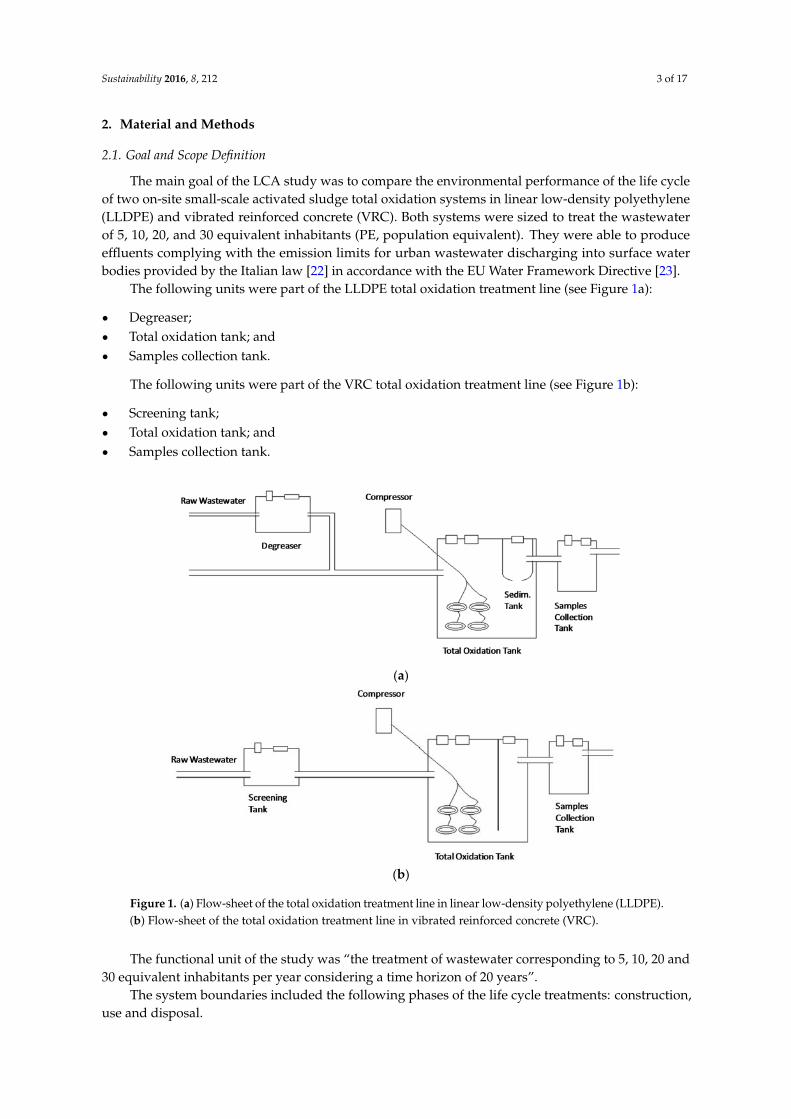
The following units were part of the LLDPE total oxidation treatment line (see Figure 1a):
‚ Degreaser;‚ Total oxidation tank; and‚ Samples collection tank.
The following units were part of the VRC total oxidation treatment line (see Figure 1b):
‚ Screening tank;‚ Total oxidation tank; and‚ Samples collection tank.
Sustainability 2016, 8, 212 3 of 18
2. Material and Methods
2.1. Goal and Scope Definition
The main goal of the LCA study was to compare the environmental performance of the life cycle
of two on‐site small‐scale activated sludge total oxidation systems in linear low‐density polyethylene
(LLDPE) and vibrated reinforced concrete (VRC). Both systems were sized to treat the wastewater of 5,
10, 20, and 30 equivalent inhabitants (PE, population equivalent). They were able to produce effluents
complying with the emission limits for urban wastewater discharging into surface water bodies
provided by the Italian law [22] in accordance with the EU Water Framework Directive [23].
The following units were part of the LLDPE total oxidation treatment line (see Figure 1a):
Degreaser;
Total oxidation tank; and
Samples collection tank.
The following units were part of the VRC total oxidation treatment line (see Figure 1b):
Screening tank;
Total oxidation tank; and
Samples collection tank.
(a)
(b)
Figure 1. (a) Flow‐sheet of the total oxidation treatment line in linear low‐density polyethylene
(LLDPE). (b) Flow‐sheet of the total oxidation treatment line in vibrated reinforced concrete (VRC).
The functional unit of the study was “the treatment of wastewater corresponding to 5, 10, 20
and 30 equivalent inhabitants per year considering a time horizon of 20 years”.
The system boundaries included the following phases of the life cycle treatments: construction,
use and disposal.
The construction phase considered the environmental loads related to the use of raw materials
for the realization of all the components of the systems, the production processes of such
Figure 1. (a) Flow-sheet of the total oxidation treatment line in linear low-density polyethylene (LLDPE).(b) Flow-sheet of the total oxidation treatment line in vibrated reinforced concrete (VRC).
The functional unit of the study was “the treatment of wastewater corresponding to 5, 10, 20 and30 equivalent inhabitants per year considering a time horizon of 20 years”.
The system boundaries included the following phases of the life cycle treatments: construction,use and disposal.
Sustainability 2016, 8, 212 4 of 17
The construction phase considered the environmental loads related to the use of raw materialsfor the realization of all the components of the systems, the production processes of such componentsand all the accessory materials required for operating the plant. Moreover, the environmental loads ofexcavation and backfilling were also considered.
The operational phase considered the environmental burdens related to energy consumption forthe systems operation, disposal of sludge produced in the total oxidation tanks and, finally, requiredmanagement and maintenance activities.
The disposal stage considered the environmental loads of disposal processes relating to eachcomponent of the treatment lines. A landfill scenario for the disposal of the materials of each treatmentunit was assumed, while the produced sludge was sent to a large wastewater treatment plant.
During all stages of the life cycle of the systems, the environmental loads related to all the neededtransports were considered.
2.2. Life Cycle Inventory (LCI)
The software tool SimaPro 7.0 (PRè Consultans, Amersfoort, The Netherlands) made it possibleto realize the treatment systems models.
Technical catalogues of companies producing treatment systems for municipal wastewater werethe source for foreground inventory data, both for the construction phase of all the system componentsas well as the excavation and backfilling techniques.
Two companies (Caccia Engineering S.P.A., Samarate Italy; Polivinil Rotomachinery S.P.A., Cerano,Italy) dealing with the construction of rotational molding machines provided the process data aboutthe rotomolding process for the LLDPE components production. The data on the thickness of the tanksand the geometrical dimensions of the several complementary components of the treatment units arethe result of calculations made on the basis of the manufacturers technical drawings.
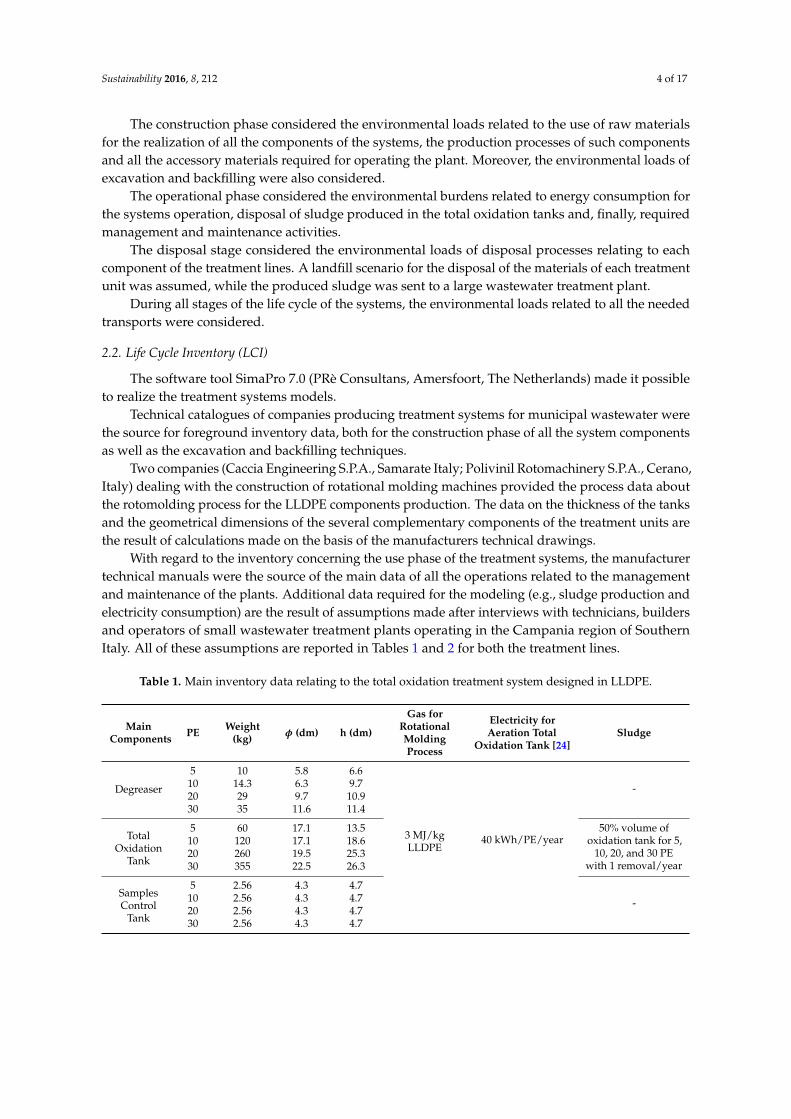
With regard to the inventory concerning the use phase of the treatment systems, the manufacturertechnical manuals were the source of the main data of all the operations related to the managementand maintenance of the plants. Additional data required for the modeling (e.g., sludge production andelectricity consumption) are the result of assumptions made after interviews with technicians, buildersand operators of small wastewater treatment plants operating in the Campania region of SouthernItaly. All of these assumptions are reported in Tables 1 and 2 for both the treatment lines.
Table 1. Main inventory data relating to the total oxidation treatment system designed in LLDPE.
MainComponents PE Weight
(kg) φ (dm) h (dm)
Gas forRotationalMoldingProcess
Electricity forAeration Total
Oxidation Tank [24]Sludge
Degreaser
5 10 5.8 6.6
3 MJ/kgLLDPE
40 kWh/PE/year
-10 14.3 6.3 9.720 29 9.7 10.930 35 11.6 11.4
TotalOxidation
Tank
5 60 17.1 13.5 50% volume ofoxidation tank for 5,
10, 20, and 30 PEwith 1 removal/year
10 120 17.1 18.620 260 19.5 25.330 355 22.5 26.3
SamplesControl
Tank
5 2.56 4.3 4.7
-10 2.56 4.3 4.720 2.56 4.3 4.730 2.56 4.3 4.7
Sustainability 2016, 8, 212 5 of 17
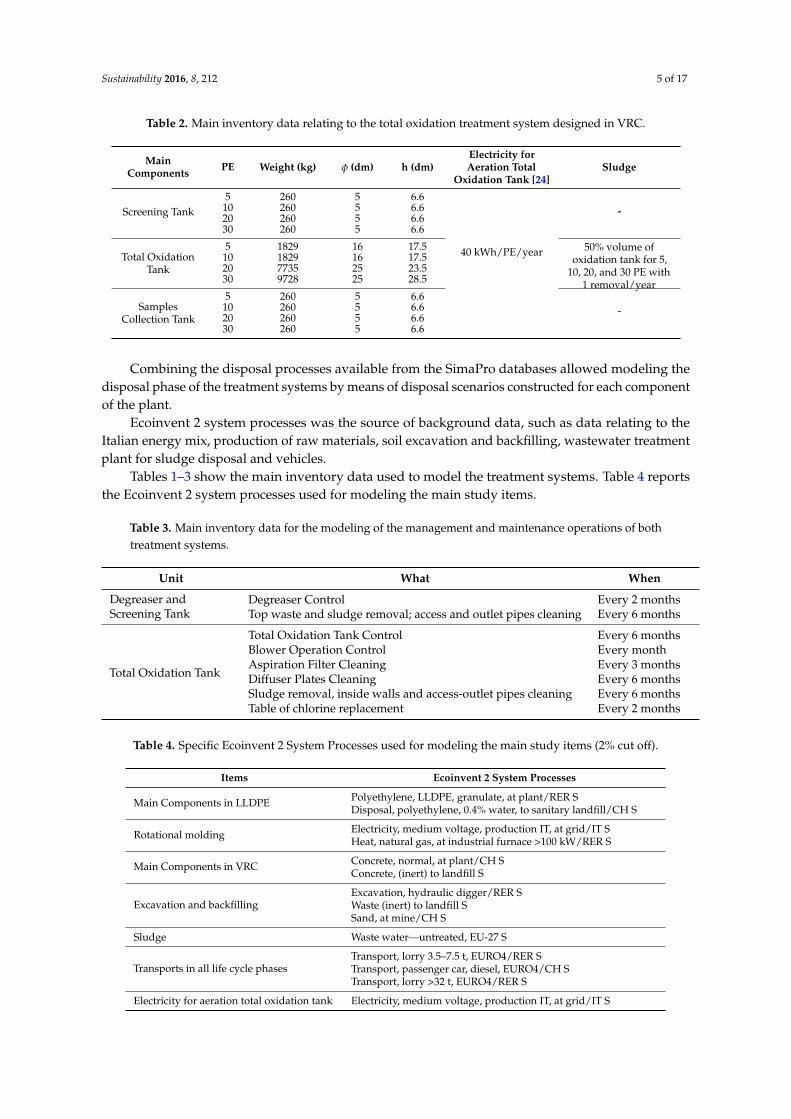
Table 2. Main inventory data relating to the total oxidation treatment system designed in VRC.
MainComponents PE Weight (kg) φ (dm) h (dm)
Electricity forAeration Total
Oxidation Tank [24]Sludge
Screening Tank5 260 5 6.6
40 kWh/PE/year
-10 260 5 6.620 260 5 6.630 260 5 6.6
Total OxidationTank
5 1829 16 17.5 50% volume ofoxidation tank for 5,
10, 20, and 30 PE with1 removal/year
10 1829 16 17.520 7735 25 23.530 9728 25 28.5
SamplesCollection Tank
5 260 5 6.6-10 260 5 6.6
20 260 5 6.630 260 5 6.6
Combining the disposal processes available from the SimaPro databases allowed modeling thedisposal phase of the treatment systems by means of disposal scenarios constructed for each componentof the plant.
Ecoinvent 2 system processes was the source of background data, such as data relating to theItalian energy mix, production of raw materials, soil excavation and backfilling, wastewater treatmentplant for sludge disposal and vehicles.
Tables 1–3 show the main inventory data used to model the treatment systems. Table 4 reportsthe Ecoinvent 2 system processes used for modeling the main study items.
Table 3. Main inventory data for the modeling of the management and maintenance operations of bothtreatment systems.
Unit What When
Degreaser andScreening Tank
Degreaser Control Every 2 monthsTop waste and sludge removal; access and outlet pipes cleaning Every 6 months
Total Oxidation Tank
Total Oxidation Tank Control Every 6 monthsBlower Operation Control Every monthAspiration Filter Cleaning Every 3 monthsDiffuser Plates Cleaning Every 6 monthsSludge removal, inside walls and access-outlet pipes cleaning Every 6 monthsTable of chlorine replacement Every 2 months
Table 4. Specific Ecoinvent 2 System Processes used for modeling the main study items (2% cut off).
Items Ecoinvent 2 System Processes
Main Components in LLDPE Polyethylene, LLDPE, granulate, at plant/RER SDisposal, polyethylene, 0.4% water, to sanitary landfill/CH S
Rotational molding Electricity, medium voltage, production IT, at grid/IT SHeat, natural gas, at industrial furnace >100 kW/RER S
Main Components in VRC Concrete, normal, at plant/CH SConcrete, (inert) to landfill S
Excavation and backfillingExcavation, hydraulic digger/RER SWaste (inert) to landfill SSand, at mine/CH S
Sludge Waste water—untreated, EU-27 S
Transports in all life cycle phasesTransport, lorry 3.5–7.5 t, EURO4/RER STransport, passenger car, diesel, EURO4/CH STransport, lorry >32 t, EURO4/RER S
Electricity for aeration total oxidation tank Electricity, medium voltage, production IT, at grid/IT S
Sustainability 2016, 8, 212 6 of 17
The Campus of the University of Salerno, in the Campania region of Southern Italy, was thehypothetical location of the treatment systems. The following are the distances considered for thetransport phase: 500 km for the production site of the system materials and components (the distancetakes into account where the manufacturer headquarters is effectively located related to the technicalcatalogue taken into consideration), 20 km for the sludge disposal, 10 km for the service center, and50 km for the disposal site.
2.3. Life Cycle Impact Assessment
The environmental impacts of two treatment systems were evaluated with three different methods:ReCiPe 2008 (H/H), Ecological Footprint and IPCC 2007 GWP 100 years.
ReCiPe and Ecological Footprint are multi-parametric methods; thus, they provide an integratedvision that takes into account many environmental aspects in the calculation of the impacts. ReCiPecombines a midpoint level approach (problem-oriented) with an endpoint approach (damage-oriented)considering 18 midpoint impact categories grouped into three endpoint categories: damage to humanhealth, damage to ecosystems and resource consumption [25]. The Ecological footprint methodcalculates the amount of biologically productive land and water required by a population to producethe resources it consumes and to dispose of the waste generated by the consumption of fossil andnuclear fuel [24]. The IPCC 2007 GWP 100 years indicator is based on the factors of climate changeover a period of 100 years considering the gaseous emissions of a potential greenhouse effect [26].
The results obtained with the use of three impact assessment methods allowed comparingthe environmental performance of the two considered systems as a function of different treatmentcapacities in terms of the number of PE as well as for both the total life cycle and each single phase.
3. Results
3.1. Result of Study
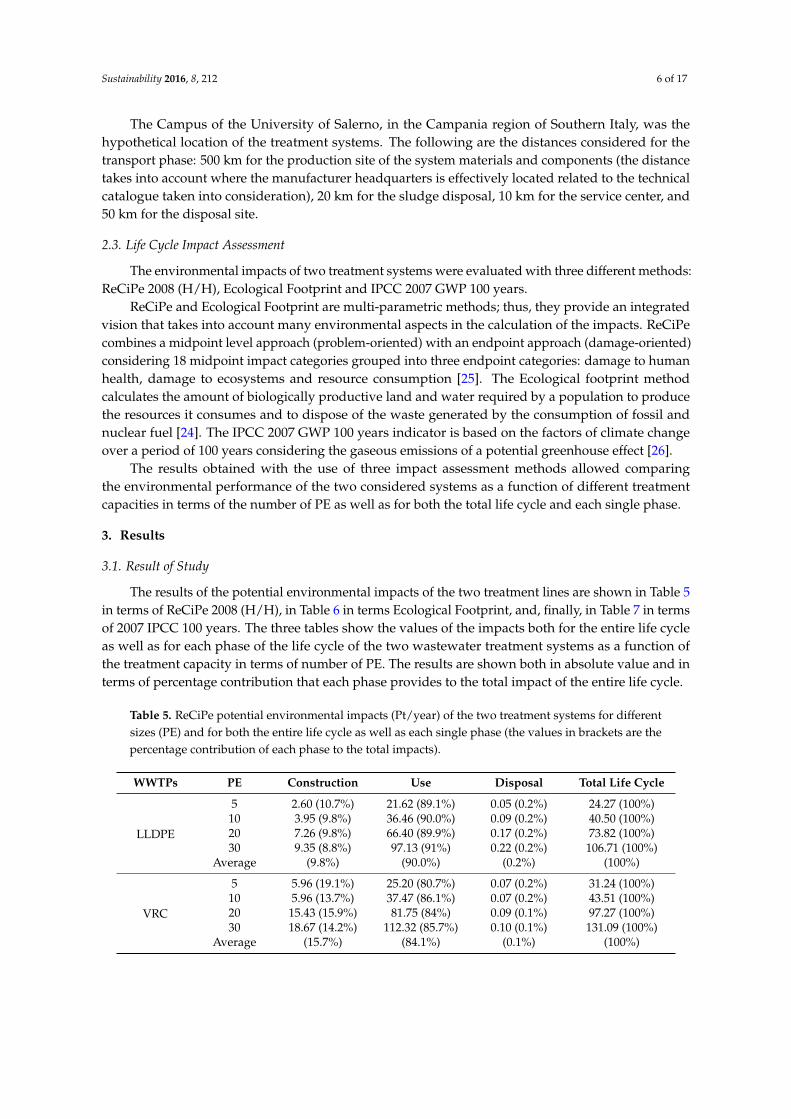
The results of the potential environmental impacts of the two treatment lines are shown in Table 5in terms of ReCiPe 2008 (H/H), in Table 6 in terms Ecological Footprint, and, finally, in Table 7 in termsof 2007 IPCC 100 years. The three tables show the values of the impacts both for the entire life cycleas well as for each phase of the life cycle of the two wastewater treatment systems as a function ofthe treatment capacity in terms of number of PE. The results are shown both in absolute value and interms of percentage contribution that each phase provides to the total impact of the entire life cycle.
Table 5. ReCiPe potential environmental impacts (Pt/year) of the two treatment systems for differentsizes (PE) and for both the entire life cycle as well as each single phase (the values in brackets are thepercentage contribution of each phase to the total impacts).
WWTPs PE Construction Use Disposal Total Life Cycle
LLDPE
5 2.60 (10.7%) 21.62 (89.1%) 0.05 (0.2%) 24.27 (100%)10 3.95 (9.8%) 36.46 (90.0%) 0.09 (0.2%) 40.50 (100%)20 7.26 (9.8%) 66.40 (89.9%) 0.17 (0.2%) 73.82 (100%)30 9.35 (8.8%) 97.13 (91%) 0.22 (0.2%) 106.71 (100%)
Average (9.8%) (90.0%) (0.2%) (100%)
VRC
5 5.96 (19.1%) 25.20 (80.7%) 0.07 (0.2%) 31.24 (100%)10 5.96 (13.7%) 37.47 (86.1%) 0.07 (0.2%) 43.51 (100%)20 15.43 (15.9%) 81.75 (84%) 0.09 (0.1%) 97.27 (100%)30 18.67 (14.2%) 112.32 (85.7%) 0.10 (0.1%) 131.09 (100%)
Average (15.7%) (84.1%) (0.1%) (100%)
Sustainability 2016, 8, 212 7 of 17
Table 6. Ecological Footprint potential environmental impacts (Pt/year) of the two treatment systemsfor different sizes (PE) and for both the entire life cycle as well as each single phase (the values inbrackets are the percentage contribution of each phase to the total impacts).
WWTPs PE Construction Use Disposal Total Life Cycle
LLDPE
5 50.03 (7.0%) 668.80 (93.0%) 0.58 (0.1%) 719.46 (100%)10 72.87 (6.2%) 1110.04 (93.8%) 0.93 (0.1%) 1183.91 (100%)20 128.66 (6.0%) 2002.90 (93.9%) 1.75 (0.1%) 2133.45 (100%)30 163.50 (5.3%) 2929.03 (94.6%) 2.27 (0.1%) 3095.00 (100%)
Average (6.1%) (93.8%) (0.1%) (100%)
VRC
5 160.77 (16.4%) 814.95 (83.4%) 1.82 (0.2%) 977.54 (100%)10 160.77 (12.2%) 1151.41 (87.6%) 1.82 (0.1%) 1314.00 (100%)20 453.62 (14.7%) 2629.43 (85.2%) 2.24 (0.1%) 3085.30 (100%)30 553.50 (13.5%) 3548.57 (86.5%) 2.39 (0.1%) 4104.45 (100%)
Average (14.2%) (85.7%) (0.1%) (100%)
Table 7. IPCC 2007 potential environmental impacts (kg/CO2 eq/y) of the two treatment systems fordifferent sizes (PE) and for both the entire life cycle as well as each single phase (the values in bracketsare the percentage contribution of each phase to the total impacts).
WWTPs PE Construction Use Disposal Total Life Cycle
LLDPE
5 17.82 (6.7%) 248.48 (93.1%) 0.60 (0.2%) 266.91 (100%)10 26.37 (5.9%) 418.07 (93.9%) 0.97 (0.2%) 445.43 (100%)20 47.37 (5.8%) 761.18 (93.9%) 1.88 (0.2%) 810.47 (100%)30 60.57 (5.1%) 1116.86 (94.7%) 2.46 (0.2%) 1179.95 (100%)
Average (5.9%) (93.9%) (0.2%) (100%)
VRC
5 55.42 (15.4%) 303.59 (84.4%) 0.67 (0.2%) 359.69 (100%)10 55.42 (11.3%) 433.68 (88.5%) 0.67 (0.1%) 489.77 (100%)20 157.59 (13.6%) 997.45 (86.3%) 0.84 (0.1%) 1155.87 (100%)30 192.38 (12.5%) 1350.47 (87.5%) 0.89 (0.1%) 1543.74 (100%)
Average (13.2%) (86.7%) (0.1%) (100%)
Table 8 presents the per capita impacts obtained by dividing the absolute values of Tables 5–7 bythe corresponding number of PE.
The obtained results confirm the obvious expected result that the greater the treatment capacity(in terms of PE), the greater the environmental impacts on both the total life cycle as well as each singlephase (Tables 5–7). On the other hand, there is a beneficial scale factor in terms of per capita impacts.In fact, the greater the treatment capacity, the lower the per capita impacts are (Table 8). The VRC for10 PE was the unique exception to the previous stated general rule, because the technical catalogueused for the designing of the treatment system suggested the same dimensions for both 5 and 10 PE.
Use is the most significant phase of the life cycle for both treatment systems (independently bytheir size) as well as the three impact assessment methods. For the LLDPE treatment system, the usepercentage incidence was 89.8% in terms of ReCiPe, 93.6% in terms of Ecological Footprint and 93.7%in terms of IPCC 2007, while, for the VRC treatment system, the use percentage incidence was 83.8% interms of ReCiPe, 85.3% in terms of Ecological Footprint and 86.4% in terms of IPCC 2007.
Construction is the second most significant phase of the life cycle for both treatment systems(independently by their size) as well as the three impact assessment methods. For the LLDPE treatmentsystem, the construction percentage incidence was 10.0% in terms of ReCiPe, 6.3% in terms of EcologicalFootprint and 6.0% in terms of IPCC 2007, while, for the VRC treatment system, the use percentageincidence was 16.1% in terms of ReCiPe, 14.6% in terms of Ecological Footprint and 13.5% in terms ofIPCC 2007.
The disposal phase, compared with the incidence of use and construction phases, was negligiblefor both treatment systems (independently by their size) as well as the three impact assessmentmethods. Overall, it averaged around 0.15%.
Sustainability 2016, 8, 212 8 of 17
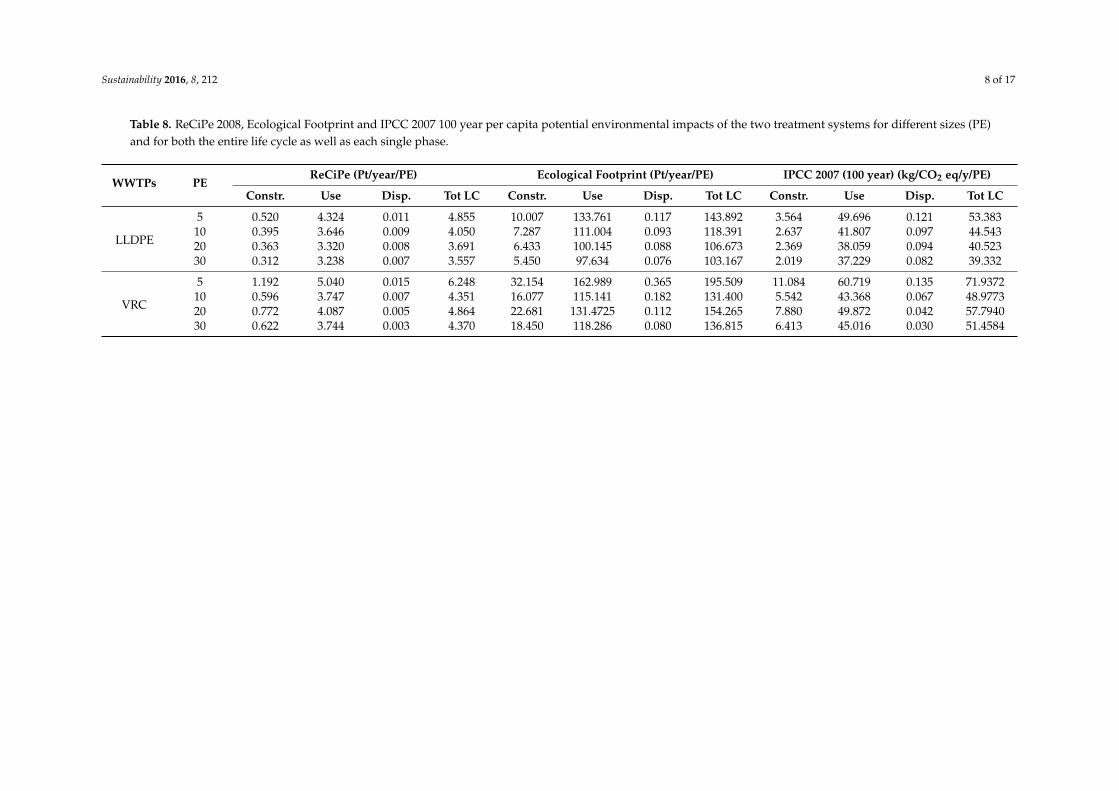
Table 8. ReCiPe 2008, Ecological Footprint and IPCC 2007 100 year per capita potential environmental impacts of the two treatment systems for different sizes (PE)and for both the entire life cycle as well as each single phase.
WWTPs PEReCiPe (Pt/year/PE) Ecological Footprint (Pt/year/PE) IPCC 2007 (100 year) (kg/CO2 eq/y/PE)
Constr. Use Disp. Tot LC Constr. Use Disp. Tot LC Constr. Use Disp. Tot LC
LLDPE
5 0.520 4.324 0.011 4.855 10.007 133.761 0.117 143.892 3.564 49.696 0.121 53.38310 0.395 3.646 0.009 4.050 7.287 111.004 0.093 118.391 2.637 41.807 0.097 44.54320 0.363 3.320 0.008 3.691 6.433 100.145 0.088 106.673 2.369 38.059 0.094 40.52330 0.312 3.238 0.007 3.557 5.450 97.634 0.076 103.167 2.019 37.229 0.082 39.332
VRC
5 1.192 5.040 0.015 6.248 32.154 162.989 0.365 195.509 11.084 60.719 0.135 71.937210 0.596 3.747 0.007 4.351 16.077 115.141 0.182 131.400 5.542 43.368 0.067 48.977320 0.772 4.087 0.005 4.864 22.681 131.4725 0.112 154.265 7.880 49.872 0.042 57.794030 0.622 3.744 0.003 4.370 18.450 118.286 0.080 136.815 6.413 45.016 0.030 51.4584
Sustainability 2016, 8, 212 9 of 17
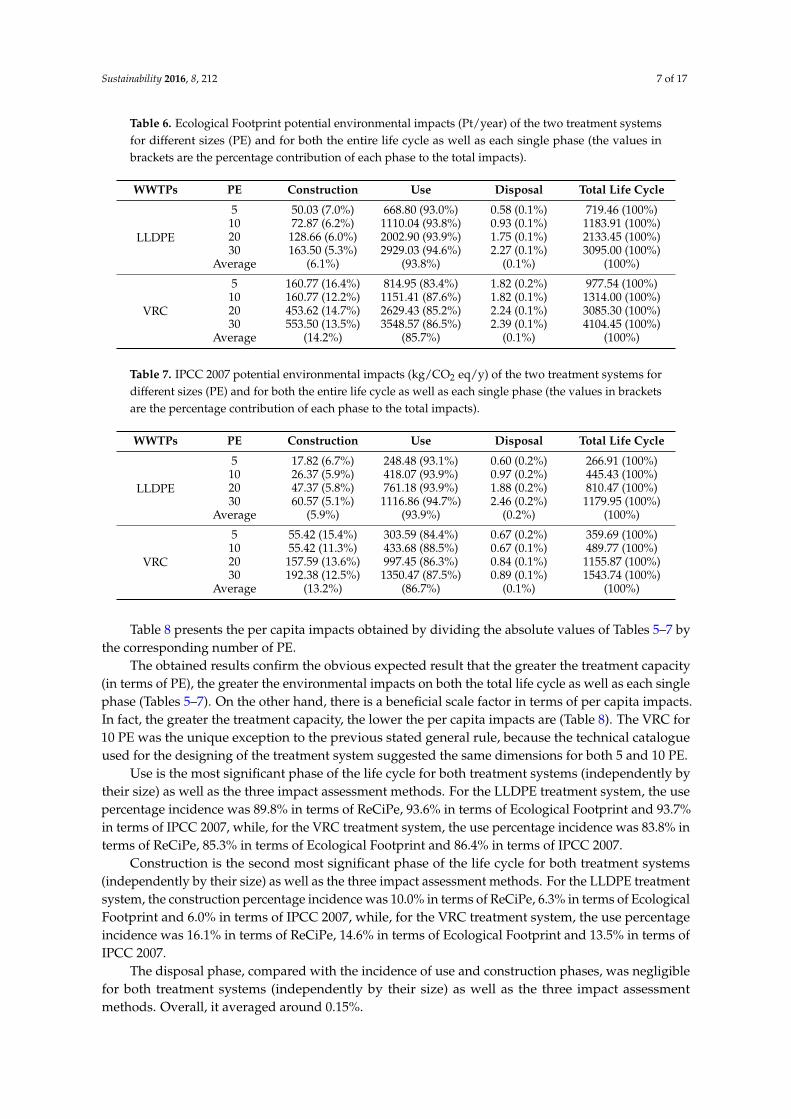
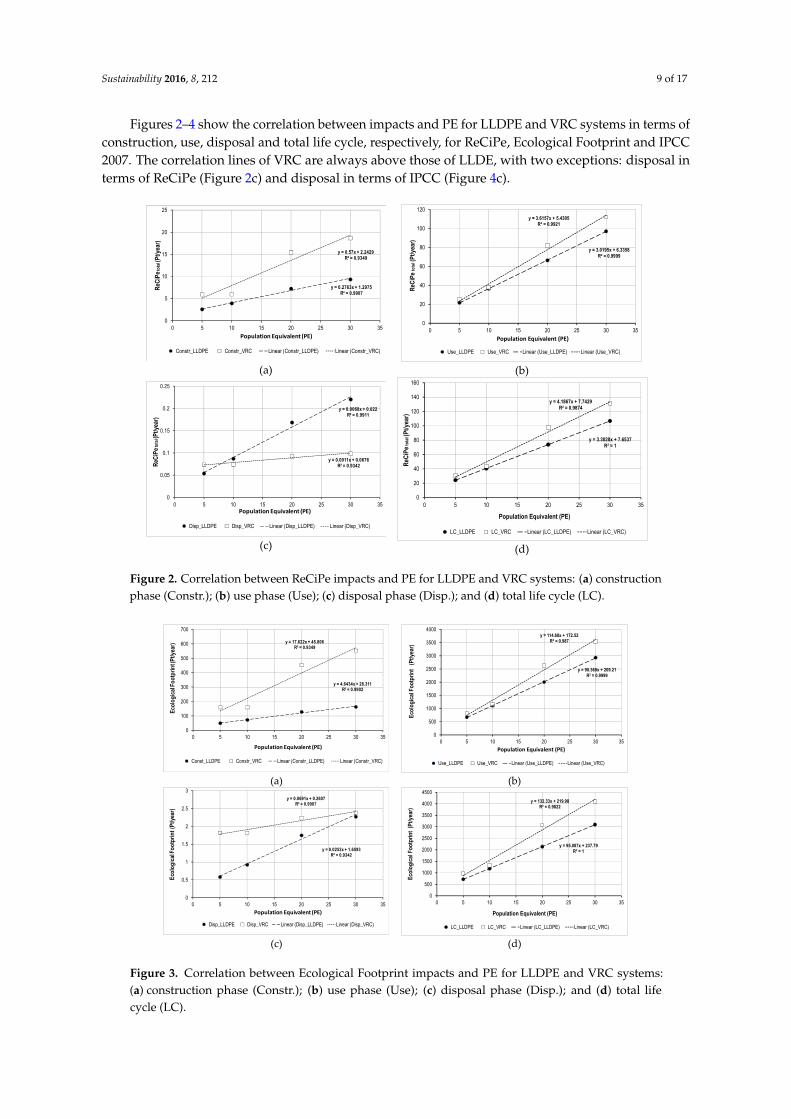
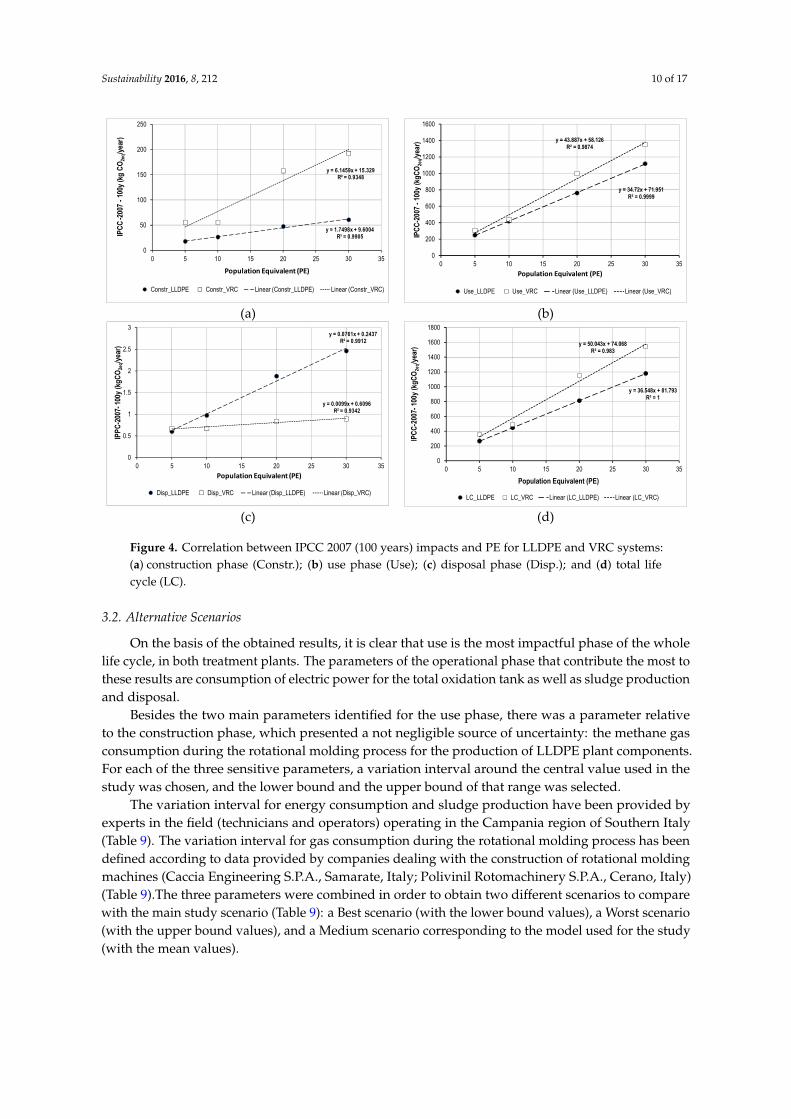
Figures 2–4 show the correlation between impacts and PE for LLDPE and VRC systems in terms ofconstruction, use, disposal and total life cycle, respectively, for ReCiPe, Ecological Footprint and IPCC2007. The correlation lines of VRC are always above those of LLDE, with two exceptions: disposal interms of ReCiPe (Figure 2c) and disposal in terms of IPCC (Figure 4c).
Sustainability 2016, 8, 212 9 of 18
The obtained results confirm the obvious expected result that the greater the treatment capacity
(in terms of PE), the greater the environmental impacts on both the total life cycle as well as each
single phase (Tables 5–7). On the other hand, there is a beneficial scale factor in terms of per capita
impacts. In fact, the greater the treatment capacity, the lower the per capita impacts are (Table 8). The
VRC for 10 PE was the unique exception to the previous stated general rule, because the technical
catalogue used for the designing of the treatment system suggested the same dimensions for both 5
and 10 PE.
Use is the most significant phase of the life cycle for both treatment systems (independently by
their size) as well as the three impact assessment methods. For the LLDPE treatment system, the use
percentage incidence was 89.8% in terms of ReCiPe, 93.6% in terms of Ecological Footprint and
93.7% in terms of IPCC 2007, while, for the VRC treatment system, the use percentage incidence was
83.8% in terms of ReCiPe, 85.3% in terms of Ecological Footprint and 86.4% in terms of IPCC 2007.
Construction is the second most significant phase of the life cycle for both treatment systems
(independently by their size) as well as the three impact assessment methods. For the LLDPE
treatment system, the construction percentage incidence was 10.0% in terms of ReCiPe, 6.3% in
terms of Ecological Footprint and 6.0% in terms of IPCC 2007, while, for the VRC treatment system,
the use percentage incidence was 16.1% in terms of ReCiPe, 14.6% in terms of Ecological Footprint
and 13.5% in terms of IPCC 2007.
The disposal phase, compared with the incidence of use and construction phases, was
negligible for both treatment systems (independently by their size) as well as the three impact
assessment methods. Overall, it averaged around 0.15%.
Figures 2–4 show the correlation between impacts and PE for LLDPE and VRC systems in terms
of construction, use, disposal and total life cycle, respectively, for ReCiPe, Ecological Footprint and
IPCC 2007. The correlation lines of VRC are always above those of LLDE, with two exceptions:
disposal in terms of ReCiPe (Figure 2c) and disposal in terms of IPCC (Figure 4c).
(a)
(b)
(c) (d)
Figure 2. Correlation between ReCiPe impacts and PE for LLDPE and VRC systems: (a) construction
phase (Constr.); (b) use phase (Use); (c) disposal phase (Disp.); and (d) total life cycle (LC).
y = 0.2763x + 1.2975R² = 0.9907
y = 0.57x + 2.2429R² = 0.9349
0
5
10
15
20
25
0 5 10 15 20 25 30 35
ReC
iPet
otal
(Pt/y
ear)
Population Equivalent (PE)
Constr_LLDPE Constr_VRC Linear (Constr_LLDPE) Linear (Constr_VRC)
y = 3.0195x + 6.3358R² = 0.9999
y = 3.6157x + 5.4305R² = 0.9921
0
20
40
60
80
100
120
0 5 10 15 20 25 30 35
ReC
iPe
tota
l(Pt
/yea
r)
Population Equivalent (PE)
Use_LLDPE Use_VRC Linear (Use_LLDPE) Linear (Use_VRC)
y = 0.0068x + 0.022R² = 0.9911
y = 0.0011x + 0.0676R² = 0.9342
0
0.05
0.1
0.15
0.2
0.25
0 5 10 15 20 25 30 35
ReC
iPet
otal
(Pt/y
ear)
Population Equivalent (PE)
Disp_LLDPE Disp_VRC Linear (Disp_LLDPE) Linear (Disp_VRC)
y = 3.3028x + 7.6537R² = 1
y = 4.1867x + 7.7429R² = 0.9874
0
20
40
60
80
100
120
140
160
0 5 10 15 20 25 30 35
ReC
iPe
tota
l (Pt
/yea
r)
Population Equivalent (PE)
LC_LLDPE LC_VRC Linear (LC_LLDPE) Linear (LC_VRC)
Figure 2. Correlation between ReCiPe impacts and PE for LLDPE and VRC systems: (a) constructionphase (Constr.); (b) use phase (Use); (c) disposal phase (Disp.); and (d) total life cycle (LC).
Sustainability 2016, 8, 212 10 of 18
(a) (b)
(c) (d)
Figure 3. Correlation between Ecological Footprint impacts and PE for LLDPE and VRC systems: (a)
construction phase (Constr.); (b) use phase (Use); (c) disposal phase (Disp.); and (d) total life cycle
(LC).
(a) (b)
(c) (d)
Figure 4. Correlation between IPCC 2007 (100 years) impacts and PE for LLDPE and VRC systems:
(a) construction phase (Constr.); (b) use phase (Use); (c) disposal phase (Disp.); and (d) total life cycle
(LC).
y = 4.6434x + 28.311R² = 0.9902
y = 17.622x + 45.806R² = 0.9349
0
100
200
300
400
500
600
700
0 5 10 15 20 25 30 35
Ecol
ogic
al F
ootp
rint (
Pt/y
ear)
Population Equivalent (PE)
Const_LLDPE Constr_VRC Linear (Constr_LLDPE) Linear (Constr_VRC)
y = 90.368x + 209.21R² = 0.9999
y = 114.68x + 172.52R² = 0.987
0
500
1000
1500
2000
2500
3000
3500
4000
0 5 10 15 20 25 30 35
Ecol
ogic
al F
ootp
rint
(Pt/y
ear)
Population Equivalent (PE)
Use_LLDPE Use_VRC Linear (Use_LLDPE) Linear (Use_VRC)
y = 0.0691x + 0.2607R² = 0.9907
y = 0.0252x + 1.6593R² = 0.9342
0
0.5
1
1.5
2
2.5
3
0 5 10 15 20 25 30 35
Ecol
ogic
al F
ootp
rint(
Pt/y
ear)
Population Equivalent (PE)
Disp_LLDPE Disp_VRC Linear (Disp_LLDPE) Linear (Disp_VRC)
y = 95.087x + 237.79R² = 1
y = 132.33x + 219.98R² = 0.9822
0
500
1000
1500
2000
2500
3000
3500
4000
4500
0 5 10 15 20 25 30 35
Ecol
ogic
al F
ootp
rint
(Pt/y
ear)
Population Equivalent (PE)
LC_LLDPE LC_VRC Linear (LC_LLDPE) Linear (LC_VRC)
y = 1.7498x + 9.6004R² = 0.9905
y = 6.1459x + 15.329R² = 0.9348
0
50
100
150
200
250
0 5 10 15 20 25 30 35
IPC
C -2
007
-100
y (k
g C
O2e
q/yea
r)
Population Equivalent (PE)
Constr_LLDPE Constr_VRC Linear (Constr_LLDPE) Linear (Constr_VRC)
y = 34.72x + 71.951R² = 0.9999
y = 43.887x + 58.126R² = 0.9874
0
200
400
600
800
1000
1200
1400
1600
0 5 10 15 20 25 30 35
IPC
C-2
007
-100
y (k
gCO
2eq/y
ear)
Population Equivalent (PE)
Use_LLDPE Use_VRC Linear (Use_LLDPE) Linear (Use_VRC)
y = 0.0761x + 0.2437R² = 0.9912
y = 0.0099x + 0.6096R² = 0.9342
0
0.5
1
1.5
2
2.5
3
0 5 10 15 20 25 30 35
IPPC
-200
7-10
0y (k
gCO
2eq/y
ear)
Population Equivalent (PE)
Disp_LLDPE Disp_VRC Linear (Disp_LLDPE) Linear (Disp_VRC)
y = 36.548x + 81.793R² = 1
y = 50.043x + 74.068R² = 0.983
0
200
400
600
800
1000
1200
1400
1600
1800
0 5 10 15 20 25 30 35
IPC
C-2
007-
100y
(kgC
O2e
q/yea
r)
Population Equivalent (PE)
LC_LLDPE LC_VRC Linear (LC_LLDPE) Linear (LC_VRC)
Figure 3. Correlation between Ecological Footprint impacts and PE for LLDPE and VRC systems:(a) construction phase (Constr.); (b) use phase (Use); (c) disposal phase (Disp.); and (d) total lifecycle (LC).
Sustainability 2016, 8, 212 10 of 17
Sustainability 2016, 8, 212 10 of 18
(a) (b)
(c) (d)
Figure 3. Correlation between Ecological Footprint impacts and PE for LLDPE and VRC systems: (a)
construction phase (Constr.); (b) use phase (Use); (c) disposal phase (Disp.); and (d) total life cycle
(LC).
(a) (b)
(c) (d)
Figure 4. Correlation between IPCC 2007 (100 years) impacts and PE for LLDPE and VRC systems:
(a) construction phase (Constr.); (b) use phase (Use); (c) disposal phase (Disp.); and (d) total life cycle
(LC).
y = 4.6434x + 28.311R² = 0.9902
y = 17.622x + 45.806R² = 0.9349
0
100
200
300
400
500
600
700
0 5 10 15 20 25 30 35
Ecol
ogic
al F
ootp
rint (
Pt/y
ear)
Population Equivalent (PE)
Const_LLDPE Constr_VRC Linear (Constr_LLDPE) Linear (Constr_VRC)
y = 90.368x + 209.21R² = 0.9999
y = 114.68x + 172.52R² = 0.987
0
500
1000
1500
2000
2500
3000
3500
4000
0 5 10 15 20 25 30 35
Ecol
ogic
al F
ootp
rint
(Pt/y
ear)
Population Equivalent (PE)
Use_LLDPE Use_VRC Linear (Use_LLDPE) Linear (Use_VRC)
y = 0.0691x + 0.2607R² = 0.9907
y = 0.0252x + 1.6593R² = 0.9342
0
0.5
1
1.5
2
2.5
3
0 5 10 15 20 25 30 35
Ecol
ogic
al F
ootp
rint(
Pt/y
ear)
Population Equivalent (PE)
Disp_LLDPE Disp_VRC Linear (Disp_LLDPE) Linear (Disp_VRC)
y = 95.087x + 237.79R² = 1
y = 132.33x + 219.98R² = 0.9822
0
500
1000
1500
2000
2500
3000
3500
4000
4500
0 5 10 15 20 25 30 35
Ecol
ogic
al F
ootp
rint
(Pt/y
ear)
Population Equivalent (PE)
LC_LLDPE LC_VRC Linear (LC_LLDPE) Linear (LC_VRC)
y = 1.7498x + 9.6004R² = 0.9905
y = 6.1459x + 15.329R² = 0.9348
0
50
100
150
200
250
0 5 10 15 20 25 30 35
IPC
C -2
007
-100
y (k
g C
O2e
q/yea
r)
Population Equivalent (PE)
Constr_LLDPE Constr_VRC Linear (Constr_LLDPE) Linear (Constr_VRC)
y = 34.72x + 71.951R² = 0.9999
y = 43.887x + 58.126R² = 0.9874
0
200
400
600
800
1000
1200
1400
1600
0 5 10 15 20 25 30 35
IPC
C-2
007
-100
y (k
gCO
2eq/y
ear)
Population Equivalent (PE)
Use_LLDPE Use_VRC Linear (Use_LLDPE) Linear (Use_VRC)
y = 0.0761x + 0.2437R² = 0.9912
y = 0.0099x + 0.6096R² = 0.9342
0
0.5
1
1.5
2
2.5
3
0 5 10 15 20 25 30 35
IPPC
-200
7-10
0y (k
gCO
2eq/y
ear)
Population Equivalent (PE)
Disp_LLDPE Disp_VRC Linear (Disp_LLDPE) Linear (Disp_VRC)
y = 36.548x + 81.793R² = 1
y = 50.043x + 74.068R² = 0.983
0
200
400
600
800
1000
1200
1400
1600
1800
0 5 10 15 20 25 30 35
IPC
C-2
007-
100y
(kgC
O2e
q/yea
r)
Population Equivalent (PE)
LC_LLDPE LC_VRC Linear (LC_LLDPE) Linear (LC_VRC)
Figure 4. Correlation between IPCC 2007 (100 years) impacts and PE for LLDPE and VRC systems:(a) construction phase (Constr.); (b) use phase (Use); (c) disposal phase (Disp.); and (d) total lifecycle (LC).
3.2. Alternative Scenarios
On the basis of the obtained results, it is clear that use is the most impactful phase of the wholelife cycle, in both treatment plants. The parameters of the operational phase that contribute the most tothese results are consumption of electric power for the total oxidation tank as well as sludge productionand disposal.
Besides the two main parameters identified for the use phase, there was a parameter relativeto the construction phase, which presented a not negligible source of uncertainty: the methane gasconsumption during the rotational molding process for the production of LLDPE plant components.For each of the three sensitive parameters, a variation interval around the central value used in thestudy was chosen, and the lower bound and the upper bound of that range was selected.
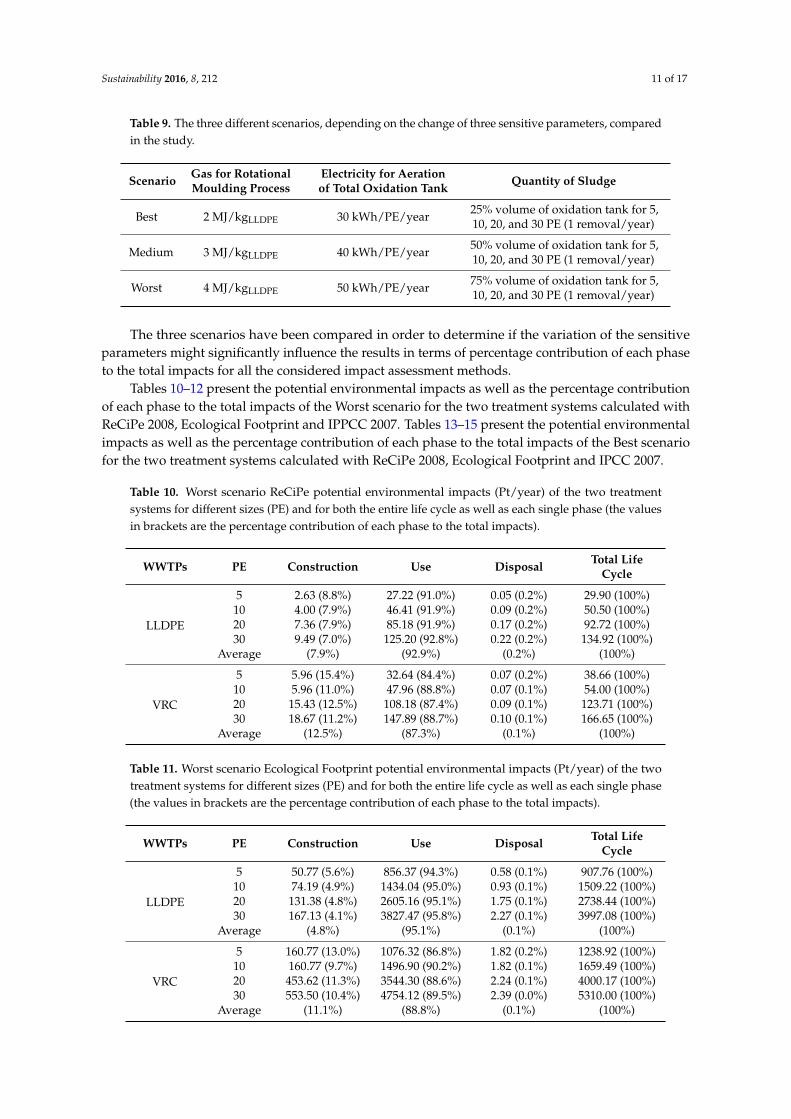
The variation interval for energy consumption and sludge production have been provided byexperts in the field (technicians and operators) operating in the Campania region of Southern Italy(Table 9). The variation interval for gas consumption during the rotational molding process has beendefined according to data provided by companies dealing with the construction of rotational moldingmachines (Caccia Engineering S.P.A., Samarate, Italy; Polivinil Rotomachinery S.P.A., Cerano, Italy)(Table 9).The three parameters were combined in order to obtain two different scenarios to comparewith the main study scenario (Table 9): a Best scenario (with the lower bound values), a Worst scenario(with the upper bound values), and a Medium scenario corresponding to the model used for the study(with the mean values).
Sustainability 2016, 8, 212 11 of 17
Table 9. The three different scenarios, depending on the change of three sensitive parameters, comparedin the study.
Scenario Gas for RotationalMoulding Process
Electricity for Aerationof Total Oxidation Tank Quantity of Sludge
Best 2 MJ/kgLLDPE 30 kWh/PE/year 25% volume of oxidation tank for 5,10, 20, and 30 PE (1 removal/year)
Medium 3 MJ/kgLLDPE 40 kWh/PE/year 50% volume of oxidation tank for 5,10, 20, and 30 PE (1 removal/year)
Worst 4 MJ/kgLLDPE 50 kWh/PE/year 75% volume of oxidation tank for 5,10, 20, and 30 PE (1 removal/year)
The three scenarios have been compared in order to determine if the variation of the sensitiveparameters might significantly influence the results in terms of percentage contribution of each phaseto the total impacts for all the considered impact assessment methods.
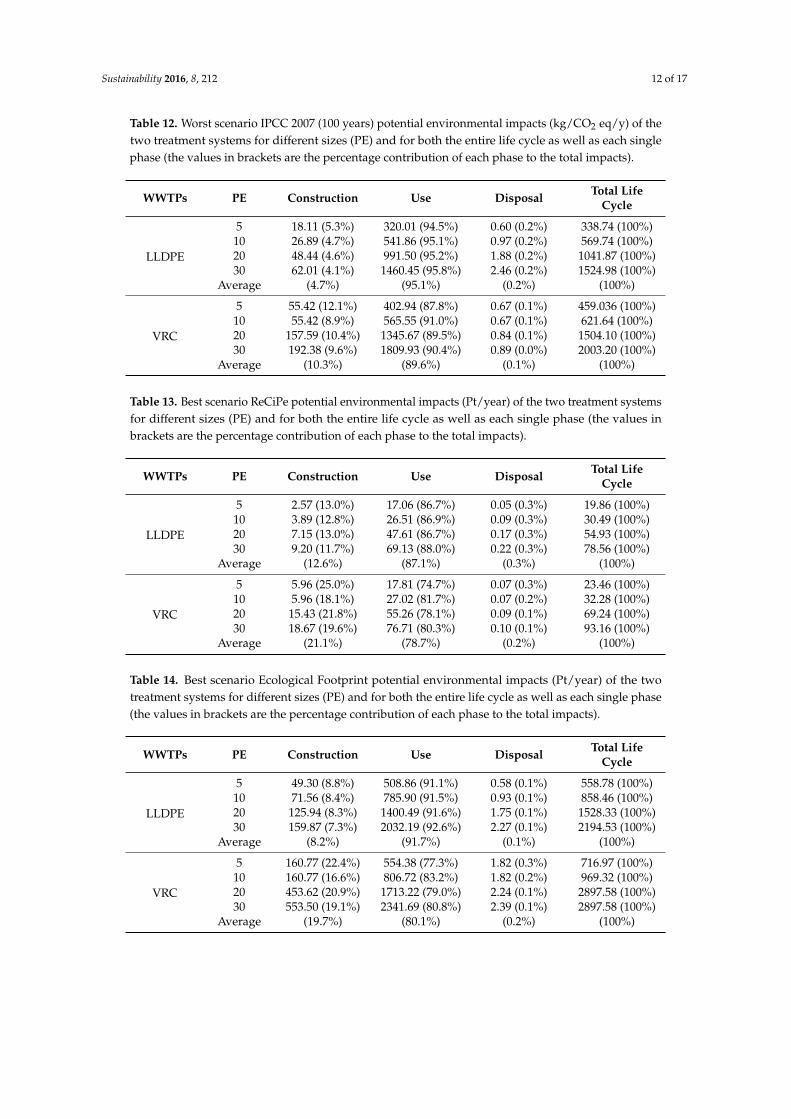
Tables 10–12 present the potential environmental impacts as well as the percentage contributionof each phase to the total impacts of the Worst scenario for the two treatment systems calculated withReCiPe 2008, Ecological Footprint and IPPCC 2007. Tables 13–15 present the potential environmentalimpacts as well as the percentage contribution of each phase to the total impacts of the Best scenariofor the two treatment systems calculated with ReCiPe 2008, Ecological Footprint and IPCC 2007.
Table 10. Worst scenario ReCiPe potential environmental impacts (Pt/year) of the two treatmentsystems for different sizes (PE) and for both the entire life cycle as well as each single phase (the valuesin brackets are the percentage contribution of each phase to the total impacts).
WWTPs PE Construction Use Disposal Total LifeCycle
LLDPE
5 2.63 (8.8%) 27.22 (91.0%) 0.05 (0.2%) 29.90 (100%)10 4.00 (7.9%) 46.41 (91.9%) 0.09 (0.2%) 50.50 (100%)20 7.36 (7.9%) 85.18 (91.9%) 0.17 (0.2%) 92.72 (100%)30 9.49 (7.0%) 125.20 (92.8%) 0.22 (0.2%) 134.92 (100%)
Average (7.9%) (92.9%) (0.2%) (100%)
VRC
5 5.96 (15.4%) 32.64 (84.4%) 0.07 (0.2%) 38.66 (100%)10 5.96 (11.0%) 47.96 (88.8%) 0.07 (0.1%) 54.00 (100%)20 15.43 (12.5%) 108.18 (87.4%) 0.09 (0.1%) 123.71 (100%)30 18.67 (11.2%) 147.89 (88.7%) 0.10 (0.1%) 166.65 (100%)
Average (12.5%) (87.3%) (0.1%) (100%)
Table 11. Worst scenario Ecological Footprint potential environmental impacts (Pt/year) of the twotreatment systems for different sizes (PE) and for both the entire life cycle as well as each single phase(the values in brackets are the percentage contribution of each phase to the total impacts).
WWTPs PE Construction Use Disposal Total LifeCycle
LLDPE
5 50.77 (5.6%) 856.37 (94.3%) 0.58 (0.1%) 907.76 (100%)10 74.19 (4.9%) 1434.04 (95.0%) 0.93 (0.1%) 1509.22 (100%)20 131.38 (4.8%) 2605.16 (95.1%) 1.75 (0.1%) 2738.44 (100%)30 167.13 (4.1%) 3827.47 (95.8%) 2.27 (0.1%) 3997.08 (100%)
Average (4.8%) (95.1%) (0.1%) (100%)
VRC
5 160.77 (13.0%) 1076.32 (86.8%) 1.82 (0.2%) 1238.92 (100%)10 160.77 (9.7%) 1496.90 (90.2%) 1.82 (0.1%) 1659.49 (100%)20 453.62 (11.3%) 3544.30 (88.6%) 2.24 (0.1%) 4000.17 (100%)30 553.50 (10.4%) 4754.12 (89.5%) 2.39 (0.0%) 5310.00 (100%)
Average (11.1%) (88.8%) (0.1%) (100%)
Sustainability 2016, 8, 212 12 of 17
Table 12. Worst scenario IPCC 2007 (100 years) potential environmental impacts (kg/CO2 eq/y) of thetwo treatment systems for different sizes (PE) and for both the entire life cycle as well as each singlephase (the values in brackets are the percentage contribution of each phase to the total impacts).
WWTPs PE Construction Use Disposal Total LifeCycle
LLDPE
5 18.11 (5.3%) 320.01 (94.5%) 0.60 (0.2%) 338.74 (100%)10 26.89 (4.7%) 541.86 (95.1%) 0.97 (0.2%) 569.74 (100%)20 48.44 (4.6%) 991.50 (95.2%) 1.88 (0.2%) 1041.87 (100%)30 62.01 (4.1%) 1460.45 (95.8%) 2.46 (0.2%) 1524.98 (100%)
Average (4.7%) (95.1%) (0.2%) (100%)
VRC
5 55.42 (12.1%) 402.94 (87.8%) 0.67 (0.1%) 459.036 (100%)10 55.42 (8.9%) 565.55 (91.0%) 0.67 (0.1%) 621.64 (100%)20 157.59 (10.4%) 1345.67 (89.5%) 0.84 (0.1%) 1504.10 (100%)30 192.38 (9.6%) 1809.93 (90.4%) 0.89 (0.0%) 2003.20 (100%)
Average (10.3%) (89.6%) (0.1%) (100%)
Table 13. Best scenario ReCiPe potential environmental impacts (Pt/year) of the two treatment systemsfor different sizes (PE) and for both the entire life cycle as well as each single phase (the values inbrackets are the percentage contribution of each phase to the total impacts).
WWTPs PE Construction Use Disposal Total LifeCycle
LLDPE
5 2.57 (13.0%) 17.06 (86.7%) 0.05 (0.3%) 19.86 (100%)10 3.89 (12.8%) 26.51 (86.9%) 0.09 (0.3%) 30.49 (100%)20 7.15 (13.0%) 47.61 (86.7%) 0.17 (0.3%) 54.93 (100%)30 9.20 (11.7%) 69.13 (88.0%) 0.22 (0.3%) 78.56 (100%)
Average (12.6%) (87.1%) (0.3%) (100%)
VRC
5 5.96 (25.0%) 17.81 (74.7%) 0.07 (0.3%) 23.46 (100%)10 5.96 (18.1%) 27.02 (81.7%) 0.07 (0.2%) 32.28 (100%)20 15.43 (21.8%) 55.26 (78.1%) 0.09 (0.1%) 69.24 (100%)30 18.67 (19.6%) 76.71 (80.3%) 0.10 (0.1%) 93.16 (100%)
Average (21.1%) (78.7%) (0.2%) (100%)
Table 14. Best scenario Ecological Footprint potential environmental impacts (Pt/year) of the twotreatment systems for different sizes (PE) and for both the entire life cycle as well as each single phase(the values in brackets are the percentage contribution of each phase to the total impacts).
WWTPs PE Construction Use Disposal Total LifeCycle
LLDPE
5 49.30 (8.8%) 508.86 (91.1%) 0.58 (0.1%) 558.78 (100%)10 71.56 (8.4%) 785.90 (91.5%) 0.93 (0.1%) 858.46 (100%)20 125.94 (8.3%) 1400.49 (91.6%) 1.75 (0.1%) 1528.33 (100%)30 159.87 (7.3%) 2032.19 (92.6%) 2.27 (0.1%) 2194.53 (100%)
Average (8.2%) (91.7%) (0.1%) (100%)
VRC
5 160.77 (22.4%) 554.38 (77.3%) 1.82 (0.3%) 716.97 (100%)10 160.77 (16.6%) 806.72 (83.2%) 1.82 (0.2%) 969.32 (100%)20 453.62 (20.9%) 1713.22 (79.0%) 2.24 (0.1%) 2897.58 (100%)30 553.50 (19.1%) 2341.69 (80.8%) 2.39 (0.1%) 2897.58 (100%)
Average (19.7%) (80.1%) (0.2%) (100%)
Sustainability 2016, 8, 212 13 of 17
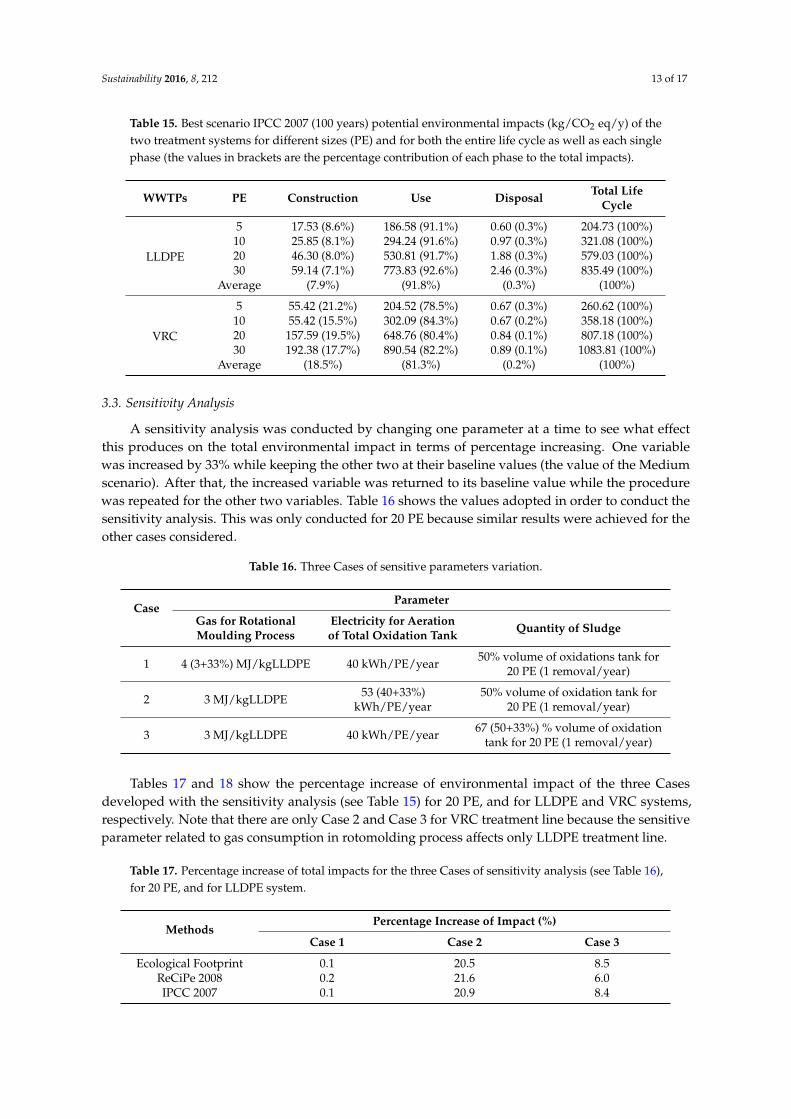
Table 15. Best scenario IPCC 2007 (100 years) potential environmental impacts (kg/CO2 eq/y) of thetwo treatment systems for different sizes (PE) and for both the entire life cycle as well as each singlephase (the values in brackets are the percentage contribution of each phase to the total impacts).
WWTPs PE Construction Use Disposal Total LifeCycle
LLDPE
5 17.53 (8.6%) 186.58 (91.1%) 0.60 (0.3%) 204.73 (100%)10 25.85 (8.1%) 294.24 (91.6%) 0.97 (0.3%) 321.08 (100%)20 46.30 (8.0%) 530.81 (91.7%) 1.88 (0.3%) 579.03 (100%)30 59.14 (7.1%) 773.83 (92.6%) 2.46 (0.3%) 835.49 (100%)
Average (7.9%) (91.8%) (0.3%) (100%)
VRC
5 55.42 (21.2%) 204.52 (78.5%) 0.67 (0.3%) 260.62 (100%)10 55.42 (15.5%) 302.09 (84.3%) 0.67 (0.2%) 358.18 (100%)20 157.59 (19.5%) 648.76 (80.4%) 0.84 (0.1%) 807.18 (100%)30 192.38 (17.7%) 890.54 (82.2%) 0.89 (0.1%) 1083.81 (100%)
Average (18.5%) (81.3%) (0.2%) (100%)
3.3. Sensitivity Analysis
A sensitivity analysis was conducted by changing one parameter at a time to see what effectthis produces on the total environmental impact in terms of percentage increasing. One variablewas increased by 33% while keeping the other two at their baseline values (the value of the Mediumscenario). After that, the increased variable was returned to its baseline value while the procedurewas repeated for the other two variables. Table 16 shows the values adopted in order to conduct thesensitivity analysis. This was only conducted for 20 PE because similar results were achieved for theother cases considered.
Table 16. Three Cases of sensitive parameters variation.
CaseParameter
Gas for RotationalMoulding Process
Electricity for Aerationof Total Oxidation Tank Quantity of Sludge
1 4 (3+33%) MJ/kgLLDPE 40 kWh/PE/year 50% volume of oxidations tank for20 PE (1 removal/year)
2 3 MJ/kgLLDPE 53 (40+33%)kWh/PE/year
50% volume of oxidation tank for20 PE (1 removal/year)
3 3 MJ/kgLLDPE 40 kWh/PE/year 67 (50+33%) % volume of oxidationtank for 20 PE (1 removal/year)
Tables 17 and 18 show the percentage increase of environmental impact of the three Casesdeveloped with the sensitivity analysis (see Table 15) for 20 PE, and for LLDPE and VRC systems,respectively. Note that there are only Case 2 and Case 3 for VRC treatment line because the sensitiveparameter related to gas consumption in rotomolding process affects only LLDPE treatment line.
Table 17. Percentage increase of total impacts for the three Cases of sensitivity analysis (see Table 16),for 20 PE, and for LLDPE system.
MethodsPercentage Increase of Impact (%)
Case 1 Case 2 Case 3
Ecological Footprint 0.1 20.5 8.5ReCiPe 2008 0.2 21.6 6.0IPCC 2007 0.1 20.9 8.4
Sustainability 2016, 8, 212 14 of 17
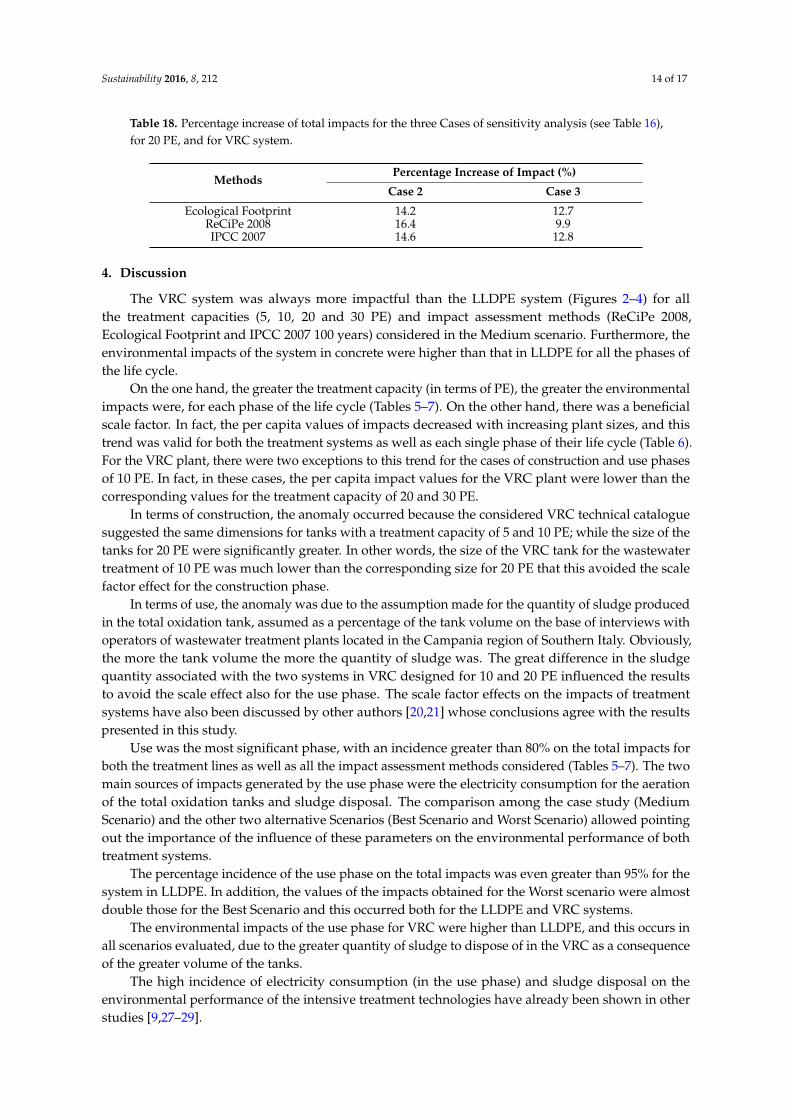
Table 18. Percentage increase of total impacts for the three Cases of sensitivity analysis (see Table 16),for 20 PE, and for VRC system.
MethodsPercentage Increase of Impact (%)
Case 2 Case 3
Ecological Footprint 14.2 12.7ReCiPe 2008 16.4 9.9IPCC 2007 14.6 12.8
4. Discussion
The VRC system was always more impactful than the LLDPE system (Figures 2–4) for allthe treatment capacities (5, 10, 20 and 30 PE) and impact assessment methods (ReCiPe 2008,Ecological Footprint and IPCC 2007 100 years) considered in the Medium scenario. Furthermore, theenvironmental impacts of the system in concrete were higher than that in LLDPE for all the phases ofthe life cycle.
On the one hand, the greater the treatment capacity (in terms of PE), the greater the environmentalimpacts were, for each phase of the life cycle (Tables 5–7). On the other hand, there was a beneficialscale factor. In fact, the per capita values of impacts decreased with increasing plant sizes, and thistrend was valid for both the treatment systems as well as each single phase of their life cycle (Table 6).For the VRC plant, there were two exceptions to this trend for the cases of construction and use phasesof 10 PE. In fact, in these cases, the per capita impact values for the VRC plant were lower than thecorresponding values for the treatment capacity of 20 and 30 PE.
In terms of construction, the anomaly occurred because the considered VRC technical cataloguesuggested the same dimensions for tanks with a treatment capacity of 5 and 10 PE; while the size of thetanks for 20 PE were significantly greater. In other words, the size of the VRC tank for the wastewatertreatment of 10 PE was much lower than the corresponding size for 20 PE that this avoided the scalefactor effect for the construction phase.
In terms of use, the anomaly was due to the assumption made for the quantity of sludge producedin the total oxidation tank, assumed as a percentage of the tank volume on the base of interviews withoperators of wastewater treatment plants located in the Campania region of Southern Italy. Obviously,the more the tank volume the more the quantity of sludge was. The great difference in the sludgequantity associated with the two systems in VRC designed for 10 and 20 PE influenced the resultsto avoid the scale effect also for the use phase. The scale factor effects on the impacts of treatmentsystems have also been discussed by other authors [20,21] whose conclusions agree with the resultspresented in this study.
Use was the most significant phase, with an incidence greater than 80% on the total impacts forboth the treatment lines as well as all the impact assessment methods considered (Tables 5–7). The twomain sources of impacts generated by the use phase were the electricity consumption for the aerationof the total oxidation tanks and sludge disposal. The comparison among the case study (MediumScenario) and the other two alternative Scenarios (Best Scenario and Worst Scenario) allowed pointingout the importance of the influence of these parameters on the environmental performance of bothtreatment systems.
The percentage incidence of the use phase on the total impacts was even greater than 95% for thesystem in LLDPE. In addition, the values of the impacts obtained for the Worst scenario were almostdouble those for the Best Scenario and this occurred both for the LLDPE and VRC systems.
The environmental impacts of the use phase for VRC were higher than LLDPE, and this occurs inall scenarios evaluated, due to the greater quantity of sludge to dispose of in the VRC as a consequenceof the greater volume of the tanks.
The high incidence of electricity consumption (in the use phase) and sludge disposal on theenvironmental performance of the intensive treatment technologies have already been shown in otherstudies [9,27–29].
Sustainability 2016, 8, 212 15 of 17
In this study, the obtained results showed that the construction phase has a percentage incidenceon the total impacts variable with the considered system. The construction generated impactssignificantly higher for the treatment line in concrete than LLDPE.
For the Medium Scenario, the percentage incidence of this phase never exceeded 20% of the totalimpact for both systems as well as all the impacts assessment methods considered (Tables 5–7).
The results obtained with the other alternative scenarios showed some differences but the overalltrend did not change.
The percentage incidence of the construction phase on total impacts for the Best Scenario wasgreater than that obtained in the Medium Scenario for both treatment systems (Tables 13–15). Inparticular, in the Best Scenario, there was the maximum percentage contribution equal to 25.4%(relative to the plant in concrete with a treatment capacity of 5 PE with ReCiPe 2008) (Table 13). Thepercentage incidence of the construction phase on the total impacts for the Worst Scenario was lessthan that obtained in the Medium Scenario for both treatment systems (Tables 10–12).
For the Best scenario, the sensitive parameters relating to the use phase corresponded to theminimum value adopted. Therefore, the operative phase of the plants generated lower potentialenvironmental impacts, compared to impacts of the operative phase of Medium Scenario, andconsequently increased the percentage contribution of the construction phase to total impacts(Tables 13–15). On the other hand, for the Worst scenario, the parameters related to the operationalphase assumed the maximum value adopted. Therefore, the impacts of this phase were higher andconsequently the percentage contribution of the construction to the total was lower (Tables 10–12).
The variation of the third sensitive parameter, i.e., the gas consumption for the rotational moldingprocess, it must be emphasized that its variation affected only the treatment system in LLDPE.Comparing the results obtained for the construction phase of such system for the Best scenario andWorst scenario, it is possible to note that the variation of this parameter was negligible. Consequently,it had no effect in the comparison between the construction phases of the two treatment systems. Infact, even in the Worst scenario (with the maximum value of gas consumption), the construction phaseof the concrete system was the most significant in terms of environmental impacts.
The results obtained with the two alternative scenarios (Best and Worst) did not change thegeneral conclusions of Medium Scenario (i.e., LLDPE was the best alternative in all scenarios; the usewas the most impactful phase for both lines and for all scenarios). However, there were significantdifferences in numerical terms between the results obtained with the three different scenarios.
It is worth nothing that, taking into account the results of the entire life cycle of the Worst Scenariofor LLDPE treatment line and Best Scenario for VRC treatment line, there is a reversal of the trend:the treatment system in VRC is less impactful than that in LLDPE. This occurs with all the evaluationmethods considered.
The performed sensitivity analysis showed that the electricity consumption for the aeration of thetotal oxidation tanks was the sensitive parameter playing the major role, for both treatment lines (seeCase 2 in Tables 17 and 18).
Usually, the disposal phase of wastewater treatment plants is completely ignored in currentliterature and consequently its impacts are not evaluated. In the performed study, the disposal phasepresented, in all cases, negligible environmental impacts as deducible from the percentage contributionthat this phase provided to the total impacts for both treatment lines (Tables 5–7).
The results obtained with the three impacts assessment methods taken into consideration (ReCiPe2008, Ecological Footprint and IPCC 2007 100 years) were uniform and coherent. Therefore, in thisstudy the choice of the evaluation method did not influence the results.
5. Conclusions
The performed study proposed a comparison of the environmental impacts calculated withthe LCA methodology of two on-site small-scale activated sludge total oxidation systems in linear
Sustainability 2016, 8, 212 16 of 17
low-density polyethylene (LLDPE) and VRC. Both plants were appropriately sized to ensure atreatment capacity of 5, 10, 20 and 30 equivalent inhabitants (PE).
The main aim of the study was to evaluate the incidence of construction, disposal and operationon the total impacts evaluated with three different methods: ReCiPe 2008, Ecological Footprint andIPCC 2007 100 years.
The most significant phase for both treatment lines was the use phase, which contributed morethan 80% of the total impacts. The construction phase was the second major phase with an incidenceless than 25% for both systems and for all the considered impacts assessment methods. For theactivated sludge total oxidation systems, use is the most weighted phase due to the high consumptionof energy and resources required for its operation.
Obviously, the results cannot be generalized because they were obtained for a specific type oftechnology. For instance, for extensive treatment systems, i.e., constructed wetlands, the life cyclephase with the greatest impact could be the construction phase [5,7–9].
Comparing the environmental performance of the two treatment systems considered in this study,it is possible to conclude that the plant designed in LLDPE was more eco-friendly than that designedin VRC. The plant in concrete was always most impactful, even comparing each single phase of the lifecycle as well as all the treatment capacities taken into consideration.
Finally, the obtained results were not dependent on the impact assessment method considered.
Acknowledgments: This article was produced as part of the research project called SNECS—Social Network delleEntità dei Centri Storici (“Social Network Entities of Historic Places”)—Notice 713/Ric 29 October 2010. Theauthors wish to thank Dr. Sacha A. Berardo for the English revision.
Author Contributions: Giovanni De Feo conceived and designed the study; Carmen Ferrara and GiovanniIuliano performed the calculations; Giovanni De Feo, Carmen Ferrara and Giovanni Iuliano analyzed the data;and Giovanni De Feo and Carmen Ferrara wrote the paper.
Conflicts of Interest: The authors declare no conflict of interest.
References
1. Curran, M.A. Life-cycle assessment. Encycl. Ecol. 2008, 3, 2168–2174.2. Lehtoranta, S.; Vilpas, R.; Mattila, T.J. Comparison of carbon footprints and eutrophication impacts of rural
on-site wastewater treatment plants in Finland. J. Clean. Prod. 2014, 65, 439–446. [CrossRef]3. Roux, P.; Mur, I.; Risch, E.; Boutin, C. Urban planning of sewer infrastructure: Impact of population density
and land topography on environmental performances of wastewater treatment systems. In Proceedings ofthe LCM 2011 International Conference on Life Cycle Management, Berlin, Germany, 28–31 August 2011.
4. Risch, E.; Gutierrez, O.; Roux, P.; Boutin, C.; Corominas, L. Life Cycle Assessment of urban wastewatersystems: Quantifying the relative contribution of sewer systems. Water Res. 2015, 77, 35–48. [CrossRef][PubMed]
5. Di Muro, J.; Guertin, F.; Helling, R.; Perkins, J.; Romer, S.A. Financial and Environmental Analysis ofConstructed Wetlands for Industrial Wastewater Treatment. J. Ind. Ecol. 2014, 18, 631–640. [CrossRef]
6. Dixon, A.; Simon, M.; Burkitt, T. Assessing the environmental impact of two options for small scalewastewater treatment: Comparing a reed bed and an aerated biological filter using a life cycle approach.Ecol. Eng. 2003, 20, 297–308. [CrossRef]
7. Lopsik, K. Life cycle assessment of small-scale constructed wetland and extended aeration activated sludgewastewater treatment system. Int. J. Environ. Sci. Technol. 2013, 10, 1295–1308. [CrossRef]
8. Machado, P.; Urbano, L.; Brito, G.; Janknecht, P.; Salas, J.J.; Nogueira, R. Life Cycle Assessment of WastewaterTreatment Options for Small and Decentralized Communities. Water Sci. Technol. 2007, 56, 15–22. [CrossRef] [PubMed]
9. Yıldırım, M.; Topkaya, B. Assessing Environmental Impacts of Wastewater, Treatment Alternatives forSmall-Scale Communities. Clean–Soil Air Water 2012, 40, 171–178. [CrossRef]
10. Roux, P.; Boutin, C.; Risch, E.; Heduit, A. Life Cycle environmental Assessment (LCA) of sanitation systemsincluding sewerage: Case of vertical flow constructed wetlands versus activated sludge. In Proceedings of12th IWA International Conference—Wetland Systems for Water Pollution Control, Venice, Italy, 4–8 October2010; Volume 2, pp. 879–887.
Sustainability 2016, 8, 212 17 of 17
11. Benetto, E.; Nguyen, D.; Lohmann, T.; Schmitt, B.; Schosseler, P. Life cycle assessment of ecological sanitationsystem for small-scale wastewater treatment. Sci. Total Environ. 2009, 407, 1506–1516. [CrossRef] [PubMed]
12. Kärrman, E.; Jönsson, H. Normalising impacts in an environmental systems analysis of wastewater systems.Water Sci. Technol. 2001, 43, 293–300. [PubMed]
13. Lundin, M.; Bengtsson, M.; Molander, S. Life cycle assessment of wastewater systems: Influence of systemboundaries and scale on calculated environmental loads. Environ. Sci. Technol. 2000, 34, 180–186. [CrossRef]
14. Remy, C.; Jekel, M. Sustainable wastewater management: Life cycle assessment of conventional andsource-separating urban sanitation systems. Water Sci. Technol. 2008, 58, 1555–1562. [CrossRef] [PubMed]
15. Remy, C.; Jekel, M. Energy analysis of conventional and source-separation systems for urban wastewatermanagement using Life Cycle Assessment. Water Sci. Technol. 2012, 65, 22–29. [CrossRef] [PubMed]
16. Thibodeau, C.; Monette, F.; Glaus, M. Comparison of development scenarios of a blackwatersource-separation sanitation system using life cycle assessment and environmental life cycle costing.Resour. Conserv. Recy. 2014, 92, 38–54. [CrossRef]
17. Tillman, A.M.; Svingby, M.; Lundström, H. Life cycle assessment of municipal waste water systems. Int. J.Life Cycle Ass. 1998, 3, 145–157. [CrossRef]
18. Larsen, H.F.; Hauschild, M. Review of existing LCA studies on wastewater treatment technologies. InProceedings of the SETAC-Europe Annual Meeting, 18th, Warsaw, SETAC Europe, Brussels, Belgium,25–29 May 2008.
19. Corominas, L.; Foley, J.; Guest, J.S.; Hospido, A.; Larsen, H.F.; Morera, S.; Shaw, A. Life cycle assessmentapplied to wastewater treatment: State of the art. Water Res. 2013, 47, 5480–5492. [CrossRef] [PubMed]
20. Doka, G. Life Cycle Inventories of Waste Treatment Services. Part IV “Wastewater treatment”; Ecoinvent ReportNo. 13; Swiss Centre for Life Cycle Inventories: Dübendorf, Schweiz, 2009.
21. Lorenzo-Toja, Y.; Rowe, I.V.; Chenel, S.; Navarro, D.M.; Moreira, M.T.; Feijoo, G. Eco-efficiency analysis ofSpanish WWTPs using the LCA + DEA method. Water Res. 2015, 68, 651–666. [CrossRef] [PubMed]
22. Decreto Legislativo 3 Aprile 2006, n. 152. “Norme in materia ambientale” (Environmental Regulations),Gazzetta Ufficiale n. 88 del 14 Aprile 2006—Supplemento Ordinario n. 96. Available online:http://www.camera.it/parlam/leggi/deleghe/06152dl.htm (accessed on 25 February 2016). (In Italian).
23. European Union. Directive 2000/60/EC of the European Parliament and of the Council of 23 October2000 establishing a framework for Community action in the field of water policy. 2000. Available online:http://faolex.fao.org/docs/pdf/eur23005.pdf (accessed on 25 February 2016).
24. De Feo, G.; De Gisi, S.; Galasso, M. Acque Reflue (Wastewater), 1st ed.; Dario Flaccovio Editore s.r.l: Palermo,Italy, 2012. (In Italian)
25. Goedkoop, M.; Heijungs, R.; Huijbregts, M.; de Schryver, A.; Struijs, J.; van Zelm, R. ReCiPe 2008—A lifeCycle Impact Assessment Method Which Comprises Harmonised Category Indicators at the Midpointand the Endpoint Level. First Edition (Version 1.08), Report I: Characterisation. 2013. Available online:http://www.lcia-recipe.net/file-cabinet/ReCiPe_main_report_MAY_2013.pdf?attredirects=0 (accessed on14 August 2015).
26. PRé. SimaPro Database Manual Methods library. 2015. Available online: http://www.pre-sustainability.com/download/DatabaseManualMethods.pdf (accessed on 14 August 2015).
27. Gallego, A.; Hospido, A.; Moreira, M.T.; Feijoo, G. Environmental performance of wastewater treatmentplants for small populations. Resour. Conserv. Recy. 2008, 52, 931–940. [CrossRef]
28. Hospido, A.; Moreira, M.T.; Feijoo, G. A comparison of municipal wastewater treatment plants for bigcentres of population in Galicia (Spain). Int. J. Life Cycle Ass. 2008, 13, 57–64. [CrossRef]
29. Pasqualino, J.C.; Meneses, M.; Abella, M.; Castells, F. LCA as a decision support tool for the environmentalimprovement of the operation of a municipal wastewater treatment plant. Environ. Sci. Technol. 2009, 43,3300–3307. [CrossRef] [PubMed]
© 2016 by the authors; licensee MDPI, Basel, Switzerland. This article is an open accessarticle distributed under the terms and conditions of the Creative Commons by Attribution(CC-BY) license (http://creativecommons.org/licenses/by/4.0/).