Embed Size (px)
Citation preview

Comparative examination of New Start light rail transit, light railway, and bus rapid transit services opened from 2000
Lyndon Henry Principal/Consultant
Mobility Planning Associates • Austin, Texas
TRB/APTA Joint Light Rail Transit Conference
Salt Lake City
12 November 2012
David Dobbs Publisher, Light Rail Now! Website
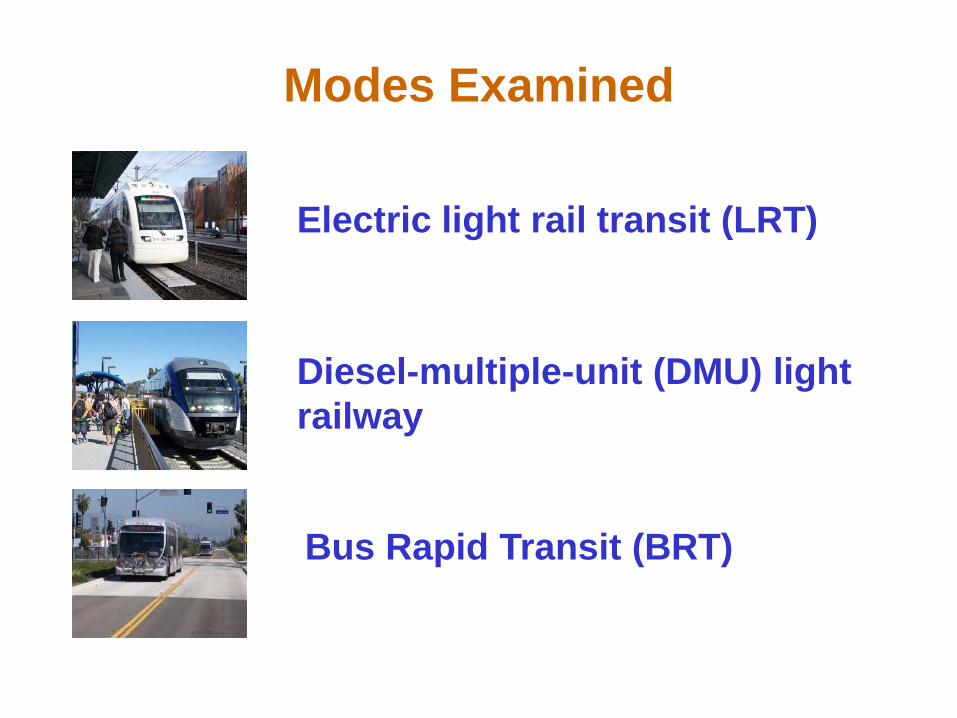
Modes Examined
Electric light rail transit (LRT)
Diesel-multiple-unit (DMU) light railway
Bus Rapid Transit (BRT)
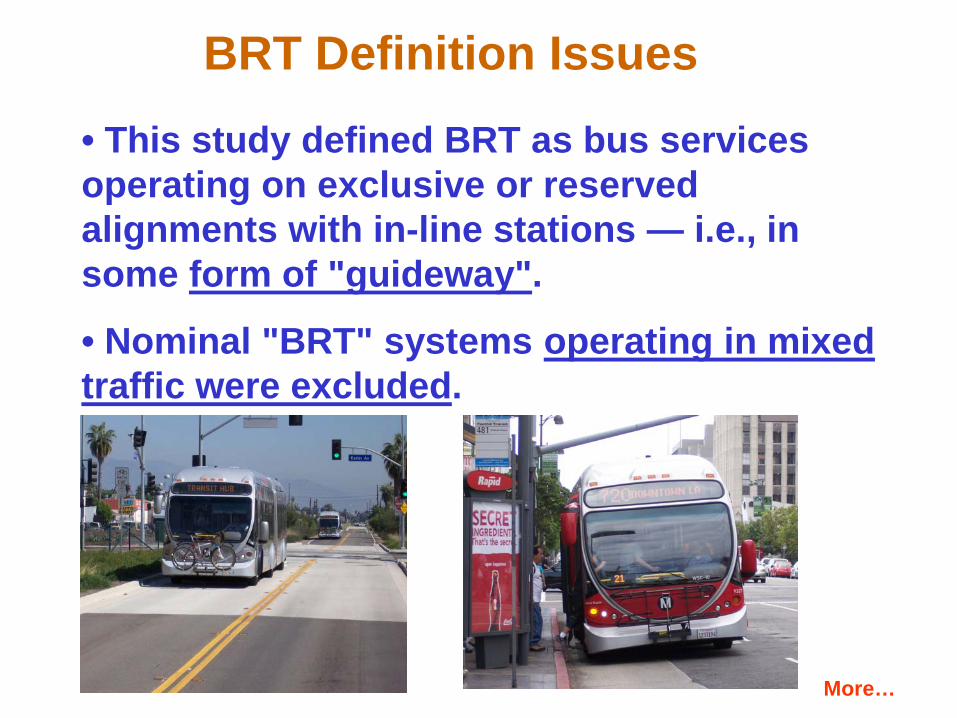
BRT Definition Issues
• This study defined BRT as bus services operating on exclusive or reserved alignments with in-line stations — i.e., in some form of "guideway".
• Nominal "BRT" systems operating in mixed traffic were excluded.
More…

• For any BRT project, only segment in exclusive or reserved alignment (i.e., in "guideway" or paveway) was included.
• Segments in mixed traffic (i.e., buses departing from operation in guideway) were considered ordinary limited-stop street bus operation.
Research Issues Investigated
• Major differences in capital cost per mile (km) among LRT, DMU light railway, and BRT?
• Major differences in how closely final capital costs match projected/budgeted costs?
• Major differences in how well ridership goals are achieved?
Research Data Criteria
• Projects studied: Selection of "New Starts" LRT, light railway, and BRT projects opened since 2000.
• "New Start" projects — mostly new systems, or major extensions to existing new systems, receiving New Starts funding or oversight from the FTA.
• Other totally new projects examined where data were readily accessible.
• Data must be reliable and compatible. More…

• Study results limited because of constraints on readily available data.
• Projects excluded where data insufficient or not readily available.
• DMU light railways of New Jersey Transit's RiverLine (Camden-Trenton) and Capital Metro's MetroRail (Austin, Texas metro area) excluded because of serious cost and operations data availability problems.
• Circulator-type streetcar lines excluded, but line-haul lines included.
O&M Data Problems
• Operating and maintenance (O&M) cost data (particularly per passenger-mile) either not readily available, or not available in a consistent, standardized form to facilitate reliable, fair comparisons.
• BRT operations data routinely blended in and reported with systemwide bus data.
• For extensions to existing LRT systems, crucial evaluatory data are almost never disaggregated from systemwide LRT data.

Except for just a handful of projects, adequate data was hard to find…
And it seemed our study might be doomed…

But suddenly, as if handed down from above…
… Help was found in the form of two excellent FTA-funded studies:
• Federal Transit Administration (FTA), Office of Planning and Environment with support from SG Associates, Inc., Predicted and Actual Impacts of New Starts Projects — Capital Cost, Operating Cost and Ridership Data (September 2003)
• FTA, Office of Planning and Environment with support from Vanasse Hangen Brustlin, Inc., The Predicted And Actual Impacts Of New Starts Projects — 2007 — Capital Cost And Ridership (April 2008)
These supplemented other sources of raw data for analysis in the study.

Evaluatory Methodology
Final Capital Cost per Mile
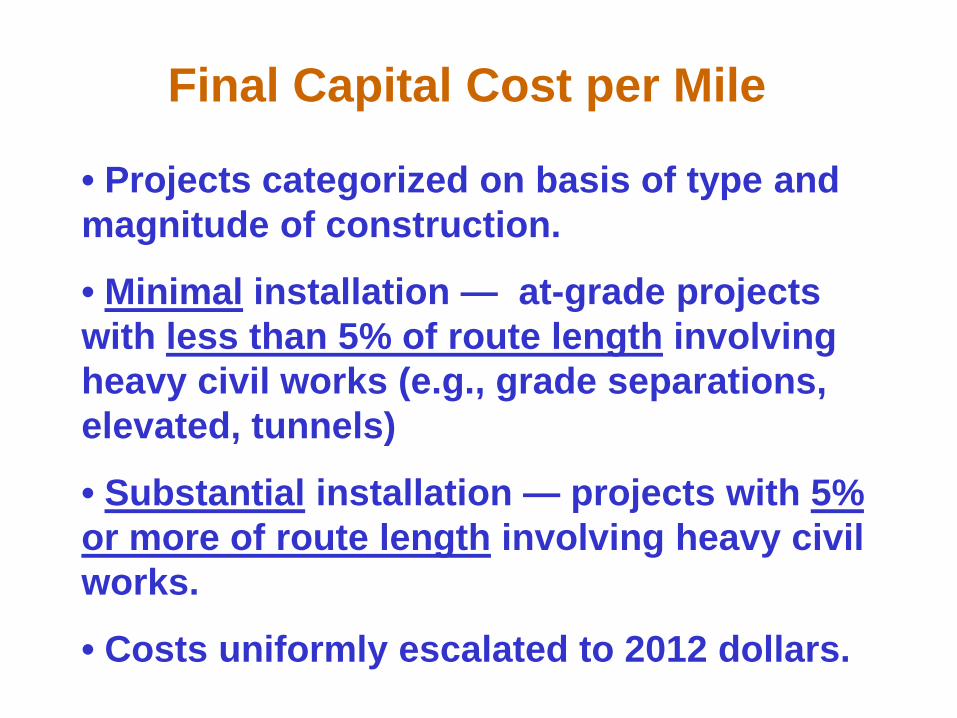
• Projects categorized on basis of type and magnitude of construction.
• Minimal installation — at-grade projects with less than 5% of route length involving heavy civil works (e.g., grade separations, elevated, tunnels)
• Substantial installation — projects with 5% or more of route length involving heavy civil works.
• Costs uniformly escalated to 2012 dollars.
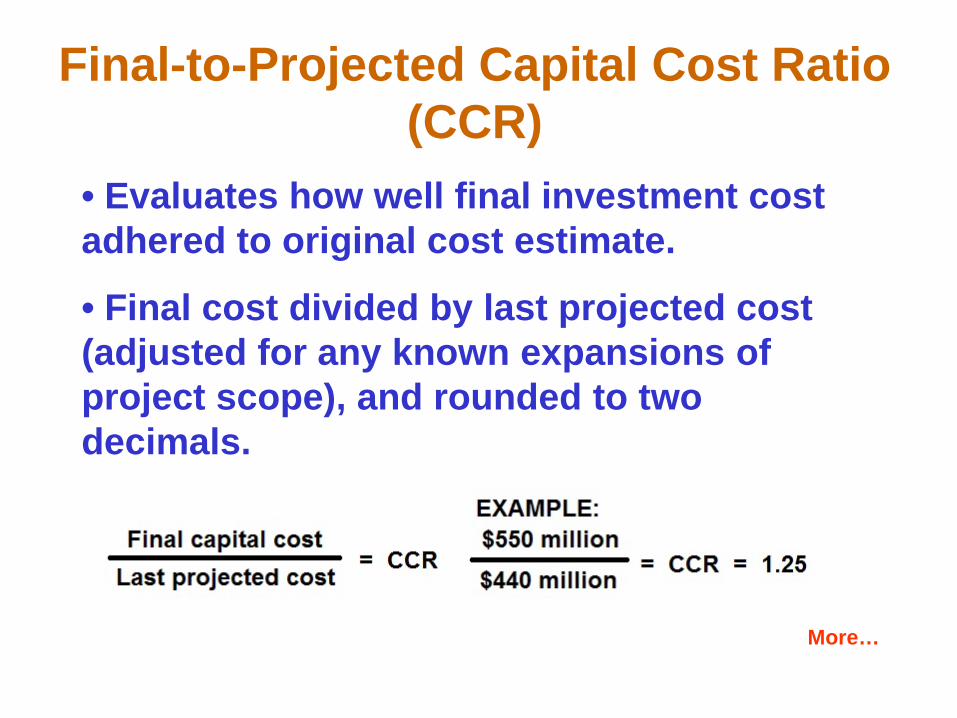
Final-to-Projected Capital Cost Ratio (CCR)
• Evaluates how well final investment cost adhered to original cost estimate.
• Final cost divided by last projected cost (adjusted for any known expansions of project scope), and rounded to two decimals.
More…

• 1 — project completed exactly within budget (good).
• <1 — project completed under budget (very good).
• >1 — budget overrun (poor).
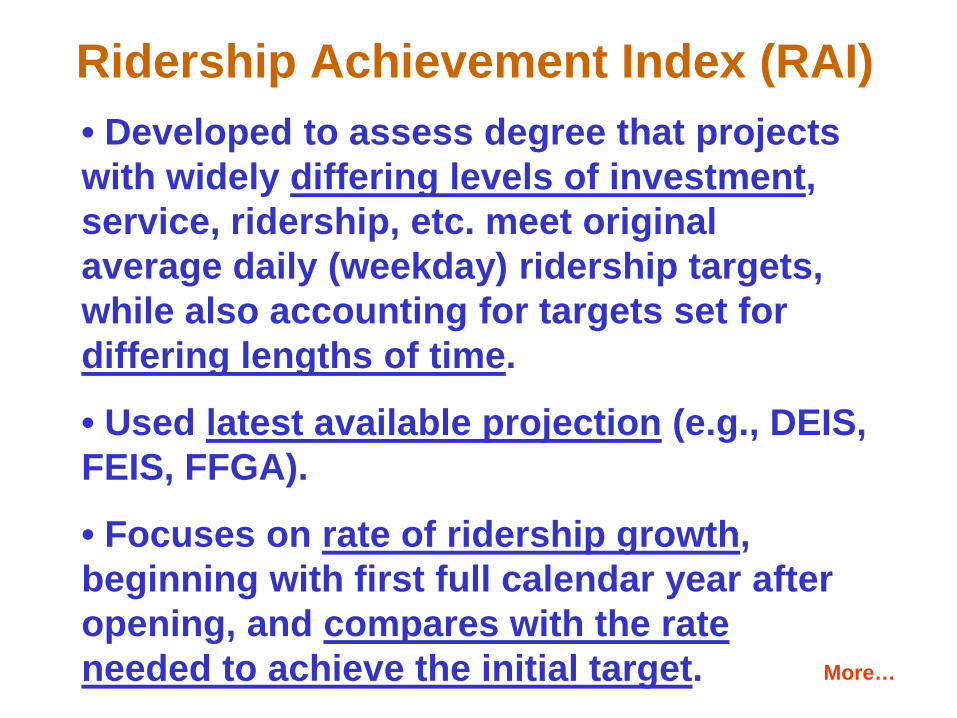
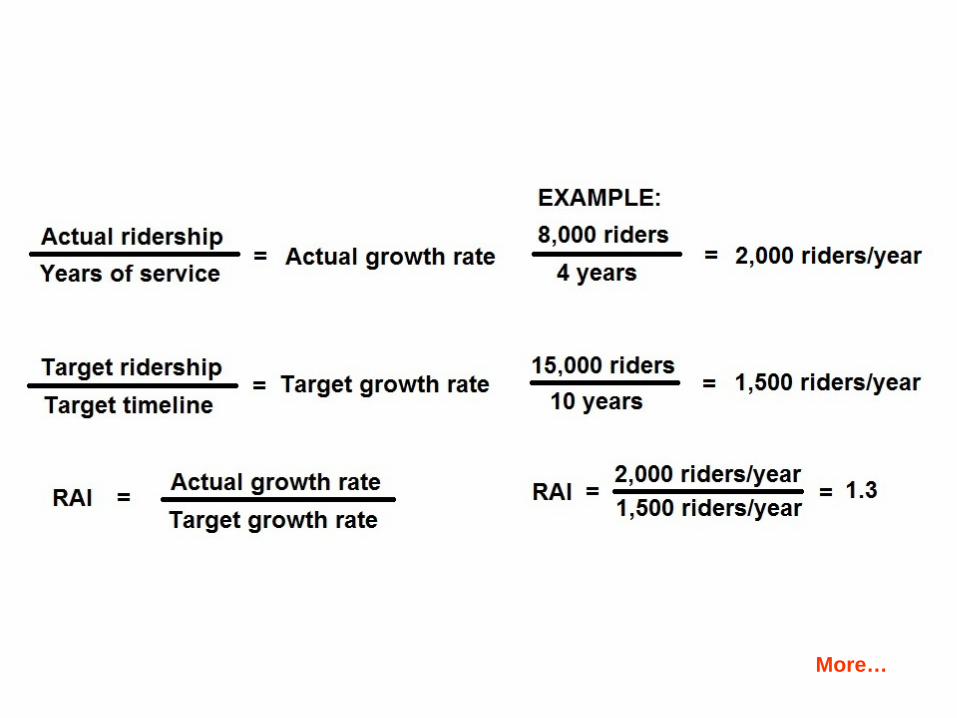
Ridership Achievement Index (RAI) • Developed to assess degree that projects with widely differing levels of investment, service, ridership, etc. meet original average daily (weekday) ridership targets, while also accounting for targets set for differing lengths of time.
• Used latest available projection (e.g., DEIS, FEIS, FFGA).
• Focuses on rate of ridership growth, beginning with first full calendar year after opening, and compares with the rate needed to achieve the initial target. More…
More…
• 1 — project meeting ridership target (good).
• >1 — project exceeding target (very good).
• <1 — project not meeting target (poor).

Cases Studied
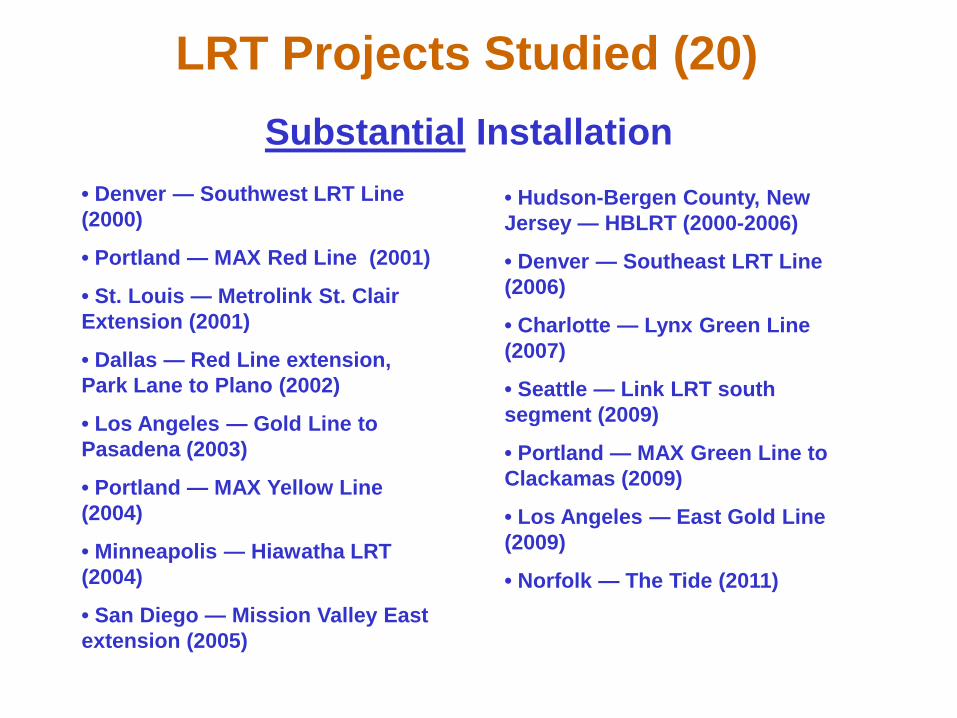
LRT Projects Studied (20)
• Denver — Southwest LRT Line (2000)
• Portland — MAX Red Line (2001)
• St. Louis — Metrolink St. Clair Extension (2001)
• Dallas — Red Line extension, Park Lane to Plano (2002)
• Los Angeles — Gold Line to Pasadena (2003)
• Portland — MAX Yellow Line (2004)
• Minneapolis — Hiawatha LRT (2004)
• San Diego — Mission Valley East extension (2005)
• Hudson-Bergen County, New Jersey — HBLRT (2000-2006)
• Denver — Southeast LRT Line (2006)
• Charlotte — Lynx Green Line (2007)
• Seattle — Link LRT south segment (2009)
• Portland — MAX Green Line to Clackamas (2009)
• Los Angeles — East Gold Line (2009)
• Norfolk — The Tide (2011)
Substantial Installation

• Portland — Portland Streetcar (2001)
• Sacramento — South LRT Line (2003)
• Houston — MetroRail (2004)
• Memphis — Madison Avenue/Medical Center streetcar extension (2004)
• Phoenix — Metro (2008)
Minimal Installation
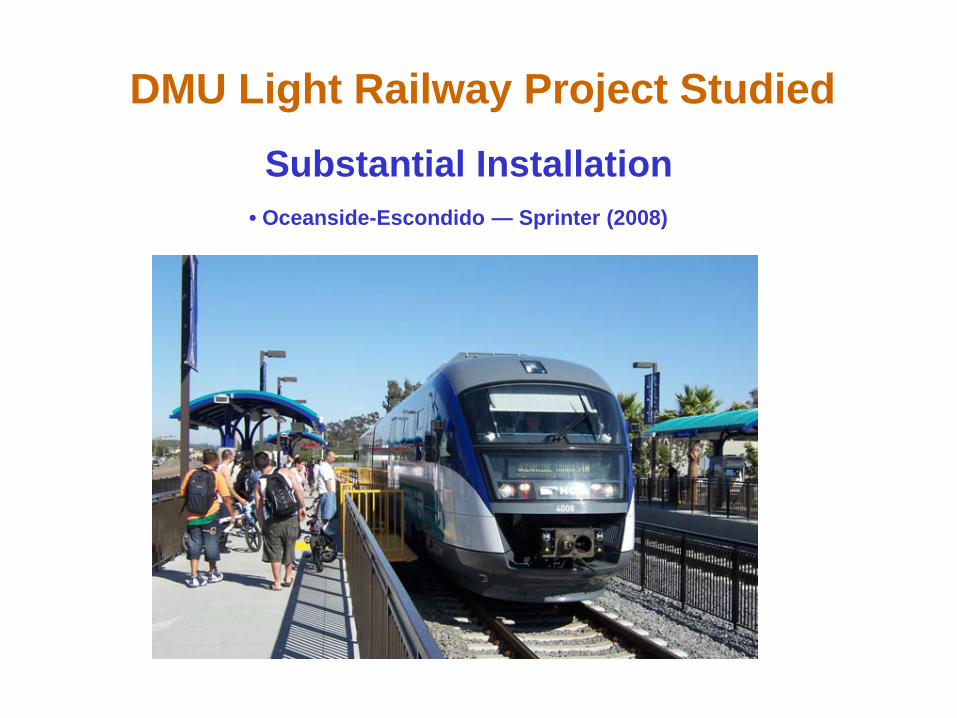
DMU Light Railway Project Studied
Substantial Installation • Oceanside-Escondido — Sprinter (2008)

BRT Projects Studied (5)
• Pittsburgh — West Busway (2000)
• Boston — Silver Line Phase II/ Piers Transitway/Waterfront tunnel (2003)
• Los Angeles — Orange Line Busway (2005)
• Eugene, Oregon — Emerald Express (2007)
• Cleveland — HealthLine/Euclid Avenue (2008)
Substantial Installation Minimal Installation

Case Examples

Final Capital Cost per Mile LRT Substantial Installation
Lowest St. Louis — Metrolink St. Clair Extension (2001)
• 17.4 miles (28.1 km)
• $339.2 million, CCR 1.05
• $28.5 million/mile ($17.6 million/km)
• Ridership: 15,976 (2002), RAI 7.1
Highest Seattle — Link LRT south segment (2009)
• 15.6 miles (25.2 km)
• $2.57 billion, CCR 1.03
• $182.6 million/mile ($113.2 million/km)
• Ridership: 26,200 (2012) RAI 2.3
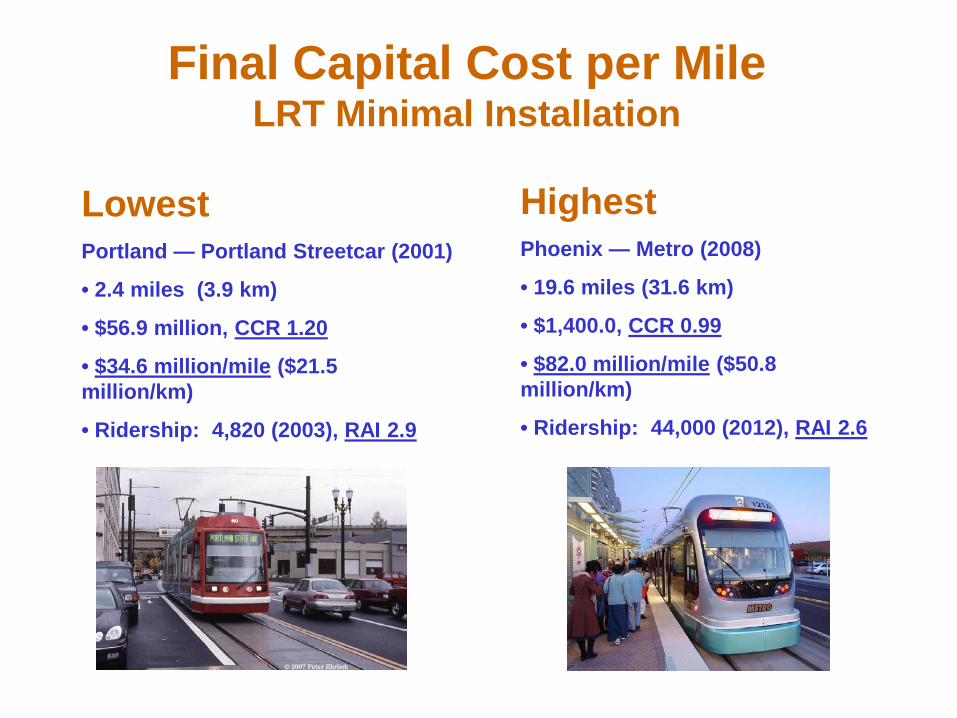
Final Capital Cost per Mile LRT Minimal Installation
Lowest Portland — Portland Streetcar (2001)
• 2.4 miles (3.9 km)
• $56.9 million, CCR 1.20
• $34.6 million/mile ($21.5 million/km)
• Ridership: 4,820 (2003), RAI 2.9
Highest Phoenix — Metro (2008)
• 19.6 miles (31.6 km)
• $1,400.0, CCR 0.99
• $82.0 million/mile ($50.8 million/km)
• Ridership: 44,000 (2012), RAI 2.6
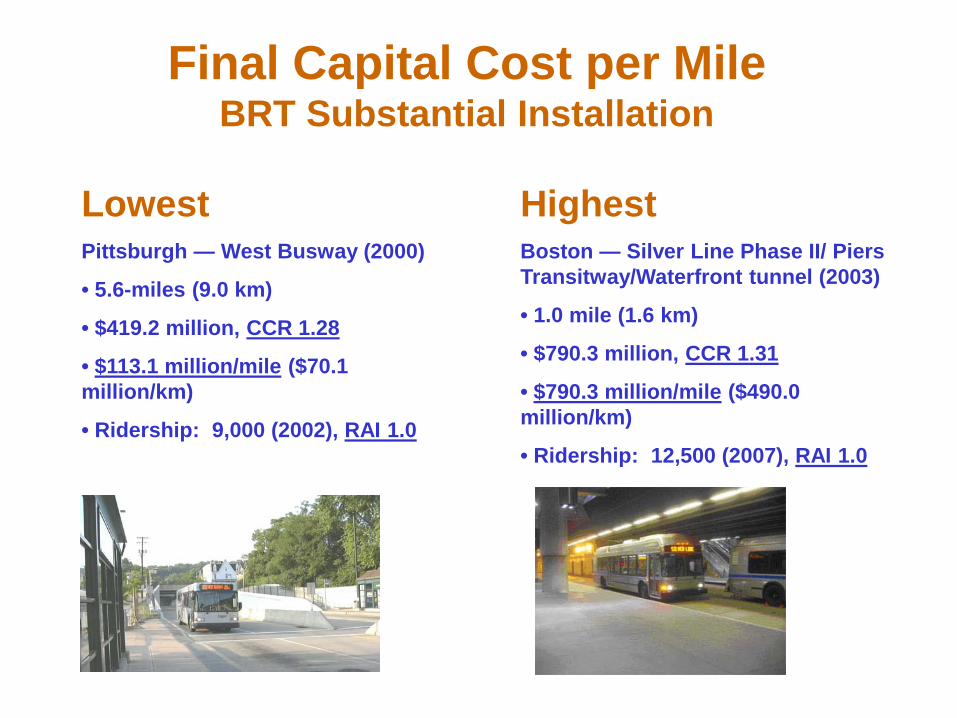
Final Capital Cost per Mile BRT Substantial Installation
Lowest Pittsburgh — West Busway (2000)
• 5.6-miles (9.0 km)
• $419.2 million, CCR 1.28
• $113.1 million/mile ($70.1 million/km)
• Ridership: 9,000 (2002), RAI 1.0
Highest Boston — Silver Line Phase II/ Piers Transitway/Waterfront tunnel (2003)
• 1.0 mile (1.6 km)
• $790.3 million, CCR 1.31
• $790.3 million/mile ($490.0 million/km)
• Ridership: 12,500 (2007), RAI 1.0

Final Capital Cost per Mile BRT Minimal Installation
Lowest Eugene, Oregon — Emerald Express (2007)
• BRT 2.5 miles (4.0 km) out of total route of 3.9 miles (6.3 km)
• $24.6 million, CCR 1.89
• $11.7 million/mile ($7.2 million/km)
• Ridership: 9,600 (2012), CCR (NA)
Highest Cleveland — HealthLine/Euclid Avenue (2008)
• BRT 4.4 miles (7.1 km) out of total route of 6.7 miles (10.8 km)
• $197.2 million, CCR 1.17
• $51.4 million/mile ($31.9 million/km)
• Ridership: 15,000 (2012), RAI 1.6

Summary Analyses
and Conclusions

• DMU light railway (Sprinter) — $25.2 mn/mile More…

• BRT projects studied did not have any particular advantage when very heavy installation (tunnels, elevated structure, etc.) was involved — BRT average capital cost per mile (km) much higher than LRT.
• DMU light railway project much lower in capital cost per mile (km) than average BRT or LRT.

• Average capital cost of "Minimal Installation" BRT projects studied were 40% lower than LRT.

• DMU light railway (Sprinter) — CCR = 1.38 More…
• Average capital cost overruns were 24% higher for BRT projects studied than for LRT.
• DMU light railway project studied had
higher overrun than LRT or BRT.
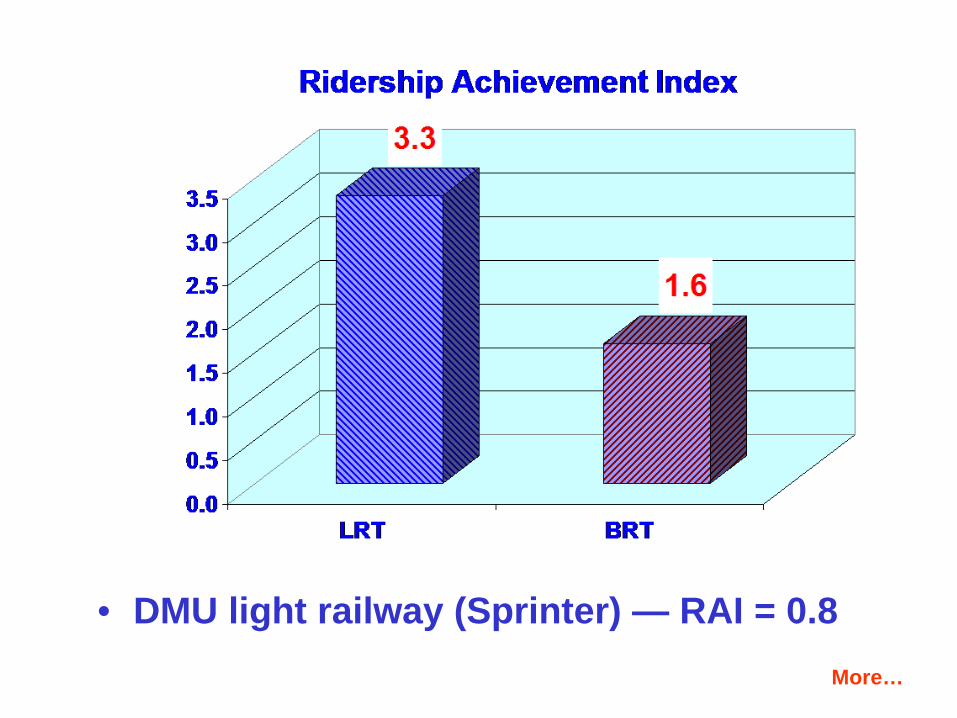
• DMU light railway (Sprinter) — RAI = 0.8 More…
• LRT projects studied met ridership targets much better (2X) than BRT projects.
• DMU light railway project studied did not meet ridership target.

Additional Conclusions
• Merely comparing gross capital cost and ridership is insufficient.
• Comparative evaluation needs to account for different economic lives of systems and rolling stock.
• Evaluation difficult because of lack of any consistent, standardized data reporting system.
• Some projects neither clearly set nor state critical goals (e.g., ridership targets), nor report key data even after project is operational.
• BRT project ridership targets (if any) are rarely publicly revealed.
• BRT project ridership and O&M costs are typically blended with systemwide bus data.
• Streetcar project ridership targets often obscured or ignored.
• LRT extension project data (e.g., ridership and O&M costs) almost never disaggregated from systemwide LRT data.

Recommendations
• FTA should mandate consistent, standard evaluatory data criteria.
• Useful elements: ridership, passenger-mileage, O&M cost (gross and per passenger-mile), and total cost (both annualized capital and O&M, gross and per passenger-mile).
• Critical evaluatory data should be made readily accessible for public scrutiny.
• All projects should establish ridership targets and report progress in meeting those targets for extended period after project completed.

Lyndon Henry Mobility Planning Associates
512.441-3014
Dave Dobbs Light Rail Now
512.282-1149
Dave Dobbs Light Rail Now