Embed Size (px)
Citation preview

A Comparative Genomic Investigation
of Fungal Genome Evolution
Jason StajichDuke University
University Program in Genetics & Genomics

Comparative Genomics
Evolutionary genomics
Evolution & Organismal
PhenotypePopulation structureEcological adaptationNiche changesPhylogeny
Model Systems
Genetic toolsGene function &
expressionRegulatory networksPathwaysMolecular & cellular
biologyDisease models
Molecular evolutionGene orderGene familiesGene and genome
structureGene contentConserved elementsRates of molecular
evolution

Power of the comparative approach
A B A B C D E
??

Industrial uses of fungi
• Bread, beer, wine - Saccharomyces cerevisiae
• Sake and soy sauce - Aspergillus oryzae
• Dairy - Penicillium roqueforti, Kluyveromyces lactis
• Citric acid - Aspergillus niger
• Riboflavin - Ashbya gossypii
• Stonewashed jeans - Trichoderma reesei
• Penicillin antibiotic - Penicillium notatum

Agricultural impact of fungi
• Two-thirds of plant disease is caused by fungi
• Wheat blight (Fusarium)
• Strawberry grey mold (Botrytis)
• Leaf rusts (Puccinia)
• Wheat and maize smuts (Ustilago).
• Also deposit mycotoxins - e.g. ergot
• Mycorrhizal fungi provide nutrient exchange and nitrogen fixation
www.gov.mb.ca
USDA A.G. Bölker

Impact of fungi on human health
• Biggest risk for immunocompromised individuals
• Primary pathogens
• Histoplasma, Coccidioides, Cryptococcus gattii
• Opportunistic pathogens
• Candida albicans, Aspergillus fumigatus, Cryptococcus neoformans, Rhizopus oryzae
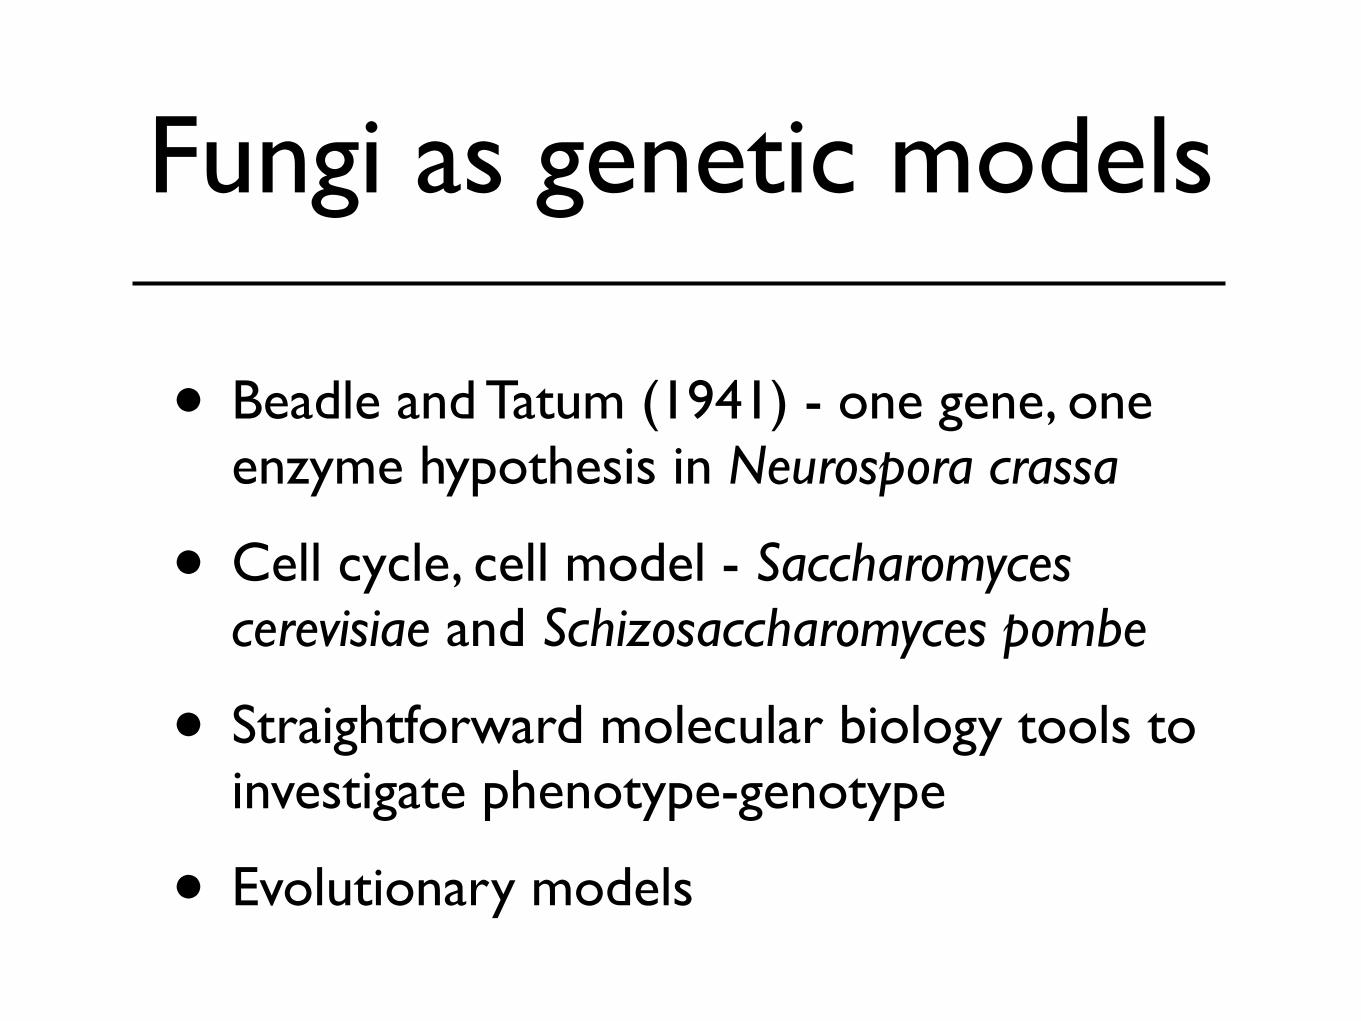
Fungi as genetic models
• Beadle and Tatum (1941) - one gene, one enzyme hypothesis in Neurospora crassa
• Cell cycle, cell model - Saccharomyces cerevisiae and Schizosaccharomyces pombe
• Straightforward molecular biology tools to investigate phenotype-genotype
• Evolutionary models

Fungal genomes
• Smaller than most vertebrate and plant genomes
• A. gossypii 8.5 Mb, S. cerevisiae 12 Mb
• N. crassa 40 Mb
• Animals: 100 Mb worm, 3000 Mb Human
• Vary in protein coding gene content
• 4700 in A. gossypii, 5800 in S. cerevisiae
• 16,000 in R. oryzae or S. nodorum
• 19,000 in Fruitfly, 25,000 in worm

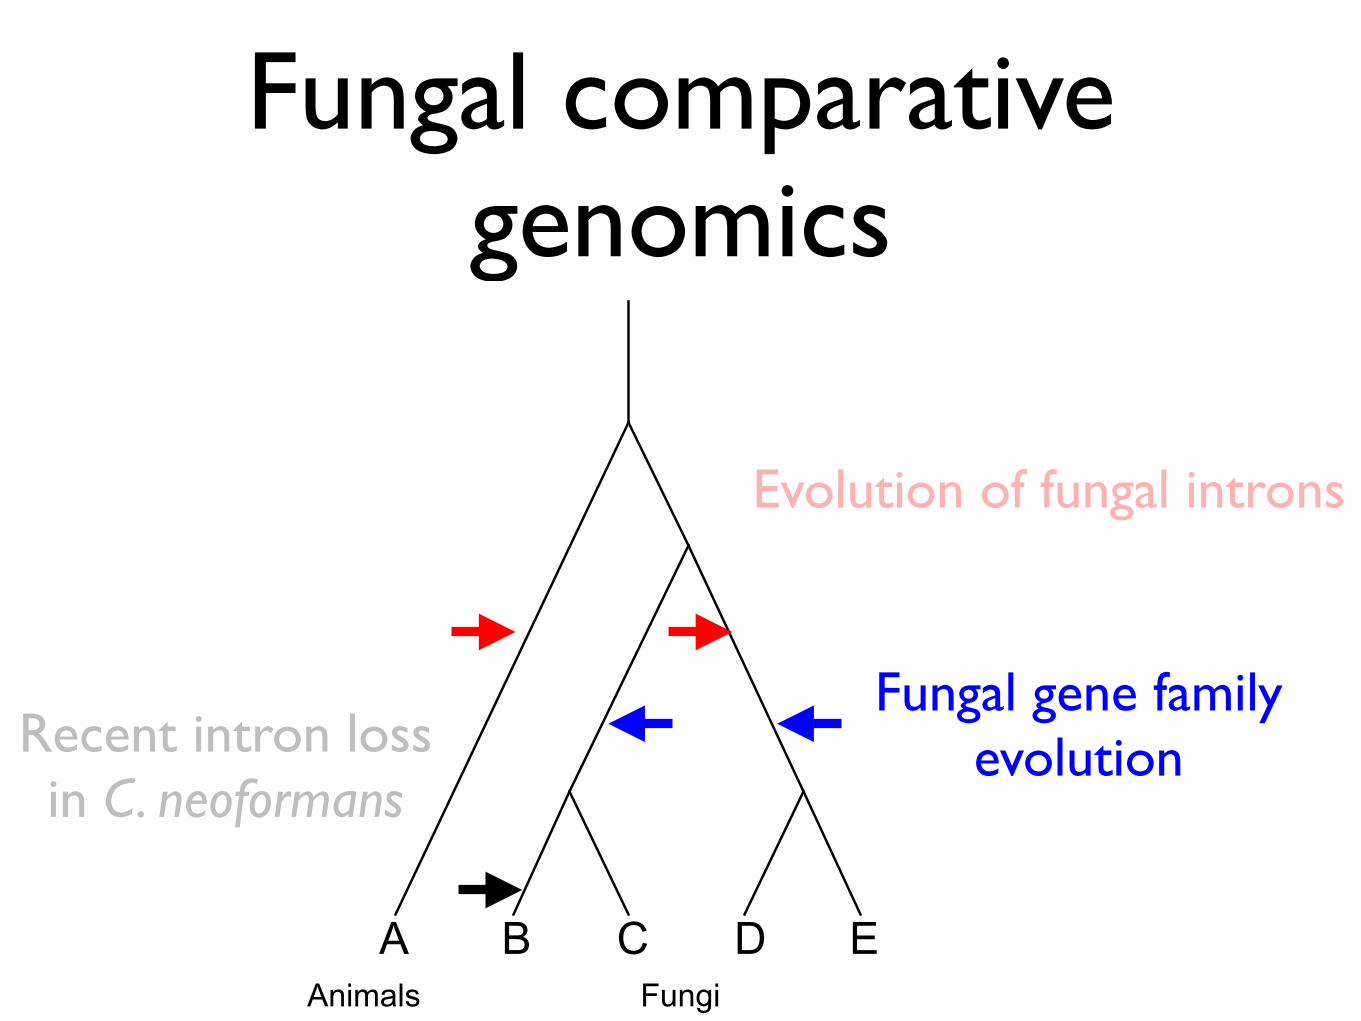
Fungal comparative genomics
A B C D E
Recent Intron Lossin C.neoformans
Evolution of fungal introns
Animals Fungi
Fungal gene family evolution

Central dogma of eukaryotic biology
Introns
splicing to form mRNA
Genomic DNA
Ribosome
Protein
mRNA
mRNA
ExonExonExonIn
tro
n
pre-mRNA
Genomic DNA
Protein
Intr
on

Orthologs and Paralogs
Speciation
Gene
Duplication
Tim
e
Paralogs
V W
V
U
Orthologs
A
A A
A1 A2

Genome annotation
• Many of the fungal genomes were only assembled genomic sequence.
• Automated annotation pipeline was built to generate to get systematic gene prediction.
• Several gene prediction programs were trained and results were combined to produce composite gene calls

SNAPTwinscan
GlimmerGenscan
ZFF to GFF3
GFF2 to GFF3
Tools::Genscan
Tools::Glimmer
BLASTZBLASTN
SearchIO
Bio:
:DB:
:GFF
HMMER
GFF to AA
Genome
Proteins
predicted proteins
SearchIO
ProteinsFASTAall-vs-all
exonerateprotein2genome
GFF2 to GFF3
Findorthologs
protein to genome
coordinates
GLEAN(combiner)
Tools::GFF
exonerateest2genome
ESTs
SearchIO
MCL
Gene families
Rfam tRNAscan
Multiple sequence alignment
Intron mapping into
alignmentIntron analysis
Bio::AlignIOaa2cds alignment
AnalysisMethodology
http://fungal.genome.duke.edu

Fungal comparative genomics
A B C D E
Recent intron lossin C. neoformans
Evolution of fungal introns
Animals Fungi
Fungal gene family evolution

Evolution of gene structure
• Present day introns
• Recent insertions?
• Introns late hypothesis
• Formed in eukaryotic ancestor?
• Introns early hypothesis / exon theory of genes
• Mixture of two?
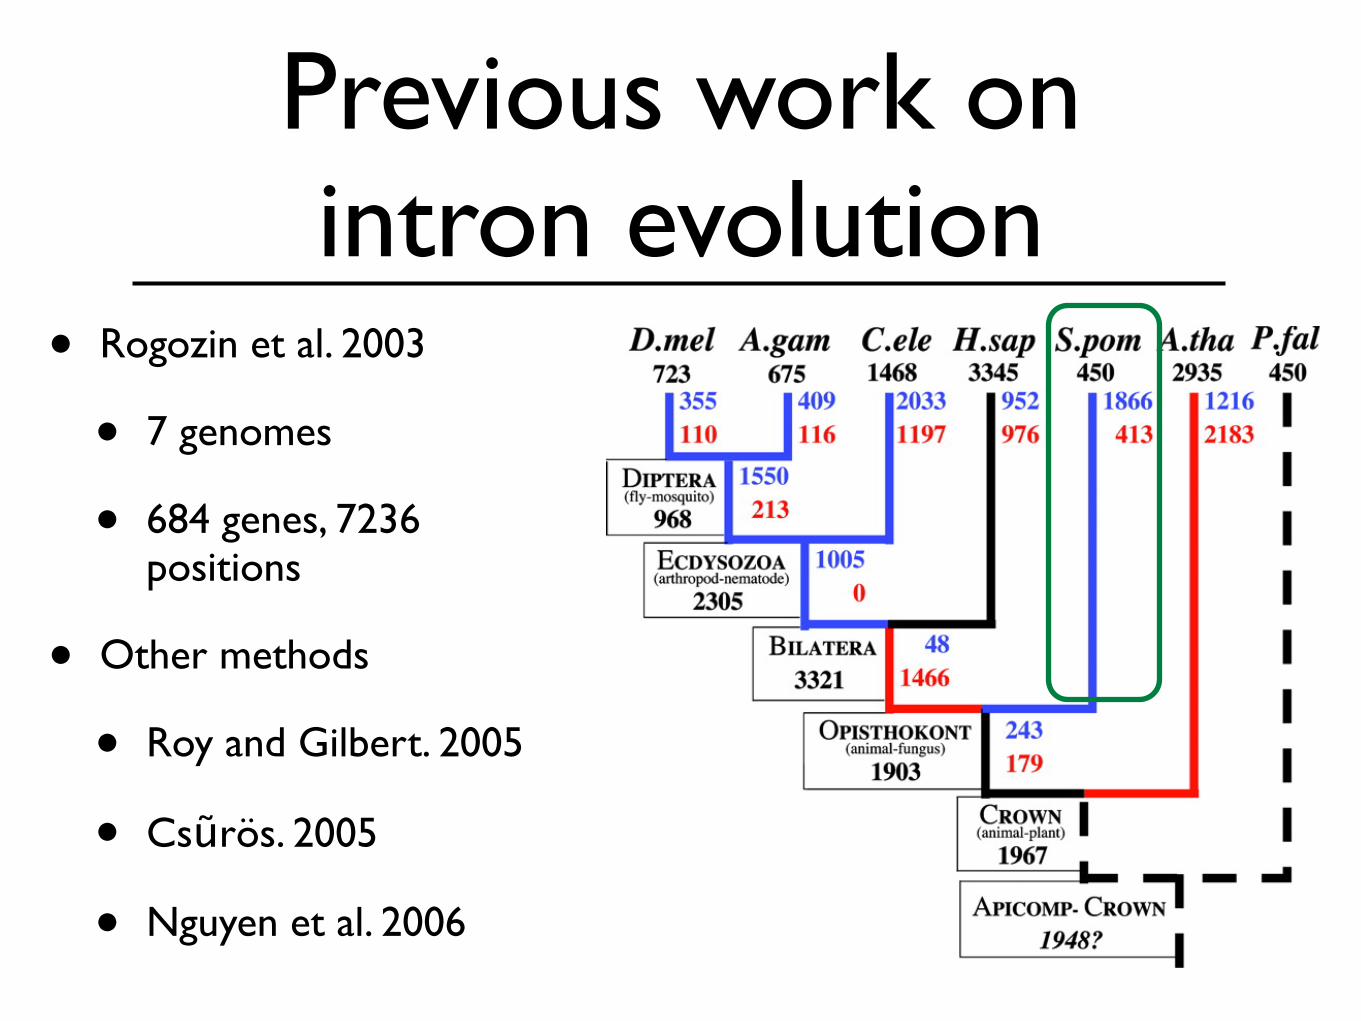
Previous work on intron evolution
• Rogozin et al. 2003
• 7 genomes
• 684 genes, 7236 positions
• Other methods
• Roy and Gilbert. 2005
• Csũrös. 2005
• Nguyen et al. 2006

Calculating intron densities across a phylogeny
Basidiomycota
Archiascomycota
Hemiascomycota
Euascomycota
Opisthokont
Vertebrates
Plants
Zygomycota
Chaetomium globosum (463)Neurospora crassa (336)
Podospora anserina (359)Magnaporthe grisea (368)
Fusarium graminearum (372)Aspergillus fumigatus (481)Aspergillus terreus (474)Aspergillus nidulans (469)
Stagonospora nodorum (403)Saccharomyces cerevisiae (7)Candida glabrata (6)
Kluyveromyces lactis (6)Ashbya gossypii (7)
Debaryomyces hansenii (5)Yarrowia lipolytica (30)
Schizosaccharomyces pombe (214)Phanerochaete chrysosporium (1615)Coprinus cinereus (1621)
Cryptococcus neoformans (1578)Ustilago maydis (86)
Rhizopus oryzae (947)Mus musculus (2658)Homo sapiens (2737)Fugu rubripes (2687)
Arabidopsis thaliana (2290)
0.1 substitutions

Intron frequency varies among the fungi
1 2 3 4 5 60
100
200
300
400
500
Mean Introns per gene
Me
an
In
tro
n le
ng
th
Rory
Umay
SpomCneo
PchrCcin
Cgla
Klac
Ylip
Scer
Dhan
Agos
Pans

Analysis of whole genomes
• 25 entire genomes
• 21 fungi, 3 vertebrates, 1 plant
• Largest dataset ever assembled for intron analysis
• 1160 orthologous genes
• 7533 intron positions
• 4.15 Mb coding sequence (CDS) per genome

7533 intron positions
25 s
peci
es
predicted proteins
Proteins
FASTAall-vs-all
Findorthologs
Multiple sequence alignment
Intron mapping into
alignmentIntron analysis
Analysis Methods

ATG GTG CGT ACA
Intron phase
ATG GT G CGT ACA
ATG G TG CGT ACA
phase 0
phase 1
phase 2
exon exonintron
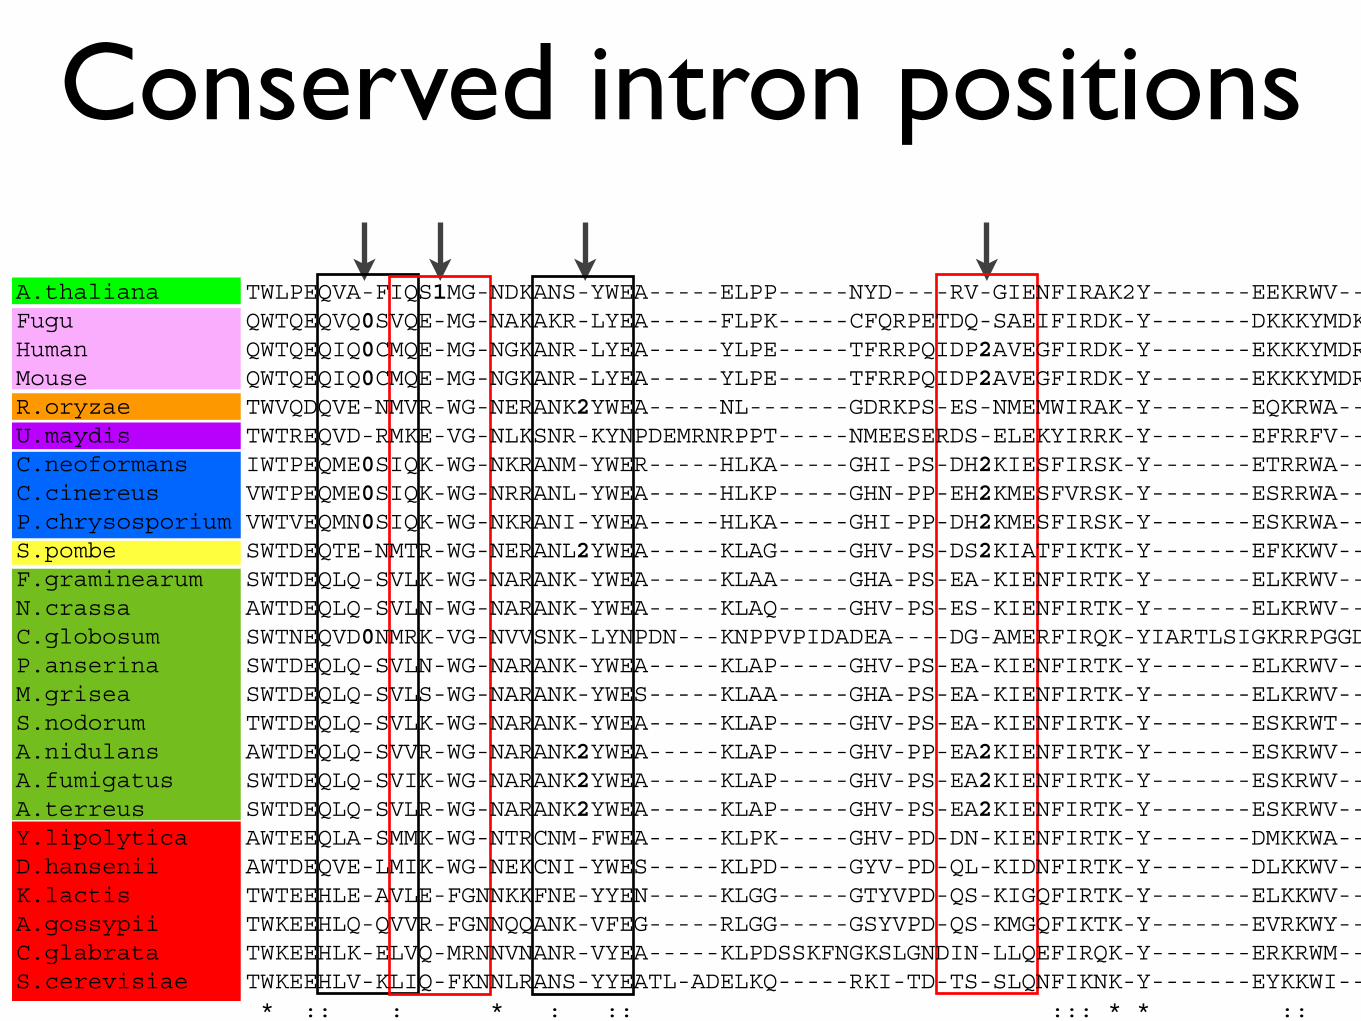
Conserved intron positions
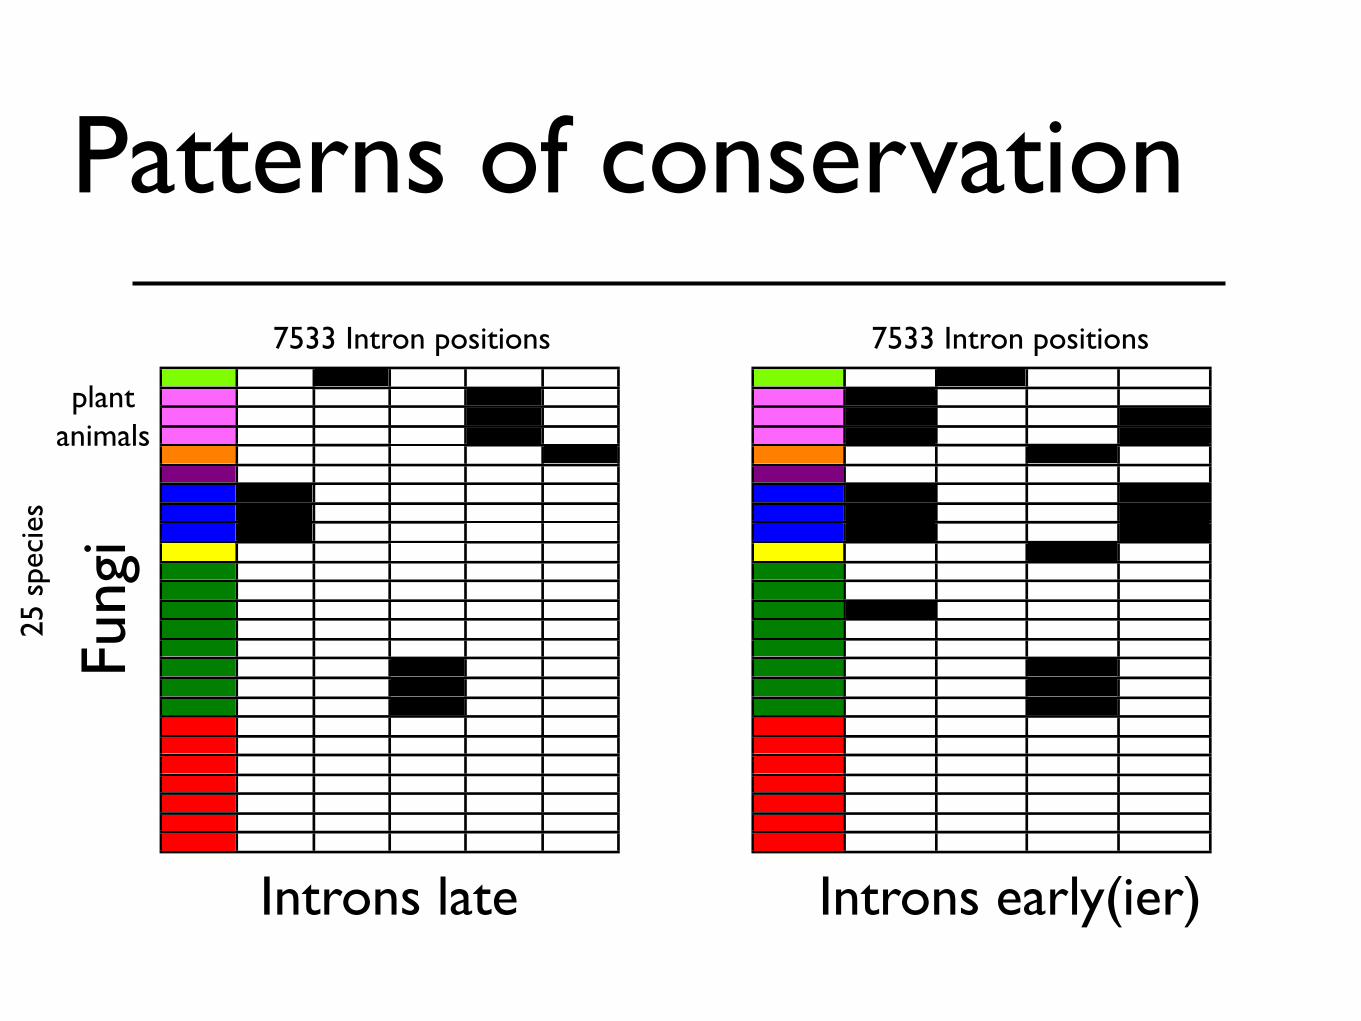
Patterns of conservation
Introns late Introns early(ier)
7533 Intron positions 7533 Intron positions
25 s
peci
es
animalsplant
Fung
i

Intron positions shared with animals or plants
S.
ce
revis
iae
Y.
lipo
lytica
F.
gra
min
ea
rum
M.
grise
a
P.
an
se
rin
a
N.
cra
ssa
C.
glo
bo
su
m
A.
nid
ula
ns
A.
terr
eu
s
A.
fum
iga
tus
S.
no
do
rum
R.
ory
za
e
U.
ma
yd
is
C.
ne
ofo
rma
ns
C.
cin
ere
us
P.
ch
ryso
sp
oriu
m
S.
po
mb
e
C.
gla
bra
ta
A.
go
ssyp
ii
K.
lactis
D.
ha
nse
nii
Percentage
45
40
35
30
25
20
15
10
5
0

Phylogenetic signal in intron positions
afum
ater
anid
snod
cglo
ncra
pans
mgri
fgra
agos
klac
cgla
scer
dhan
ylip
spom
ccin
pchr
cneo
umay
rory
frub
hsap
mmus
atha
afum
ater
anid
cglo
pans
ncra
fgra
mgri
snod
agos
cgla
klac
dhan
scer
ylip
umay
spom
ccin
pchr
cneo
rory
frub
hsap
mmus
atha
Strict consensus tree of16 parsimonious trees using
dollo parsimony based on 7533 intron positionsMaximum Likelihood tree based on alignment of 30 proteins
Species Tree30 proteins
Parsimony reconstruc
tion

Intron position reconstruction
• 3 Methods
• Roy and Gilbert. 2005
• Csũrös. 2005
• Nguyen et al. 2006
• Methods agree for all but 2 nodes in tree

Reconstruction of ancestral intron densities
A.
tha
lian
a
R.
ory
za
e
U.
ma
yd
is
C.
ne
ofo
rma
ns
C.
cin
ere
us
P.
ch
ryso
sp
oriu
m
S.
po
mb
e
So
rda
rio
myce
tes
Eu
rotio
myce
tes
+
S.
no
dsu
m
Y.
lipo
lytica
Sa
cch
aro
myce
s
Ve
rte
bra
tes
5.51 6.61 2.28 0.21 3.80 3.89 3.90 0.52 0.89 1.12 0.07 0.02
1.20
3.55
3.55
4.01 0.07
1.50
2.20
3.50
3.72
4.674.67 Introns
per kb of CDS
Exon length of 214 bp

Conclusions
• Early eukaryotic crown genes were complex!
• Ancestor had 70% of the introns in vertebrates
• More introns than previously reported
• Intron loss has dominated among the fungi
• Hemiascomycota experienced loss
• Sampling can bias interpretations - all fungi are not equal.

Fungal comparative genomics
A B C D E
Recent intron lossin C. neoformans
Evolution of fungal introns
Animals Fungi
Fungal gene family evolution

Mechanism of intron loss
• S. cerevisiae and Hemiascomycota have undergone intron loss.
• How are introns lost from the genome?
• Are they lost independently?
• Are they lost many at a time?
• Molecular mechanism of loss

Models of intron loss
• All introns in S. cerevisiae are in 5’ end of gene
• G. Fink proposed transcripts recombine with genome 3’ -> 5’ explaining 5’ retention bias.
• In S. cerevisiae most intron loss events occurred too long ago so little evidence supporting any mechanism

Sequenced Cryptococcus genomes
0.1
C. gattii, strain WM276
C. gattii, strain R265
C. neoformans var. neoformans, strain JEC21
C. neoformans var. grubii, strain H99
substitutions

Screen for intron changes
• Annotate 3 Cryptococcus genomes (var. grubii and 2 var. gattii genomes)
• Identify and align 4-way orthologous genes
• 5298 orthologous genes (out of ~6500)
• Identify intron position changes
Stajich and Dietrich. Euk Cell In press.
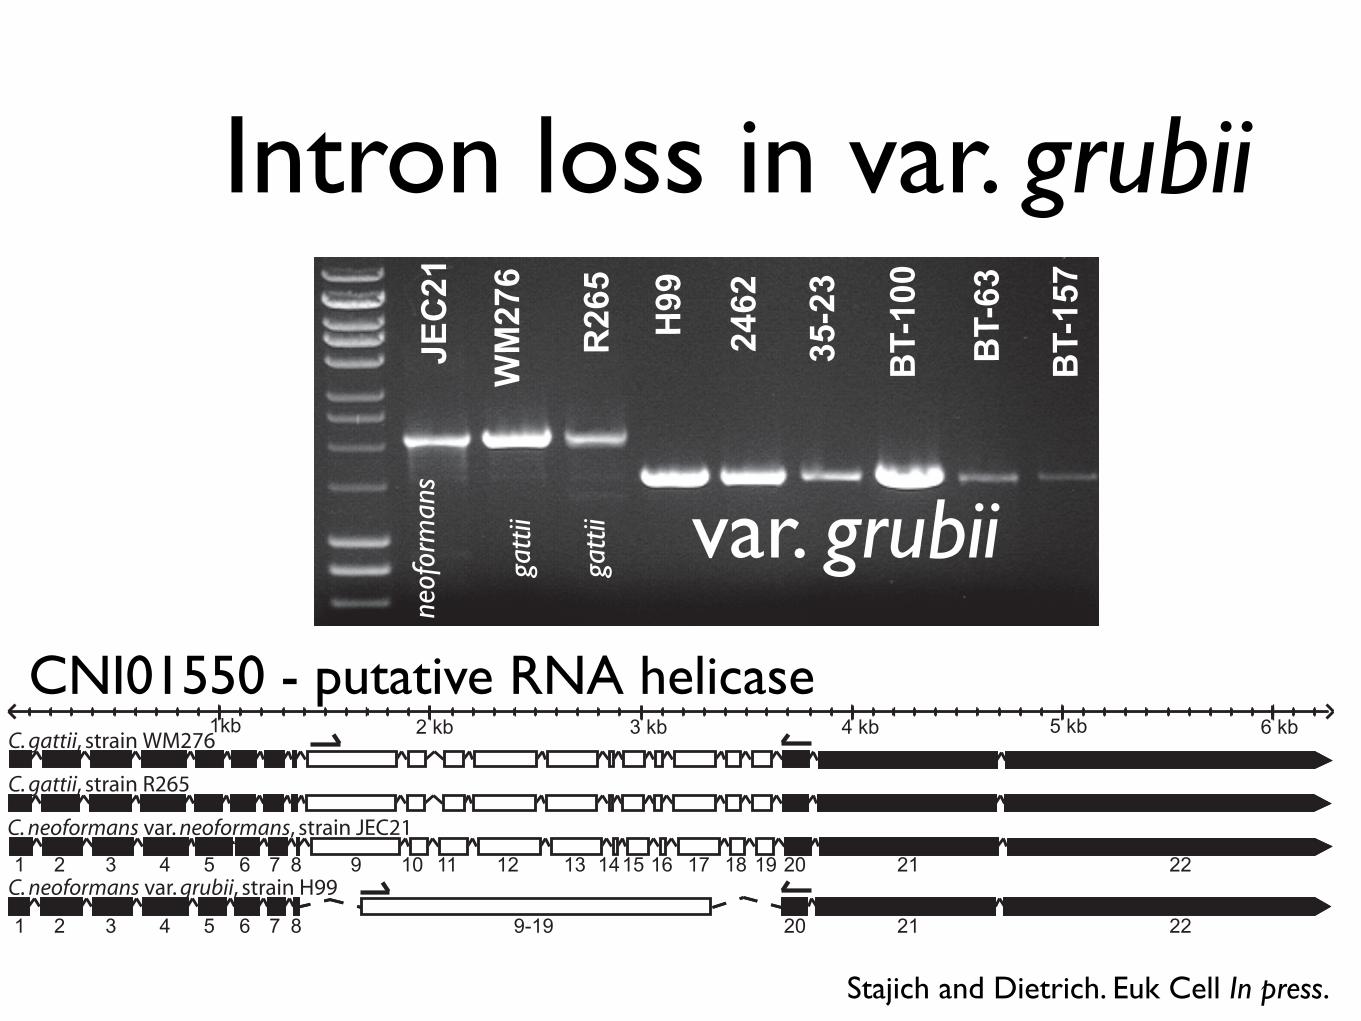
Intron loss in var. grubii
0.1
1kb 2 kb 3 kb 4 kb 5 kb 6 kb
JEC21
WM276
R265
H99
2462
35-23
BT-100
BT-63
BT-157C. gattii, strain WM276
C. gattii, strain R265
C. neoformans var. neoformans, strain JEC21
C. neoformans var. grubii, strain H99
A
B
C
1 2 3 4 5 6 7 8 9-19
1 2 3 4 5 6 7 8 9 10 11 12 13 1415 16 17 18 19 20 21 22
20 21 22
Stajich and Dietrich. Euk Cell In press.
CNI01550 - putative RNA helicase
var. grubii
neof
orm
ans
gatti
i
gatti
i
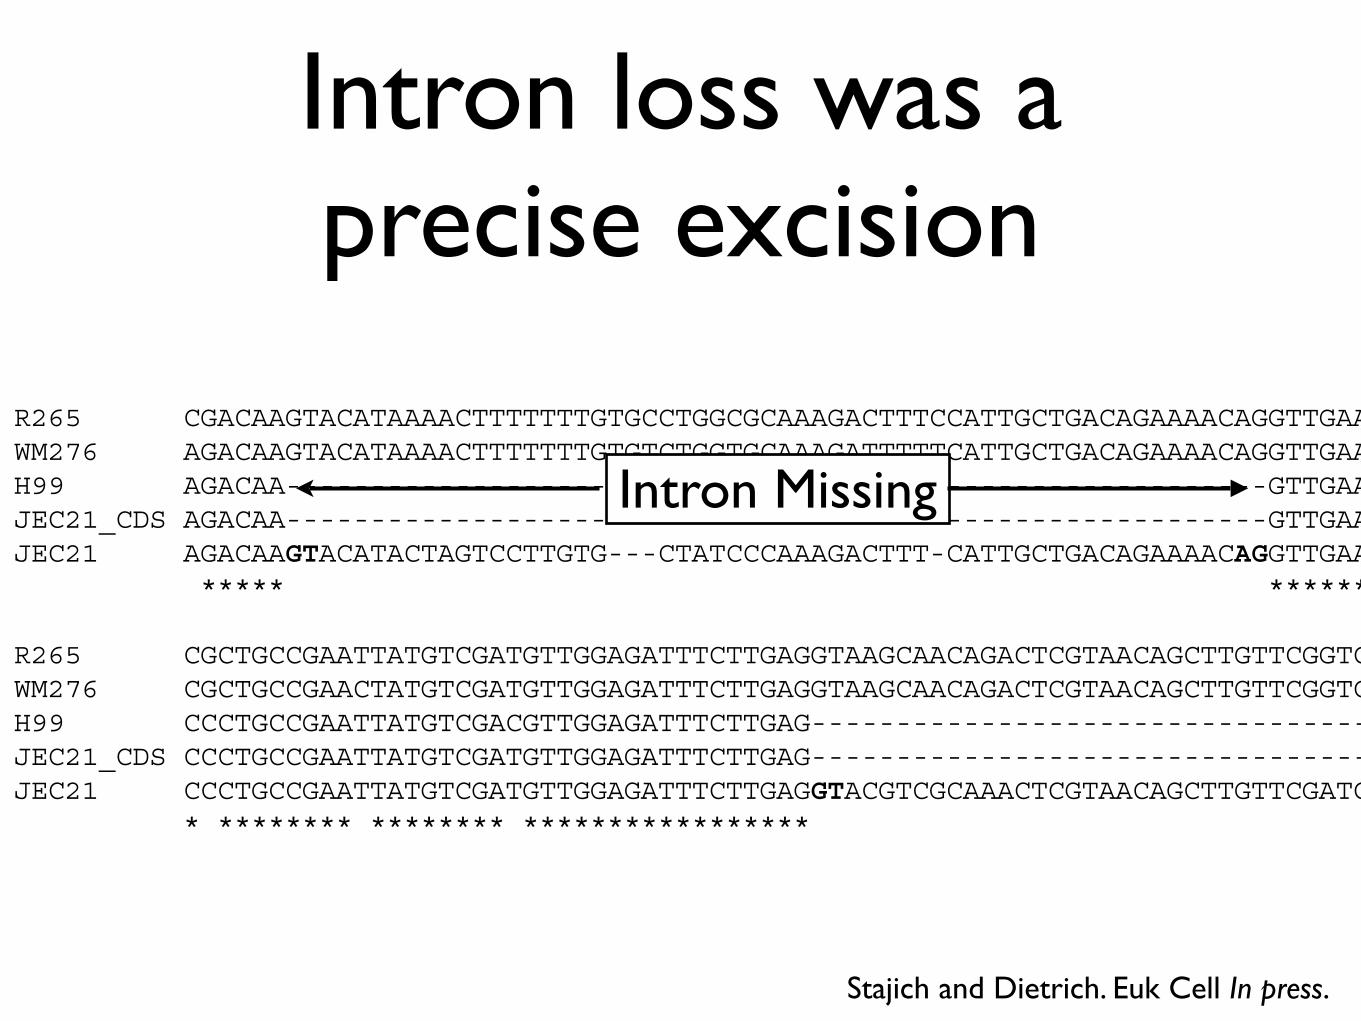
Intron loss was a precise excision
Intron Missing
Stajich and Dietrich. Euk Cell In press.

Other examples of loss
PRP8 homolog (Splicing)
1,3 beta-glucan synthase (cell wall)
Ubiquitin protein ligase (protein degradation)
Stajich and Dietrich. Euk Cell In press.
CNN02320/FKS1A
5 61 2 3 4 7 8 9 10 11 12
3-7 8 9 10 11 121 2
JEC21
R265
WM276
H99
CNG04610
3 4
5.1 5.2 6
C
JEC21
R265
WM276
H99
3 4
65
CNA01350
5 6
1 2 3 4-6 7 8 9 10 11 12 13 14 15
B
JEC21
R265
WM276
H991 2 3 4 7 8 9 10 11 12 13 14 15
LOSS
LOSS
GAIN

Conclusions
• Intron loss via homologous recombination with spliced transcript
• Large losses are all adjacent introns
• Precise deletion
• Loss biased towards the middle of gene not 3’
Fungal comparative genomics
A B C D E
Recent intron lossin C. neoformans
Evolution of fungal introns
Animals Fungi
Fungal gene family evolution

Gene family evolution
• Gene families are the crucible of new genes and thus new functions
• Signature of adaptive evolution often confounded in multi-gene families
• Can we identify families that are have unexpectedly large changes in size across a phylogeny?
• Follow up these families with more focused studies

Identifying family expansions
• Previous work only considered pairwise
• Ad hoc comparison of gene family sizes
• C.elegans-C.briggsae - GPCR family expansions (Stein et al, PLOS Biology 2004)
• A. gambiae-D. melanogaster - Mosquito specific family expansions related to symbiotic bacteria (Holt et el, Science 2002).

Gene family sizes follow power law distribution
N.crassaA.gossypiiR.oryzaeA.oryzaeA.terreusC.cinereusU.maydis
101
1
10
100
1000
10000
100
Family size
Fre
quency o
f F
am
ily s
ize
Multicopy genesSugar transporters
P450 Enzymes
single copy genesPRP8 (splicing)
CDC48 (cell cycle ATPase)

Fully sequenced fungal genomesRhizopus oryazeNeurospora crassaPodospora anserinaChaetomium globosumMagnaporthe griseaFusarium verticillioidesFusarium graminearumTrichoderma reeseiSclerotinia sclerotiorumBotrytis cinereaStagonospora nodorumUncinocarpus reesiiCoccidioides immitisHistoplasma capsulatumAspergillus fumigatusAspergillus nidulansAspergillus terreusAspergillus oryzaeAshbya gosspyiiKluyveromyces lactisSaccharomyces cerevisiaeCandida glabrataCandida lusitaniaeDebaryomyces hanseniiCandida guilliermondiiCandida tropicalisCandida albicansCandida dubliniensisYarrowia lipolyticaSchizosaccharomyces pombeCryptococcus neoformansCryptococcus neoformans H99Cryptococcus gattii WM276Cryptococcus gattii R265Phanerochaete chrysosporiumCoprinus cinereusUstilago maydis
Saprophyte
Bread mold, Opp Hum pathogen
Saprophyte
Hemibiotroph - Rice
Hemibiotroph - wheat
Primary Hum pathogen
Primary Hum pathogen
Opp Hum pathogen
Saprophyte/Industrial uses
Hemibiotroph - maize
Saprophyte
Necrotroph
Necrotroph - fruits
Hemibiotroph - wheat
Opp Hum pathogen
Biotroph/Industrial uses
Industrial uses
Industrial uses
Opp Hum pathogen
Opp Hum pathogen
Opp Hum pathogen
Opp Hum pathogen
Opp Hum pathogen
Opp Hum pathogenSaprophyte
SaprophyteBiotroph - maize
Opp Hum pathogen
Opp Hum pathogen
Opp HumOpp Hum pathogen
Industrial uses
SaprophyteOpp Hum Pathogen
Saprophyte
pathogen
0100200300400500600700800900Million
years ago
Euascomycota
Zygomycota
Hemiascomycota
Archiascomycota
Basidiomycota

Phylogenetic evaluation of gene family size change• Previous methods only used ad hoc
statistics
• Explicit model for gene family size change according to a Birth-Death models
• Apply BD to family size along phylogeny using probabilistic graph models
• CAFE - Computational Analysis of gene Family Evolution Hahn et al, Genome Res 2005
De Bie, et al Bioinformatics 2006Demuth et al, submitted

A B C D E
FASTAall-vs-all
MCL
Gene families
CAFE
18 U. maydis
5 C. gattii R265
5 C. gattii WM276
5 gattii
5 C. neoformans JEC21
5 C. neoformans var grubii
5 neoformans
5 Cryptococcus
163 P. chrysosporium
141 C.cinereus
136 Homobasidiomycota
23 Hymenomycota
23 Basidiomycota
0100200300400
Family 1 P < 0.001 Branch A
Family 2 P < 0.001 Branch B
Family 3 P=0.02 Branch C,E
Family 4 P=0.03 Branch D
10 1 2
14 18 2
7 1 1
6 1 12
6 1 8
3 1 1+
Family count
Spec
ies

Families with significant expansionsVitamin & Cofactor transport
Lactose & sugar transport
Amine transport
Myo-instol, quinate, and glucose transport
Oligopeptide transport
ABC transporter
MFS, drug pump, & sugar transport
Transport
Monocarboxylate & sugar transport
ABC transport
Amino acid permease
Methytransferase
Cytochrome P450: CYP64
Cytochrome P450: CYP53,57A
Cytochrome P450
Kinase
Subtilase family
NADH flavin oxidoreductase
Aldehyde dehydrogenase
Aldo/kedo reductase
Multicopper oxidase
AMP-binding enzyme
TransportersKinasesP450
Oxidation

Transporters
• Of 45 significant families, 22 were related to transport
• Vitamin and amino acid transport
• Sugar and sugar-like transporters
• Multidrug and efflux pumps
• ABC transporters (ATP Binding Cassette)

Branches with transporter expansions
• Sugar related, Drug pump, and MFS
• Aspergillus spp, Fusarium spp, S. nodorum
• Euascomycota
• Vitamin transport
• C.neoformans, Fusarium
• A. nidulans (Biotin)
Aspergillus
Fusarium
S. nodorum
C. neoformans
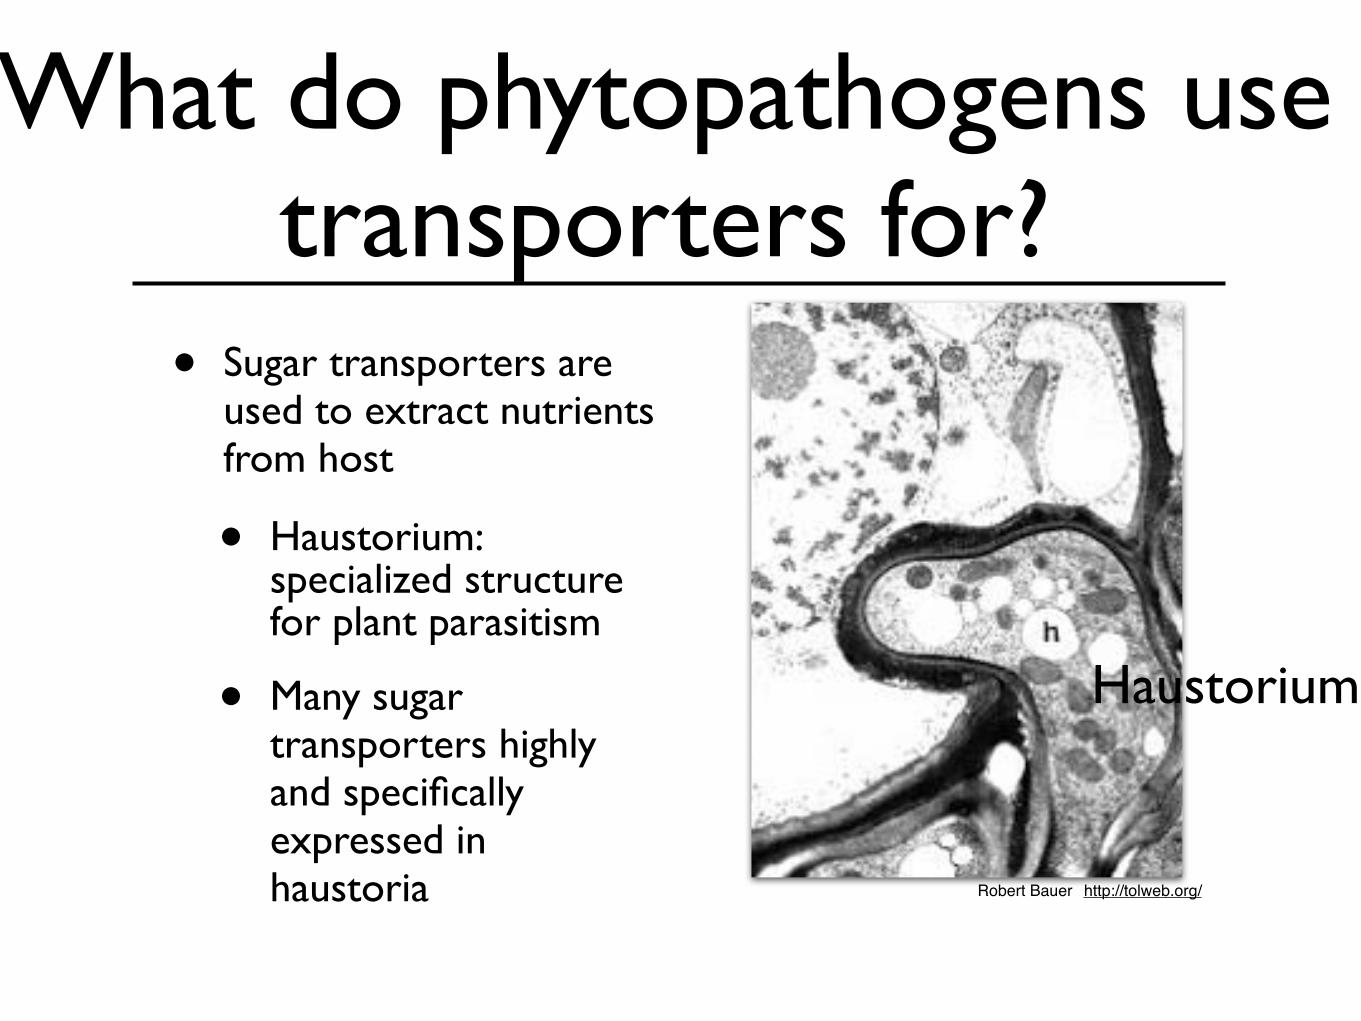
What do phytopathogens use transporters for?
• Sugar transporters are used to extract nutrients from host
• Haustorium: specialized structure for plant parasitism
• Many sugar transporters highly and specifically expressed in haustoria
Haustorium
http://tolweb.org/Robert Bauer

FIG
.1.
The
exte
rnal
and
inte
rnal
stru
ctur
esof
C.n
eofo
rman
sar
esh
own
bym
eans
ofa
mod
ified
Indi
ain
kpr
epar
atio
n.M
agni
ficat
ion,
ca.!
1,00
0.
Con
tinue
dfro
mpr
eced
ing
page
2291
Cryptococcus sugar transporters
• 3x as many sugar transporters in C. neoformans than other basidiomycetes
• “sugar coated killer”
• Capsule is mixture of glucose, xylose, and mannose.
Zerpa et al, 1996

P450 CYP64
18 U. maydis
5 C. gattii R265
5 C. gattii WM276
5 gattii
5 C. neoformans JEC21
5 C. neoformans var grubii
5 neoformans
5 Cryptococcus
163 P. chrysosporium
141 C.cinereus
136 Homobasidiomycota
23 Hymenomycota
23 Basidiomycota
0100200300400
P450 enzymes involved in synthesis and cleavage of chemical bonds. Drug metabolism in animals.
CYP64: Step in Aspergillus spp aflatoxin pathwayP. chrysosporium implicated in lignin and hydrocarbon degradation.
Million yearsago

CYP64 was from independent duplication
ccin
03995 ccin
12432
ccin
12477
ccin
12447
ccin
03760 ccin
08843
ccin
08880
ccin
08948
ccin
08949
ccin
09228
ccin
08947
ccin
08946
ccin
12431
ccin
12515
ccin
08608
ccin
12514
ccin
07535
ccin
07536
ccin
05141
ccin
07531
ccin
04462
ccin
04461
ccin
04460
ccin
07538
ccin
01326
ccin
04884
ccin
07555
ccin
07554
ccin
03994
ccin
12516
ccin
09337
ccin
09357
ccin
09950
ccin
00042
ccin
00039
ccin
00043
ccin
11079
ccin
11073
ccin
12301
ccin
03618
ccin
12868
ccin
12386
ccin
03622
ccin
09244
ccin
08520
ccin
10950
ccin
13218
ccin
13220
pchr
04215
pchr
02481
pchr
02475
pchr
02324
pchr
02322
pchr
02461
pchr
02249
pchr
02248
pchr
02471
pchr
02460
pchr
02469
pchr
02472
pchr
02470
pchr
02468
pchr
02462
pchr
02442
pchr
02441
pchr
02317
pchr
02473
pchr
02477
pchr
02480
pchr
02479
pchr
02474
pchr
02459
pchr
02478
pchr
09197
pchr
08602
pchr
02326
pchr
08048
pchr
08046
pchr
08045
pchr
08047
pchr
02328
pchr
06733
tree 1
6195
pchr
10861
pchr
07430
pchr
07443
C. cinereus expansionP. chrysosporium
expansion
Tom VolkMario Cervini

Local duplications created CYP64 expansion
9k 10k 11k 12k 13k 14k 15k 16k 17k 18k 19k 20k 21k 22k 23k 24k
pchr_24pchr_24
GLEAN modelsGLEAN_02414
Probability 1
GLEAN_02415
Probability 0.999937
GLEAN_02416
Probability 0.646357
GLEAN_02417
Probability 0.990598
Pfam domainsp450
Cytochrome P450 evalue:1e-28
p450 p450
Cytochrome P450 evalue:9e-07
p450p450
Cytochrome P450 evalue:6.3e-23
p450p450
Cytochrome P450 evalue:6e-26
p450
http://fungal.genome.duke.edu

Family size contractions
• Histoplasma, Coccidioides many families
• Hemiascomycetes - P450
• C. neoformans - P450
• U. maydis - Lactose transport

Conclusions
• Sugar transporters are highly expanded in independent lineages
• Saprophytic and phytopathogenic lifestyles
• P450 CYP64 independent expansions in Homobasidiomycetes
• Lignin degradation and saprophytic lifestyles
• Family size contractions among lineages containing primary pathogens
• Genome streamlining?

Overall conclusions
• Multiple genome sequences have helped resolve several outstanding questions in evolution introns
• Gene family expansions can be important in identifying molecular basis for adaptation

Future directions
• UC Berkeley with John Taylor
• Adaptation and speciation in fungi
• Focus on pathogenic fungus Coccidioides
• Signatures of adaptation among genomes of 12 sequenced strains

AcknowledgmentsFred DietrichGreg Wray
Lincoln SteinJohn McCuskerAlex Hartemink
Joseph HeitmanMarcy Uyenoyama
Rytas VilglyasTim JamesPat Pukkilla
Robert CramerJames FraserSteven GilesAlex IdnurmScott Roy
Dave Des MaraisHeath O’BrienMatt Rockman
MDGDietrich LabAndria Allen
Stephanie DiezmannCharles HallShan HuangPhilippe Lüdi
Laura KavanaughSandra ReynoldsMark DeLong
UPGG
Ewan Birney
DUMRUJohn Perfect
Andy AlspaughTom Mitchell
Sequencing centersBroad InstituteDuke University
Joint Genome InstituteGénolevures
Stanford University(NIH and NSF)
Matthew Hahn