Embed Size (px)
Citation preview
Productive Sector Growth and Environment DivisionOffice of Sustainable DevelopmentBureau for AfricaU.S. Agency for International Development
Comparative Cost of Production Analysis in EastAfrica: Implications for Competitiveness andComparative Advantage.
M. Odhiambo P. Kristanson KashangakiMwankiki Associates Ltd./Technoserve
October 1996
Publication services provided by AMEX International, Inc.Pursuant to the following USAID contract:
Project Title: Policy, Analysis, Research, and TechnicalSupport Project
Project Number: 698-0478Contract Number: AOT-0678-C-00-6066-00

iii
Contents
Foreword viiAcknowledgments ixExecutive Summary xiGlossary of Acronyms and Abbreviations xxi
1. Introduction 1
Background 1Objectives of the Study 1Report Outline 2
2. Methodology and Study Approach 3
Introduction 3Methodology for the Agricultural Sector 3Challenges of Comparing Agricultural Costs of Production Across Countries 4Methodology for the Textile Subsector 5
3. Comparative Coffee Cost of Production Analysis 7
Smallholder Coffee Production 7Comparative Cost of Production for Coffee: Kenya, Uganda, and Tanzania 8Summary — Lessons from Comparing Coffee COP 15Tables:3.1 Summary of Comparative COP Budgets for Arabica Coffee — 1992/93 93.2 Comparison of Smallholder Yields of Arabica Coffee: 1992/93 103.3 Comparison of Profitability (Revenues - Costs) of Arabica Coffee ($/ha) 103.4 Comparison of Coffee Processing Costs (1990 prices) 113.5 Comparison of Input Prices in Capital Cities: 1992 and 1994 133.6 Comparison of Returns to Labor for Coffee and Competing Crops 14
4. Comparative Cost of Production for Maize 17
Introduction 17Comparative Cost of Production Analysis for Maize 17Summary — Lessons from Comparing Maize COP 22
iv
Tables:4.1 Summary of Maize Cost of Production (US$): 1993 184.2 Comparison of Input Use Levels Per Ha. in Maize Production: 1993 194.3 Comparative Prices/Cost of Selected Inputs and Labor Wage Rates (US$): 1993 204.4 Comparative Returns and Profitability for Maize Production 21
5. Comparative Cost of Production Analysis for Beans 25
Introduction 25Comparison of Total and Variable Costs for Beans 25Comparison of Labor Input Levels and Cost for Beans 27Comparison of Levels of Utilization and Costs of Other Inputs in Beans Production 27Comparative Profitability 27Summary — Lessons from Comparing Beans COP 29Tables:5.1 Summary of Beans Cost of Production (US$/ha): 1993 265.2 Comparison of Physical Input Use Levels in Bean Production 285.3 Comparative Profitability of Bean Production ($/ha and $/kg): 1993 29
6. Comparative Cost of Production Analysis for Potatoes 31
Smallholder Potato Production 31Potato Cost of Production Budgets 31Lessons from Potato Cost of Production 34Tables:6.1 Comparative COP Budgets for Potatoes — 1993, Kenya 326.2 Comparison of Actual versus Good Smallholder Yields 336.3 Comparison of Fungicide Cost: 1993 33
7. Costs of Production in the Textile Industry 35
Introduction 35Costs of Production of Textiles in East Africa 35Conclusions 47Policy Implications 48
v
Tables:7.1 Cost of Producing 200gms/Square Meter of Cotton Fabric (US$) 377.2 Prices of Cotton Lint in East Africa 387.3 Cost of Chemicals in East Africa 397.4 Monthly Wage Rates in East Africa, December 1993 407.5 Comparative Labor Costs of Textile Industry Operatives 417.6 Utility Costs in East Africa 427.7 Telecommunications Costs to Various Destinations 437.8 Musoma Cost Structure (% Value of Production) 447.9 Nominal Lending Rates; 1991, 1992, 1993 457.10 Taxes Levied on Imports 467.11 Taxes as a Percentage of Profits in East Africa 46
8. Analysis of Competitiveness and Comparative Advantage 51
Introduction 51Measuring Competitiveness 52Competitiveness and Comparative Advantage of Maize in East Africa 53Competitiveness and Comparative Advantage for Beans in East Africa 55Conclusions and Recommendations for Maize and Beans 56Comparative Advantage/Competitiveness of Coffee in East Africa 57Conclusions and Recommendations for Coffee 60Comparative Advantage/Competitiveness of Textiles in East Africa 60Inputs 61Tables:8.1 Summary of Competitive and Comparative Advantage Analysis for Maize in East Africa 558.2 Summary of Competitive and Comparative Advantage Analysis for Beans in East Africa 568.3 Comparative Advantage of Tanzanian and Ugandan Arabica Coffee 1992 ($/kg) 588.4 Efficiency Measures for Polyester Yarn and Fabrics in Kenya, 1987 628.5 DRC Measures for Countries in East Africa, Textile Industry 638.6 Textile Exports From Kenya; March - July 1994 (Kshs. million) 66
Appendices1. Statement of Work 692. Coffee Cost of Production 713. Maize Cost of Production 834. Beans Cost of Production 875. Textiles Cost of Production 916. Domestic Resources Cost for Maize and Beans 977. Textile Industries 107References 111

vi
vii
ForewordOver the past few decades, research and policy focus on agricultural productivity and competitiveness
in sub-Saharan Africa has increased. This focus comes from developmental theory, which suggests thatgrowth in the agricultural sector is critical in gener ating economic growth. This relationship is particularlyimportant in Africa because of the often significant share agriculture has in total gross domestic product(GDP).
For farmers in Africa and elsewhere, net productivity is critically dependent on crop prices, level ofoutput, and production costs. But yield variations due to exogenous factors such as weather, insects, anddiseases can cause per unit output costs to fluctuate considerably from one season to the next, eroding netprofitability. Furthermore, input price subsidies for fertilizer s and agrochemicals often conceal actual costsof production and net profits, constraining efforts to measure true agricultural comparative advantage.
This study—Comparative Cost of Production Analysis in East Africa—is timely given the wave ofeconomic reforms sweeping the region in recent years. It is an analytical attempt to highlight areas o fcomparative advantage and disadvantage in various East African cou ntries and suggest ways in which thesecountries could improve regional and individual competitiveness in production and trade via optima lresource allocation. Its summary of findings on competitiveness of Kenya, Uganda, and Tanzania i nproducing coffee, maize, beans, and cotton provides a means for each of these countries to rank an dprioritize their agricultural product ion enterprises on the basis of comparative advantage. It provides thesecountries a guide for making cho ices on which crops to emphasize. The study is also a useful contributionto the process of data set collection and dissemination in the area of agricultural comparative advantageand regional trade. It should be useful in guiding governments, donors, and the private sector in makingimportant decisions that relate to these issues.
This report is one in a series of studies on Africa's regional trade and agricultural comparativ eadvantage, a joint activity of the Africa Bureau's Food Security and Productivity Unit in the Office o fSustainable Development, Productive Sector Gr owth and Environment Division (AFR/SD/PSGE), and theRegional Economic Development Services Office for East and Southern Africa (REDSO/ESA).
Curt Reintsma
Division Chief
USAID/AFR/SD/PSGE

viii
ix
Acknowledgments
The study team members would like to extend their appreciation and many thanks to everyone who madethe completion of this study possible. Regrettably, due to space limitations, it is not possible to list themall individually, but special mention must be made of the USAID/REDSO staff who, together wit hTechnoserve Inc. and Mwaniki Assoc iates, made arrangements for the funding and logistics for the study.In particular, we would like to thank Joe Carvalho (USAID/REDSO), Paul Warmka and Josep hMwangangi (Technoserve Inc.) and Ngure Mwaniki (Mwaniki Associates) for their guidance and supportthroughout the course of this study.
We would also like to thank the Policy Analysis Matrix (PAM) team in Kenya, the Ministry o fAgriculture in Tanzania and the Export Policy Analysis and Development Unit (EPADU) in Uganda fortheir willingness to provide the team with data. The PAM team in Kenya was particularly helpful i nproviding the authors with detailed COP budgets. Their assistance to the st udy team was highly appreciated.
We are also extremely grateful for the tireless efforts of the staff at Mwaniki Associates in helping toput the final document together. In particular, specia l thanks go to Esther Metha and Beth Ndungu for theirmany hours spent at the computer. Fi nally, we thank all our respondents (farmers, manufacturers, and keyinformants) for their patience with our probing questions during interviews and for allowing us to encroachinto their busy schedules.
Although we acknowledge the assistance of the above mentioned in this study, the authors accept fullresponsibility for the contents of this report.
Prof. M. O. OdhiamboAgricultural Economist (Maize and Beans)
Dr. P. KristjansonAgricultural Economist (Coffee and Potatoes)
J. KashangakiEconomist (Textiles)

x
xi
Executive SummaryThe recent market liberalization in Kenya, Uganda, and Tanzania has improved farmers competitivenessin regional and world markets for coffee, maize, and beans. Kenya is the lowest cost producer of coffeeand textiles, while Tanzania has a cost advantage in beans. Ugandan farme rs produce maize at the least costper hectare but at the highest cost per kilogram in the region due to low yields. Kenya also has acomparative cost advantage in manu facturing cotton fabric but not cotton, and Tanzania and Uganda havea comparative advantage in the production of cotton, but not in cotton fabrics. These are findings of theComparative Cost of Production in East Africa Study co nducted for USAID's Regional Office for East andSouthern Africa (REDSO). The study examines maize, beans, coffee, potatoes, and textiles in Kenya ,Tanzania, and Uganda.
The objective of the study was to gat her and analyze data on costs of production in agriculture and thetextile manufacturing industry to determine whether or not each country has a comparative advantage inproducing these commodities, and if they can competitively export them to regional and world markets.A ranking of each country's performance with respect to each commodity i s provided and recommendationsas to how the least competitive countries can reduce their costs and improve their competitiveness ar emade. It is hoped that the results of this s tudy will assist African policymakers and donor agencies seekingto assist them in their approaches towards resource allocation and regional and international trade.
The approach of the study, given limited ti me and resources, was to rely on secondary sources of data.These were verified and supplemented where possibl e with primary data collected through interviews withkey informants in each of the three countries. First, cost of production budgets were gathered for eac hcountry and commodity, and the cross-country comparative analysis undertaken. In the case of textiles ,costs of production for at least one representative firm in each country were examined. These costs werecompared to secondary data on cost of production and verified with interviews with textile firms in th eregion.
Second, comparative advantage analyses were undertaken, using secondary data where possible. I nsome cases, the COP and supplementary marketing and processing cost data was used to undertake afinancial analysis of domestic resource costs (DRCs) to determine whether or not a country wa scompetitive in world or regional markets.
COMPARATIVE COST OF PRODUCTION ANALYSIS
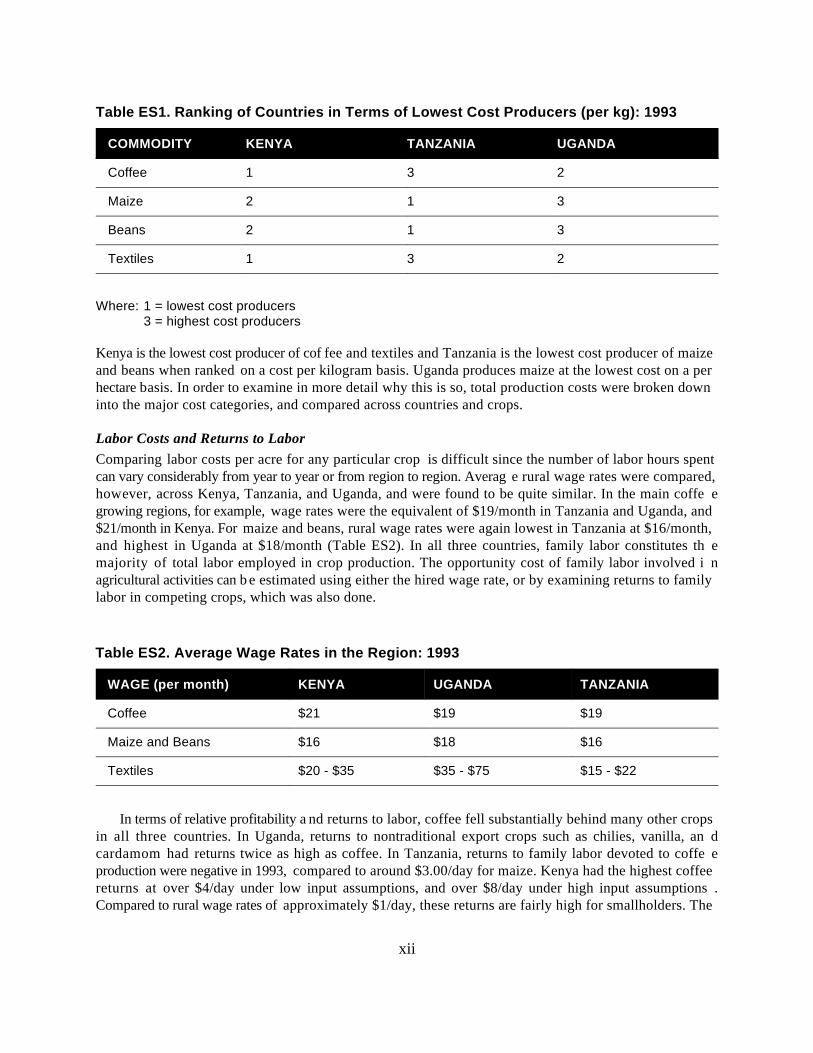
Total CostsFindings from the comparative cost of production analysis are summarized in Table ES1. The thre ecountries and four commodities are categorized according to relative costs of production per unit output,where 1=lowest cost producer, and 3=highest cost producer.
xii
Table ES1. Ranking of Countries in Terms of Lowest Cost Producers (per kg): 1993
COMMODITY KENYA TANZANIA UGANDA
Coffee 1 3 2
Maize 2 1 3
Beans 2 1 3
Textiles 1 3 2
Where: 1 = lowest cost producers3 = highest cost producers
Kenya is the lowest cost producer of cof fee and textiles and Tanzania is the lowest cost producer of maizeand beans when ranked on a cost per kilogram basis. Uganda produces maize at the lowest cost on a perhectare basis. In order to examine in more detail why this is so, total production costs were broken downinto the major cost categories, and compared across countries and crops.
Labor Costs and Returns to LaborComparing labor costs per acre for any particular crop is difficult since the number of labor hours spentcan vary considerably from year to year or from region to region. Averag e rural wage rates were compared,however, across Kenya, Tanzania, and Uganda, and were found to be quite similar. In the main coffe egrowing regions, for example, wage rates were the equivalent of $19/month in Tanzania and Uganda, and$21/month in Kenya. For maize and beans, rural wage rates were again lowest in Tanzania at $16/month,and highest in Uganda at $18/month (Table ES2). In all three countries, family labor constitutes th emajority of total labor employed in crop production. The opportunity cost of family labor involved i nagricultural activities can be estimated using either the hired wage rate, or by examining returns to familylabor in competing crops, which was also done.
Table ES2. Average Wage Rates in the Region: 1993
WAGE (per month) KENYA UGANDA TANZANIA
Coffee $21 $19 $19
Maize and Beans $16 $18 $16
Textiles $20 - $35 $35 - $75 $15 - $22
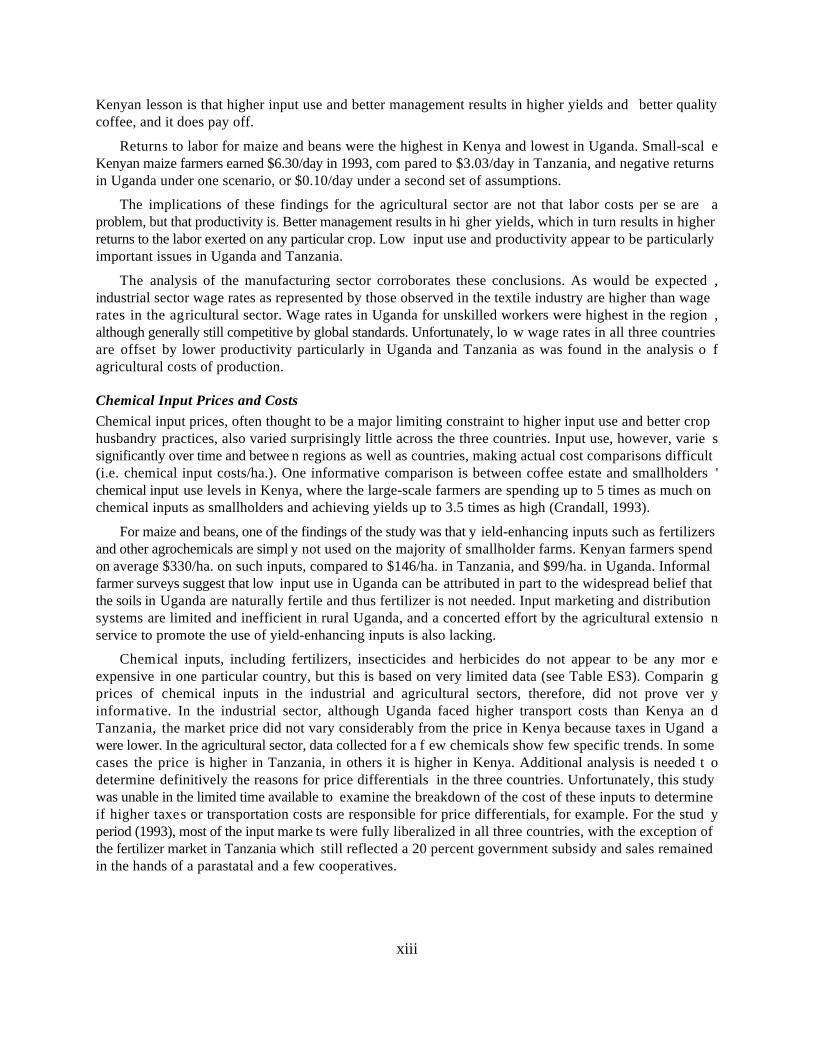
In terms of relative profitability a nd returns to labor, coffee fell substantially behind many other cropsin all three countries. In Uganda, returns to nontraditional export crops such as chilies, vanilla, an dcardamom had returns twice as high as coffee. In Tanzania, returns to family labor devoted to coffe eproduction were negative in 1993, compared to around $3.00/day for maize. Kenya had the highest coffeereturns at over $4/day under low input assumptions, and over $8/day under high input assumptions .Compared to rural wage rates of approximately $1/day, these returns are fairly high for smallholders. The
xiii
Kenyan lesson is that higher input use and better management results in higher yields and better qualitycoffee, and it does pay off.
Returns to labor for maize and beans were the highest in Kenya and lowest in Uganda. Small-scal eKenyan maize farmers earned $6.30/day in 1993, com pared to $3.03/day in Tanzania, and negative returnsin Uganda under one scenario, or $0.10/day under a second set of assumptions.
The implications of these findings for the agricultural sector are not that labor costs per se are aproblem, but that productivity is. Better management results in hi gher yields, which in turn results in higherreturns to the labor exerted on any particular crop. Low input use and productivity appear to be particularlyimportant issues in Uganda and Tanzania.
The analysis of the manufacturing sector corroborates these conclusions. As would be expected ,industrial sector wage rates as represented by those observed in the textile industry are higher than wagerates in the agricultural sector. Wage rates in Uganda for unskilled workers were highest in the region ,although generally still competitive by global standards. Unfortunately, lo w wage rates in all three countriesare offset by lower productivity particularly in Uganda and Tanzania as was found in the analysis o fagricultural costs of production.
Chemical Input Prices and CostsChemical input prices, often thought to be a major limiting constraint to higher input use and better crophusbandry practices, also varied surprisingly little across the three countries. Input use, however, varie ssignificantly over time and betwee n regions as well as countries, making actual cost comparisons difficult(i.e. chemical input costs/ha.). One informative comparison is between coffee estate and smallholders 'chemical input use levels in Kenya, where the large-scale farmers are spending up to 5 times as much onchemical inputs as smallholders and achieving yields up to 3.5 times as high (Crandall, 1993).
For maize and beans, one of the findings of the study was that y ield-enhancing inputs such as fertilizersand other agrochemicals are simpl y not used on the majority of smallholder farms. Kenyan farmers spendon average $330/ha. on such inputs, compared to $146/ha. in Tanzania, and $99/ha. in Uganda. Informalfarmer surveys suggest that low input use in Uganda can be attributed in part to the widespread belief thatthe soils in Uganda are naturally fertile and thus fertilizer is not needed. Input marketing and distributionsystems are limited and inefficient in rural Uganda, and a concerted effort by the agricultural extensio nservice to promote the use of yield-enhancing inputs is also lacking.
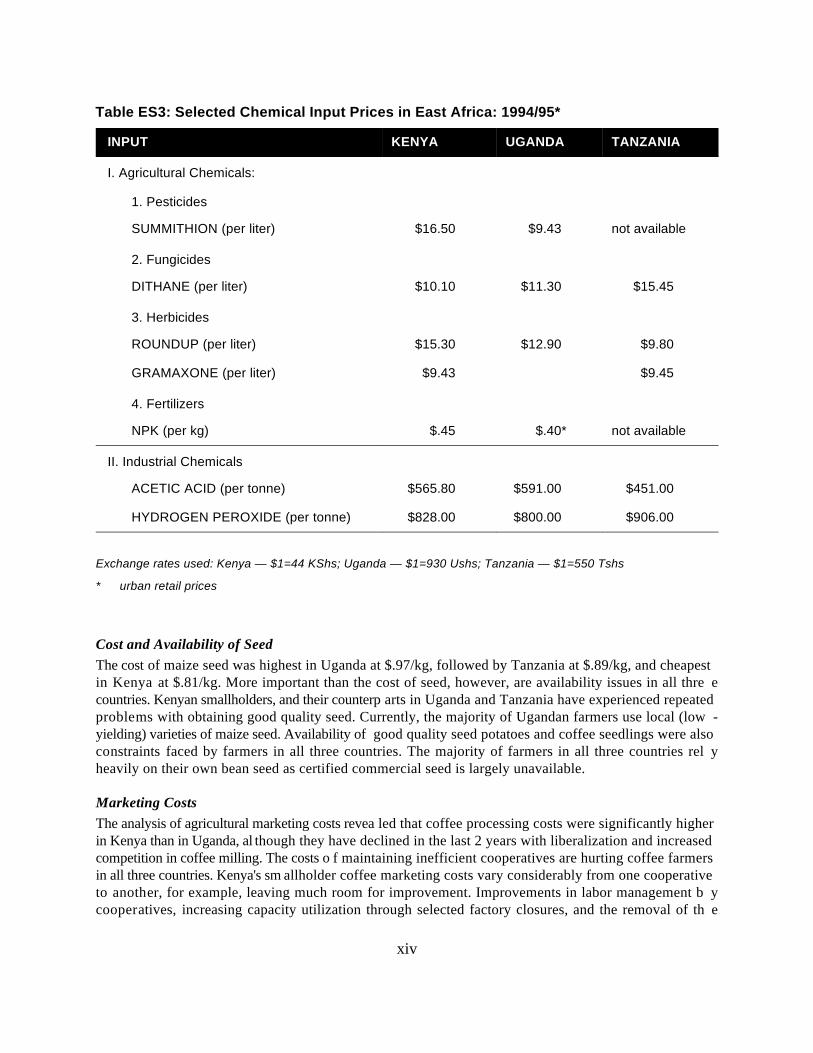
Chemical inputs, including fertilizers, insecticides and herbicides do not appear to be any mor eexpensive in one particular country, but this is based on very limited data (see Table ES3). Comparin gprices of chemical inputs in the industrial and agricultural sectors, therefore, did not prove ver yinformative. In the industrial sector, although Uganda faced higher transport costs than Kenya an dTanzania, the market price did not vary considerably from the price in Kenya because taxes in Ugand awere lower. In the agricultural sector, data collected for a f ew chemicals show few specific trends. In somecases the price is higher in Tanzania, in others it is higher in Kenya. Additional analysis is needed t odetermine definitively the reasons for price differentials in the three countries. Unfortunately, this studywas unable in the limited time available to examine the breakdown of the cost of these inputs to determineif higher taxes or transportation costs are responsible for price differentials, for example. For the stud yperiod (1993), most of the input marke ts were fully liberalized in all three countries, with the exception ofthe fertilizer market in Tanzania which still reflected a 20 percent government subsidy and sales remainedin the hands of a parastatal and a few cooperatives.
xiv
Table ES3: Selected Chemical Input Prices in East Africa: 1994/95*
INPUT KENYA UGANDA TANZANIA
I. Agricultural Chemicals:
1. Pesticides
SUMMITHION (per liter) $16.50 $9.43 not available
2. Fungicides
DITHANE (per liter) $10.10 $11.30 $15.45
3. Herbicides
ROUNDUP (per liter) $15.30 $12.90 $9.80
GRAMAXONE (per liter) $9.43 $9.45
4. Fertilizers
NPK (per kg) $.45 $.40* not available
II. Industrial Chemicals
ACETIC ACID (per tonne) $565.80 $591.00 $451.00
HYDROGEN PEROXIDE (per tonne) $828.00 $800.00 $906.00
Exchange rates used: Kenya — $1=44 KShs; Uganda — $1=930 Ushs; Tanzania — $1=550 Tshs
* urban retail prices
Cost and Availability of Seed The cost of maize seed was highest in Uganda at $.97/kg, followed by Tanzania at $.89/kg, and cheapestin Kenya at $.81/kg. More important than the cost of seed, however, are availability issues in all thre ecountries. Kenyan smallholders, and their counterp arts in Uganda and Tanzania have experienced repeatedproblems with obtaining good quality seed. Currently, the majority of Ugandan farmers use local (low -yielding) varieties of maize seed. Availability of good quality seed potatoes and coffee seedlings were alsoconstraints faced by farmers in all three countries. The majority of farmers in all three countries rel yheavily on their own bean seed as certified commercial seed is largely unavailable.
Marketing CostsThe analysis of agricultural marketing costs revea led that coffee processing costs were significantly higherin Kenya than in Uganda, al though they have declined in the last 2 years with liberalization and increasedcompetition in coffee milling. The costs o f maintaining inefficient cooperatives are hurting coffee farmersin all three countries. Kenya's sm allholder coffee marketing costs vary considerably from one cooperativeto another, for example, leaving much room for improvement. Improvements in labor management b ycooperatives, increasing capacity utilization through selected factory closures, and the removal of th e
A regional comparative cost of transportation study was being undertaken for USAID by Technoserve at the time of this study.1
xv
Coffee Board of Kenya's monopoly in auctioning coffee would increase coffee payments to cooperativemembers from 57 percent to 77 percent of free on board (FOB) prices, according to the estimates of oneanalyst (Nyoro, 1994).
Although no detailed analysis of transport costs was undertaken , the analysis in the manufacturin g1
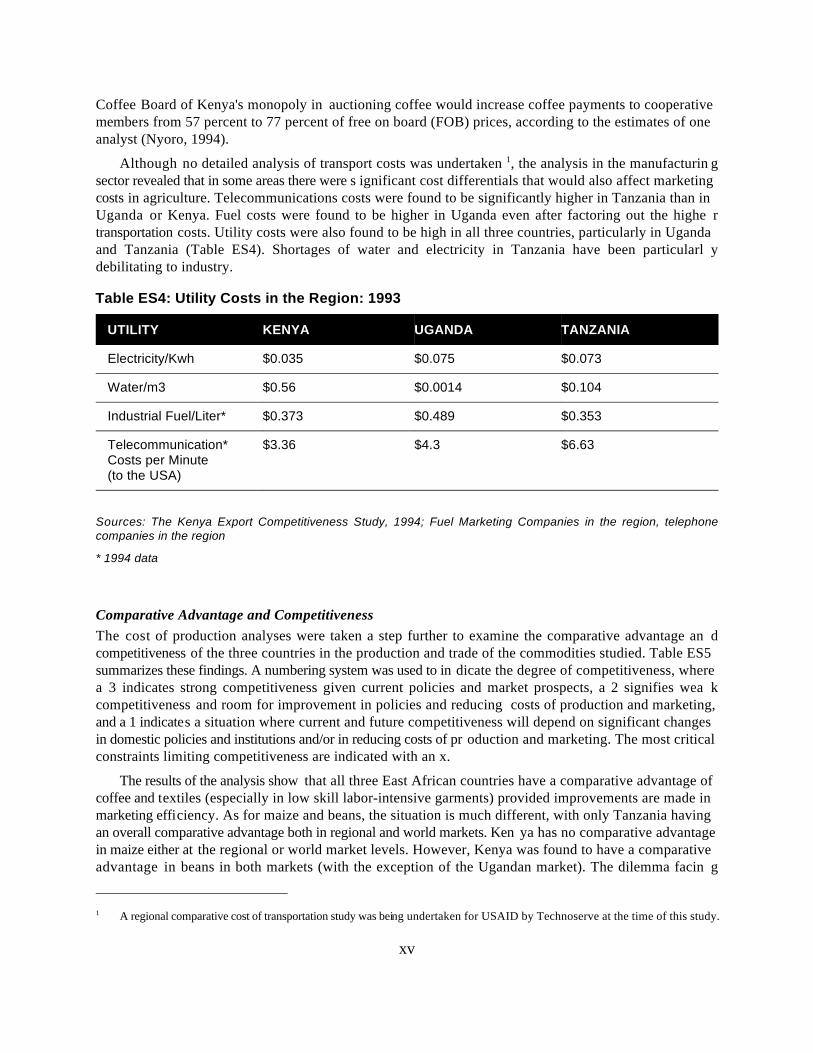
sector revealed that in some areas there were s ignificant cost differentials that would also affect marketingcosts in agriculture. Telecommunications costs were found to be significantly higher in Tanzania than inUganda or Kenya. Fuel costs were found to be higher in Uganda even after factoring out the highe rtransportation costs. Utility costs were also found to be high in all three countries, particularly in Ugandaand Tanzania (Table ES4). Shortages of water and electricity in Tanzania have been particularl ydebilitating to industry.
Table ES4: Utility Costs in the Region: 1993
UTILITY KENYA UGANDA TANZANIA
Electricity/Kwh $0.035 $0.075 $0.073
Water/m3 $0.56 $0.0014 $0.104
Industrial Fuel/Liter* $0.373 $0.489 $0.353
Telecommunication* $3.36 $4.3 $6.63Costs per Minute (to the USA)
Sources: The Kenya Export Competitiveness Study, 1994; Fuel Marketing Companies in the region, telephonecompanies in the region
* 1994 data
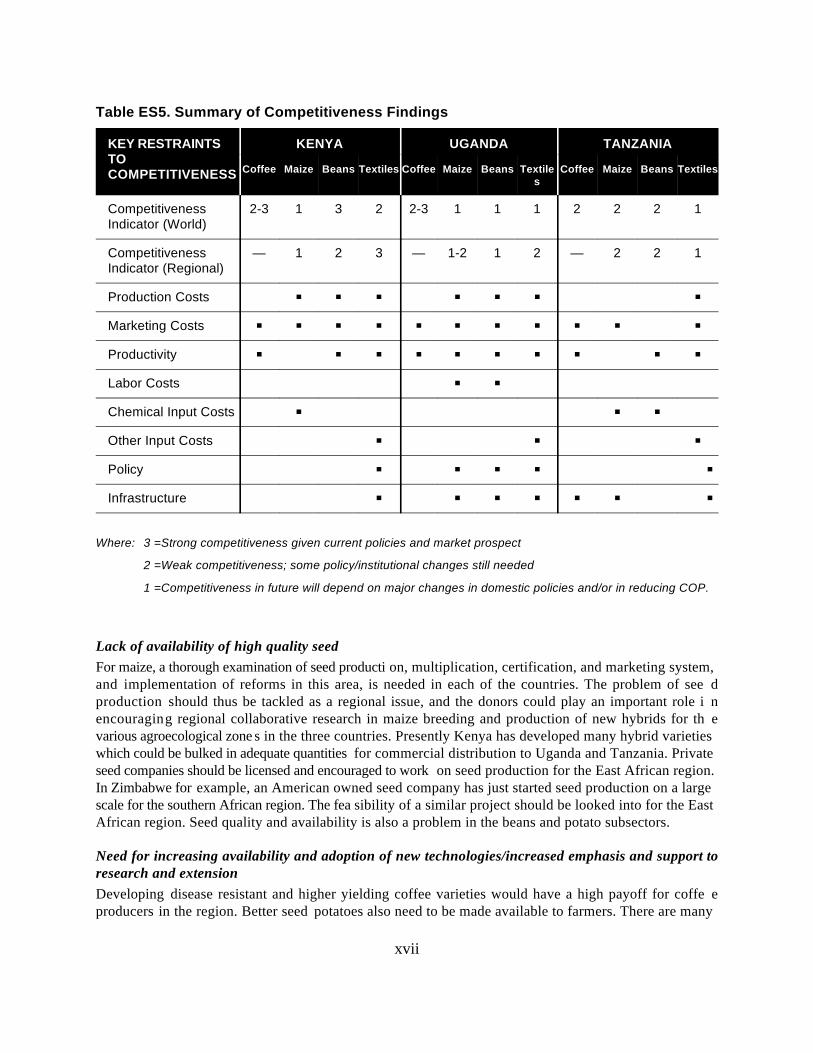
Comparative Advantage and Competitiveness The cost of production analyses were taken a step further to examine the comparative advantage an dcompetitiveness of the three countries in the production and trade of the commodities studied. Table ES5summarizes these findings. A numbering system was used to in dicate the degree of competitiveness, wherea 3 indicates strong competitiveness given current policies and market prospects, a 2 signifies wea kcompetitiveness and room for improvement in policies and reducing costs of production and marketing,and a 1 indicates a situation where current and future competitiveness will depend on significant changesin domestic policies and institutions and/or in reducing costs of pr oduction and marketing. The most criticalconstraints limiting competitiveness are indicated with an x.
The results of the analysis show that all three East African countries have a comparative advantage ofcoffee and textiles (especially in low skill labor-intensive garments) provided improvements are made inmarketing efficiency. As for maize and beans, the situation is much different, with only Tanzania havingan overall comparative advantage both in regional and world markets. Ken ya has no comparative advantagein maize either at the regional or world market levels. However, Kenya was found to have a comparativeadvantage in beans in both markets (with the exception of the Ugandan market). The dilemma facin g
xvi
Kenya is that local demand for beans still outstrips domestic production, making the export marke tunattractive (which does not mean that at any given time it is unattractive to individual traders, however).
The agricultural subsector analyses reveal that the recent market liberalization in these sectors ar ebeginning to have positive impacts on farmers incentives and crop output. Inputs are becoming mor eavailable, although in Tanzania the State and inefficient cooperatives still dominate the marketing an ddistribution of such essential inputs as fertilizers. Price controls in both input and product markets are athing of the past in all three countries, except for the coffee market in Kenya which is still monopolizedby KPCU and has not yet been opened up for private trader's participation.
The textile industry, which this s tudy found to be competitive, also has untapped potential that has notbeen fully exploited. It was observed that some textile factories were closing down in Kenya and Ugandain spite of the finding that the three countries have a comparative advantage in the industry. Plausibl eexplanations for problems facing these firms include the following:
Compared to the textile industries in competing countries such as the South East Asian countries, EastAfrican textile industries are inefficient in their producti on (especially in Uganda and Tanzania). Theseinefficiencies that raise costs are largely due to:
• the use of outdated technology
• inefficient management, especially in the case of parastatals
• low labor productivity
The dumping of textiles and garments (both new and used) in the local market.
Poor quality and high cost inputs, which in most cases are imported.
RECOMMENDATIONSThere are a number of recommendations arising from the analyses of specific commodities that ar eapplicable to all three countries. They have been categorized into the following constraint areas, in orderof priority as identified in our analysis:
Low agricultural chemical input useThere is a need for a study on chemical input use in the region to determine if the cost of inputs is reallya constraint and if input subsidies (properly targeted) are still needed. Liberalization of input market sshould be making inputs more readily available to farmers, albeit at a higher price as subsidies ar eremoved. One of the theories for why farmers have used such low input levels in the region is that the ysimply have not been available, since governments have had limited fund s available to finance the subsidiesand thus have been able to make insufficient amounts of fertilizer available (and it is usually the well-offfarmers who are able to secure rationed supplies). Getting the government out of the market is thereforesupposed to increase fertilizer use. If this is true, we should be seeing higher input use by smallholders inKenya and Uganda (Tanzania still needs to liberalize fertilizer distri bution). Since liberalization is so recentin the region, a study to determine if this is indeed happening would be extremely useful at this time.
xvii
Table ES5. Summary of Competitiveness Findings
KEY RESTRAINTS KENYA UGANDA TANZANIATOCOMPETITIVENESS Coffee Maize Beans Textiles Coffee Maize Beans Textile Coffee Maize Beans Textiles
s
Competitiveness 2-3 1 3 2 2-3 1 1 1 2 2 2 1Indicator (World)
Competitiveness — 1 2 3 — 1-2 1 2 — 2 2 1Indicator (Regional)
Production Costs
Marketing Costs
Productivity
Labor Costs
Chemical Input Costs
Other Input Costs
Policy
Infrastructure
Where: 3 =Strong competitiveness given current policies and market prospect
2 =Weak competitiveness; some policy/institutional changes still needed
1 =Competitiveness in future will depend on major changes in domestic policies and/or in reducing COP.
Lack of availability of high quality seedFor maize, a thorough examination of seed producti on, multiplication, certification, and marketing system,and implementation of reforms in this area, is needed in each of the countries. The problem of see dproduction should thus be tackled as a regional issue, and the donors could play an important role i nencouraging regional collaborative research in maize breeding and production of new hybrids for th evarious agroecological zone s in the three countries. Presently Kenya has developed many hybrid varietieswhich could be bulked in adequate quantities for commercial distribution to Uganda and Tanzania. Privateseed companies should be licensed and encouraged to work on seed production for the East African region.In Zimbabwe for example, an American owned seed company has just started seed production on a largescale for the southern African region. The fea sibility of a similar project should be looked into for the EastAfrican region. Seed quality and availability is also a problem in the beans and potato subsectors.
Need for increasing availability and adoption of new technologies/increased emphasis and support toresearch and extensionDeveloping disease resistant and higher yielding coffee varieties would have a high payoff for coffe eproducers in the region. Better seed potatoes also need to be made available to farmers. There are many
xviii
smallholders in Uganda and Tanzania who still have limited or no access to high-yielding varieties of maizeand beans. There is also a need for improved research on cotton varieties to ensure that the strains that aregrown are suitable for the agroeconomic zones in the region. The problem is not so much a lack o fapplicable research as limite d resources spread too thinly at the national research centers. Similarly, thereare limited linkages between research and extension services in each of these countries that would ensurethe research was demand-driven.
One possible approach donors could take in regionalizing research in East Africa would be th eestablishment of a foundation with the objective of overseeing research efforts in the major crops in theregion. If it had a board of directors made up of the directors of the national research centers and th eInternational Agricultural Research Centers, an important linkage could be established. The mandate ofsuch a foundation would be to coordinate regional research plans between the national research centers andthe international centers and to strengthen linkages between research and extension services. It woul drequire a small secretariat and core group of technical people involved in strategic planning, looking a tpriority commodities and constraints, and who can make objective assessments of institutional capabilities.They could hire or second social and biological scientists from each of the countries as needed.
This type of approach would be most effective if it were a multi-donor effort, and could be developedunder the Special Program for Agricultural Research (SPAR), established by the World Bank. There i ssome experience with such research foundations in Latin America, thus the first step should perhaps be acloser look at the experience and lessons from those institutions.
Low labor productivityThere is a need to focus attention on improving productivity of labor both on the farm and in industry ingeneral. In agriculture this can be done by i mproving incentives for smallholders so they can achieve yieldlevels found on large farms. Continued pressure by donors towards full implementation of agricultura lmarket liberalization efforts needs to be applied. Effective national extension services are also needed toencourage farmers to move from low input technolog y subsistence-level farming to commercial high inputproduction systems.
In industry there is a need, particularly in Tanz ania and Uganda, but also in Kenya, to upgrade trainingfacilities for both semi-skilled and skilled labor. Backwar d linkages between large industry and small-scaleenterprises also needs to be fostered. One method of promoting these linkages is through donor support toassociations such as the Agribusiness Association in Kenya, a fledgling organization with both large andsmall-scale agribusinesses as members. Another is in efforts to get the private sector more involved i nprivate sector development through workshops, round tables, etc. which get the private and public sectorsas well as NGOs and lending institutions discussing ways of overcoming constraints to private secto rgrowth. In line with this, a detailed review of ways to enhance productivity in the region could b eundertaken and used as a discussion piece in a forum consisting of key private sector, government an ddonors in the region.
High marketing costsMarketing costs in general are too high in the region. Targeted attempts need to be made at improvin ginfrastructure in the region. For example, investments in rural marketing infrastructure and the expansionof current market information systems to include coverage of regional cereals markets would lowe rmarketing costs for smallholder producers of all crops . Fuel costs in Uganda and telecommunications costsin Tanzania are too high. Utility costs in general are too high in the region and frequent shortages of waterand electricity need to be addressed. This is a definite area for continued donor pressure toward sprivatization, or at least commercialization through the introduction of more competition, or the hiring of
xix
outside (nonpolitical) management, for example. In addition, analysis of fuel costs in the region specificallyaimed at identifying efficiency enhancing measures should be undertaken. It should cover all aspects of thedistribution chain including refining, marketing costs, administrative overhead costs, and taxes.
The comparative cost of production analysis of coffee showed there is continued work to be done inall three countries towards increasing processing and marketing efficiency at the cooperative level. Thiscan be done by promoting competition among traders and millers (i.e. making sure market liberalizationsteps are fully implemented). Given the similarity of the research needs of the coffee industry in Kenya,Tanzania, and Uganda, it may make sense to consider funding a regional co ffee research center. This wouldavoid duplicative efforts and may be possible given the current policy environment and discussions o freviving the East African Community.

xx
xxi
Glossary of Acronyms andAbbreviations
ADC Agricultural Development CorporationAFR Bureau for Africa (USAID)
CIF Cost Insurance FreightCIP Chemical Input CostsCMB Cotton Marketing BoardCOP Cost of ProductionCSRP Cereals Sector Reform Program
DRC Domestic Resource Costs
EAC East African CommunityEEC European Economic CommunityEPADU Export Policy Analysis and Development UnitEPR Effective Protection RateEPZ Export Processing Zone
FAO Food and Agriculture Organization of the United NationsFOB Free On Board
GDP Gross Domestic ProductGM Gross MarginGOK Government of Kenya
HIT High Input Technology
KPCU Kenya Planters' Cooperative Union
LIT Low Input Technology
MIT Medium Input TechnologyMUB Manufacturing Under Bond
NIC Newly Industrialized CommunityNTE Non Traditional ExportNTM Nyanza Textile Mill
PAM Policy Analysis MatrixPSGE Productive Sector Growth and Environment Division (USAID/AFR/SD)PTA Preferential Trade Area
xxii
REDSO Regional Office for East and Southern Africa
SAPs Structural Adjustment ProgramsSD Office of Sustainable Development (USAID/AFR)SOW Statement of WorkSPAR Special Program for Agricultural Research
TCMB Tanzania Cotton Marketing BoardTOR Terms of ReferenceTPDC Tanzania Petroleum Development Corporation
USAID United States Agency for International Development
VAT Value Added Tax
WFP World Food Program
1
1. Introduction
BACKGROUNDThis report presents the findings of a study conducted during the period August to November of 1994 ,analyzing the comparative costs of production for coffee, maize, beans, potatoes, and textiles in Eas tAfrica. Originally the study was expected to cover the five Eastern African countries of Kenya, Uganda,Tanzania, Rwanda and Burundi. However, due to the security problems in Rwanda and Burundi, it wa sdecided to limit the study coverage to the former three East African Community states of Kenya, Ugandaand Tanzania. The study was commissioned by Technoserve Group on behalf of the USAID Regiona lOffice for East and Southern Africa (REDSO).
As a contribution to the economic development and food security in the Eastern African region ,REDSO has proposed and sponsored a number of studies in the region focusing on the problems facin gagricultural and industrial production, marketing and trade in individ ual member countries and in the regionas a whole. The Comparative Costs of Production Analysis is one such study, with the purpose o fhighlighting areas of comparative advantage and disadvantage of the respective countries in the region andto suggest ways in which these countries could improve regional and individual competitiveness i nproduction and trade. Hopefully, the study will also assist the governments in this region to individually,bilaterally or collectively focus on policies which will enhance trade in the region and lead to an optimalallocation of each country's resources in areas where they have a comparative advantage.
The timing of the study is appropriate. Countries in the region are undertaking bold policy changes ,such as structural adjustment programs (SAPs), inv olving internal and external trade liberalization. Kenya,Uganda, and Tanzania have alread y relaxed several crossborder trade restrictions and have even proposedworking on the modalities of reviving the defunct East African Community as a step toward mor eliberalized trade and regional economic integration. It is also worth noting that with the establishment ofthe Preferential Trade Area (PTA) covering Eastern and southern Africa, there is a need for each of thecountries to identify its areas of comparative advantage as a basis for carrying out trade within the region.
OBJECTIVES OF THE STUDYFrom the statement of work (SOW) and terms of referenc e (TOR) of the study (see Appendix 1), and frompreliminary discussions held with the USAID/REDSO office, the objectives of the study can b esummarized as follow:
Gather and analyze data on costs of production for maize, beans, po tatoes, coffee and textiles in Kenya,Uganda and Tanzania.
Undertake a comparative cost of production analysis acros s the three countries (converting all the coststo US$ equivalent), focusing on:
• comparative costs of labor, rents, utilities, key inputs, capital items and other variable costs.
• comparative costs associated with the regulatory environment including taxes, subsidies, etc.
2
• comparative costs of services including transport, insurance, energy (electrical and petroleu minputs) and banking, in the production process of textiles.
Rank the three countries by subsector according to their competitiveness in cost of production.
Provide discussions as to where and when a given country has a specific advantage over others in theregion with respect to production costs.
Provide recommendations on how the least competitive countries could improve their costs.
REPORT OUTLINEChapter 2 describes the methodolo gy used in the study. Chapters 3, 4, 5, 6, and 7 present the results of thecomparative cost of production anal ysis for coffee, maize, beans, potatoes, and textiles. Chapter 8 focuseson issues of comparative advantage and competitiveness of maize, beans, coffee, and textiles. Th eexecutive summary of this report provides a comprehensive summary of the findings of the study and ourrecommendations.
Appendix 1 contains the Scope of Work. Appendix 2 contains more detailed country-specific coffeeCOP analysis for Kenya, Uganda, and Tanzania. Similarly, Appendix 3 focuses on maize, Appendix 4 onbeans, Appendix 5 on textiles. Appendix 6 contains detaile d comparative advantage analyses for maize andbeans, and Appendix 7 gives a background description of the textile industries in Kenya, Uganda, an dTanzania.

3
2. Methodology and Study Approach
INTRODUCTIONThe study was carried out by two agricultural economists and one economist between August an dNovember of 1994. A critical review of the SOW provided by the client and the expected tasks that hadto be carried out during the study indicated that the study was wide in scope in terms of geographical andsubsector coverage. At the same time, there were detailed and intensive data requirements and analysesof cost of production data for each of the subsectors in each of the three countries within a limited tim eframe of only three months.
In light of all these requirements, a data gathering and analysis plan had to be formulated t oaccommodate both the wide scope of coverage and the limited time and resources available. Th emethodology selected had to answer the following questions:
What are the inputs used in the production process of the commodities under study in each of th ecountries?
Are there any differences in production technologies within and among the countries in the region forthe selected commodities, i.e. maize, beans, potatoes, coffee, and textiles?
If there are differences in production technologies, what are these differences and how are the yreflected in the cost structures?
What are the direct and indirect cost elements in each of the selected subsectors in each country, andwhat are the itemized and aggregate cost levels in each case?
What are the inter-country prod uction cost differences in each of the subsectors in terms of cost itemsand cost levels?
What factors are responsible for the inter-country cost differences across similar subsectors?
METHODOLOGY FOR THE AGRICULTURAL SECTORIn order to analyze the cost of production for maize, beans, potatoes, and coffee, a two-step approach wastaken. First, secondary data on farm level production costs and marketing costs were gathered for each ofthe 3 countries. Second, this C OP data (in some cases very detailed, in others very vague) was interpretedand analyzed, and the cross-country comparisons made.
Data Requirements for the Agricultural SubsectorsIn the agricultural subsectors, the data requirements for cost producti on analysis for each crop included dataand information on:
Yield (kg/ha) levels at selected representative levels o f technologies and where relevant (and possible),at the small, medium, and large scales of operation.
4
Level of technology as reflected in the standard of crop husbandry practices. For convenience wherepossible, the level of technology has been defined as follows:
• Level I: Low input technology (LIT)
• Level II: Medium input technology (MIT)
• Level III: High input technology (HIT)
Quantities of variable material inputs and the associated variable costs of production. These include:
• seed input and its procurement cost which include the purchase price, transportation and storage;
• fertilizer input and its procurement costs;
• pesticides and other agrochemical inputs like herbicides, fungicides and insecticides and thei rprocurement costs; and
• other inputs that may be identified as variable.
Quantities of labor inputs and the associated costs of production they entail. Labor inputs include bothhired (casual or permanent) and family labor used to carry out such operations like land preparation,planting, weed control, chemical application, crop maintenance and harvesting.
The fixed cost elements involved in the production process of each of the commodities were als oidentified and costed. These include such costs as:
• depreciation and interest costs on equipment;
• management fees and staff salaries where applicable;
• infrastructure and farm structure depreciation and overhead costs;
• cost of utilities on the farm, appropriately apportioned to the enterprises concerned; and
• in the case of coffee, a perennial crop, the annualized establishment costs.
Local and world market prices of the variou s inputs used in the production of the various commoditiescovered in the study.
Prices of each of the commodities in the local, regional, and world market.
Transportation and marketing costs in both the input and the product markets.
CHALLENGES OF COMPARING AGRICULTURAL COSTS OFPRODUCTION ACROSS COUNTRIESA farmer's profits from growing a given crop depend upon the price he receives for his output, the levelof output he is able to produce, and the costs he incurs in producing it. One way of judging competitivenessis to compare those production costs across countries. However, caution must be used in these comparisons.Few national agencies collect farm account-based cost data. Often, Ministry of Agriculture cost estimatesare based on recommended practices rather than empirical work conducted by researchers.
Methods for measuring cost of production vary considerably across both countries and commodities.In some countries, they are reported in terms of specific input categories. In others, costs are reported interms of a mix of inputs and activities, where the latter might be des cribed as land preparation or harvesting
5
using a combination of inputs. Typically, costs of production are calculated on a per hectare basis. Theyare then converted to a per unit o f output basis by dividing per hectare costs by yield. Yield variations dueto weather, insects, and diseases can cause costs per unit of output to vary considerably from one cro pseason to the next. Very good yields reduce per unit output costs and poor yields increase them. It i simportant, therefore, to have some notion of "normal" yields in judging t he representativeness of productioncosts per unit of output in any particular growing season. Given the variability of yields, production costsare likely to vary significantly across seasons.
Costs also vary among farms and over time as a result of different intensities of input use, effectivenessin use of inputs, changes in prices of inputs, and cultural and management practices. Variation in inpu tprices affects profits to the extent that these fluctuations are not fully offset by compensating changes inoutput prices. In practice, production cost data do not always indicate separately the price and quantity ofeach input, which makes comparisons impossible.
It is common in many developing countries to subsidize the prices of some inputs, especially fertilizersand agrochemicals. Sometimes the subsidies are reflected in the market price of these inputs. In case swhere parastatals control the marketing and processing of crops, the cost of inputs is deducted from th eprices paid to producers. Structural adjustment programs in most countries include major reductions i ninput subsidies. Thus, large differences in input prices occur as subsidies are reduced. For purposes o fexamining international competitiven ess, it is often desirable to adjust production costs for these subsidiesand add them to variable costs. However, due to the on-going structural adjustment programs and trad eliberalization in East Africa, such policy distortions have been assumed to be minimal and will not be amajor focus of this study.
In most cases, variable cash costs are the only available information, since fixed costs have not beenallocated to each commodity. In general, data on depreciation and imputed capital, land, and labor costsare also not available. This is not a serious problem, however. These costs do not affect short-ru nproduction decisions or allocation of resourc es among commodities, since they are return measures for thewhole farm and affect long-term profitability.
METHODOLOGY FOR THE TEXTILE SUBSECTORIn order to analyze the cost of production for the textile industry a three step approach was used. First ,detailed cost data was obtained from one representative firm in each country. This data was then analyzedand compared across the three countries to identify differences in costs of production. Once the cost datahad been analyzed it was used to identify areas of comparative advantage for the three countries, Kenya,Uganda and Tanzania. In order to complement the data collected a de tailed review of all the secondary dataavailable was carried out. In addition, a number of firms in the region were interviewed to cross check thedata collected and verify inferences and conclusions made in the report.
Data Requirements for the Textile SubsectorThe data requirements to measure costs of production in textile manufacturing are quite extensive. Th erequirements included:
Direct costs, which include cost of raw materials, labor, fuel, water, electricity, packaging, an dtelecommunications;
Manpower overhead costs such as salaries and fringe benefits for the general manager, directors ,engineering, and other technical staff;
6
Non-manpower overhead such as land rental, depreciation on ma chinery, equipment, infrastructure andbuilding, insurance, legal expenses, accounting expenses, travel and other utility expenses.
Challenges of Comparing Industrial Costs of Production across CountriesSimilar to the agricultural subsector, it is very difficult to compare industrial costs of production acros scountries. One of the most difficult challenges is that the textile industry has such a large variety o fproducts with varying production methods and technol ogies. Comparison therefore has to be across similarproducts. In this case, it was decided to use a unit of analysis, woven cotton fabric, since it is a base for avariety of different products.
Costs also vary depending on the size of the firm and the level of input use. It is very difficult t odetermine exact levels of input use as the data often available from firms is aggregated. In the same vein,it is very difficult to allocate non-manpower overhead costs such as land rental, depreciation to specificproducts as the data is often not aggregated in this way. The data available also does not give an indicationon the kinds of technology used and hence the productivity of the firm at all stages of production fro mspinning to weaving to dyeing and bleaching is difficult to determine and compare.
In addition to all these challenges it should be kept in mind that firms in the region are very sensitiveabout giving out detailed cost information for fear of com petitors or tax implications. As a result, obtainingdetailed reliable data from a good sample of firms is a ver y difficult exercise. Very often interpretation andestimates need to be made on some costs that are aggregated or not available using secondary data o rgeneral discussions with experts in the field.
The higher quality achieved by smallholders can be seen in Kenya, where in 90/91, 4 percent of estate coffee was between2
classes 1 and 3 (and 80 percent between 4 and 6), and smallholders had 17 percent between classes 1 and 3 (and 58 percentbetween 4 and 6).
7
3. Comparative Coffee Cost ofProduction Analysis
Kenya, Tanzania, and Uganda
SMALLHOLDER COFFEE PRODUCTIONThis study will focus on smallholder coffee production, since the comparative cost of productio ninformation available for all three countries is for that sector. Estate coffee production is large-scale andthus represents a very different cropping system from that of a smallholder farm. Nonetheless, the hig hdegree of coffee management found on Kenyan estates, for example, provides useful insights, and thesecomparative practices will be considered below as well.
Before looking at costs, what are the farm-level activities that are involved in producing coffee? Theyinclude change of cycle, pruning, handling and desuckering, hand and chemical weeding, fertilize rapplication, spraying, manuring, mulching, and picking. There are significant differences in the level andfrequency of these activities, both across regions and different farm sizes.
One advantage the more labo r-intensive, smaller operations have over large-scale mechanized estatesis that they produce higher quality coffee. Quality is influenced by management practices at each stage ofproduction and processing, including use of appropriate and adequate fertilizers, prevention of coffee berrydisease and leaf rust through fungicide spraying, picking of the cherry when it is ripe, not allowing th echerry to ferment during the soaking and washing processing stages, and sun-drying the parchmen t(Crandall, June 1993). The quality of the coffee bean is determined after processing, roasting and liquoring,and a class 1 bean (the highest quality) commands a price up to 50 percent higher than the price receivedfor average quality coffee (class 5-6) .2
Although the final farm-level output of smallholders is cherry coffee, pos t-harvest handling, processing,and marketing costs have to be included in any analysis of returns to farmers, since these costs ar edetermined and deducted from the final price the farmer receives in all three countries.
Smallholders typically deliver their cherry coffee to factories owned by their cooperative societie swhere the cherry is pulped and dried into parchment coffee. The parchment is then transported from thecooperative factory to a large milling facility for grading, sorting, milling (hulling), and storage. Such millsare usually parastatal or cooperative union owned and situated in the capital cities. After the coffee ha sbeen milled by the large coffee mill, it is sold through an auction process. It is only after the coffee ha s
In Kenya, Tanzania, and Uganda, a pooled payment system was used which averaged prices over the year. The aim was to3
minimize the effects of sharp price changes on farmers, but it also delayed payments and gave farmers less incentive to producehigh quality coffee. This has changed recently in Tanzania and Uganda, where farmers may now sell to private traders, andin Kenya, where an "out-of-pool" system was introduced in 1992. Kenyan coffee farmers can now choose to receive proceedsimmediately after coffee sales, thereby improving incentives to produce higher quality coffee.
Out-turns of clean coffee from ripe cherry should average around 15 to 20 percent.4
8
been sold that the farmers receive their payments, usually in the form of a partial initial payment to b efollowed by a final payment .3
COMPARATIVE COST OF PRODUCTION FOR COFFEE: KENYA,UGANDA, AND TANZANIAThe best information on coffee COP came from Kenya due to the existence of the PAM research team,who collect farm-level cost of production information several times a year for many crops across severalregions. Recent World Bank-funded studies on comparative advantage of export crops were available forUganda and Tanzania. Although not as detailed (particularly in the input level assumptions behind them),they include COP data for Arabica coffee production in 1992/93 i n similar agroclimatic zones as the Kenyadata, allowing a valid cross-country comparison. Comparable COP budgets for 1992/93 have bee nconverted to U.S. dollars (with the exchange rate assumptions given at the bottom of the table) and ar epresented in Table 3.1. Detailed country-specific coffee COP analyses are presented in Appendix 2.
Costs per hectare are very similar for all 3 countries, at approxima tely $500 per hectare, although underthe higher input scenario for Kenya, total costs are $1297/ha. Costs of production for low input Kenya ncoffee farmers have not increas ed substantially since 1981/82, when they ranged from $621 - $853/ha., or$1.20 - $1.60/kg. (Kristjanson et al, 1990). At h igher input/management levels at a cost of $1297/ha., costshave virtually doubled since 1981/82 in Kenya. In Tanzania, the costs of producing Arabica ranged from$55/ha. to $95/ha. in 1989 but have since increased to over $500/ha. during the period 1989-1993 (whichcorresponds to the period of liberalization discussed below).
Translating per hectare costs into per kilogram clean coffee costs requires using some kind of averageyield figures. A comparison of coffee yields using secondary data is complicated by the fact that som esources use yields of clean coffee while others use parchment or cherry yields. In Tanzania and Uganda,for example, yields of parchment coffee — that is, coffee that has been washed, pulped, and dried — areused since most farmers hand-pulp on their farms. In Kenya, farmers typically deliver the coffee cherryto their cooperatives where these processes are carried out. The yield of the final product, clean coffee, isdetermined after the parchment coffee has been milled (i.e. hulled). Thus clean coffee yields are partiallydetermined by the efficiency of the farmer's, cooperative's, and miller's processing steps, although overallit is the husbandry practices followed by the farmer that largely determines the ultimate yield of clea ncoffee. Table 3.2 shows the sources and yields used in the comparative analysis.4
The cost of producing one kilogram of clean coffee was lowest in Kenya, at $.80/kg. under a low inputassumption, and $1.08/kg. under a higher input scenario (see Table A2.2 for details on these inpu tassumptions). It should be noted that the yields used in the case of Kenya are actual yields achieved b yfarmers as reflected in PAM's crop budgets. In the case of Tanzania and Uganda, average national yieldfigures are used, which may or may not reflect an actual "average" farmer's yields. The cost of producingone kilogram of clean coffee was $1.09 in Uganda in the 1992/93 crop year, and $2.23/kilogram i n
The Tanzania cost per kilo of clean coffee may be overstated, particularly for some small-scale farmers, due to the5
assumptions of: very low yields (from national average figures), and 2) relatively high input use (from recommended inputpackages). More actual farm budget data is needed.
9
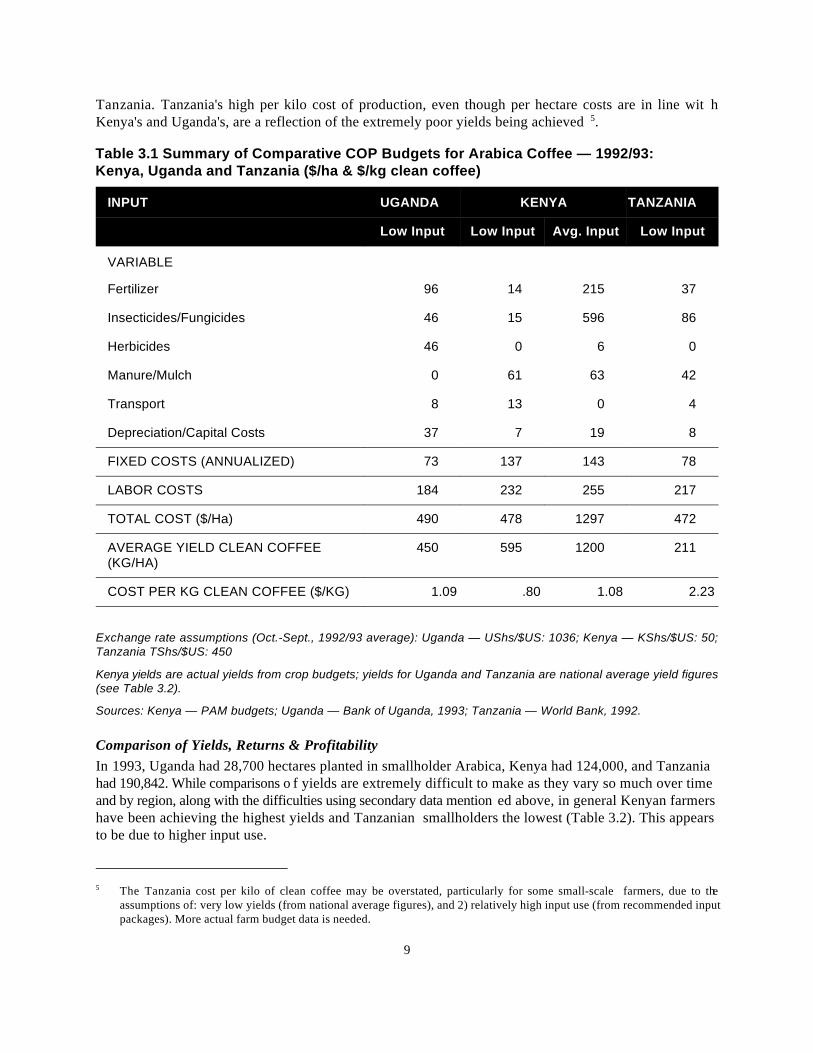
Tanzania. Tanzania's high per kilo cost of production, even though per hectare costs are in line wit hKenya's and Uganda's, are a reflection of the extremely poor yields being achieved .5
Table 3.1 Summary of Comparative COP Budgets for Arabica Coffee — 1992/93:Kenya, Uganda and Tanzania ($/ha & $/kg clean coffee)
INPUT UGANDA KENYA TANZANIA
Low Input Low Input Avg. Input Low Input
VARIABLE
Fertilizer 96 14 215 37
Insecticides/Fungicides 46 15 596 86
Herbicides 46 0 6 0
Manure/Mulch 0 61 63 42
Transport 8 13 0 4
Depreciation/Capital Costs 37 7 19 8
FIXED COSTS (ANNUALIZED) 73 137 143 78
LABOR COSTS 184 232 255 217
TOTAL COST ($/Ha) 490 478 1297 472
AVERAGE YIELD CLEAN COFFEE 450 595 1200 211(KG/HA)
COST PER KG CLEAN COFFEE ($/KG) 1.09 .80 1.08 2.23
Exchange rate assumptions (Oct.-Sept., 1992/93 average): Uganda — UShs/$US: 1036; Kenya — KShs/$US: 50;Tanzania TShs/$US: 450
Kenya yields are actual yields from crop budgets; yields for Uganda and Tanzania are national average yield figures(see Table 3.2).
Sources: Kenya — PAM budgets; Uganda — Bank of Uganda, 1993; Tanzania — World Bank, 1992.
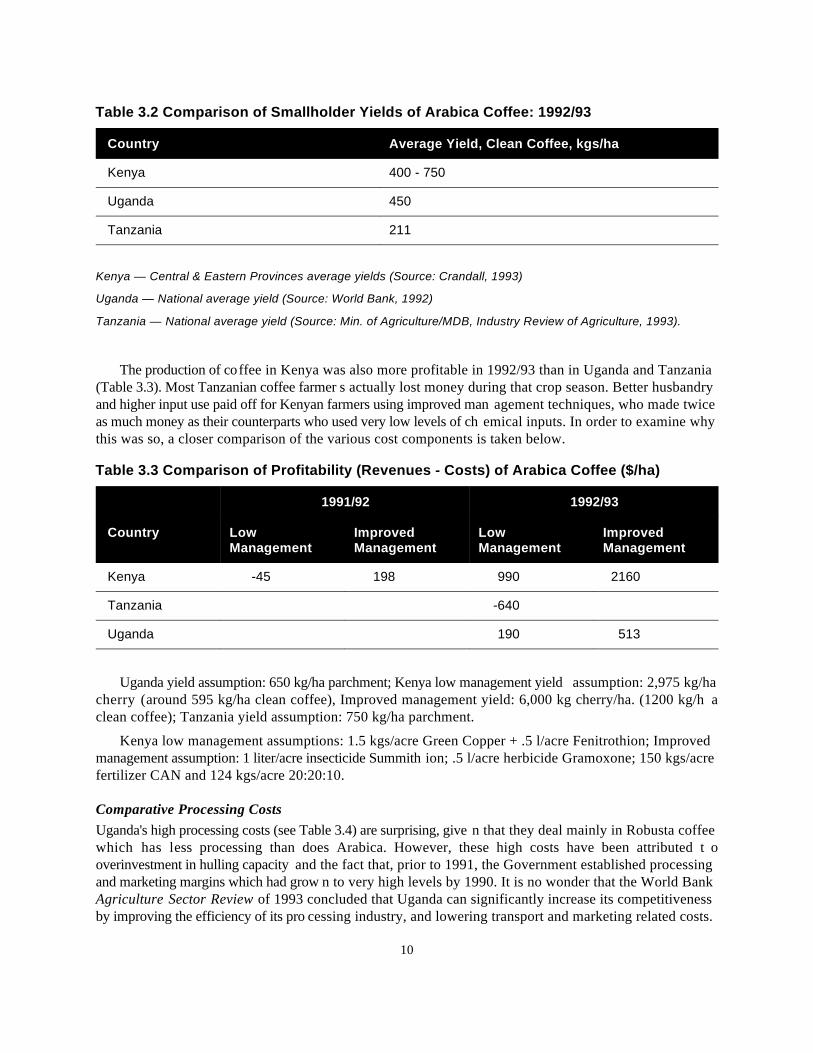
Comparison of Yields, Returns & ProfitabilityIn 1993, Uganda had 28,700 hectares planted in smallholder Arabica, Kenya had 124,000, and Tanzaniahad 190,842. While comparisons o f yields are extremely difficult to make as they vary so much over timeand by region, along with the difficulties using secondary data mention ed above, in general Kenyan farmershave been achieving the highest yields and Tanzanian smallholders the lowest (Table 3.2). This appearsto be due to higher input use.
10
Table 3.2 Comparison of Smallholder Yields of Arabica Coffee: 1992/93
Country Average Yield, Clean Coffee, kgs/ha
Kenya 400 - 750
Uganda 450
Tanzania 211
Kenya — Central & Eastern Provinces average yields (Source: Crandall, 1993)
Uganda — National average yield (Source: World Bank, 1992)
Tanzania — National average yield (Source: Min. of Agriculture/MDB, Industry Review of Agriculture, 1993).
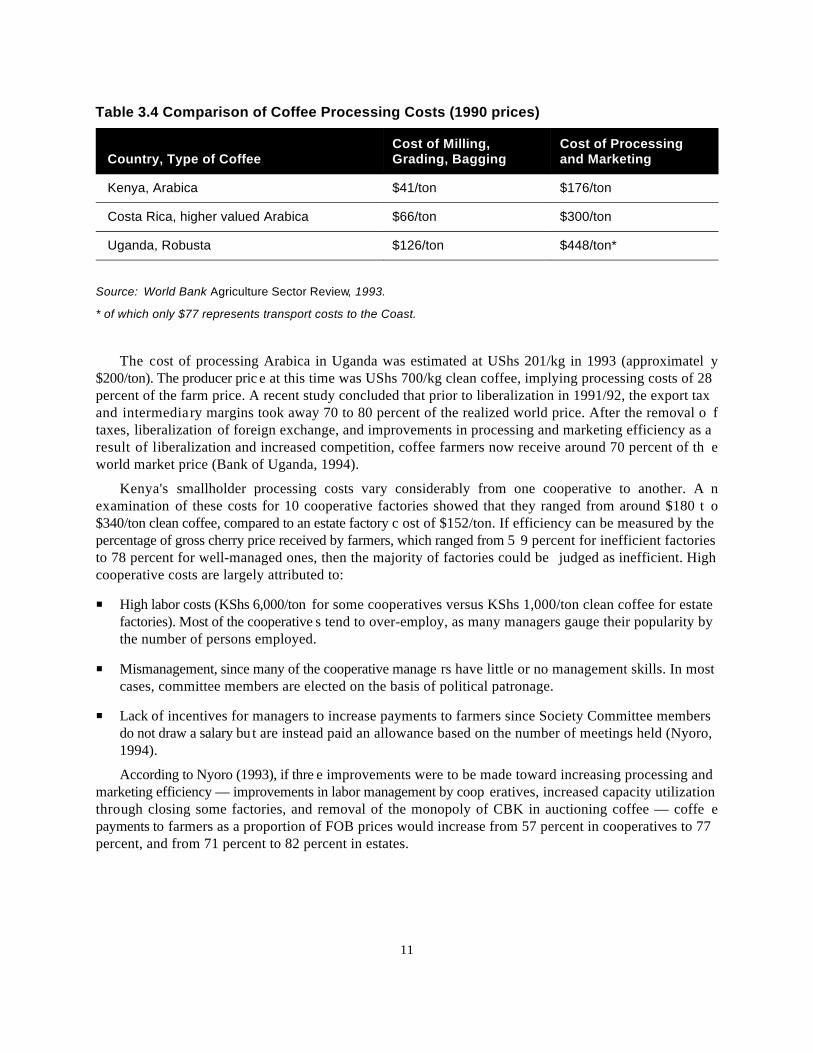
The production of coffee in Kenya was also more profitable in 1992/93 than in Uganda and Tanzania(Table 3.3). Most Tanzanian coffee farmer s actually lost money during that crop season. Better husbandryand higher input use paid off for Kenyan farmers using improved man agement techniques, who made twiceas much money as their counterparts who used very low levels of ch emical inputs. In order to examine whythis was so, a closer comparison of the various cost components is taken below.
Table 3.3 Comparison of Profitability (Revenues - Costs) of Arabica Coffee ($/ha)
Country Low Improved Low Improved
1991/92 1992/93
Management Management Management Management
Kenya -45 198 990 2160
Tanzania -640
Uganda 190 513
Uganda yield assumption: 650 kg/ha parchment; Kenya low management yield assumption: 2,975 kg/hacherry (around 595 kg/ha clean coffee), Improved management yield: 6,000 kg cherry/ha. (1200 kg/h aclean coffee); Tanzania yield assumption: 750 kg/ha parchment.
Kenya low management assumptions: 1.5 kgs/acre Green Copper + .5 l/acre Fenitrothion; Improvedmanagement assumption: 1 liter/acre insecticide Summith ion; .5 l/acre herbicide Gramoxone; 150 kgs/acrefertilizer CAN and 124 kgs/acre 20:20:10.
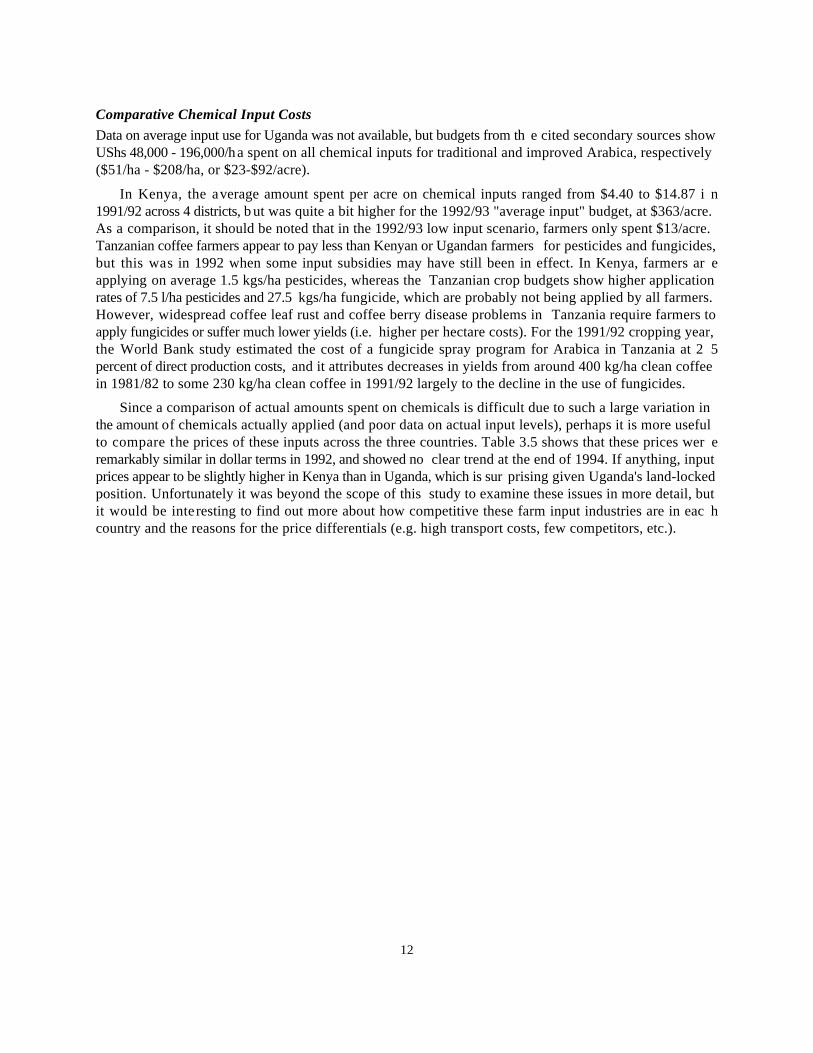
Comparative Processing CostsUganda's high processing costs (see Table 3.4) are surprising, give n that they deal mainly in Robusta coffeewhich has less processing than does Arabica. However, these high costs have been attributed t ooverinvestment in hulling capacity and the fact that, prior to 1991, the Government established processingand marketing margins which had grow n to very high levels by 1990. It is no wonder that the World BankAgriculture Sector Review of 1993 concluded that Uganda can significantly increase its competitivenessby improving the efficiency of its pro cessing industry, and lowering transport and marketing related costs.
11
Table 3.4 Comparison of Coffee Processing Costs (1990 prices)
Country, Type of Coffee Grading, Bagging and MarketingCost of Milling, Cost of Processing
Kenya, Arabica $41/ton $176/ton
Costa Rica, higher valued Arabica $66/ton $300/ton
Uganda, Robusta $126/ton $448/ton*
Source: World Bank Agriculture Sector Review, 1993.
* of which only $77 represents transport costs to the Coast.
The cost of processing Arabica in Uganda was estimated at UShs 201/kg in 1993 (approximatel y$200/ton). The producer pric e at this time was UShs 700/kg clean coffee, implying processing costs of 28percent of the farm price. A recent study concluded that prior to liberalization in 1991/92, the export taxand intermediary margins took away 70 to 80 percent of the realized world price. After the removal o ftaxes, liberalization of foreign exchange, and improvements in processing and marketing efficiency as aresult of liberalization and increased competition, coffee farmers now receive around 70 percent of th eworld market price (Bank of Uganda, 1994).
Kenya's smallholder processing costs vary considerably from one cooperative to another. A nexamination of these costs for 10 cooperative factories showed that they ranged from around $180 t o$340/ton clean coffee, compared to an estate factory c ost of $152/ton. If efficiency can be measured by thepercentage of gross cherry price received by farmers, which ranged from 5 9 percent for inefficient factoriesto 78 percent for well-managed ones, then the majority of factories could be judged as inefficient. Highcooperative costs are largely attributed to:
High labor costs (KShs 6,000/ton for some cooperatives versus KShs 1,000/ton clean coffee for estatefactories). Most of the cooperative s tend to over-employ, as many managers gauge their popularity bythe number of persons employed.
Mismanagement, since many of the cooperative manage rs have little or no management skills. In mostcases, committee members are elected on the basis of political patronage.
Lack of incentives for managers to increase payments to farmers since Society Committee membersdo not draw a salary but are instead paid an allowance based on the number of meetings held (Nyoro,1994).
According to Nyoro (1993), if thre e improvements were to be made toward increasing processing andmarketing efficiency — improvements in labor management by coop eratives, increased capacity utilizationthrough closing some factories, and removal of the monopoly of CBK in auctioning coffee — coffe epayments to farmers as a proportion of FOB prices would increase from 57 percent in cooperatives to 77percent, and from 71 percent to 82 percent in estates.
12
Comparative Chemical Input CostsData on average input use for Uganda was not available, but budgets from th e cited secondary sources showUShs 48,000 - 196,000/ha spent on all chemical inputs for traditional and improved Arabica, respectively($51/ha - $208/ha, or $23-$92/acre).
In Kenya, the average amount spent per acre on chemical inputs ranged from $4.40 to $14.87 i n1991/92 across 4 districts, but was quite a bit higher for the 1992/93 "average input" budget, at $363/acre.As a comparison, it should be noted that in the 1992/93 low input scenario, farmers only spent $13/acre.Tanzanian coffee farmers appear to pay less than Kenyan or Ugandan farmers for pesticides and fungicides,but this was in 1992 when some input subsidies may have still been in effect. In Kenya, farmers ar eapplying on average 1.5 kgs/ha pesticides, whereas the Tanzanian crop budgets show higher applicationrates of 7.5 l/ha pesticides and 27.5 kgs/ha fungicide, which are probably not being applied by all farmers.However, widespread coffee leaf rust and coffee berry disease problems in Tanzania require farmers toapply fungicides or suffer much lower yields (i.e. higher per hectare costs). For the 1991/92 cropping year,the World Bank study estimated the cost of a fungicide spray program for Arabica in Tanzania at 2 5percent of direct production costs, and it attributes decreases in yields from around 400 kg/ha clean coffeein 1981/82 to some 230 kg/ha clean coffee in 1991/92 largely to the decline in the use of fungicides.
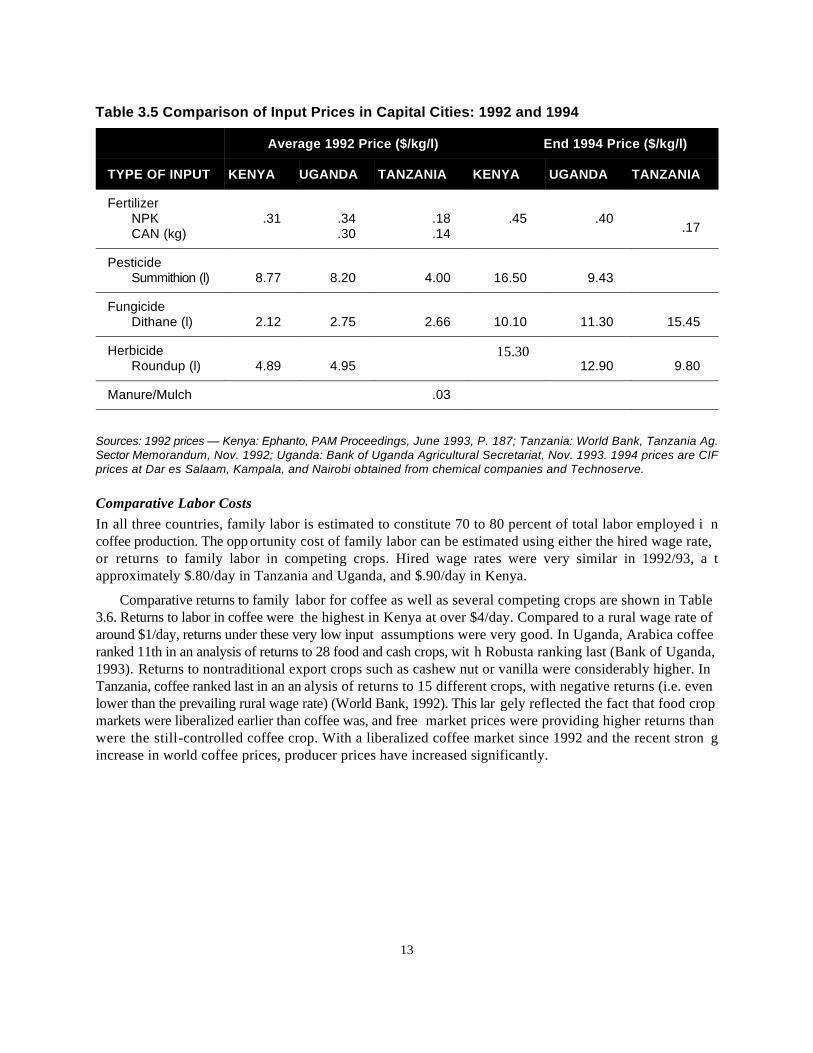
Since a comparison of actual amounts spent on chemicals is difficult due to such a large variation inthe amount of chemicals actually applied (and poor data on actual input levels), perhaps it is more usefulto compare the prices of these inputs across the three countries. Table 3.5 shows that these prices wer eremarkably similar in dollar terms in 1992, and showed no clear trend at the end of 1994. If anything, inputprices appear to be slightly higher in Kenya than in Uganda, which is sur prising given Uganda's land-lockedposition. Unfortunately it was beyond the scope of this study to examine these issues in more detail, butit would be interesting to find out more about how competitive these farm input industries are in eac hcountry and the reasons for the price differentials (e.g. high transport costs, few competitors, etc.).
13
Table 3.5 Comparison of Input Prices in Capital Cities: 1992 and 1994
TYPE OF INPUT KENYA UGANDA TANZANIA KENYA UGANDA TANZANIA
Average 1992 Price ($/kg/l) End 1994 Price ($/kg/l)
FertilizerNPK .31 .34 .18 .45 .40 CAN (kg) .30 .14
.17
Pesticide Summithion (l) 8.77 8.20 4.00 16.50 9.43
FungicideDithane (l) 2.12 2.75 2.66 10.10 11.30 15.45
HerbicideRoundup (l) 4.89 4.95 12.90 9.80
15.30
Manure/Mulch .03
Sources: 1992 prices — Kenya: Ephanto, PAM Proceedings, June 1993, P. 187; Tanzania: World Bank, Tanzania Ag.Sector Memorandum, Nov. 1992; Uganda: Bank of Uganda Agricultural Secretariat, Nov. 1993. 1994 prices are CIFprices at Dar es Salaam, Kampala, and Nairobi obtained from chemical companies and Technoserve.
Comparative Labor CostsIn all three countries, family labor is estimated to constitute 70 to 80 percent of total labor employed i ncoffee production. The opportunity cost of family labor can be estimated using either the hired wage rate,or returns to family labor in competing crops. Hired wage rates were very similar in 1992/93, a tapproximately $.80/day in Tanzania and Uganda, and $.90/day in Kenya.
Comparative returns to family labor for coffee as well as several competing crops are shown in Table3.6. Returns to labor in coffee were the highest in Kenya at over $4/day. Compared to a rural wage rate ofaround $1/day, returns under these very low input assumptions were very good. In Uganda, Arabica coffeeranked 11th in an analysis of returns to 28 food and cash crops, wit h Robusta ranking last (Bank of Uganda,1993). Returns to nontraditional export crops such as cashew nut or vanilla were considerably higher. InTanzania, coffee ranked last in an an alysis of returns to 15 different crops, with negative returns (i.e. evenlower than the prevailing rural wage rate) (World Bank, 1992). This lar gely reflected the fact that food cropmarkets were liberalized earlier than coffee was, and free market prices were providing higher returns thanwere the still-controlled coffee crop. With a liberalized coffee market since 1992 and the recent stron gincrease in world coffee prices, producer prices have increased significantly.
14
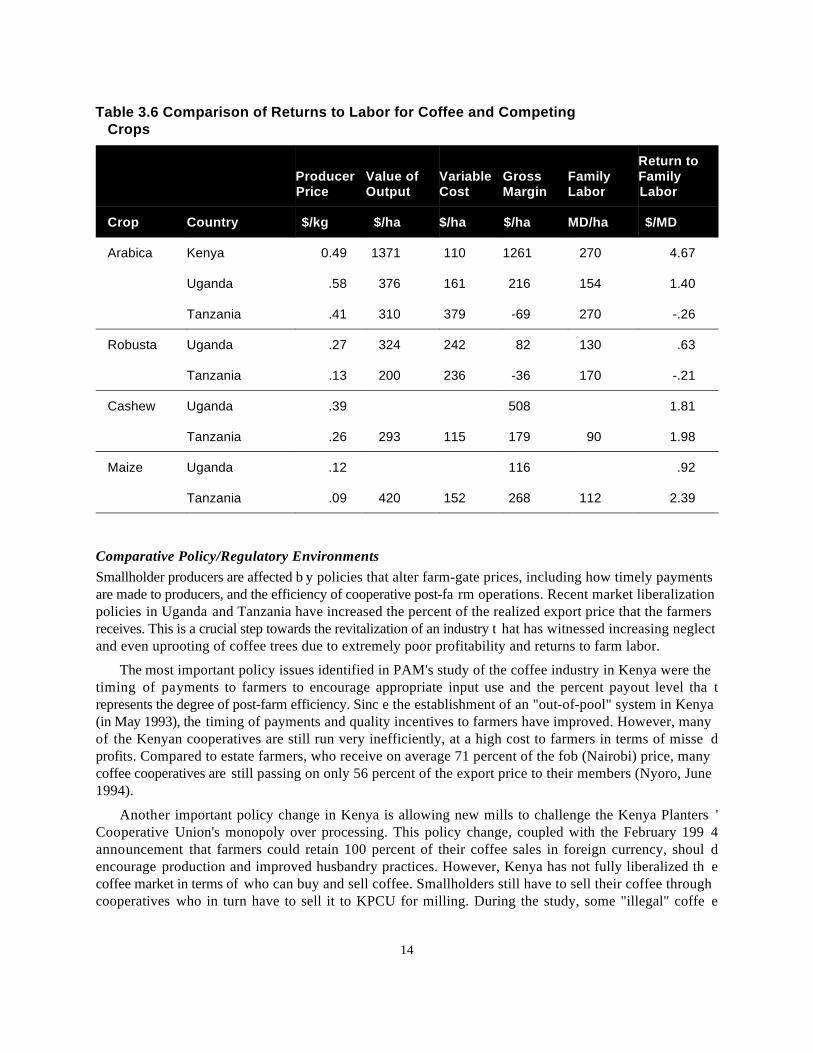
Table 3.6 Comparison of Returns to Labor for Coffee and CompetingCrops
Crop Country $/kg $/ha $/ha $/ha MD/ha $/MD
Producer Value of Variable Gross Family FamilyPrice Output Cost Margin Labor Labor
Return to
Arabica Kenya 0.49 1371 110 1261 270 4.67
Uganda .58 376 161 216 154 1.40
Tanzania .41 310 379 -69 270 -.26
Robusta Uganda .27 324 242 82 130 .63
Tanzania .13 200 236 -36 170 -.21
Cashew Uganda .39 508 1.81
Tanzania .26 293 115 179 90 1.98
Maize Uganda .12 116 .92
Tanzania .09 420 152 268 112 2.39
Comparative Policy/Regulatory EnvironmentsSmallholder producers are affected b y policies that alter farm-gate prices, including how timely paymentsare made to producers, and the efficiency of cooperative post-fa rm operations. Recent market liberalizationpolicies in Uganda and Tanzania have increased the percent of the realized export price that the farmersreceives. This is a crucial step towards the revitalization of an industry t hat has witnessed increasing neglectand even uprooting of coffee trees due to extremely poor profitability and returns to farm labor.
The most important policy issues identified in PAM's study of the coffee industry in Kenya were thetiming of payments to farmers to encourage appropriate input use and the percent payout level tha trepresents the degree of post-farm efficiency. Sinc e the establishment of an "out-of-pool" system in Kenya(in May 1993), the timing of payments and quality incentives to farmers have improved. However, manyof the Kenyan cooperatives are still run very inefficiently, at a high cost to farmers in terms of misse dprofits. Compared to estate farmers, who receive on average 71 percent of the fob (Nairobi) price, manycoffee cooperatives are still passing on only 56 percent of the export price to their members (Nyoro, June1994).
Another important policy change in Kenya is allowing new mills to challenge the Kenya Planters 'Cooperative Union's monopoly over processing. This policy change, coupled with the February 199 4announcement that farmers could retain 100 percent of their coffee sales in foreign currency, shoul dencourage production and improved husbandry practices. However, Kenya has not fully liberalized th ecoffee market in terms of who can buy and sell coffee. Smallholders still have to sell their coffee throughcooperatives who in turn have to sell it to KPCU for milling. During the study, some "illegal" coffe e
15
dealers were taken to court in Kisii for buying coffee from farmers and attempting to transport it and sellit in Uganda, where the recent market liberal ization has allowed private traders to purchase coffee directlyfrom farmers.
The two most important policies that effectively taxed coffee producers in all three countries unti lrecent years were producer price policies and fixed exchange rates (overvalued official exchange rate sincrease the price of export crops in dollar terms). These policies are now a thing of the past in all threecountries. Recent comparative advantage analyses for coffee in Ugan da and Tanzania revealed that the newGovernment policies were conducive to promote production of coffee. In other words, policies were n olonger implicitly taxing coffee farmers as they had in the past (World Bank, 1993, Bank of Uganda, 1994).
SUMMARY — LESSONS FROM COMPARING COFFEE COPThe comparison of COP across Kenya, Tanzania, and Uganda showed a lot of s imilarity when broken downinto the major cost categories. For the low national ave rage yield assumptions in Uganda and Tanzania andthe low input scenario in Kenya, total costs in each country were close to $500/ha. Coffee has been largelyneglected by the majority of farmers in all three countries until recently due to low world prices and poorgovernment policies coupled with cooperative inefficiencies that effectively kept producer prices at 5 0percent or less than the realized export price (although in Kenya this has generally been higher, at 60-70percent of the world price). This is reflected in declining yields and higher per hectare costs. This periodof declining input use and yields has corresponded to the period of liberalization, particularly in Ugandaand Tanzania, during which input subsidies were removed. In Tanzania, for example, the cost of producingArabica coffee has subsequently risen in nominal terms from under $100/ha. in 1989 to over $500/ha. in1992/93.
In terms of relative profitability a nd returns to labor, coffee fell substantially behind many other cropsin all three countries as well. In Uganda, returns to non -traditional export crops such as chilies, vanilla, andcardamom have returns twice as high as coffee. In Tanzania, returns to family labor devoted to coffe eproduction were negative in 1993, compared to $2.40/day for maize. Kenya had the highest returns at over$4/day under low input assumptions, and over $8/day under high input assumptions. Compared to rura lwage rates of approximately $1/day, these returns are fairly high for smallholders. The Kenyan lesson isthat higher input use and better management results in higher yields and better quality coffee, and it doespay off. Labor costs varied little across the three countries, at $.80 - $.90/day in 1992/93 (up to aroun d$1/day in 1994), with typically only 10-20 percent of labor used in coffee coming from outside the family.
Chemical input prices, often thought to be a major limiting constraint to higher input use and bette rcrop husbandry practices, also varied surprisingly little across the three countries. Input use, however ,varies significantly over time and between regions as well as countries, making actual cost comparisonsdifficult (i.e. chemical input costs/ha.). One informative comparison is between estate and smallholders'chemical input use levels in Kenya, where the large-scale farmers are spending up to 5 times as much onchemical inputs as smallholders and achieving yields up to 3.5 times as high (Crandall, 1993).
Since coffee remains such an important source of income for many smallholders as well as a vita lsource of foreign exchange in all three countries, the policy implications arising from this comparative COPexercise are clear. There is continued work to be done in each country in the following areas:
Increasing processing and marketing efficiency at the cooperative level.
Promoting competition among traders and millers (i.e. making su re market liberalization steps are fullyimplemented).
16
Committing increased resources to developing disease resistant and higher yielding coffee varieties.
Research into smallholder practice s regarding use of chemical inputs to gain a better understanding ofwhy such low levels are typically being used. It may be that with liberalization, chemical input pricesare beyond the reach of many smallholders, and properly target ed input subsidies should be considered.
Given the similarity of the research needs of the coffee industry in Kenya, Tanzania, and Uganda, itmay make sense to consider funding a regional coffee researc h center. This would avoid duplicative effortsand may be possible given the current policy environment and discussions of reviving the East Africa nCommunity.
The good news is that it appears that smallholders are currently responding to higher world coffe eprices quite quickly. They are once again spending time, effort, and money on their coffee trees an dincreasing production. One of the implications of this is the fact that farmers will not bother to us epurchased inputs until they perceive the rewards are great enough (in this case, the world price —processing and marketing costs). However, East African producers still only produce around five or si xpercent of world coffee output, and will remain residual players in the world market, unable to influenceworld price levels.
17
4. Comparative Cost ofProduction for Maize
Kenya, Uganda, and Tanzania
INTRODUCTIONMaize is by far the most important cereal crop in East Africa. It is the main staple food in most parts ofKenya and Tanzania. In Uganda, however, maize has not been widely adopted in the diet in most parts ofthe country, although it is becoming more popular among the urban population whose supply of th etraditional staples like matoke and millet is getting less and less reliable.
Maize production in Kenya takes place on both large-scale and small-scale farms. Large-scale farmsin Kenya account for about 20 to 30 percent of total production while smallholders account for 70 to 80percent. Large-scale maize growing is concentrated in the Kenyan highland districts of Trans Nzoia, UasinGishu, Nakuru, and parts of Kisii (Sotik Settlement) and Kakamega (Lugari) districts. These large-scalefarms are operated purely on commercial (profit-oriented) basis and employ high technology inputs likemachinery, agrochemicals and other purchased inputs. Small-scale farms, on the other hand, tend to growmaize for subsistence requirements, with occasional surpl us for sale in good years. The level of technologyemployed on these farms varies, being higher in some areas than in others. Intercropping of maize withbeans, millet, sorghum, and other minor crops is also a widespread practice among smallholders (se eAppendix 3 and Table A3.3 for Kenya). Data on intercropping for Tanzania and Uganda were not availableand comparison on intercropping costs are therefore not included.
In Uganda and Tanzania, maize is produced mainly by smallholders using hand cultivation ,occasionally supplemented by ox-cultivation or tractors.
The maize cost of production analysis for each country is based on what is regarded as representativeor average husbandry practices. In Uganda and Tanzania, this applies to an average smallholder. Th eanalysis for Kenya, however, is presented for both large-scale and small-scale farming systems.
COMPARATIVE COST OF PRODUCTION ANALYSIS FOR MAIZEDetailed COP tables for each of the countries are presented in Appendix 3. Here, the results ar esummarized and certain cost el ements highlighted in order to compare different cost categories across thethree countries. Table 4.1 pr esents a comparison of the COP of maize in Kenya, Tanzania, and Uganda in1993, and reveals the following:
In terms of total cost of production per hectare, Kenyan large-scale farmers are the highest cos tproducers of maize in the region, spending $770 per hectare. They are followed by smallholders i nKenya who spend half that amount, or $390 per hectare. Ugandan smallholders with their low inputtechnology come next with an estimated production cost of $242 per hectare. Tanzania, (at high inputtechnology), turns out to be the cheapest producer in the region at $239 per hectare.
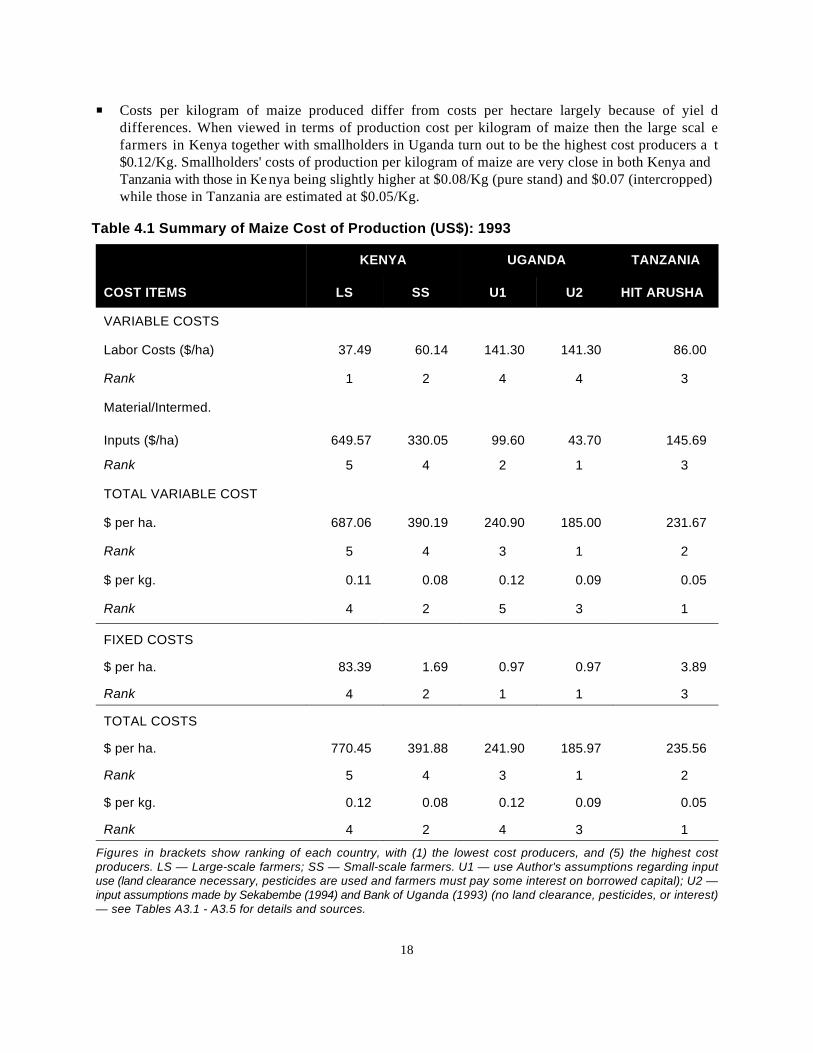
18
Costs per kilogram of maize produced differ from costs per hectare largely because of yiel ddifferences. When viewed in terms of production cost per kilogram of maize then the large scal efarmers in Kenya together with smallholders in Uganda turn out to be the highest cost producers a t$0.12/Kg. Smallholders' costs of production per kilogram of maize are very close in both Kenya andTanzania with those in Kenya being slightly higher at $0.08/Kg (pure stand) and $0.07 (intercropped)while those in Tanzania are estimated at $0.05/Kg.
Table 4.1 Summary of Maize Cost of Production (US$): 1993
KENYA UGANDA TANZANIA
COST ITEMS LS SS U1 U2 HIT ARUSHA
VARIABLE COSTS
Labor Costs ($/ha) 37.49 60.14 141.30 141.30 86.00
Rank 1 2 4 4 3
Material/Intermed.
Inputs ($/ha) 649.57 330.05 99.60 43.70 145.69
Rank 5 4 2 1 3
TOTAL VARIABLE COST
$ per ha. 687.06 390.19 240.90 185.00 231.67
Rank 5 4 3 1 2
$ per kg. 0.11 0.08 0.12 0.09 0.05
Rank 4 2 5 3 1
FIXED COSTS
$ per ha. 83.39 1.69 0.97 0.97 3.89
Rank 4 2 1 1 3
TOTAL COSTS
$ per ha. 770.45 391.88 241.90 185.97 235.56
Rank 5 4 3 1 2
$ per kg. 0.12 0.08 0.12 0.09 0.05
Rank 4 2 4 3 1
Figures in brackets show ranking of each country, with (1) the lowest cost producers, and (5) the highest costproducers. LS — Large-scale farmers; SS — Small-scale farmers. U1 — use Author's assumptions regarding inputuse (land clearance necessary, pesticides are used and farmers must pay some interest on borrowed capital); U2 —input assumptions made by Sekabembe (1994) and Bank of Uganda (1993) (no land clearance, pesticides, or interest)— see Tables A3.1 - A3.5 for details and sources.
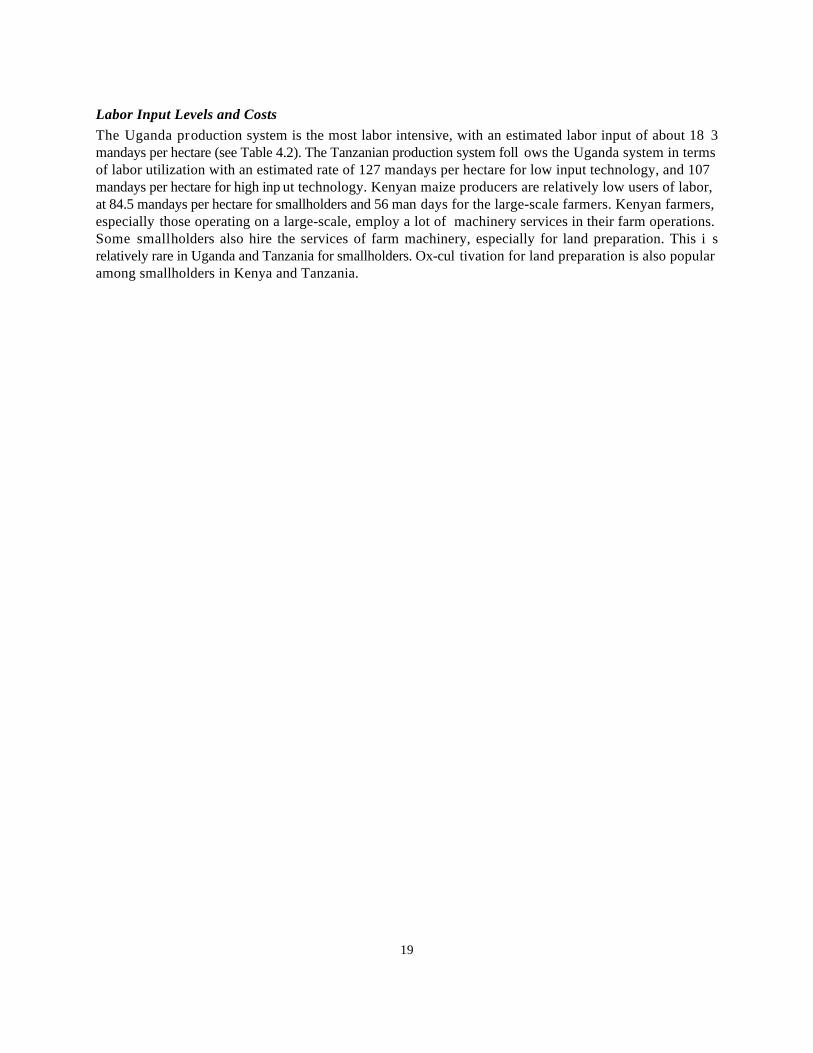
19
Labor Input Levels and CostsThe Uganda production system is the most labor intensive, with an estimated labor input of about 18 3mandays per hectare (see Table 4.2). The Tanzanian production system foll ows the Uganda system in termsof labor utilization with an estimated rate of 127 mandays per hectare for low input technology, and 107mandays per hectare for high inp ut technology. Kenyan maize producers are relatively low users of labor,at 84.5 mandays per hectare for smallholders and 56 man days for the large-scale farmers. Kenyan farmers,especially those operating on a large-scale, employ a lot of machinery services in their farm operations.Some smallholders also hire the services of farm machinery, especially for land preparation. This i srelatively rare in Uganda and Tanzania for smallholders. Ox-cul tivation for land preparation is also popularamong smallholders in Kenya and Tanzania.
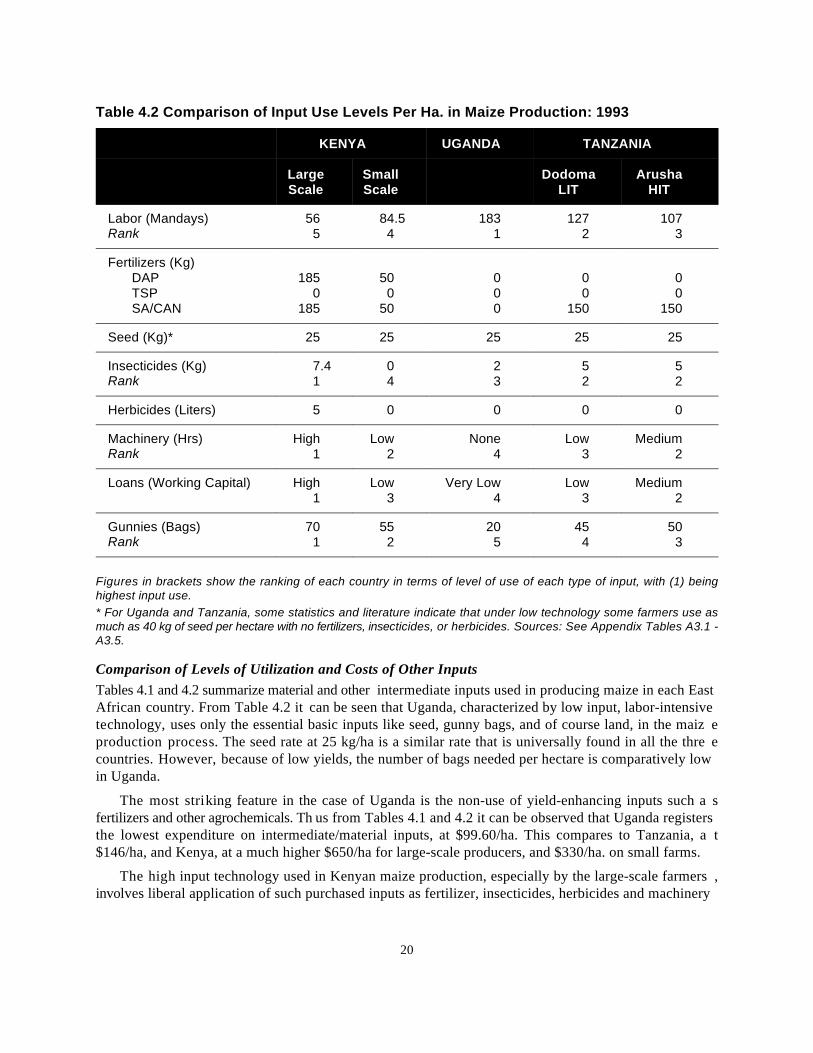
20
Table 4.2 Comparison of Input Use Levels Per Ha. in Maize Production: 1993
KENYA UGANDA TANZANIA
Large Small Dodoma ArushaScale Scale LIT HIT
Labor (Mandays) 56 84.5 183 127 107Rank 5 4 1 2 3
Fertilizers (Kg)DAP 185 50 0 0 0TSP 0 0 0 0 0SA/CAN 185 50 0 150 150
Seed (Kg)* 25 25 25 25 25
Insecticides (Kg) 7.4 0 2 5 5Rank 1 4 3 2 2
Herbicides (Liters) 5 0 0 0 0
Machinery (Hrs) High Low None Low MediumRank 1 2 4 3 2
Loans (Working Capital) High Low Very Low Low Medium1 3 4 3 2
Gunnies (Bags) 70 55 20 45 50Rank 1 2 5 4 3
Figures in brackets show the ranking of each country in terms of level of use of each type of input, with (1) beinghighest input use.* For Uganda and Tanzania, some statistics and literature indicate that under low technology some farmers use asmuch as 40 kg of seed per hectare with no fertilizers, insecticides, or herbicides. Sources: See Appendix Tables A3.1 -A3.5.
Comparison of Levels of Utilization and Costs of Other InputsTables 4.1 and 4.2 summarize material and other intermediate inputs used in producing maize in each EastAfrican country. From Table 4.2 it can be seen that Uganda, characterized by low input, labor-intensivetechnology, uses only the essential basic inputs like seed, gunny bags, and of course land, in the maiz eproduction process. The seed rate at 25 kg/ha is a similar rate that is universally found in all the thre ecountries. However, because of low yields, the number of bags needed per hectare is comparatively lowin Uganda.
The most striking feature in the case of Uganda is the non-use of yield-enhancing inputs such a sfertilizers and other agrochemicals. Th us from Tables 4.1 and 4.2 it can be observed that Uganda registersthe lowest expenditure on intermediate/material inputs, at $99.60/ha. This compares to Tanzania, a t$146/ha, and Kenya, at a much higher $650/ha for large-scale producers, and $330/ha. on small farms.
The high input technology used in Kenyan maize production, especially by the large-scale farmers ,involves liberal application of such purchased inputs as fertilizer, insecticides, herbicides and machinery
21
services. This explains why, on a per hectare basis, Kenyans are the highest cost producers in the region($770/ha for large-scale farmers and $390/ha for smallholders).
Table 4.3 shows the 1993 average prices of inputs in the three countries. Wage rates are close in thethree territories, but were slightly higher in Ug anda ($ 0.77/manday), followed by Kenya ($ 0.68/manday),and Tanzania ($ 0.67/manday). In terms of total labor costs, Uganda leads with high wage rates and labor-intensive technology, at an estimated expenditure of about $141/ha, followed by Tanzania and then Kenya.
Table 4.3 Comparative Prices/Cost of Selected Inputs and Labor Wage Rates (US$): 1993
INPUT UNIT KENYA UGANDA TANZANIA*
Prices per Unit (US$)
Labor Mandays 0.68 0.77 0.67Rank 2 1 3
Machinery/Tractor Hire Ha 33.56 60.33 19.44(for ploughing)Rank 2 1 3
Ox-Plough Hire Ha 30.20 33.78 16.67Rank 2 1 3
FertilizersDAP Kg 0.41 .29 .15RankTSP Kg 0.36 .29 .15RankSA/CAN Kg 0.36 .29 .11Rank
1 2 3
1 2 3
1 2 3
Maize SeedHybrid Kg 0.81 0.97 0.89RankLocal Kg 0.18 0.19 0.19Rank
3 1 2
3 1 1
InsecticideDust Kg 1.14 2.90 3.07RankLiquid Litre 8.31 11.58 4.00Rank
3 2 1
2 1 3
Gunnies Bag 1.02 0.10 0.11Rank 1 3 2
Bean Seed Kg 0.47 0.47 0.22Rank 1 1 2
Numbers in brackets show the ranking of the countries, (1) being the most expensive, (3) the least expensive.
* According to the World Bank (1993), subsidies on Tanzanian fertilizers and other agrochemicals were phased outgradually from 1990-1994/95. By 1993 these subsidies were around 20 percent. Sources: Kenya — author's fieldsurvey; Nyoro (1993); Tanzania — WB Ag. Sector Memorandum (1992), adjusted using data from Mdadila (1993) andBinamungu (1993); Uganda — Bank of Uganda Agricultural Secretariat Report (1993).
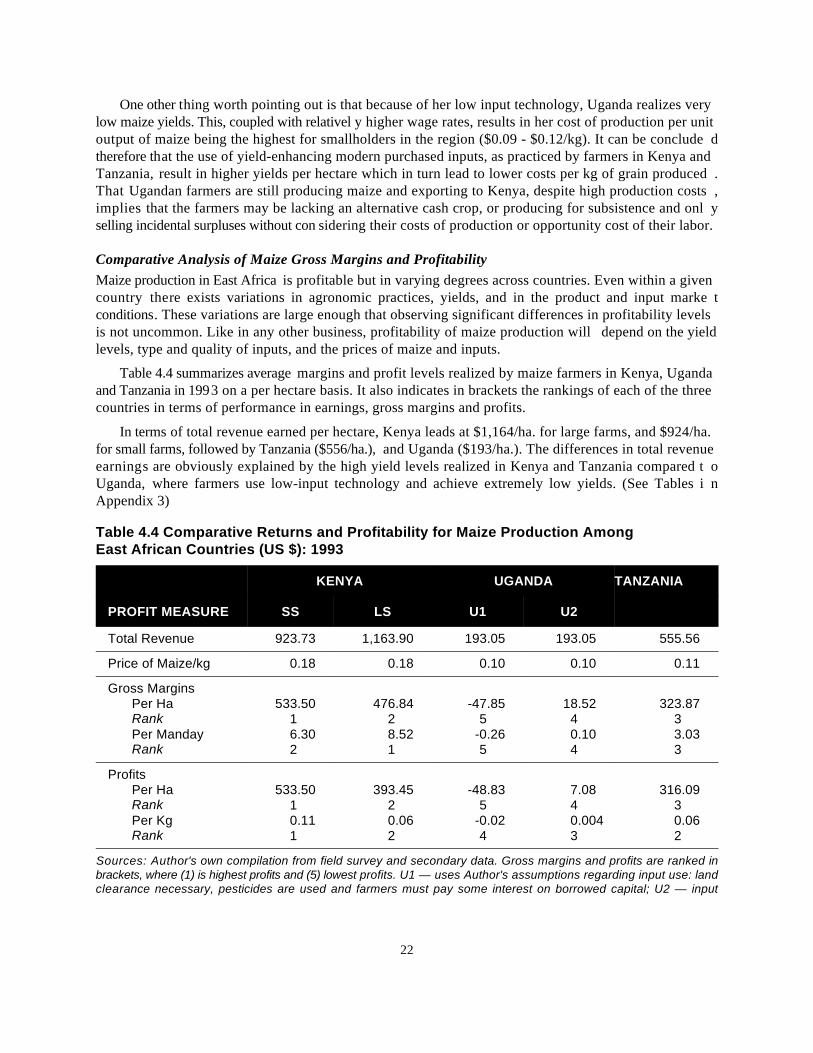
22
One other thing worth pointing out is that because of her low input technology, Uganda realizes verylow maize yields. This, coupled with relativel y higher wage rates, results in her cost of production per unitoutput of maize being the highest for smallholders in the region ($0.09 - $0.12/kg). It can be conclude dtherefore that the use of yield-enhancing modern purchased inputs, as practiced by farmers in Kenya andTanzania, result in higher yields per hectare which in turn lead to lower costs per kg of grain produced .That Ugandan farmers are still producing maize and exporting to Kenya, despite high production costs ,implies that the farmers may be lacking an alternative cash crop, or producing for subsistence and onl yselling incidental surpluses without con sidering their costs of production or opportunity cost of their labor.
Comparative Analysis of Maize Gross Margins and ProfitabilityMaize production in East Africa is profitable but in varying degrees across countries. Even within a givencountry there exists variations in agronomic practices, yields, and in the product and input marke tconditions. These variations are large enough that observing significant differences in profitability levelsis not uncommon. Like in any other business, profitability of maize production will depend on the yieldlevels, type and quality of inputs, and the prices of maize and inputs.
Table 4.4 summarizes average margins and profit levels realized by maize farmers in Kenya, Ugandaand Tanzania in 1993 on a per hectare basis. It also indicates in brackets the rankings of each of the threecountries in terms of performance in earnings, gross margins and profits.
In terms of total revenue earned per hectare, Kenya leads at $1,164/ha. for large farms, and $924/ha.for small farms, followed by Tanzania ($556/ha.), and Uganda ($193/ha.). The differences in total revenueearnings are obviously explained by the high yield levels realized in Kenya and Tanzania compared t oUganda, where farmers use low-input technology and achieve extremely low yields. (See Tables i nAppendix 3)
Table 4.4 Comparative Returns and Profitability for Maize Production Among East African Countries (US $): 1993
PROFIT MEASURE SS LS U1 U2
KENYA UGANDA TANZANIA
Total Revenue 923.73 1,163.90 193.05 193.05 555.56
Price of Maize/kg 0.18 0.18 0.10 0.10 0.11
Gross MarginsPer Ha 533.50 476.84 -47.85 18.52 323.87RankPer Manday 6.30 8.52 -0.26 0.10 3.03Rank
1 2 5 4 3
2 1 5 4 3
ProfitsPer Ha 533.50 393.45 -48.83 7.08 316.09RankPer Kg 0.11 0.06 -0.02 0.004 0.06Rank
1 2 5 4 3
1 2 4 3 2
Sources: Author's own compilation from field survey and secondary data. Gross margins and profits are ranked inbrackets, where (1) is highest profits and (5) lowest profits. U1 — uses Author's assumptions regarding input use: landclearance necessary, pesticides are used and farmers must pay some interest on borrowed capital; U2 — input
23
assumptions made by Sekabembe (1994) and Bank of Uganda (1993): i.e. no land clearance cost, pesticide use, orinterest charges — see Tables A3.1 - A3.5 for details and sources. See Appendix Tables A3.1 - A3.5 for details.
The gross margin analysis, on per hectare or per man-day basis, shows a similar pattern, with Kenyaleading again and Uganda with very low or negative gross margins (revenues - variable costs). Analysisof profit levels (revenues - total costs) re veals that on per hectare and per kilo basis, Kenyan producers aremaking higher profits than Tanzanian farmers who are in turn making more money than Uganda nsmallholders.
Maize price levels are highest in Kenya followed by Tanzania and Uganda. However, input prices arehighest in Uganda followed by Kenya and Ta nzania (Table 4.3). It would appear therefore that high yieldsand high maize prices, coupled with moderate input price levels, make Kenyan farmers earn higher profitsin maize than their counterparts in Uganda and Tanzania. Tanzanian farmers, on the other hand, wit hrelatively high maize yields and low input prices, realize better profits per hectare than Ugandan farmerswho get very low to negative profits per hectare or per kilogram of maize produced. Unless th eGovernment of Uganda adopts yield enhancing policy incentives like extension services and breeding ofhigh yield varieties, maize production in Uganda will remain unprofitable and will only be carried out bynoncommercially minded farmers who do not put hig h opportunity cost to their family labor or who do notuse borrowed capital. As noted already, the widespread belief that Ugandan soils are fertile and need nofertilizers needs to be addressed by a more aggressive extension effort and an improved fertilize rdistribution system.
Comparative Policy/Regulatory EnvironmentIn the past, all three countries had strict regulatory controls over marketing and pricing of maize. Thesepolicies were inherited from the past colonial governments, and resulted in the marketing of the grain bya monopoly parastatal. Direct government regulation and fixing of producer prices offered by suc hparastatals often suppressed t he farm-gate prices far below levels that would have prevailed in the case ofa free market. Such prices also tended to be uniform,(i.e. pan-territorial and pan-seasonal) across th ecountry. It has been argued that these policies often discouraged farmers who then reduced maiz eproduction (Lofchie, 1989, Odhiambo, et al, 1994).
With the recent adaptation of the SAPs, and the subseq uent market liberalization in the three countries,maize marketing has been freed of all government and parastatal regulatory restrictions. The free trad eregime has excited both producers and traders w ho feel they now have some incentives to engage in maizeproduction and marketing as a business undertaking. The impact of the Structural Adjustment Programson maize and other grain marketing has not been documented, but early indications are that the incentivestructure is there both at the farm level and at the market level. Farmers and traders in Uganda an dTanzania seem to find the new found freedom encouraging. In Kenya, the initial reactions from bot hfarmers and traders was one of optimism. However, of late (1994) Kenyan farmers have been heard t ocomplain of being unable to compete with cheap maize imports coming into the country. In response theGovernment of Kenya imposed a temporary ban on maize imports in August 1994 which has since beenreplaced by the imposition of a variable duty levy on such imports as a protection to the local farmers.
SUMMARY — LESSONS FROM COMPARING MAIZE COPThe COP analysis shows that maize production in East Africa is carried out under varying levels of inputuse technologies and standard of crop husbandry. The leve ls of cost and profits also vary considerably. Thehigh levels of input use and good crop management found among the large scale farmers and som esmallholders in Kenya result in higher yields and higher profits per hectare. Tanzanian farmers practicing
24
medium to high input technology come second to Kenya in terms of yields and profitability in maiz eproduction.
However, in terms of costs per hectare, the use of yield enhancing purchased inputs as practiced b ysome Kenyan and Tanzanian farmers leads to relatively higher costs, compared to those of thei rcounterparts in Uganda who currently do not use such inputs. On the basis of costs of production pe rKilogram of maize, the study indicates that Uganda with her low input levels and yields is a higher costproducer than Kenya and Tanzania. There is ro om for improvement in the production of maize in Uganda.There is therefore need to institute research and extension policies that would help improve crop husbandryand yields at the farm level. The implications of this is that the Ugandan government and donor agenciesshould look into the following areas of policy:
Investment in maize research to produce high yielding varieties that would be made available t ofarmers. Currently, the majority of Ugandan farmers use local (unimproved) maize seed. Mor eresearch should also be concentr ated on agronomic practices that could be developed as a package forfarmers.
Developing a strong extension service to advise farmers on r ecommended practices for maize growing.
Developing marketing infrastructure and market information for both inputs and maize. This wil lensure that farmers can get the inputs readily and also sell their products at profitable prices.
For Kenya and Tanzania, more efforts should be made and incentives provided to bring mor esmallholders to higher yield levels comparable to smallholder yie lds used in this study for Kenya. One suchpolicy incentive is the development of appropriate marketing infrastructure and a market informatio nsystem that includes inter-regional markets.
Finally the problem of seed production could be tackled as a regional issue where by the three Eas tAfrican countries with the help of donor funding could embark on regional collaborative research in maizebreeding and production of new hybrids for the various agroecological zon e in the three countries. PresentlyKenya has developed many hybrid varieties which could be bulk ed in adequate quantities for commerciallydistribution to Uganda and Tanzania. The Kenya Seed Company could be expand to produce maize seedfor the whole region. Alternatively, more private seed companies could be encouraged to work on see dproduction for the East African region. In Zimbabwe for example, an American Seed Company has juststarted seed production on a large scale for the Southern African region and the feasibility of a simila rproject could be looked into for East Africa.
25
5. Comparative Cost of ProductionAnalysis for Beans
INTRODUCTIONBeans in all the three countries of East Afric a has been largely regarded as a smallholder subsistence crop.However, its production is now so widespread that in some parts of Eas t Africa it has managed to grow intoan important cash crop planted to supplement farm incomes from traditional crops.
COMPARISON OF TOTAL AND VARIABLE COSTS FOR BEANSAs is the case with maize, the cost of production analysis for beans for each country is discussed in moredetail in Appendix 4. Table 5.1 presents the comparati ve analysis of COP for beans in Kenya, Uganda, andTanzania. It shows, as in the case of maize, that Kenya is the highest cost producer of beans in the regionon per hectare basis. A pure stand of beans costs about $392/ha. to produce in Kenya, compared to $207-$232 in Uganda, and $91-$93 in Tanza nia. When analyzed on the basis of cost of production per kilogramof beans produced, the low yields achieved by Ugandan farmers resu lt in the highest costs at $.26 - $.29/kg.Kenyan beans are produced at a cost of around $ .18/kg for pure stand and $0.07/kg for intercropped, whilein Tanzania pure stand beans cost approximately from $0.07 - $.09/kg to produce. No data were availableon intercropping production systems for both maize and beans in Uganda and Tanzania, although th epractice is widespread in the two countries.
The cost of purchased inputs used in Kenya may make it the most expensive bean producer on a perhectare basis. However, Uganda, with its labor-intens ive production system coupled with a high wage rate,turns out to be the highest cost producer on a per kilogram basi s, despite negligible use of purchased inputs.One of the assumptions behi nd the Uganda COP budget was fairly high fixed costs relative to the budgetsfor Kenya and Tanzania (U1 in Table 5.1). Since there was no apparent reason why this should be so, thiscost element was reduced for this analysis (U2 in Table 5.1). Even when fix ed costs are assumed to be zero,Uganda remains the highest cost producer of beans in the region.
Analysis in terms of variable costs gives a similar picture to the total cost comparison analysis. Kenya'stotal variable cost are more heavily weighted by materi al intermediate inputs and less by labor costs. In thecase of Uganda, the greatest proportion of total variable costs is a ccounted for by labor. Total variable costsin Tanzania are relatively low, a nd it still stands as the least cost producer when judged on a total variablecosts criteria. Fixed costs, as expected under smallholder conditions, are negligible in Kenya and Tanzania,and as explained above, were quite high (at $18/ha.) in the Uganda budget, but reduced for the purposesof this comparative analysis.
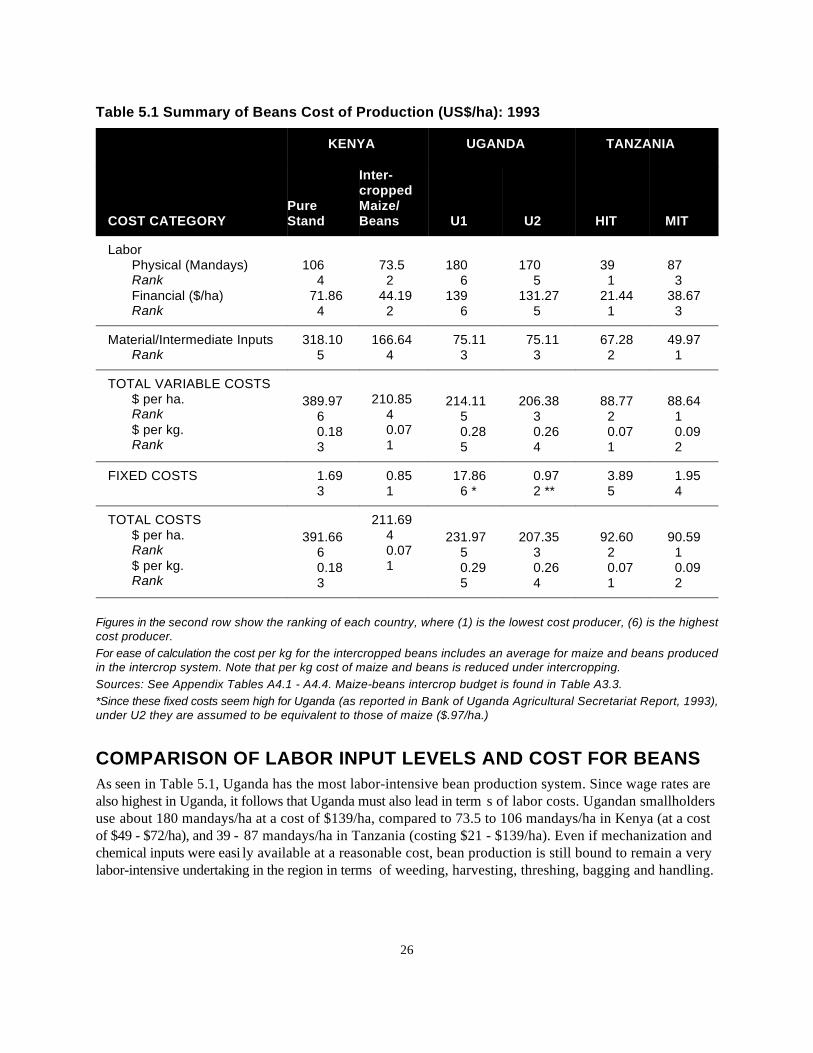
26
Table 5.1 Summary of Beans Cost of Production (US$/ha): 1993
COST CATEGORY Stand Beans U1 U2 HIT MIT
KENYA UGANDA TANZANIA
Pure Maize/
Inter-cropped
LaborPhysical (Mandays) 106 73.5 180 170 39 87RankFinancial ($/ha) 71.86 44.19 139 131.27 21.44 38.67Rank
4 2 6 5 1 3
4 2 6 5 1 3
Material/Intermediate Inputs 318.10 166.64 75.11 75.11 67.28 49.97Rank 5 4 3 3 2 1
TOTAL VARIABLE COSTS $ per ha. 210.85Rank$ per kg. 0.07Rank
389.97 214.11 206.38 88.77 88.646 5 3 2 10.18 0.28 0.26 0.07 0.093 5 4 1 2
4
1
FIXED COSTS 1.69 0.85 17.86 0.97 3.89 1.953 1 6.* 2.** 5 4
TOTAL COSTS 211.69$ per ha. 4Rank$ per kg. 1Rank
391.66 231.97 207.35 92.60 90.596 5 3 2 10.18 0.29 0.26 0.07 0.093 5 4 1 2
0.07
Figures in the second row show the ranking of each country, where (1) is the lowest cost producer, (6) is the highestcost producer.For ease of calculation the cost per kg for the intercropped beans includes an average for maize and beans producedin the intercrop system. Note that per kg cost of maize and beans is reduced under intercropping.Sources: See Appendix Tables A4.1 - A4.4. Maize-beans intercrop budget is found in Table A3.3.*Since these fixed costs seem high for Uganda (as reported in Bank of Uganda Agricultural Secretariat Report, 1993),under U2 they are assumed to be equivalent to those of maize ($.97/ha.)
COMPARISON OF LABOR INPUT LEVELS AND COST FOR BEANSAs seen in Table 5.1, Uganda has the most labor-intensive bean production system. Since wage rates arealso highest in Uganda, it follows that Uganda must also lead in term s of labor costs. Ugandan smallholdersuse about 180 mandays/ha at a cost of $139/ha, compared to 73.5 to 106 mandays/ha in Kenya (at a costof $49 - $72/ha), and 39 - 87 mandays/ha in Tanzania (costing $21 - $139/ha). Even if mechanization andchemical inputs were easi ly available at a reasonable cost, bean production is still bound to remain a verylabor-intensive undertaking in the region in terms of weeding, harvesting, threshing, bagging and handling.
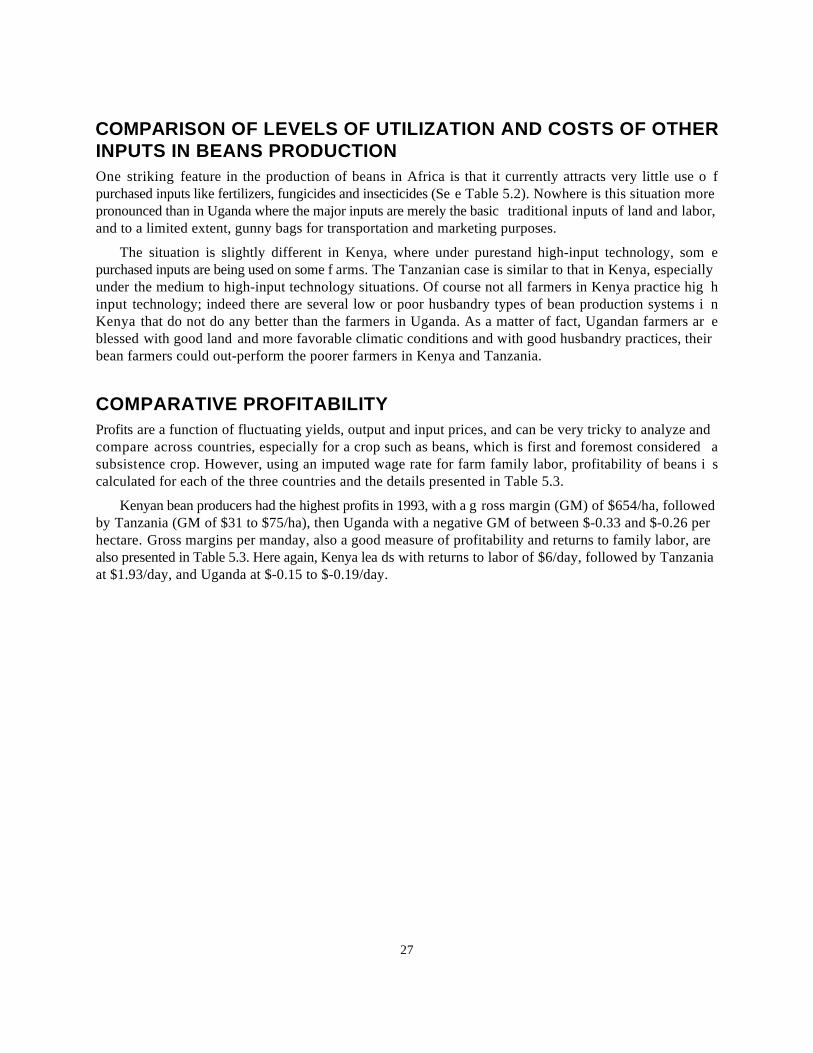
27
COMPARISON OF LEVELS OF UTILIZATION AND COSTS OF OTHERINPUTS IN BEANS PRODUCTIONOne striking feature in the production of beans in Africa is that it currently attracts very little use o fpurchased inputs like fertilizers, fungicides and insecticides (Se e Table 5.2). Nowhere is this situation morepronounced than in Uganda where the major inputs are merely the basic traditional inputs of land and labor,and to a limited extent, gunny bags for transportation and marketing purposes.
The situation is slightly different in Kenya, where under purestand high-input technology, som epurchased inputs are being used on some f arms. The Tanzanian case is similar to that in Kenya, especiallyunder the medium to high-input technology situations. Of course not all farmers in Kenya practice hig hinput technology; indeed there are several low or poor husbandry types of bean production systems i nKenya that do not do any better than the farmers in Uganda. As a matter of fact, Ugandan farmers ar eblessed with good land and more favorable climatic conditions and with good husbandry practices, theirbean farmers could out-perform the poorer farmers in Kenya and Tanzania.
COMPARATIVE PROFITABILITYProfits are a function of fluctuating yields, output and input prices, and can be very tricky to analyze andcompare across countries, especially for a crop such as beans, which is first and foremost considered asubsistence crop. However, using an imputed wage rate for farm family labor, profitability of beans i scalculated for each of the three countries and the details presented in Table 5.3.
Kenyan bean producers had the highest profits in 1993, with a g ross margin (GM) of $654/ha, followedby Tanzania (GM of $31 to $75/ha), then Uganda with a negative GM of between $-0.33 and $-0.26 perhectare. Gross margins per manday, also a good measure of profitability and returns to family labor, arealso presented in Table 5.3. Here again, Kenya lea ds with returns to labor of $6/day, followed by Tanzaniaat $1.93/day, and Uganda at $-0.15 to $-0.19/day.
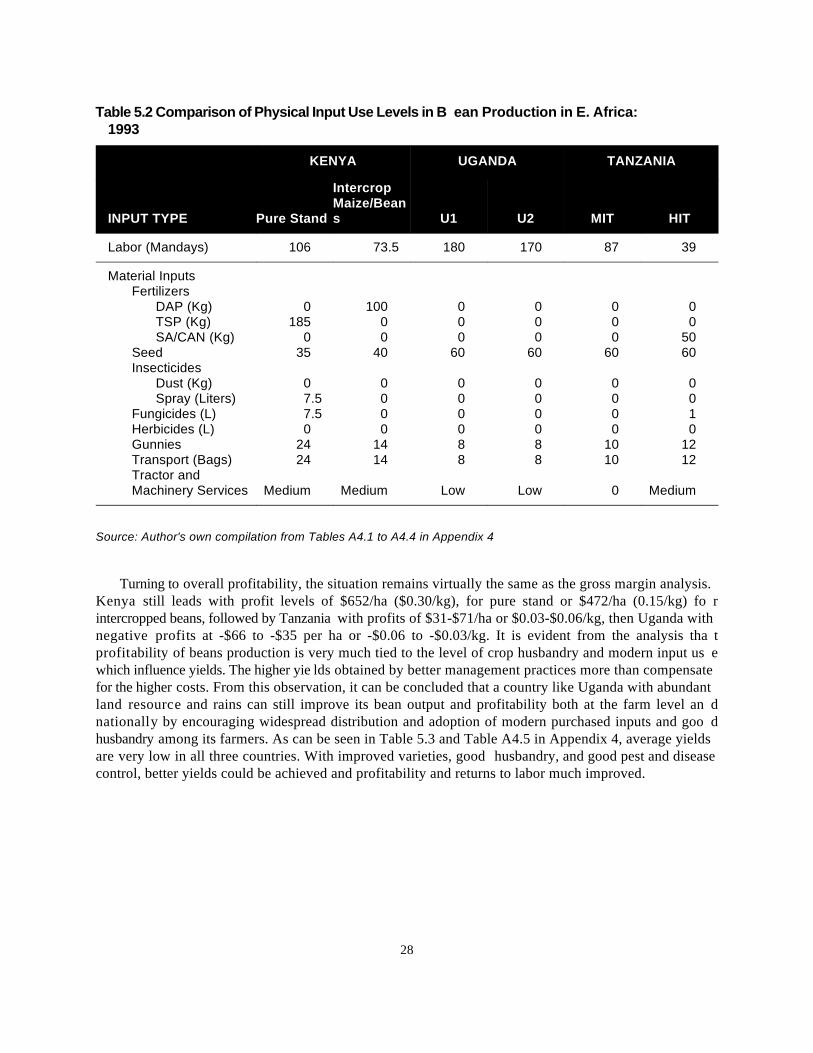
28
Table 5.2 Comparison of Physical Input Use Levels in B ean Production in E. Africa:1993
INPUT TYPE Pure Stand s U1 U2 MIT HIT
KENYA UGANDA TANZANIA
IntercropMaize/Bean
Labor (Mandays) 106 73.5 180 170 87 39
Material InputsFertilizers
DAP (Kg) 0 100 0 0 0 0 TSP (Kg) 185 0 0 0 0 0 SA/CAN (Kg) 0 0 0 0 0 50
Seed 35 40 60 60 60 60Insecticides
Dust (Kg) 0 0 0 0 0 0 Spray (Liters) 7.5 0 0 0 0 0
Fungicides (L) 7.5 0 0 0 0 1Herbicides (L) 0 0 0 0 0 0Gunnies 24 14 8 8 10 12Transport (Bags) 24 14 8 8 10 12Tractor andMachinery Services Medium Medium Low Low 0 Medium
Source: Author's own compilation from Tables A4.1 to A4.4 in Appendix 4
Turning to overall profitability, the situation remains virtually the same as the gross margin analysis.Kenya still leads with profit levels of $652/ha ($0.30/kg), for pure stand or $472/ha (0.15/kg) fo rintercropped beans, followed by Tanzania with profits of $31-$71/ha or $0.03-$0.06/kg, then Uganda withnegative profits at -$66 to -$35 per ha or -$0.06 to -$0.03/kg. It is evident from the analysis tha tprofitability of beans production is very much tied to the level of crop husbandry and modern input us ewhich influence yields. The higher yie lds obtained by better management practices more than compensatefor the higher costs. From this observation, it can be concluded that a country like Uganda with abundantland resource and rains can still improve its bean output and profitability both at the farm level an dnationally by encouraging widespread distribution and adoption of modern purchased inputs and goo dhusbandry among its farmers. As can be seen in Table 5.3 and Table A4.5 in Appendix 4, average yieldsare very low in all three countries. With improved varieties, good husbandry, and good pest and diseasecontrol, better yields could be achieved and profitability and returns to labor much improved.
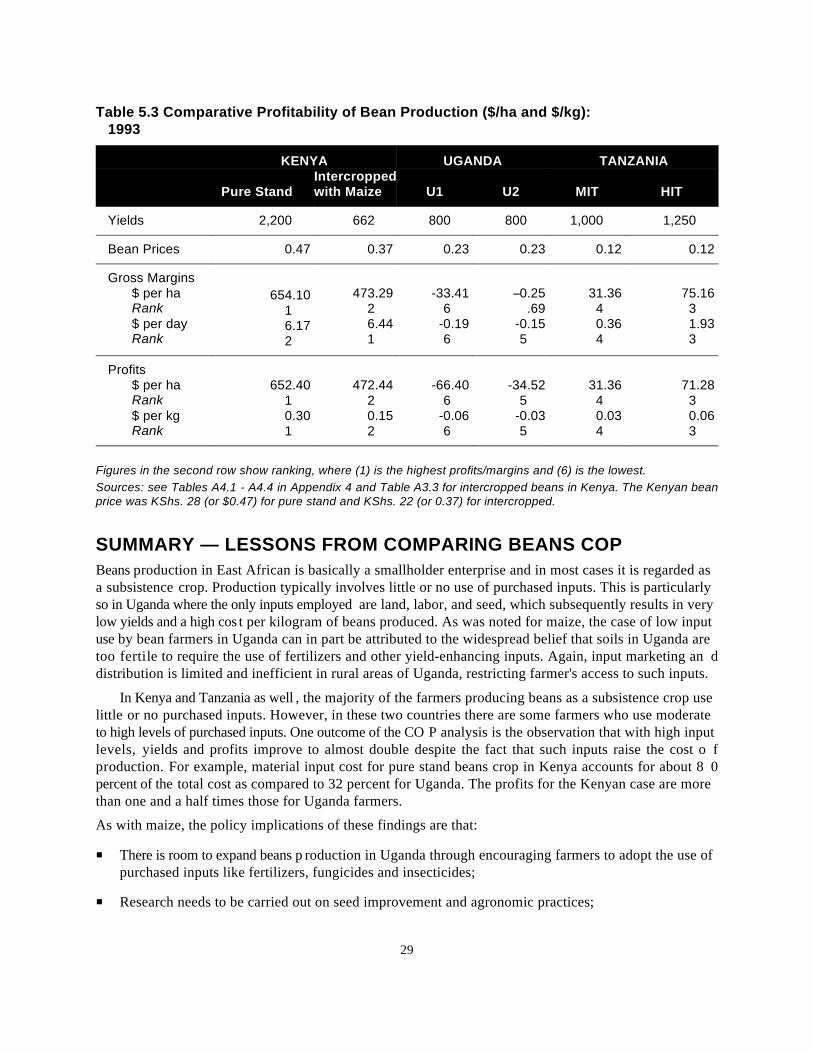
29
Table 5.3 Comparative Profitability of Bean Production ($/ha and $/kg):1993
KENYA UGANDA TANZANIA
Pure Stand with Maize U1 U2 MIT HITIntercropped
Yields 2,200 662 800 800 1,000 1,250
Bean Prices 0.47 0.37 0.23 0.23 0.12 0.12
Gross Margins$ per ha 473.29 -33.41 0.25 31.36 75.16Rank$ per day 6.44 -0.19 -0.15 0.36 1.93Rank
654.1016.172
2 6 .69 4 3
1 6 5 4 3
Profits$ per ha 652.40 472.44 -66.40 -34.52 31.36 71.28Rank$ per kg 0.30 0.15 -0.06 -0.03 0.03 0.06Rank
1 2 6 5 4 3
1 2 6 5 4 3
Figures in the second row show ranking, where (1) is the highest profits/margins and (6) is the lowest.Sources: see Tables A4.1 - A4.4 in Appendix 4 and Table A3.3 for intercropped beans in Kenya. The Kenyan beanprice was KShs. 28 (or $0.47) for pure stand and KShs. 22 (or 0.37) for intercropped.
SUMMARY — LESSONS FROM COMPARING BEANS COPBeans production in East African is basically a smallholder enterprise and in most cases it is regarded asa subsistence crop. Production typically involves little or no use of purchased inputs. This is particularlyso in Uganda where the only inputs employed are land, labor, and seed, which subsequently results in verylow yields and a high cos t per kilogram of beans produced. As was noted for maize, the case of low inputuse by bean farmers in Uganda can in part be attributed to the widespread belief that soils in Uganda aretoo fertile to require the use of fertilizers and other yield-enhancing inputs. Again, input marketing an ddistribution is limited and inefficient in rural areas of Uganda, restricting farmer's access to such inputs.
In Kenya and Tanzania as well , the majority of the farmers producing beans as a subsistence crop uselittle or no purchased inputs. However, in these two countries there are some farmers who use moderateto high levels of purchased inputs. One outcome of the CO P analysis is the observation that with high inputlevels, yields and profits improve to almost double despite the fact that such inputs raise the cost o fproduction. For example, material input cost for pure stand beans crop in Kenya accounts for about 8 0percent of the total cost as compared to 32 percent for Uganda. The profits for the Kenyan case are morethan one and a half times those for Uganda farmers.
As with maize, the policy implications of these findings are that:
There is room to expand beans p roduction in Uganda through encouraging farmers to adopt the use ofpurchased inputs like fertilizers, fungicides and insecticides;
Research needs to be carried out on seed improvement and agronomic practices;
30
More must be done in terms of impr oving extension services to encourage farmers to adopt good crophusbandry in order to improve their yields.
Admittedly, many smallholders in Kenya and Tanzania als o still use little or no purchased inputs in theproduction of beans. They too require government policy incentives that would help them adop trecommended practices and boost their yields so as to earn higher profits from beans. The recent marketliberalization in the three countries will definitely he lp farmers get good prices but other incentives like thedevelopment of market infrastructure and a good marketing information system will be required to makethe market more transparent and efficient. Kenya and Tanzania h ave already embarked on the developmentand strengthening of agricultural marketing information services, with market prices broadcast over th eradio and published in the newspapers, and hopefully such services will be improved and sustainable in thelong-run.
31
6. Comparative Cost of ProductionAnalysis for Potatoes
Kenya, Tanzania, and Uganda
Potatoes were chosen for this study as a represen tative vegetable crop that has been growing in importancein East African's diets in recent years. It is typically grown for both home consumption and for sale, withfarmers retaining part of the crop for seed. In some areas (such as Meru in Kenya), potato farmers ar emuch more commercialized, producing primarily for sale.
Kenya produces more potatoes, in total tons, than any of its southern, eastern, or central Africa nneighbors, at 730,000 tons, or 32.6 kgs/capita/year (FAO Production Yearbook, 1988). Tanzania produces9 kgs/capita/year (223,000 tons), and Uganda produces 9.7 kgs/capita/year (158,000 tons).
Potato production is most suited to elevations of between 1500 and 2500 meters. In Kenya, this areais concentrated along the high points of the Rift Valley, around Mount Kenya, and in the Aberdar eMountain Range. In Uganda , potatoes are found primarily in Kabale district near the Rwanda border, andin the highland areas in easter n Uganda near Mount Elgon. In Tanzania, the major potato production zoneis the Southern Highlands, and they are also found in the higher elevation area near Arusha (Moun tKilimanjaro). In the higher elevation areas of all t hree countries (above 2,000 meters), three crops per yearare possible depending on rainfall distribution. At lower elevations two crops per year are typical. In theArusha area of Tanzania, there is a unimodal rainfall pattern allowing only one potato crop per year.
The potato is a fast maturing crop with harvesting possible two months after planting. In the highlandareas where farmers can complete three cropping seasons of potatoes in a year, potatoes produce seve ntimes more kilograms per hectare than maize, which takes 9 to 12 months to mature. Therefore, potatoesreplace maize as the main source of starch in many of these areas.
SMALLHOLDER POTATO PRODUCTIONMost of the potato production in Eastern Africa comes from smallholders. In Uganda, the average farmsize for potato producers is 10 acres, with an average potato plot size of .25 acres. Nearly 75 percent ofKenyan potato farmers are cultivating on less than two hectares (4.5 acres) of land.
The potato crop is fairly difficult to grow, and is quite demanding with respect to disease and pes tcontrol and soil fertility. A sound crop rot ation can be an effective means of satisfying these demands, andit is recommended that potatoes be planted not more than once in four seasons. However, due to lan dshortage and population pressure, this recommendation is not f ollowed in all regions or by all smallholders.
POTATO COST OF PRODUCTION BUDGETSUnfortunately, secondary potato COP data was unavailable for Uganda and Tanzania, making a cross -country comparison impossible without first undertaking farm-level surveys. Secondary COP data wa savailable for Kenya (from the PAM team), and will become available shortly for Uganda, where a farm-level survey of potato producers has just been finished.
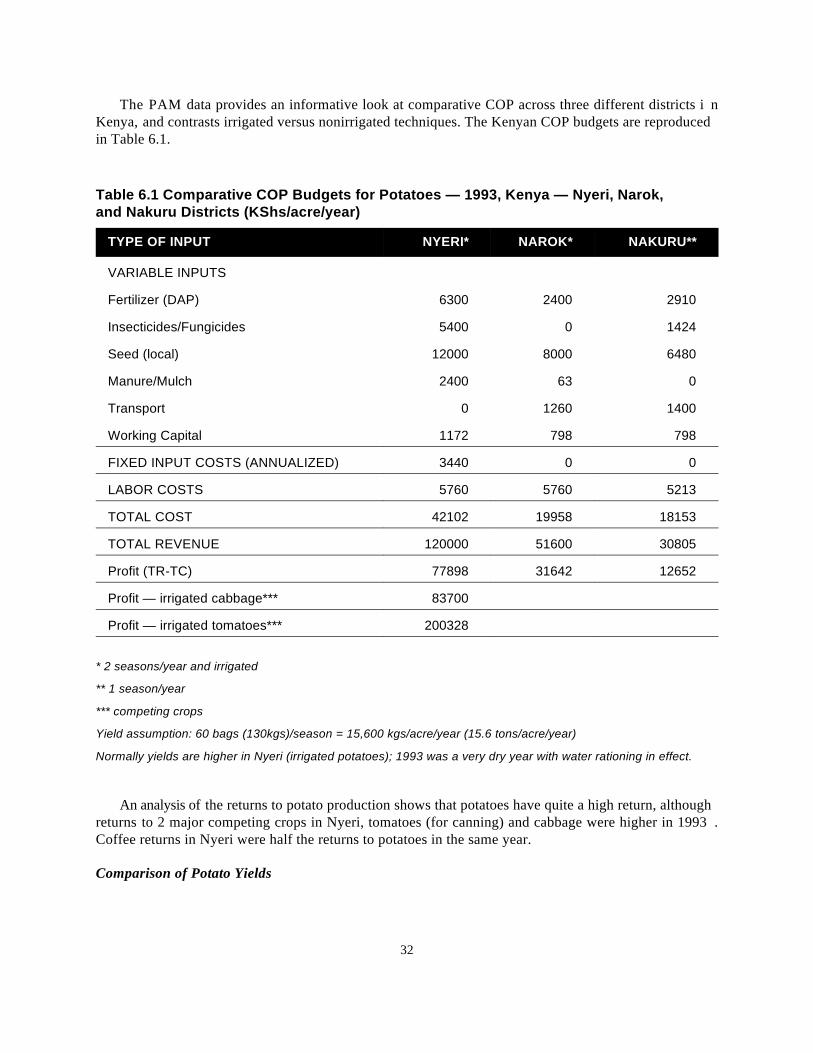
32
The PAM data provides an informative look at comparative COP across three different districts i nKenya, and contrasts irrigated versus nonirrigated techniques. The Kenyan COP budgets are reproducedin Table 6.1.
Table 6.1 Comparative COP Budgets for Potatoes — 1993, Kenya — Nyeri, Narok, and Nakuru Districts (KShs/acre/year)
TYPE OF INPUT NYERI* NAROK* NAKURU**
VARIABLE INPUTS
Fertilizer (DAP) 6300 2400 2910
Insecticides/Fungicides 5400 0 1424
Seed (local) 12000 8000 6480
Manure/Mulch 2400 63 0
Transport 0 1260 1400
Working Capital 1172 798 798
FIXED INPUT COSTS (ANNUALIZED) 3440 0 0
LABOR COSTS 5760 5760 5213
TOTAL COST 42102 19958 18153
TOTAL REVENUE 120000 51600 30805
Profit (TR-TC) 77898 31642 12652
Profit — irrigated cabbage*** 83700
Profit — irrigated tomatoes*** 200328
* 2 seasons/year and irrigated
** 1 season/year
*** competing crops
Yield assumption: 60 bags (130kgs)/season = 15,600 kgs/acre/year (15.6 tons/acre/year)
Normally yields are higher in Nyeri (irrigated potatoes); 1993 was a very dry year with water rationing in effect.
An analysis of the returns to potato production shows that potatoes have quite a high return, althoughreturns to 2 major competing crops in Nyeri, tomatoes (for canning) and cabbage were higher in 1993 .Coffee returns in Nyeri were half the returns to potatoes in the same year.
Comparison of Potato Yields
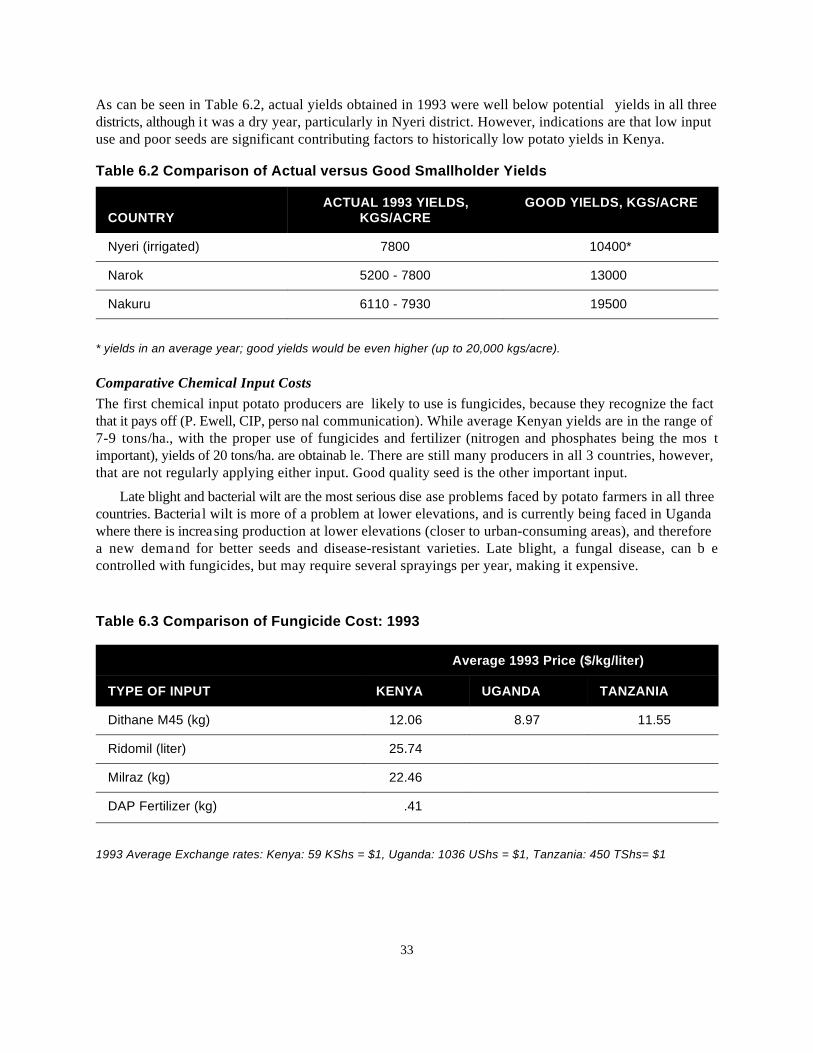
33
As can be seen in Table 6.2, actual yields obtained in 1993 were well below potential yields in all threedistricts, although it was a dry year, particularly in Nyeri district. However, indications are that low inputuse and poor seeds are significant contributing factors to historically low potato yields in Kenya.
Table 6.2 Comparison of Actual versus Good Smallholder Yields
COUNTRY KGS/ACREACTUAL 1993 YIELDS, GOOD YIELDS, KGS/ACRE
Nyeri (irrigated) 7800 10400*
Narok 5200 - 7800 13000
Nakuru 6110 - 7930 19500
* yields in an average year; good yields would be even higher (up to 20,000 kgs/acre).
Comparative Chemical Input CostsThe first chemical input potato producers are likely to use is fungicides, because they recognize the factthat it pays off (P. Ewell, CIP, perso nal communication). While average Kenyan yields are in the range of7-9 tons/ha., with the proper use of fungicides and fertilizer (nitrogen and phosphates being the mos timportant), yields of 20 tons/ha. are obtainab le. There are still many producers in all 3 countries, however,that are not regularly applying either input. Good quality seed is the other important input.
Late blight and bacterial wilt are the most serious dise ase problems faced by potato farmers in all threecountries. Bacterial wilt is more of a problem at lower elevations, and is currently being faced in Ugandawhere there is increasing production at lower elevations (closer to urban-consuming areas), and thereforea new demand for better seeds and disease-resistant varieties. Late blight, a fungal disease, can b econtrolled with fungicides, but may require several sprayings per year, making it expensive.
Table 6.3 Comparison of Fungicide Cost: 1993
TYPE OF INPUT KENYA UGANDA TANZANIA
Average 1993 Price ($/kg/liter)
Dithane M45 (kg) 12.06 8.97 11.55
Ridomil (liter) 25.74
Milraz (kg) 22.46
DAP Fertilizer (kg) .41
1993 Average Exchange rates: Kenya: 59 KShs = $1, Uganda: 1036 UShs = $1, Tanzania: 450 TShs= $1
34
Availability of High Quality SeedOne of the biggest constraints to increased potato production (and better quality potatoes) in all thre ecountries is the lack of availability of high quality seed potatoes. This is a policy issue since see dpropagation has been the responsibility of the government in each of these countries. For example, seedmultiplication and distribution have been the primary roles of the government parastatal Agricultura lDevelopment Corporation (ADC) Farms in Molo, Kenya. Big commercial s eed companies have never beeninvolved in vegetatively propagated crops for various r easons. Some African countries, such as Sudan, relyon European imports for seed potatoes.
Kenya is currently trying to contract directly with farmers to produce seed potatoes, but is facing twomajor problems:
There are a series of extra management steps required in producing good quality seeds — e.g .periodically checking and marking plants with bacterial wilt — that require farmers to be well trained(and be willing to expend the extra labor required).
When the market price of fresh potatoes gets high, most farmers are not willing to hold on to thei rpotatoes to use as seed, but sell them immediately (P. Ewell, CIP, personal communication).
LESSONS FROM POTATO COST OF PRODUCTIONAlthough the secondary data was limited, this cursory analysis has indicated that there are some problemsthat need to be addressed with respect to potato production in East Africa:
There is a need for more farm-level research in Uganda and Tanzania, where potatoes are an importantcrop, but little is known about farm-level practices and constraints.
The availability of high qualit y seed appears to override any other constraints, making it a top priorityfor governments and donors to address.
A study of chemical input use would be useful in order to determine if cost of inputs is truly aconstraint and if input subsidies (properly targeted) may be needed.
Although a large number of firms in East Africa (Kenya in particular) are increasingly using synthetic fibers in the production6
process, it was decided for the purpose of this analysis to exclude synthetics in our unit of analysis for ease of comparison withother countries. In addition cotton is still the largest input for most mills in the region and will increase over time because(I)global trends show a shift towards cotton based products ,(ii) as cotton production improves in the region due toliberalization of the industry, firms will reduce their use of synthetics in favor of cotton particularly those involved inproduction for export.
35
7. Costs of Productionin the Textile Industry
INTRODUCTIONPresented in the sections below is an analysis of costs of production in the textile industry in East Africa.Given that the other commodities under analysis were agricultural, it was decided to include an industrialcommodity for comparison. The textile industry was selected because of its relative importance i nmanufacturing in all the three countries and its potential for growth and export earnings. A comparativeanalysis of costs of production in the reg ion was undertaken and the policy implications of the findings forgovernments and donors examined.
COSTS OF PRODUCTION OF TEXTILES IN EAST AFRICADefining a suitable methodology for measuring and comparing costs of production across countries i scritical to the utility of the analysis that is performed. Analyzing the textile industry is quite complex dueto the variety of products, technologies, and type and size of firms in the industry. For the purpose of thisstudy the scope of the textile sector will include both woven fabric and garments. For the purpose o fanalysis, however, the cost structure of fully integrated mills was analyzed. More specifically, th econsultants examined the costs of producing 200 grams of 100 percent cotton fabric of one meter length. 6
In all three countries, actual cost data was collected from firms that can be considered reasonabl yrepresentative of the general cost structure in the industry. The sel ection in Uganda and Tanzania was madeslightly more difficult due to the general low level of production and capac ity utilization in the sector. Someof the best performing firms were selected in these countries. In addition to the cost data obtained from thefirms, secondary data on costs of production in industry, and textiles in particular, was examined an dcompared to the data obtained from the firms to ensure its validity and representativeness. Various textilemanufacturers in the region were also interviewed to cross-check the data collected and to identify othercost constraints faced by firms.
The cost structure obtained in Tanzania and Uganda was from firms that are majority owned by thegovernment, but with significant minority ownership from overseas investors. In contrast, the cost dat afrom Kenya was from a fully privately owned firm. This distinction should be kept in mind as one mightexpect the cost structure to be more efficient in the private firm vis-a-vis the publicly owned firms.
All the firms analyzed are labor-intensive, employing over 300 workers and producing mostly for thedomestic market. Capacity utilization rates varied acros s the firms analyzed with Kenya's being the highest
Capacity Utilization rate of the Kenyan firm was approximately 75 percent in 1993; the Tanzanian firm was 48 percent in 19937
and the Ugandan firm was 20 percent in 1994. Figures for the Ugandan firm were higher in 1993, but came down in 1994because the firm was earmarked for privatization and as a result the banks stopped lending it money. In 1994, the firm had toreduce output considerably, despite the high quality of its products.
36
in 1993 and Uganda's being the lowest. This factor should also b e kept in mind as lower capacity utilizationrates affect the cost efficiency of a firm. 7
For the purpose of the analysis conducted, it is assumed that the technology used is similar acros scountries and is fixed since it was not possible to do a detailed assessment of the technology used in eachfirm analyzed and in the regio n in general. It will therefore not be possible to make definitive conclusionson the impact of technology on costs of production in the region. However, a llusions will be made whereverit is deemed relevant on the impact of technology on costs of production.
Due to the small sample size used for the analysis, the costs obtained can only be considered a sindicative and not representative of the entire sector. They are neve rtheless useful for comparative purposesand will help to identify key cost constraints faced by the industry in the region and possible areas o fintervention by governments that would help to improve industrial competitiveness.
Presented in Table 7.1 below is a summary of the main cost elements required to manufacture 10 0percent cotton fabric of 200gms/square meter. The elements are aggregated into key cost components forease of comparison with other countries. More detailed cost budgets for each country are presented i nAppendix 5 to this study which will help to clarify how the various costs were compiled.
A cursory look at the costs for each country in comparison to the others reveals that the total cost ofproduction is highest in Tanzania, followed by Uganda and then Kenya. However, components within thecost structure vary across the countries in a number of areas. For example, the share of cotton in tota lproduction costs is much higher in Kenya than in the other two countries. In order to determine why thesedifferences occur, it is necessary to examine the prices of the various inputs and compare them acros scountries. Ideally, it would also be important to examine the level of input use, however, it was not possibleto get detailed data in this area. The manufacturers themselves were interviewed and asked to identif ylevels of input use, and this coupled with secondary price information was used to give some indicationsof the costs involved and the reasons for differences between countries.
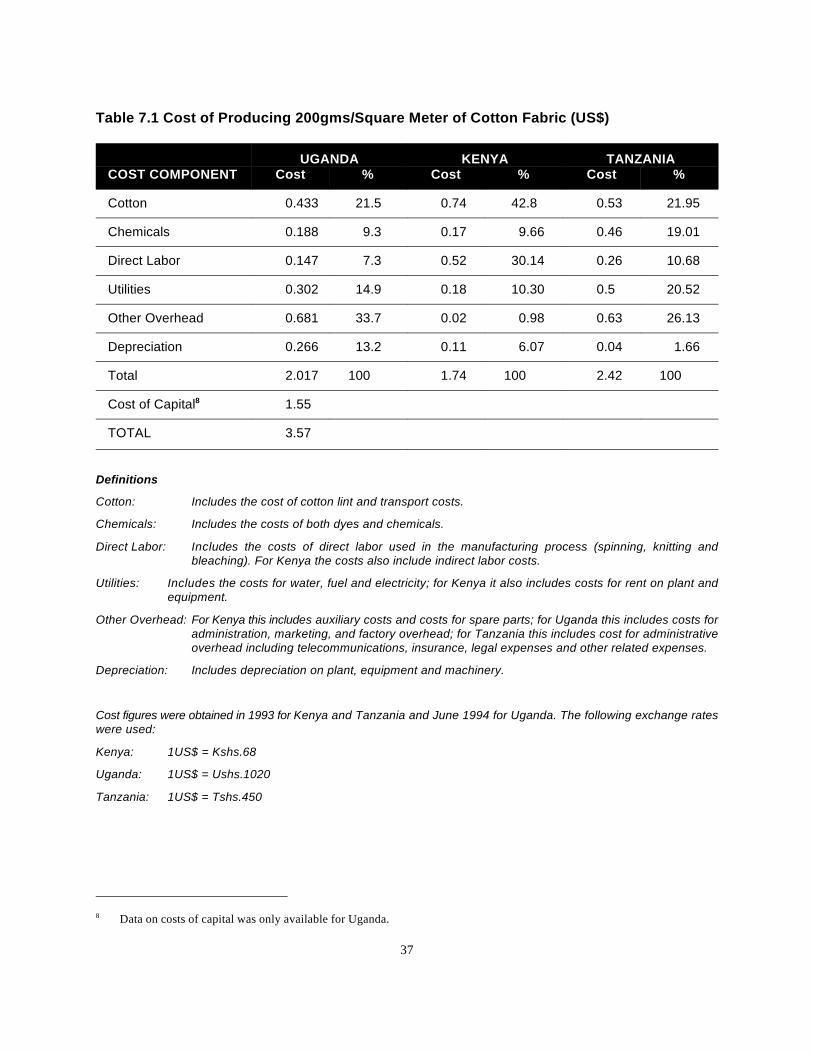
Data on costs of capital was only available for Uganda.8
37
Table 7.1 Cost of Producing 200gms/Square Meter of Cotton Fabric (US$)
UGANDA KENYA TANZANIACOST COMPONENT Cost % Cost % Cost %
Cotton 0.433 21.5 0.74 42.8 0.53 21.95
Chemicals 0.188 9.3 0.17 9.66 0.46 19.01
Direct Labor 0.147 7.3 0.52 30.14 0.26 10.68
Utilities 0.302 14.9 0.18 10.30 0.5 20.52
Other Overhead 0.681 33.7 0.02 0.98 0.63 26.13
Depreciation 0.266 13.2 0.11 6.07 0.04 1.66
Total 2.017 100 1.74 100 2.42 100
Cost of Capital 1.558
TOTAL 3.57
Definitions
Cotton: Includes the cost of cotton lint and transport costs.
Chemicals: Includes the costs of both dyes and chemicals.
Direct Labor: Includes the costs of direct labor used in the manufacturing process (spinning, knitting andbleaching). For Kenya the costs also include indirect labor costs.
Utilities: Includes the costs for water, fuel and electricity; for Kenya it also includes costs for rent on plant andequipment.
Other Overhead: For Kenya this includes auxiliary costs and costs for spare parts; for Uganda this includes costs foradministration, marketing, and factory overhead; for Tanzania this includes cost for administrativeoverhead including telecommunications, insurance, legal expenses and other related expenses.
Depreciation: Includes depreciation on plant, equipment and machinery.
Cost figures were obtained in 1993 for Kenya and Tanzania and June 1994 for Uganda. The following exchange rateswere used:
Kenya: 1US$ = Kshs.68
Uganda: 1US$ = Ushs.1020
Tanzania: 1US$ = Tshs.450
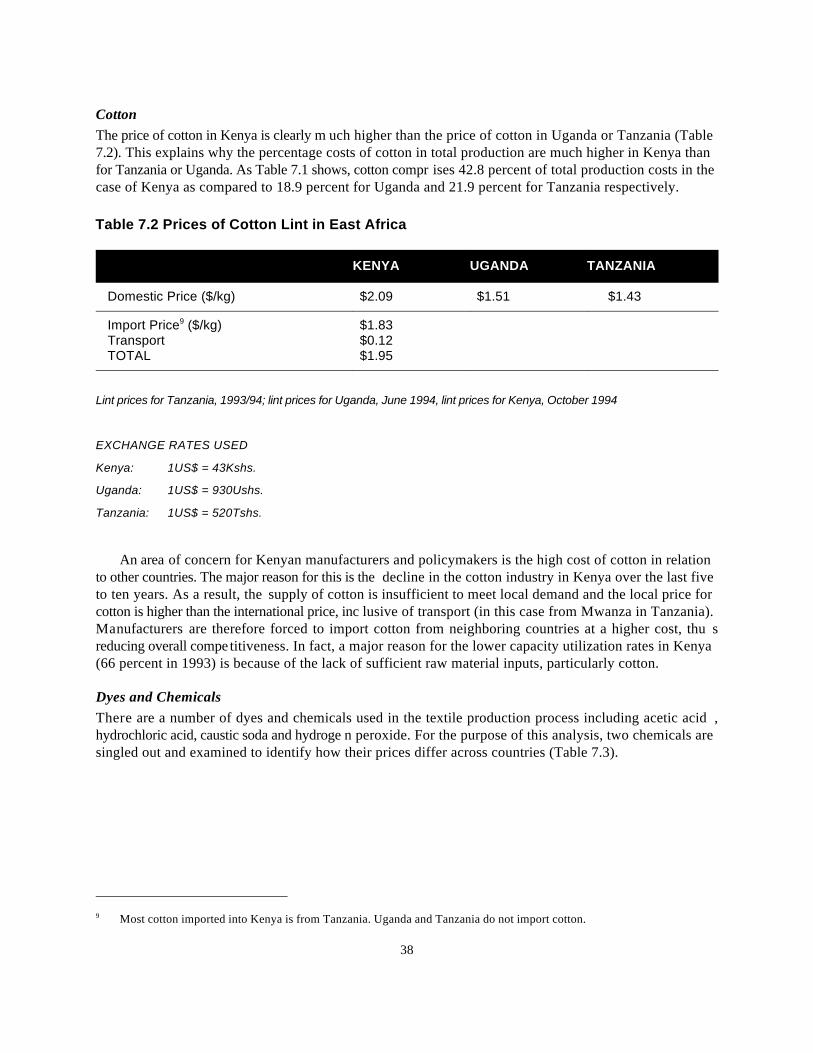
Most cotton imported into Kenya is from Tanzania. Uganda and Tanzania do not import cotton.9
38
CottonThe price of cotton in Kenya is clearly m uch higher than the price of cotton in Uganda or Tanzania (Table7.2). This explains why the percentage costs of cotton in total production are much higher in Kenya thanfor Tanzania or Uganda. As Table 7.1 shows, cotton compr ises 42.8 percent of total production costs in thecase of Kenya as compared to 18.9 percent for Uganda and 21.9 percent for Tanzania respectively.
Table 7.2 Prices of Cotton Lint in East Africa
KENYA UGANDA TANZANIA
Domestic Price ($/kg) $2.09 $1.51 $1.43
Import Price ($/kg) $1.839
Transport $0.12TOTAL $1.95
Lint prices for Tanzania, 1993/94; lint prices for Uganda, June 1994, lint prices for Kenya, October 1994
EXCHANGE RATES USED
Kenya: 1US$ = 43Kshs.
Uganda: 1US$ = 930Ushs.
Tanzania: 1US$ = 520Tshs.
An area of concern for Kenyan manufacturers and policymakers is the high cost of cotton in relationto other countries. The major reason for this is the decline in the cotton industry in Kenya over the last fiveto ten years. As a result, the supply of cotton is insufficient to meet local demand and the local price forcotton is higher than the international price, inc lusive of transport (in this case from Mwanza in Tanzania).Manufacturers are therefore forced to import cotton from neighboring countries at a higher cost, thu sreducing overall competitiveness. In fact, a major reason for the lower capacity utilization rates in Kenya(66 percent in 1993) is because of the lack of sufficient raw material inputs, particularly cotton.
Dyes and ChemicalsThere are a number of dyes and chemicals used in the textile production process including acetic acid ,hydrochloric acid, caustic soda and hydroge n peroxide. For the purpose of this analysis, two chemicals aresingled out and examined to identify how their prices differ across countries (Table 7.3).
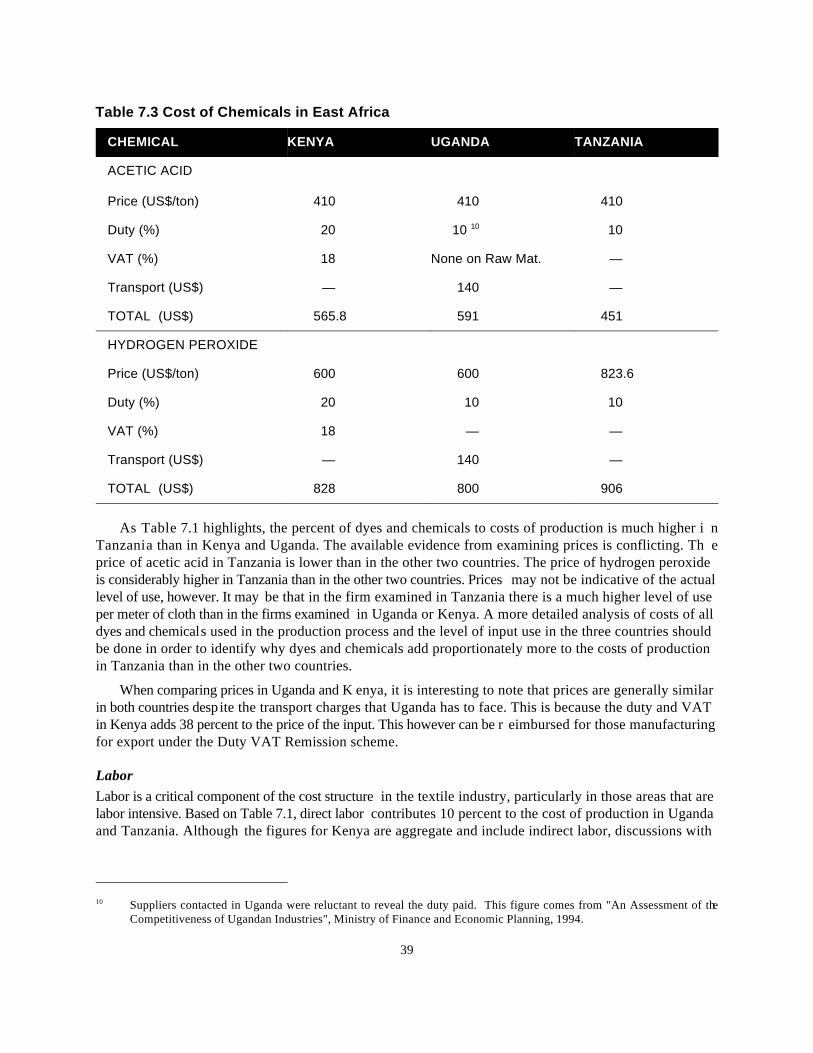
Suppliers contacted in Uganda were reluctant to reveal the duty paid. This figure comes from "An Assessment of the10
Competitiveness of Ugandan Industries", Ministry of Finance and Economic Planning, 1994.
39
Table 7.3 Cost of Chemicals in East Africa
CHEMICAL KENYA UGANDA TANZANIA
ACETIC ACID
Price (US$/ton) 410 410 410
Duty (%) 20 10 1010
VAT (%) 18 None on Raw Mat. —
Transport (US$) — 140 —
TOTAL (US$) 565.8 591 451
HYDROGEN PEROXIDE
Price (US$/ton) 600 600 823.6
Duty (%) 20 10 10
VAT (%) 18 — —
Transport (US$) — 140 —
TOTAL (US$) 828 800 906
As Table 7.1 highlights, the percent of dyes and chemicals to costs of production is much higher i nTanzania than in Kenya and Uganda. The available evidence from examining prices is conflicting. Th eprice of acetic acid in Tanzania is lower than in the other two countries. The price of hydrogen peroxideis considerably higher in Tanzania than in the other two countries. Prices may not be indicative of the actuallevel of use, however. It may be that in the firm examined in Tanzania there is a much higher level of useper meter of cloth than in the firms examined in Uganda or Kenya. A more detailed analysis of costs of alldyes and chemicals used in the production process and the level of input use in the three countries shouldbe done in order to identify why dyes and chemicals add proportionately more to the costs of productionin Tanzania than in the other two countries.
When comparing prices in Uganda and K enya, it is interesting to note that prices are generally similarin both countries despite the transport charges that Uganda has to face. This is because the duty and VATin Kenya adds 38 percent to the price of the input. This however can be r eimbursed for those manufacturingfor export under the Duty VAT Remission scheme.
LaborLabor is a critical component of the cost structure in the textile industry, particularly in those areas that arelabor intensive. Based on Table 7.1, direct labor contributes 10 percent to the cost of production in Ugandaand Tanzania. Although the figures for Kenya are aggregate and include indirect labor, discussions with
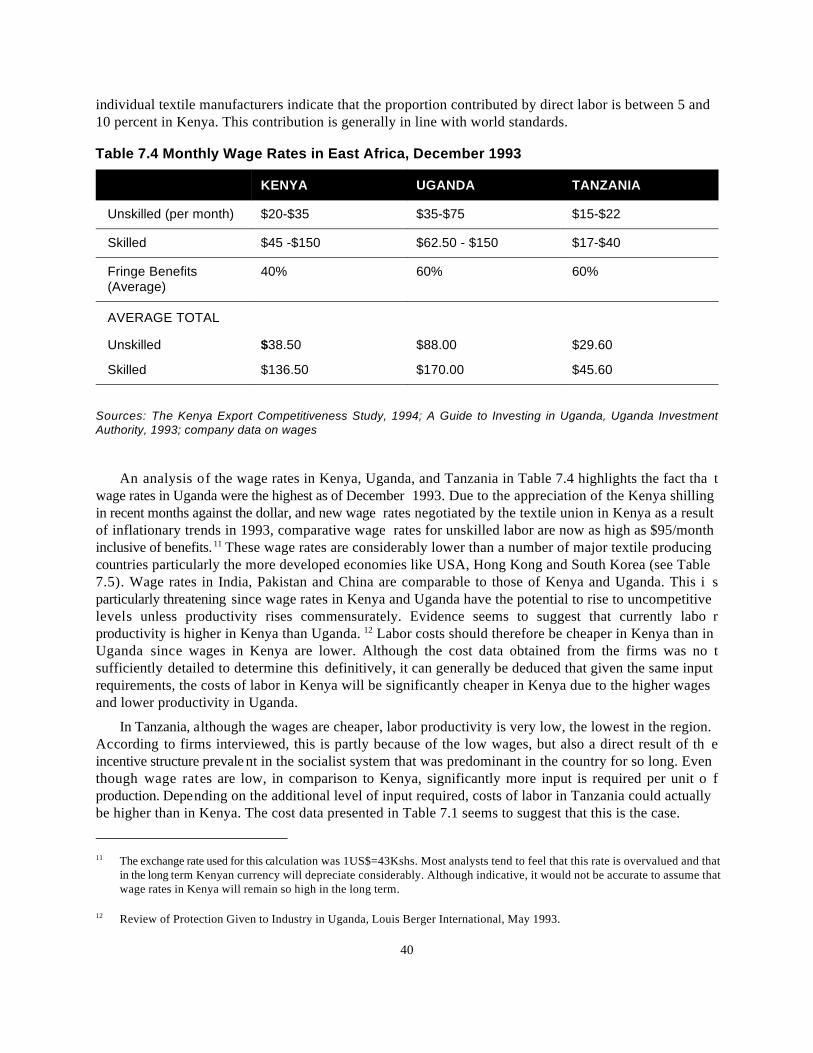
The exchange rate used for this calculation was 1US$=43Kshs. Most analysts tend to feel that this rate is overvalued and that11
in the long term Kenyan currency will depreciate considerably. Although indicative, it would not be accurate to assume thatwage rates in Kenya will remain so high in the long term.
Review of Protection Given to Industry in Uganda, Louis Berger International, May 1993. 12
40
individual textile manufacturers indicate that the proportion contributed by direct labor is between 5 and10 percent in Kenya. This contribution is generally in line with world standards.
Table 7.4 Monthly Wage Rates in East Africa, December 1993
KENYA UGANDA TANZANIA
Unskilled (per month) $20-$35 $35-$75 $15-$22
Skilled $45 -$150 $62.50 - $150 $17-$40
Fringe Benefits 40% 60% 60%(Average)
AVERAGE TOTAL
Unskilled $38.50 $88.00 $29.60
Skilled $136.50 $170.00 $45.60
Sources: The Kenya Export Competitiveness Study, 1994; A Guide to Investing in Uganda, Uganda InvestmentAuthority, 1993; company data on wages
An analysis of the wage rates in Kenya, Uganda, and Tanzania in Table 7.4 highlights the fact tha twage rates in Uganda were the highest as of December 1993. Due to the appreciation of the Kenya shillingin recent months against the dollar, and new wage rates negotiated by the textile union in Kenya as a resultof inflationary trends in 1993, comparative wage rates for unskilled labor are now as high as $95/monthinclusive of benefits. These wage rates are considerably lower than a number of major textile producing11
countries particularly the more developed economies like USA, Hong Kong and South Korea (see Table7.5). Wage rates in India, Pakistan and China are comparable to those of Kenya and Uganda. This i sparticularly threatening since wage rates in Kenya and Uganda have the potential to rise to uncompetitivelevels unless productivity rises commensurately. Evidence seems to suggest that currently labo rproductivity is higher in Kenya than Uganda. Labor costs should therefore be cheaper in Kenya than in12
Uganda since wages in Kenya are lower. Although the cost data obtained from the firms was no tsufficiently detailed to determine this definitively, it can generally be deduced that given the same inputrequirements, the costs of labor in Kenya will be significantly cheaper in Kenya due to the higher wagesand lower productivity in Uganda.
In Tanzania, although the wages are cheaper, labor productivity is very low, the lowest in the region.According to firms interviewed, this is partly because of the low wages, but also a direct result of th eincentive structure prevalent in the socialist system that was predominant in the country for so long. Eventhough wage rates are low, in comparison to Kenya, significantly more input is required per unit o fproduction. Depending on the additional level of input required, costs of labor in Tanzania could actuallybe higher than in Kenya. The cost data presented in Table 7.1 seems to suggest that this is the case.
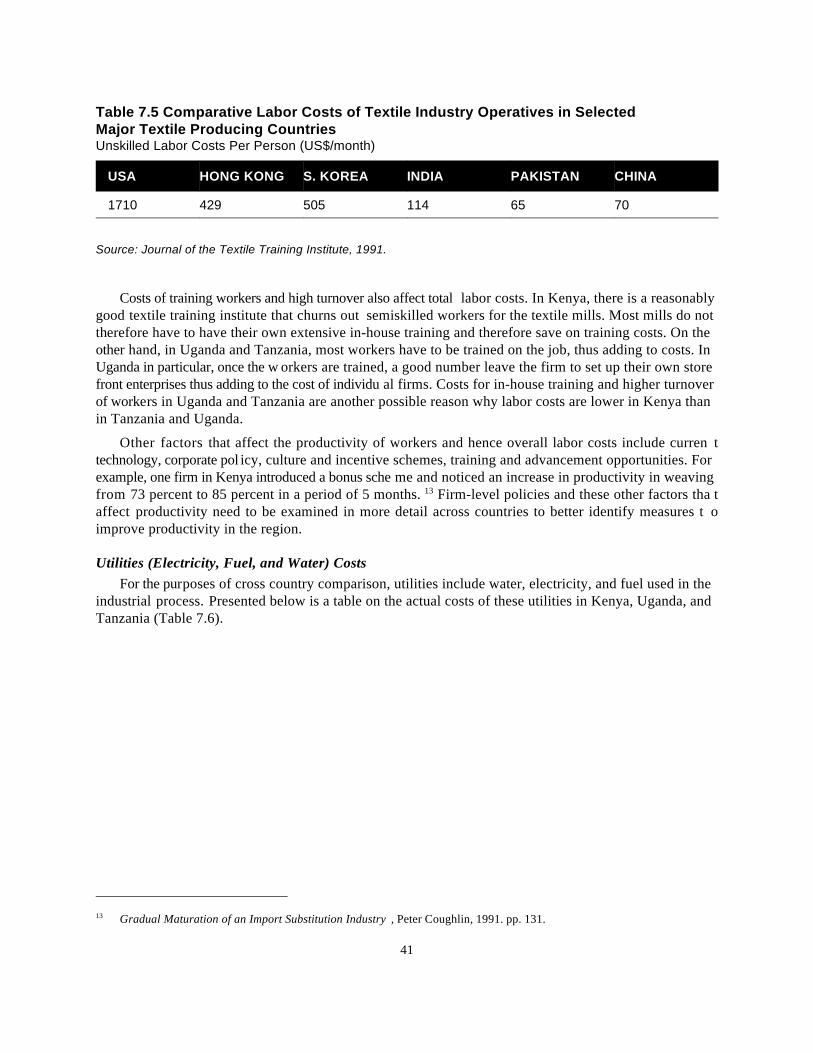
Gradual Maturation of an Import Substitution Industry , Peter Coughlin, 1991. pp. 131.13
41
Table 7.5 Comparative Labor Costs of Textile Industry Operatives in SelectedMajor Textile Producing CountriesUnskilled Labor Costs Per Person (US$/month)
USA HONG KONG S. KOREA INDIA PAKISTAN CHINA
1710 429 505 114 65 70
Source: Journal of the Textile Training Institute, 1991.
Costs of training workers and high turnover also affect total labor costs. In Kenya, there is a reasonablygood textile training institute that churns out semiskilled workers for the textile mills. Most mills do nottherefore have to have their own extensive in-house training and therefore save on training costs. On theother hand, in Uganda and Tanzania, most workers have to be trained on the job, thus adding to costs. InUganda in particular, once the w orkers are trained, a good number leave the firm to set up their own storefront enterprises thus adding to the cost of individu al firms. Costs for in-house training and higher turnoverof workers in Uganda and Tanzania are another possible reason why labor costs are lower in Kenya thanin Tanzania and Uganda.
Other factors that affect the productivity of workers and hence overall labor costs include curren ttechnology, corporate pol icy, culture and incentive schemes, training and advancement opportunities. Forexample, one firm in Kenya introduced a bonus sche me and noticed an increase in productivity in weavingfrom 73 percent to 85 percent in a period of 5 months. Firm-level policies and these other factors tha t13
affect productivity need to be examined in more detail across countries to better identify measures t oimprove productivity in the region.
Utilities (Electricity, Fuel, and Water) CostsFor the purposes of cross country comparison, utilities include water, electricity, and fuel used in the
industrial process. Presented below is a table on the actual costs of these utilities in Kenya, Uganda, andTanzania (Table 7.6).
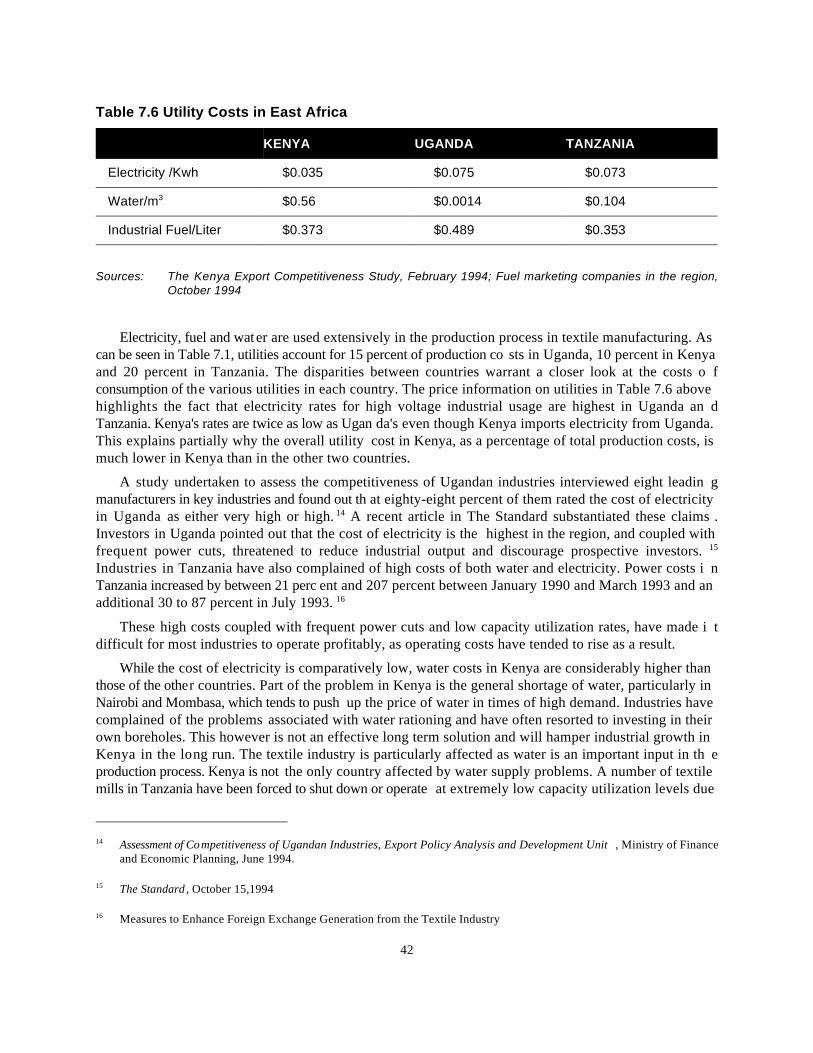
Assessment of Competitiveness of Ugandan Industries, Export Policy Analysis and Development Unit , Ministry of Finance14
and Economic Planning, June 1994.
The Standard , October 15,199415
Measures to Enhance Foreign Exchange Generation from the Textile Industry16
42
Table 7.6 Utility Costs in East Africa
KENYA UGANDA TANZANIA
Electricity /Kwh $0.035 $0.075 $0.073
Water/m $0.56 $0.0014 $0.1043
Industrial Fuel/Liter $0.373 $0.489 $0.353
Sources: The Kenya Export Competitiveness Study, February 1994; Fuel marketing companies in the region,October 1994
Electricity, fuel and water are used extensively in the production process in textile manufacturing. Ascan be seen in Table 7.1, utilities account for 15 percent of production co sts in Uganda, 10 percent in Kenyaand 20 percent in Tanzania. The disparities between countries warrant a closer look at the costs o fconsumption of the various utilities in each country. The price information on utilities in Table 7.6 abovehighlights the fact that electricity rates for high voltage industrial usage are highest in Uganda an dTanzania. Kenya's rates are twice as low as Ugan da's even though Kenya imports electricity from Uganda.This explains partially why the overall utility cost in Kenya, as a percentage of total production costs, ismuch lower in Kenya than in the other two countries.
A study undertaken to assess the competitiveness of Ugandan industries interviewed eight leadin gmanufacturers in key industries and found out th at eighty-eight percent of them rated the cost of electricityin Uganda as either very high or high. A recent article in The Standard substantiated these claims .14
Investors in Uganda pointed out that the cost of electricity is the highest in the region, and coupled withfrequent power cuts, threatened to reduce industrial output and discourage prospective investors. 15
Industries in Tanzania have also complained of high costs of both water and electricity. Power costs i nTanzania increased by between 21 perc ent and 207 percent between January 1990 and March 1993 and anadditional 30 to 87 percent in July 1993. 16
These high costs coupled with frequent power cuts and low capacity utilization rates, have made i tdifficult for most industries to operate profitably, as operating costs have tended to rise as a result.
While the cost of electricity is comparatively low, water costs in Kenya are considerably higher thanthose of the other countries. Part of the problem in Kenya is the general shortage of water, particularly inNairobi and Mombasa, which tends to push up the price of water in times of high demand. Industries havecomplained of the problems associated with water rationing and have often resorted to investing in theirown boreholes. This however is not an effective long term solution and will hamper industrial growth inKenya in the long run. The textile industry is particularly affected as water is an important input in th eproduction process. Kenya is not the only country affected by water supply problems. A number of textilemills in Tanzania have been forced to shut down or operate at extremely low capacity utilization levels due
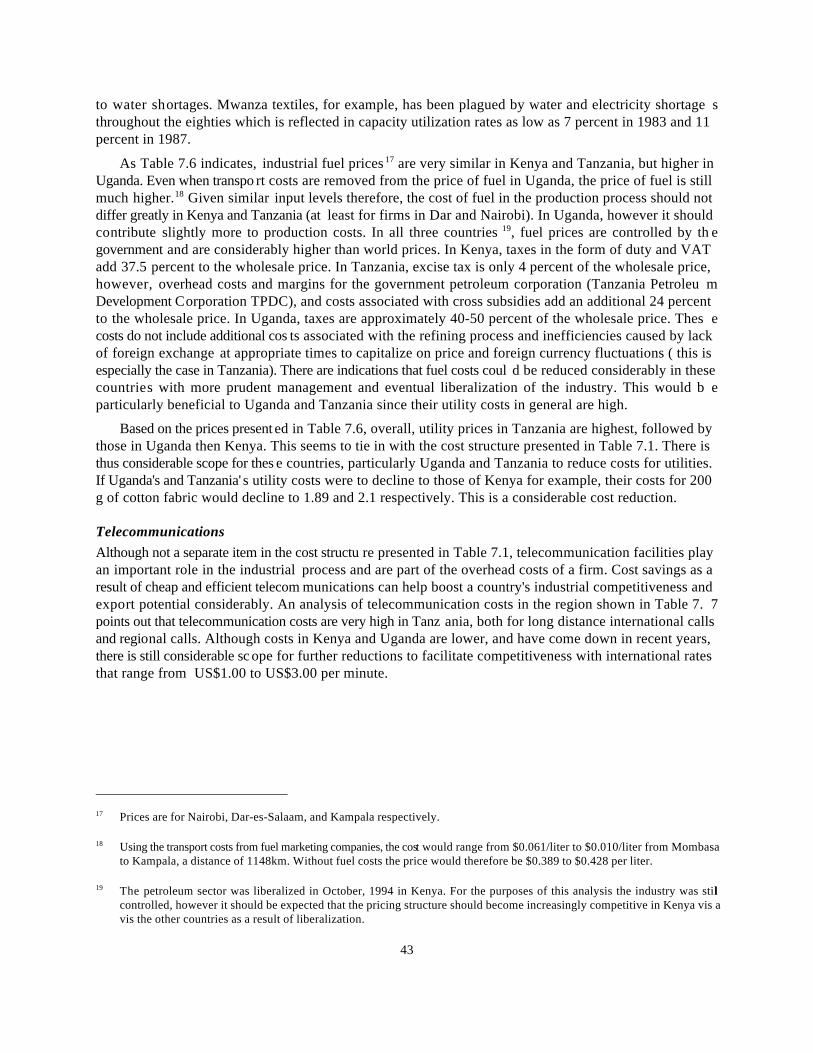
Prices are for Nairobi, Dar-es-Salaam, and Kampala respectively.17
Using the transport costs from fuel marketing companies, the cost would range from $0.061/liter to $0.010/liter from Mombasa18
to Kampala, a distance of 1148km. Without fuel costs the price would therefore be $0.389 to $0.428 per liter.
The petroleum sector was liberalized in October, 1994 in Kenya. For the purposes of this analysis the industry was still19
controlled, however it should be expected that the pricing structure should become increasingly competitive in Kenya vis avis the other countries as a result of liberalization.
43
to water shortages. Mwanza textiles, for example, has been plagued by water and electricity shortage sthroughout the eighties which is reflected in capacity utilization rates as low as 7 percent in 1983 and 11percent in 1987.
As Table 7.6 indicates, industrial fuel prices are very similar in Kenya and Tanzania, but higher in17
Uganda. Even when transpo rt costs are removed from the price of fuel in Uganda, the price of fuel is stillmuch higher. Given similar input levels therefore, the cost of fuel in the production process should not18
differ greatly in Kenya and Tanzania (at least for firms in Dar and Nairobi). In Uganda, however it shouldcontribute slightly more to production costs. In all three countries , fuel prices are controlled by th e19
government and are considerably higher than world prices. In Kenya, taxes in the form of duty and VATadd 37.5 percent to the wholesale price. In Tanzania, excise tax is only 4 percent of the wholesale price,however, overhead costs and margins for the government petroleum corporation (Tanzania Petroleu mDevelopment Corporation TPDC), and costs associated with cross subsidies add an additional 24 percentto the wholesale price. In Uganda, taxes are approximately 40-50 percent of the wholesale price. Thes ecosts do not include additional cos ts associated with the refining process and inefficiencies caused by lackof foreign exchange at appropriate times to capitalize on price and foreign currency fluctuations ( this isespecially the case in Tanzania). There are indications that fuel costs coul d be reduced considerably in thesecountries with more prudent management and eventual liberalization of the industry. This would b eparticularly beneficial to Uganda and Tanzania since their utility costs in general are high.
Based on the prices presented in Table 7.6, overall, utility prices in Tanzania are highest, followed bythose in Uganda then Kenya. This seems to tie in with the cost structure presented in Table 7.1. There isthus considerable scope for thes e countries, particularly Uganda and Tanzania to reduce costs for utilities.If Uganda's and Tanzania' s utility costs were to decline to those of Kenya for example, their costs for 200g of cotton fabric would decline to 1.89 and 2.1 respectively. This is a considerable cost reduction.
TelecommunicationsAlthough not a separate item in the cost structu re presented in Table 7.1, telecommunication facilities playan important role in the industrial process and are part of the overhead costs of a firm. Cost savings as aresult of cheap and efficient telecom munications can help boost a country's industrial competitiveness andexport potential considerably. An analysis of telecommunication costs in the region shown in Table 7. 7points out that telecommunication costs are very high in Tanz ania, both for long distance international callsand regional calls. Although costs in Kenya and Uganda are lower, and have come down in recent years,there is still considerable scope for further reductions to facilitate competitiveness with international ratesthat range from US$1.00 to US$3.00 per minute.
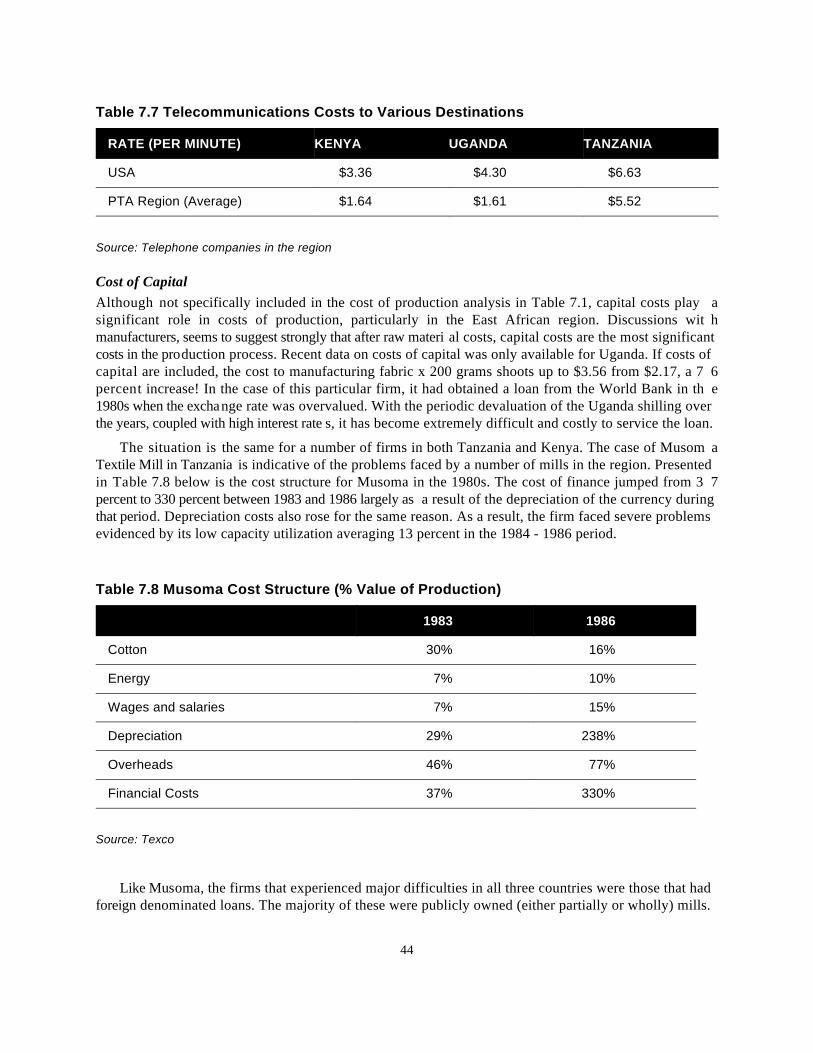
44
Table 7.7 Telecommunications Costs to Various Destinations
RATE (PER MINUTE) KENYA UGANDA TANZANIA
USA $3.36 $4.30 $6.63
PTA Region (Average) $1.64 $1.61 $5.52
Source: Telephone companies in the region
Cost of CapitalAlthough not specifically included in the cost of production analysis in Table 7.1, capital costs play asignificant role in costs of production, particularly in the East African region. Discussions wit hmanufacturers, seems to suggest strongly that after raw materi al costs, capital costs are the most significantcosts in the production process. Recent data on costs of capital was only available for Uganda. If costs ofcapital are included, the cost to manufacturing fabric x 200 grams shoots up to $3.56 from $2.17, a 7 6percent increase! In the case of this particular firm, it had obtained a loan from the World Bank in th e1980s when the exchange rate was overvalued. With the periodic devaluation of the Uganda shilling overthe years, coupled with high interest rate s, it has become extremely difficult and costly to service the loan.
The situation is the same for a number of firms in both Tanzania and Kenya. The case of Musom aTextile Mill in Tanzania is indicative of the problems faced by a number of mills in the region. Presentedin Table 7.8 below is the cost structure for Musoma in the 1980s. The cost of finance jumped from 3 7percent to 330 percent between 1983 and 1986 largely as a result of the depreciation of the currency duringthat period. Depreciation costs also rose for the same reason. As a result, the firm faced severe problemsevidenced by its low capacity utilization averaging 13 percent in the 1984 - 1986 period.
Table 7.8 Musoma Cost Structure (% Value of Production)
1983 1986
Cotton 30% 16%
Energy 7% 10%
Wages and salaries 7% 15%
Depreciation 29% 238%
Overheads 46% 77%
Financial Costs 37% 330%
Source: Texco
Like Musoma, the firms that experienced major difficulties in all three countries were those that hadforeign denominated loans. The majority of these were publicly owned (either partially or wholly) mills.
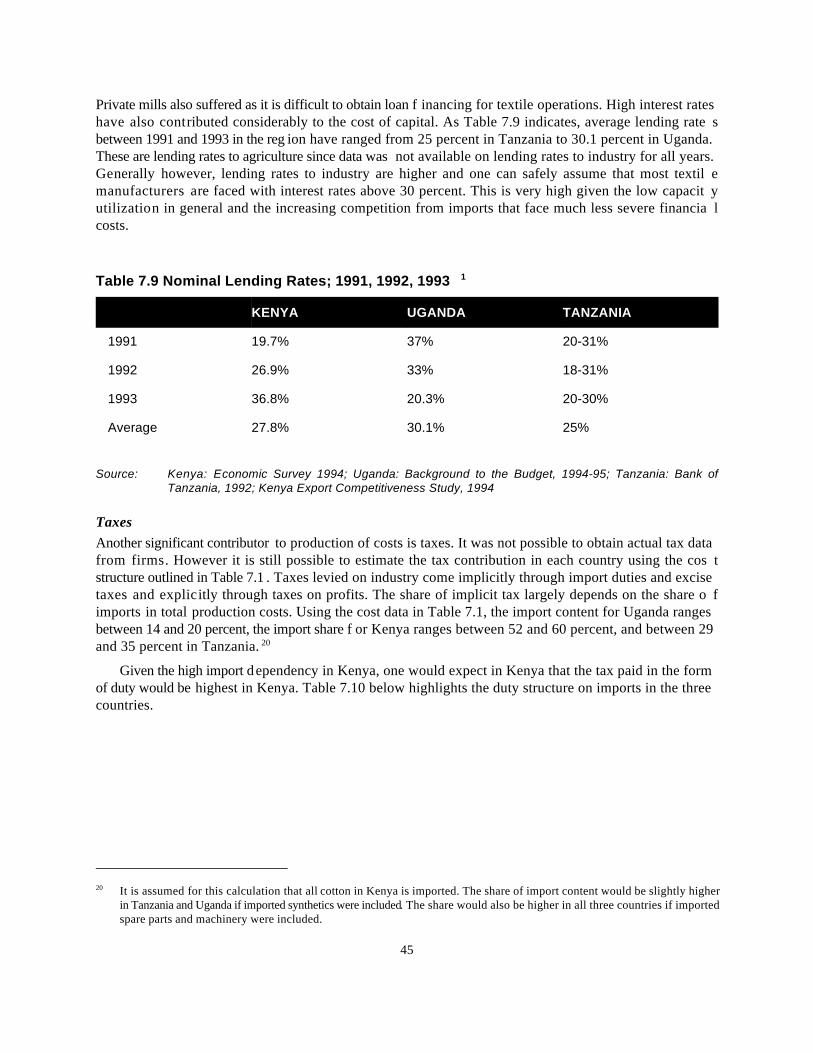
It is assumed for this calculation that all cotton in Kenya is imported. The share of import content would be slightly higher20
in Tanzania and Uganda if imported synthetics were included. The share would also be higher in all three countries if importedspare parts and machinery were included.
45
Private mills also suffered as it is difficult to obtain loan f inancing for textile operations. High interest rateshave also contributed considerably to the cost of capital. As Table 7.9 indicates, average lending rate sbetween 1991 and 1993 in the reg ion have ranged from 25 percent in Tanzania to 30.1 percent in Uganda.These are lending rates to agriculture since data was not available on lending rates to industry for all years.Generally however, lending rates to industry are higher and one can safely assume that most textil emanufacturers are faced with interest rates above 30 percent. This is very high given the low capacit yutilization in general and the increasing competition from imports that face much less severe financia lcosts.
Table 7.9 Nominal Lending Rates; 1991, 1992, 1993 1
KENYA UGANDA TANZANIA
1991 19.7% 37% 20-31%
1992 26.9% 33% 18-31%
1993 36.8% 20.3% 20-30%
Average 27.8% 30.1% 25%
Source: Kenya: Economic Survey 1994; Uganda: Background to the Budget, 1994-95; Tanzania: Bank ofTanzania, 1992; Kenya Export Competitiveness Study, 1994
TaxesAnother significant contributor to production of costs is taxes. It was not possible to obtain actual tax datafrom firms. However it is still possible to estimate the tax contribution in each country using the cos tstructure outlined in Table 7.1 . Taxes levied on industry come implicitly through import duties and excisetaxes and explicitly through taxes on profits. The share of implicit tax largely depends on the share o fimports in total production costs. Using the cost data in Table 7.1, the import content for Uganda rangesbetween 14 and 20 percent, the import share f or Kenya ranges between 52 and 60 percent, and between 29and 35 percent in Tanzania. 20
Given the high import dependency in Kenya, one would expect in Kenya that the tax paid in the formof duty would be highest in Kenya. Table 7.10 below highlights the duty structure on imports in the threecountries.
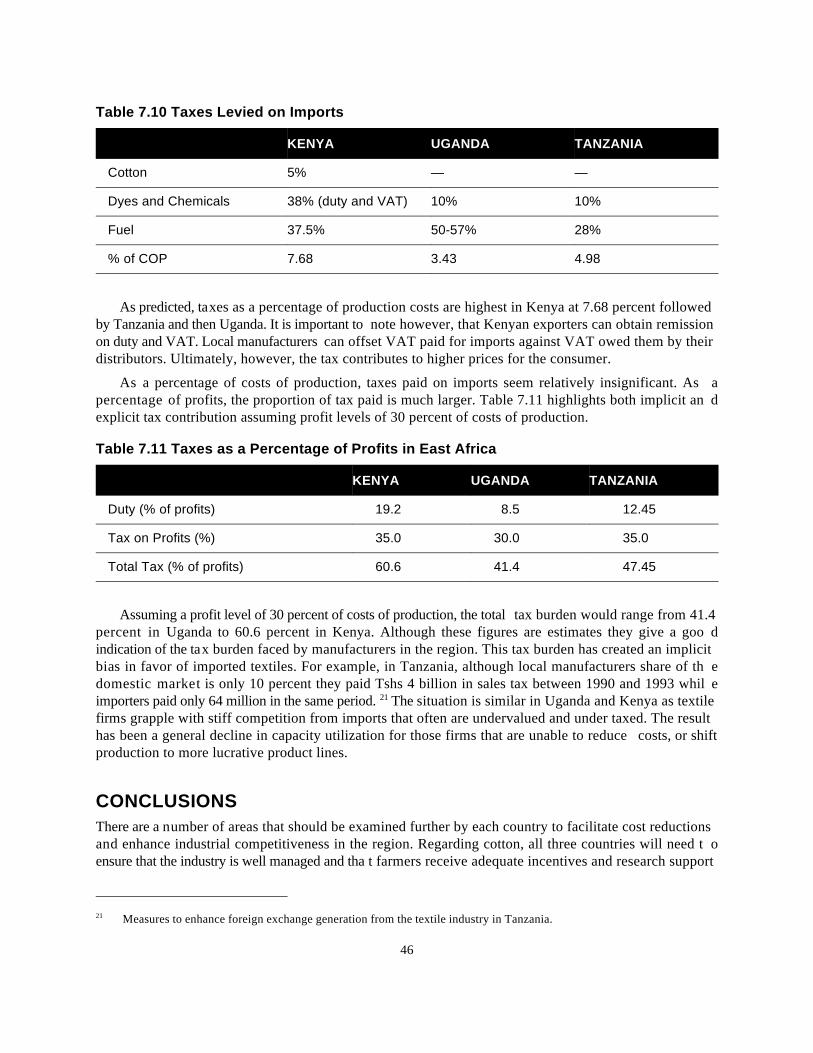
Measures to enhance foreign exchange generation from the textile industry in Tanzania. 21
46
Table 7.10 Taxes Levied on Imports
KENYA UGANDA TANZANIA
Cotton 5% — —
Dyes and Chemicals 38% (duty and VAT) 10% 10%
Fuel 37.5% 50-57% 28%
% of COP 7.68 3.43 4.98
As predicted, taxes as a percentage of production costs are highest in Kenya at 7.68 percent followedby Tanzania and then Uganda. It is important to note however, that Kenyan exporters can obtain remissionon duty and VAT. Local manufacturers can offset VAT paid for imports against VAT owed them by theirdistributors. Ultimately, however, the tax contributes to higher prices for the consumer.
As a percentage of costs of production, taxes paid on imports seem relatively insignificant. As apercentage of profits, the proportion of tax paid is much larger. Table 7.11 highlights both implicit an dexplicit tax contribution assuming profit levels of 30 percent of costs of production.
Table 7.11 Taxes as a Percentage of Profits in East Africa
KENYA UGANDA TANZANIA
Duty (% of profits) 19.2 8.5 12.45
Tax on Profits (%) 35.0 30.0 35.0
Total Tax (% of profits) 60.6 41.4 47.45
Assuming a profit level of 30 percent of costs of production, the total tax burden would range from 41.4percent in Uganda to 60.6 percent in Kenya. Although these figures are estimates they give a goo dindication of the tax burden faced by manufacturers in the region. This tax burden has created an implicitbias in favor of imported textiles. For example, in Tanzania, although local manufacturers share of th edomestic market is only 10 percent they paid Tshs 4 billion in sales tax between 1990 and 1993 whil eimporters paid only 64 million in the same period. The situation is similar in Uganda and Kenya as textile21
firms grapple with stiff competition from imports that often are undervalued and under taxed. The resulthas been a general decline in capacity utilization for those firms that are unable to reduce costs, or shiftproduction to more lucrative product lines.
CONCLUSIONSThere are a number of areas that should be examined further by each country to facilitate cost reductionsand enhance industrial competitiveness in the region. Regarding cotton, all three countries will need t oensure that the industry is well managed and tha t farmers receive adequate incentives and research support
47
from the government. Kenya in particular has allowed its cotton sector to deteriorate considerably and asa result most firms are importing cotton from other countries in the region. The high cost of importin gcotton could adversely affec t the competitiveness of the textile industry particularly exporters. In fact, therecent appreciation of the currency has made it impossible for exporters of yarn to export since the priceof finished yarn in their export destinations is higher than the price of unprocessed cotton in Kenya.
For other inputs such as dyes and chemicals it was not ed that Tanzania appears to spend comparativelymore, at least for the particular firm analyzed. It is necessary however to do a more extensive analysis ofprices and input levels for dyes and chemicals in the region to determine definitively whether this is thecase.
Labor costs are generally competitive in all three countries, although there is the potential for labo rrates in Kenya and Uganda to escalate to uncompetitive levels if productivit y does not rise commensurately.Measures will need to be put in place to enhance productivity. One area of need is a training facility fortextile workers in Uganda and Tanzania. Due to the present low level of capacity utilization in thes ecountries, setting one up from scratch may not be financially feasible or practical. This should be a longterm plan for both countries. In the short term, given the new spirit of regional cooperation, discussionsshould be held to allow workers to attend the training institute in Kenya.
Utility costs are higher in Uganda and Tanzania than in Kenya. Electricity costs are particularly highin Uganda and Tanzania and frequent power cuts have affected production ef ficiency and costs. Water costsare highest in Kenya and will ne ed to be reduced in the long term through the provision of adequate waterin key industrial areas. The cost of industrial fuel in Uganda is highest even after factoring in transpor tcosts. The Government of Uganda may eventually have to do a thorough analysis of the petroleum sectorand identify ways to reduce the cost of fuel while at the same time catering to its revenue needs.
Capital is a critical constraint in the region in general. Interest rates have been high historically an dmany firms are burdened with high foreign debt payments. Constructive steps will need to be taken t oreduce the financial burden of key government textile mills that may be attractive for privatization. Thishas already begun in Uganda and Kenya and although the government in Tanzania has indicated it sintention to private textile firms progress has still been very slow to the detriment of the industry. Soundmacroeconomic management will also help to bring down inflation and allow interest rates to settle a tlevels conducive for industrial borrowing.
Taxes on industry in the region are g enerally high, although they have been reduced substantially overthe past few years. There is a need for the governments in the regio n to reexamine their tax policy to ensureagainst an import bias. A critical issue here is enforcement of the duties levied on imports.
POLICY IMPLICATIONSBased on the analysis presented, there are a number of policy implications for governments and donor sinterested in interventions in the region. Presented below are some potential areas for future interventionthat will help to enhance industria l competitiveness in the region. A lot of the recommendations given canbe applied to all three countries although some are more specific to individual countries.
CottonExpand and improve research facilities in the region. Revitalizing and maintaining a thriving cotto nindustry is an important component of regional comparative advantage in textile manufacturing. B yliberalizing the industry in Uganda and Kenya, it is expected that private investment and free access t omarkets will provide sufficient incentives to the farmers and ensure higher quality ginning. There is still
48
a need however to improve the research capabilities in all three countries to ensure that the cotton varietiesthat are grown are suitable for the particular agroeconomic zones in the region. Research should b ecoordinated in the region to take advantage of discoveries in other countries. Donors should conside rfunding a regional research prog ram for the countries in the region in collaboration with governments andresearch bodies already conducting research.
Labor ProductivitySet up a regional training institute to provide training to unskilled and semiskilled workers on all aspectsof the textile industry. Kenya already has a reasonably good textile training institute (Kenya Textil eTraining Institute) which could be upgraded to train textile personnel in the region. It is understood thatUNIDO has already selected Kenya as a potential host country for texti le training throughout the PTA. Thisactivated should therefore be pursued vigorousl y by the East African countries and potential donors so thatworkers can begin to be trained as soon as possible.
Conduct a detailed analysis of ways to improve productivity in the region. One of biggest difference sbetween workers in Asia and in the East African region is their productivity. The experience of these andother countries like the U.S. should be examined in the context of i mproving productivity in the region. Theexperience of other successful and unsuccessful firms in the region should also be examined to facilitatethe analysis and share and expand knowledge on ways to improve productivity in the region.
InfrastructureThe problems of infrastructure ar e well known to both governments and donors alike. There are a numberof projects already in place funded by the World Bank and other donors to improve infrastructure in theregion. The recommendations presented bel ow are made only to highlight areas of specific and immediateneed that have been identified as part of this analysis.
ElectricityImprovements need to be made in a ll three countries to reduce costs. One area that should be examined inmore detail is revenue collection. In Uganda for example all the revenue collected in 1993 was only 2 4percent of the total amount due. If collection was more efficient, the tariffs would not need to be as highas they currently are. Commercialization of operations in these public corporations would enhance th erevenue collection efficiency and cost structure considerably.
WaterAction needs to be taken to reduce the water shortage problems experienced by firms in the region ,particularly in Tanzania and Kenya. The World Bank is already involved in this to a certain extent, bu timplementation, particularly in Kenya, is taking longer than was projected and is an area of concern t opotential investors.
FuelA detailed analysis of fuel costs in each coun try should be taken to identify efficiency enhancing measuresthat would reduce fuel costs in the region. The analysis should cover all aspects of the distribution chainfrom refinery costs to marketing costs to administrative overhead and taxes. It should also include a nanalysis of the cost implications of liberalization of the petroleum sector.
TelecommunicationsFacilitate continued investment and moder nization of telecommunications in the region. Governments anddonors in the region are all aware of the importance of im proving telecommunications facilities. Continuedsupport by donors in this area and commitment by governments in the region to enhance the efficiency of
49
services through commercialization and privatization is essential if telecommunication costs are to b ereduced in the long term.
Costs of CapitalExpedite full liberalization of the financial sector in the region. Access to low cost capital is a criticalfactor in efforts to revitalize the textile industry and industry in general in East Africa. Continued supportfor sound macroeconomic management and liberalization of th e capital markets will improve access to andthe cost of financing. Linking capital markets in East Africa would also help to improve access to financingfor industry and improve efficiency of the markets. A detailed analysis of the potential costs and benefitsof regional financial integration should be done so that a realistic timetable for all three countries can bedeveloped.
Seek innovative ways to privatize textile mills. A number of textile mills in the region have bee nunattractive to local or foreign investors because of their large debts, old equipment and in many cases ,weak management. This is particularly the case in Tanzania. The governments in the region may have toconsider assuming the debt themselves or develop innovative capital restructuring mechanisms like debt/equity swaps to make the purchase of these mills viable options.
TaxesReview the current tax systems in the region. This will help to avoid a bias towards imports vis-a-vis thedomestic textile industry. In Tanzania, it is important to harmonize the tax system between Tanzania andthe mainland Zanzibar to avoid the spillover of untaxed or under taxed goods from Zanzibar to th emainland. In all three countries, appropriate enforcement measures are necessary at customs to ensure thatthe adequate duty and excise taxes are paid.
Backward LinkagesSupport the development of cottage industry in the region. The cottage industry in the region has a lot ofscope for development so that it can service l arger industry with appropriate, high quality inputs. In Kenyafor example, there are a number of women’s groups that are manufacturing dy es from plants, barks of trees,stones and clays. These groups an d others should be supported to facilitate the commercialization of thesedyes. In the same vein, support to th e small scale metal/foundry sector will help to develop the indigenouscapacity to manufacture and repair machinery.

50
51
8. Analysis of Competitiveness andComparative Advantage
Maize, Beans, Coffee, and Textiles
INTRODUCTIONWith the on-going structural adjustment pr ograms and trade liberalization policies currently being pursuedby the three East African countries, there is a need to analyze the econom ics of production not only at farm-level but also in the wider context of their competitiveness and profitability in both the regional and worldmarket. Furthermore, the geog raphic proximity of the three contiguous countries and their membership insuch regional trade arrangements as the Preferential Trade Area (PTA) and the anticipated new Eas tAfrican Community (EAC) offer great opportunities for exploiting trade in both traditional and non -traditional crops. It is worth noting that the informal market traders are already taking advantage o fcrossborder trade opportunities in the maize and beans markets (Odhiambo, 1994).
The comparative cost of production analysi s alone cannot reveal the competitiveness of each country'sindividual commodity in the regional or the world market. Both supply and demand factors influence thecompetitiveness of a given commodity in the world or regional market. On the supply side, these factorsinclude:
Cost of production
Marketing costs
Quality (and sometimes reputation for level of quality)
Product differentiation (e.g. being identified as Kenyan coffee, not just as coffee)
Resource base (land, capital, labor availability, productivity, and prices or costs).
Macroeconomic policies, both m onetary (e.g. exchange rate) and fiscal (taxes and subsidies); sectoralor commodity-specific policies; trade policies (e.g. import tariffs, export subsidies)
Technological development (R&D); varietal as well as packaging, proces sing, and grading technologies
Diffusion of technology (i.e. extension)
Infrastructure, especially marketing infrastructure (e.g. transportation and marketing facilities)
Dissemination of market information
On the demand side, important factors influencing competitiveness are:
Developments in world or regional commodity markets
Market shares
DRC = net cost (value) of nontradable factors/value of production (revenues) - cost of tradable inputs.22
52
Market structure
Overall demand and changes in tastes and preferences particularly demand factors in target markets
Relative resource endowments and factor prices and productivity in competing producing countries
Policies in competitive producing countries
Technology/development of new substitutes
Tastes and preferences
Population growth
Income growth in domestic and foreign markets
MEASURING COMPETITIVENESS
Cost of ProductionA farmer's profits from growing a given crop depend upon the price he receives for his output, the levelof output he is able to produce, and the costs he incurs in producing it. One way of judging competitivenessis to compare those production c osts across countries. A comparative cost of production analysis was thusundertaken as the first step in this study. To a large extent, this comparative cost of production analysis isfairly indicative of further issues of comparative advantage. This is because in recent years in all thre ecountries, policy distortions have decreased significantly following SAPs and market liberalization in theregion.
The second step is to extend the analysis to examine comparative advantage issues. This was don eusing existing DRC analyses (described below) where available, as well as our own calculations of DRCratios using the COP data already analyzed as the basis for the comparative advantage calculations .
Domestic Resource CostsDomestic resource costs (DRCs) are calculated to measure the degree of comparative advantage that aparticular production activity gives a country. The DRC ratio is calculated as the ratio between the valueadded to primary or nontradable factors of production and the value added to tradable factors. Primary22
factors include those inputs that are not usually traded internationally, such as land, labor, water, an dcapital. Tradables are goods that are or could be traded intern ationally, including fuel, machinery, chemicalfertilizers and pesticides, and spare parts.
DRCs > 1 indicate an inefficient use of resources, since the value of domestic resources used i nproduction exceeds the value of foreign exchange earned (in the case of export crops) or saved (in the caseof import-substitution crops). In such cases, the country does not have a comparative advantage i nproduction.
DRC analysis begins with the development of a crop budget for each production alternative bein gcompared (and where relevant, includes production systems using different techniques, e.g. hand-tool vs.
For example, just because country X can export crop Y competitively in world markets doesn't mean they have a comparative23
advantage in producing that crop for export. They may be heavily subsidizing the production of that crop, and the cost of thosesubsidies to the country must be taken into account before we can say they have a comparative advantage.
53
animal traction). The determination of profit actually received by farmers (i.e. financial profitability) is astraightforward and important initial result of the analysis. It shows which farmers are competitiv ecurrently and how their profits might change if price policies were changed.
Beyond financial profitability is the issue of economic efficiency or comparative advantage of th ecommodity system. One of the ad vantages of the DRC methodology is that it requires opportunity costingof primary factors of production: land, labor, and capital. The opportunity cost of inputs and outputs in theproduction process are represe nted by economic or shadow prices (also called social prices). These pricesare intended to reflect the true economic value of goods and services in the absence of government policiessuch as taxes, subsidies, import tariffs, quotas, and price controls. When output, inputs, and factors o fproduction are valued at their shadow prices, the profitability figure calculated is said to be that o feconomic profitability, reflecting the real economic returns to a given production activity, as opposed tofinancial returns.
Comparative Advantage Versus Export CompetitivenessThe terms "comparative advantage" and "export competitiveness" are confusing to many and should b eclarified here. The term "comparative advantage" is global in perspective, used for country analysis andconcerned mainly with economic analysis. The term "export competitiveness", on the other hand, i s23
restricted to financial analysis at market prices to determine the competitiveness of tradables in terms oftheir financial profitability to exporters. To an exporter, the competitiveness of a tradable depends on hisfinancial gain from a trade activity. Unless it is financially profitable, a commodity is not competitive toexport. An exporter is also interested to know how much financial cost he has to incur to earn a unit o fforeign exchange. The domestic resource cost analysis can be used at market prices to measure th ecompetitiveness of exports. A commodity has a competitive advantage when at prevailing market pricesits DRC is equal to or lower than the prevailing official exc hange rate. However, because policy distortionshave declined considerably over the last few years in all 3 countries, this financial analysis is felt to be astrong indication of comparative advantage.
The sections that follow provide analysis of the competitiveness and comparative advantage of eachof the three countries in the pr oduction and marketing of the crops in terms of East African (regional) andWorld markets.
COMPETITIVENESS AND COMPARATIVE ADVANTAGE OF MAIZE INEAST AFRICAThe detailed analysis of competitiveness and comparative advantage of maize in the three countries ar egiven in Table 8.1 and Appendix 6 of this report. From the tables it can be seen that the Kenyan large scalesector has no comparative advantage in maize production both in the regional and the world market. It isonly in the local Nairobi market that the Kenyan maize from that sector shows some comparativ eadvantage with a financial DRC ratio of 0.52. The corresponding DRC ratios are 1.72 for the Kampal amarket; 1.27 for the Dar es Salaam market and 12.45 for the world market. Smallholder maize in Kenyahowever, is found to be competitive in the world and all three regional markets of Nairobi (DRC ratio =0.48), Kampala (DRC = 0.53) and Dar-es-Salaam (DRC=0.68). However, smallholder production in Kenyais largely subsistence based, and the little surplus realized is generally sold locally with insignifican t
54
amounts left for export. It is the large sc ale producers who have adequate surplus for export in good years,although according to this study they seem to have no comparative advantage.
Indeed, a recent study reported that following the full liberalization of the maize marketing system in1993, Kenyan large scale maize millers have been finding it cheaper to import maize from South Africaand Argentina instead of sourcing their supplies from the local market (Odhiambo, 1994). Local maiz efarmers, unable to sell their maize, have launched a series of complaints to the Kenyan Government i norder to get protection from the cheap maize imports. By August 1994, the situation became so bad thatthe Kenyan Minister for Agriculture felt it necessary to impose a ban on maize imports as a protectio nmeasure for the local maize farmers. The ban was later lifted but replaced by a variable import duty levyon cheap cereal imports including maize.
The variable duty levy on cereals dates back to 1992 when the Government of Kenya (GOK) full yliberalized grain imports under i ts Cereals Sector Reform Program (CSRP) and the Structural AdjustmentPrograms. At that time a legal clause was gazetted imposing the levy as a protection for local producersagainst cheap imported grains like maize, wheat and rice. Howeve r, as of September 1994 the levy had stillnot been implemented. Finally in 1994 it was implemented replacing the total ban initially adopted t oprotect the farmer. The va riable duty levy is calculated as the difference between the local producer priceof a given grain and its import parity price. The duty is to be charged if the local producer price is greaterthan the import parity price for a given grain consignment. Only grains coming into Kenya as donationsor for famine relief aid are exempted from the duty.
The comparative advantage analysis for Ugandan maize (see Table 8.1 and Appendix 6) shows thatit is only competitive in the Kenyan (Nairobi) market (DRC ratio = 0.88). Ugandan maize is no tcompetitive and by implication has no comparative advantage in the world market and other regiona lmarkets of Dar es Salaam and ( surprisingly) Kampala. The financial DRC ratios are 1.51 and 1.97 for thein-country and regional markets of Kampala and Dar es Salaam respectively, and 17.15 for the worl dmarket.
A close look at the results given in the tables in Appendix 6 shows that Uganda's low maize yield smake production of the commo dity expensive. The off-farm and marketing costs are also more expensivebecause Uganda is land locked and most of the produce has to be moved primarily by road transport t oregional and world markets.
During 1993 and 1994, the World Food Program (WFP) has been the major buyer of Ugandan maizefor relief supplies to war-torn neighboring cou ntries such as Rwanda, Sudan and Somalia. The WFP offersprices 5-10 percent above the Kampala market price as long as that price is below the international priceCIF Kampala (Sekabembe, 1994). Some of the strategies that have been recommended to Ugandan fo rcapturing the Kenyan market include:
Making the maize cheaper by achieving higher yields through better crop husbandry.
Developing a maize trading center in the Eastern border towns of Uganda, closer to Kenya so tha ttransportation costs to Kenya can be reduced.
Using cheaper modes of transport like the railways instead of road transportation; and
Seeking bilateral arrangements through EAC or PTA to have Uganda maize imports to Keny aexempted from the variable duty levy.
The results obtained in this study somehow corroborate the findings of the 1993 Bank of Ugand aAgricultural Secretariat study which conc luded that Ugandan maize did not have a comparative advantage
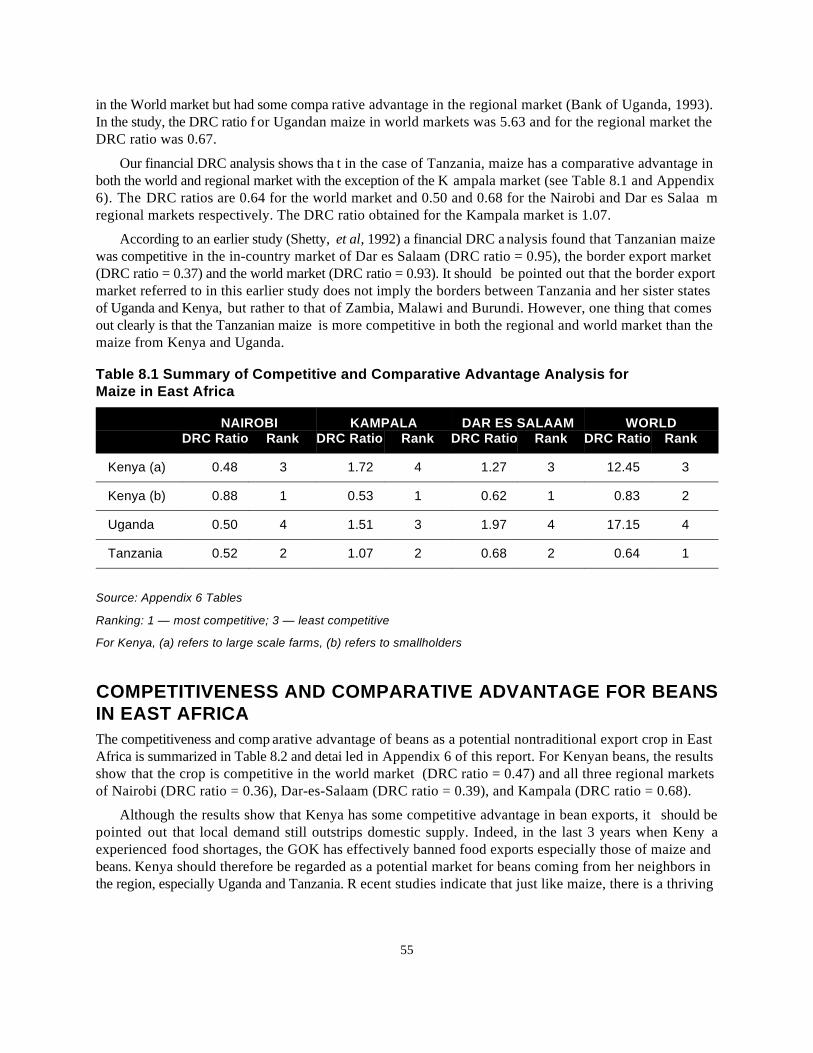
55
in the World market but had some compa rative advantage in the regional market (Bank of Uganda, 1993).In the study, the DRC ratio f or Ugandan maize in world markets was 5.63 and for the regional market theDRC ratio was 0.67.
Our financial DRC analysis shows tha t in the case of Tanzania, maize has a comparative advantage inboth the world and regional market with the exception of the K ampala market (see Table 8.1 and Appendix6). The DRC ratios are 0.64 for the world market and 0.50 and 0.68 for the Nairobi and Dar es Salaa mregional markets respectively. The DRC ratio obtained for the Kampala market is 1.07.
According to an earlier study (Shetty, et al, 1992) a financial DRC analysis found that Tanzanian maizewas competitive in the in-country market of Dar es Salaam (DRC ratio = 0.95), the border export market(DRC ratio = 0.37) and the world market (DRC ratio = 0.93). It should be pointed out that the border exportmarket referred to in this earlier study does not imply the borders between Tanzania and her sister statesof Uganda and Kenya, but rather to that of Zambia, Malawi and Burundi. However, one thing that comesout clearly is that the Tanzanian maize is more competitive in both the regional and world market than themaize from Kenya and Uganda.
Table 8.1 Summary of Competitive and Comparative Advantage Analysis forMaize in East Africa
NAIROBI KAMPALA DAR ES SALAAM WORLDDRC Ratio Rank DRC Ratio Rank DRC Ratio Rank DRC Ratio Rank
Kenya (a) 0.48 3 1.72 4 1.27 3 12.45 3
Kenya (b) 0.88 1 0.53 1 0.62 1 0.83 2
Uganda 0.50 4 1.51 3 1.97 4 17.15 4
Tanzania 0.52 2 1.07 2 0.68 2 0.64 1
Source: Appendix 6 Tables
Ranking: 1 — most competitive; 3 — least competitive
For Kenya, (a) refers to large scale farms, (b) refers to smallholders
COMPETITIVENESS AND COMPARATIVE ADVANTAGE FOR BEANSIN EAST AFRICAThe competitiveness and comp arative advantage of beans as a potential nontraditional export crop in EastAfrica is summarized in Table 8.2 and detai led in Appendix 6 of this report. For Kenyan beans, the resultsshow that the crop is competitive in the world market (DRC ratio = 0.47) and all three regional marketsof Nairobi (DRC ratio = 0.36), Dar-es-Salaam (DRC ratio = 0.39), and Kampala (DRC ratio = 0.68).
Although the results show that Kenya has some competitive advantage in bean exports, it should bepointed out that local demand still outstrips domestic supply. Indeed, in the last 3 years when Keny aexperienced food shortages, the GOK has effectively banned food exports especially those of maize andbeans. Kenya should therefore be regarded as a potential market for beans coming from her neighbors inthe region, especially Uganda and Tanzania. R ecent studies indicate that just like maize, there is a thriving
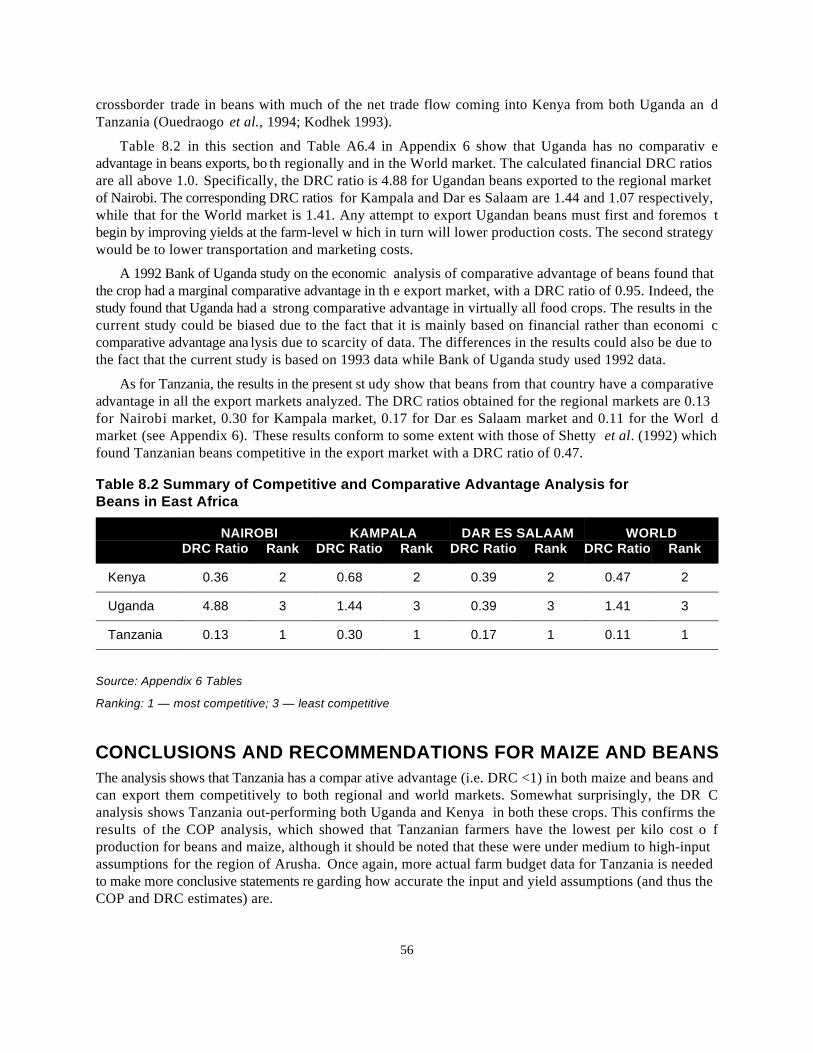
56
crossborder trade in beans with much of the net trade flow coming into Kenya from both Uganda an dTanzania (Ouedraogo et al., 1994; Kodhek 1993).
Table 8.2 in this section and Table A6.4 in Appendix 6 show that Uganda has no comparativ eadvantage in beans exports, bo th regionally and in the World market. The calculated financial DRC ratiosare all above 1.0. Specifically, the DRC ratio is 4.88 for Ugandan beans exported to the regional marketof Nairobi. The corresponding DRC ratios for Kampala and Dar es Salaam are 1.44 and 1.07 respectively,while that for the World market is 1.41. Any attempt to export Ugandan beans must first and foremos tbegin by improving yields at the farm-level w hich in turn will lower production costs. The second strategywould be to lower transportation and marketing costs.
A 1992 Bank of Uganda study on the economic analysis of comparative advantage of beans found thatthe crop had a marginal comparative advantage in th e export market, with a DRC ratio of 0.95. Indeed, thestudy found that Uganda had a strong comparative advantage in virtually all food crops. The results in thecurrent study could be biased due to the fact that it is mainly based on financial rather than economi ccomparative advantage ana lysis due to scarcity of data. The differences in the results could also be due tothe fact that the current study is based on 1993 data while Bank of Uganda study used 1992 data.
As for Tanzania, the results in the present st udy show that beans from that country have a comparativeadvantage in all the export markets analyzed. The DRC ratios obtained for the regional markets are 0.13for Nairobi market, 0.30 for Kampala market, 0.17 for Dar es Salaam market and 0.11 for the Worl dmarket (see Appendix 6). These results conform to some extent with those of Shetty et al. (1992) whichfound Tanzanian beans competitive in the export market with a DRC ratio of 0.47.
Table 8.2 Summary of Competitive and Comparative Advantage Analysis forBeans in East Africa
NAIROBI KAMPALA DAR ES SALAAM WORLDDRC Ratio Rank DRC Ratio Rank DRC Ratio Rank DRC Ratio Rank
Kenya 0.36 2 0.68 2 0.39 2 0.47 2
Uganda 4.88 3 1.44 3 0.39 3 1.41 3
Tanzania 0.13 1 0.30 1 0.17 1 0.11 1
Source: Appendix 6 Tables
Ranking: 1 — most competitive; 3 — least competitive
CONCLUSIONS AND RECOMMENDATIONS FOR MAIZE AND BEANSThe analysis shows that Tanzania has a compar ative advantage (i.e. DRC <1) in both maize and beans andcan export them competitively to both regional and world markets. Somewhat surprisingly, the DR Canalysis shows Tanzania out-performing both Uganda and Kenya in both these crops. This confirms theresults of the COP analysis, which showed that Tanzanian farmers have the lowest per kilo cost o fproduction for beans and maize, although it should be noted that these were under medium to high-inputassumptions for the region of Arusha. Once again, more actual farm budget data for Tanzania is neededto make more conclusive statements re garding how accurate the input and yield assumptions (and thus theCOP and DRC estimates) are.
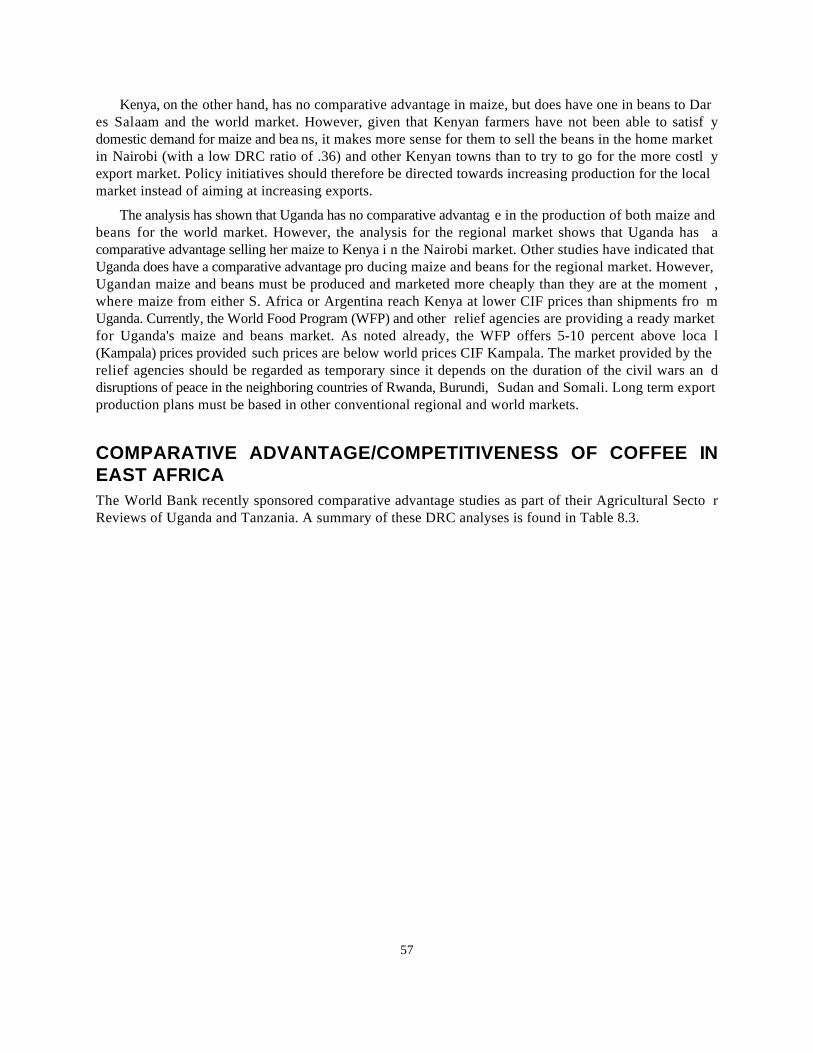
57
Kenya, on the other hand, has no comparative advantage in maize, but does have one in beans to Dares Salaam and the world market. However, given that Kenyan farmers have not been able to satisf ydomestic demand for maize and bea ns, it makes more sense for them to sell the beans in the home marketin Nairobi (with a low DRC ratio of .36) and other Kenyan towns than to try to go for the more costl yexport market. Policy initiatives should therefore be directed towards increasing production for the localmarket instead of aiming at increasing exports.
The analysis has shown that Uganda has no comparative advantag e in the production of both maize andbeans for the world market. However, the analysis for the regional market shows that Uganda has acomparative advantage selling her maize to Kenya i n the Nairobi market. Other studies have indicated thatUganda does have a comparative advantage pro ducing maize and beans for the regional market. However,Ugandan maize and beans must be produced and marketed more cheaply than they are at the moment ,where maize from either S. Africa or Argentina reach Kenya at lower CIF prices than shipments fro mUganda. Currently, the World Food Program (WFP) and other relief agencies are providing a ready marketfor Uganda's maize and beans market. As noted already, the WFP offers 5-10 percent above loca l(Kampala) prices provided such prices are below world prices CIF Kampala. The market provided by therelief agencies should be regarded as temporary since it depends on the duration of the civil wars an ddisruptions of peace in the neighboring countries of Rwanda, Burundi, Sudan and Somali. Long term exportproduction plans must be based in other conventional regional and world markets.
COMPARATIVE ADVANTAGE/COMPETITIVENESS OF COFFEE INEAST AFRICAThe World Bank recently sponsored comparative advantage studies as part of their Agricultural Secto rReviews of Uganda and Tanzania. A summary of these DRC analyses is found in Table 8.3.
58
Table 8.3 Comparative Advantage of Tanzanian and Ugandan Arabica Coffee — 1992($/kg)
OUTPUT Financial FinancialForeign Local Foreign Local
UGANDA TANZANIA
Economic Economic
Export Price ($/kg) 1.81 1.50
Exchange Rate (Shs/$) 900 325
OFF-FARM COSTS
Processing Costs .20 .03 .17 .27 .13 .14
Marketing Costs .19 .11 .08 .27 .13 .14
Collection Costs .03 0 .03 .009 0 .009
Total Off-Farm Costs .42 .14 .28 .55 .27 .28
ON-FARM COSTS
Fertilizers .09 .06 .03 .31 .25 .06
Hired Labor .10 0 .10 .19 0 .19
Transport/Others .008 0 .008 .01 .005 .005
Family Labor .34 0 .34 .46 0 .46
Fixed Costs .08 .04 .04 .11 .05 .06
Total On-Farm Costs .61 .10 .51 1.08 .31 .77
TOTAL COSTS 1.04 .25 .79 1.63 .58 1.05
Net Output Value .77 1.56 — -.14 .92
DRC Ratio .71 .53 1.15 .66
Sources: Bank of Uganda, 1993; World Bank, Tanzania Agricultural Sector Memorandum, 1993.
The DRC ratio, measured at market prices, can be used to measure financial competitive advantage,since to an exporter, the actual financial cost incurred fo r an export and the actual financial benefit realizedin local currency (and the ratio between the two) d etermines the comparative advantage of the commodity.This ratio thus provides a measure of financial competitiveness. It is com puted using the DRC ratio formulaat market prices and the of ficial exchange rate. For Tanzanian Arabica coffee the financial DRC measurewas 1.15 in 1992, indicating coffee was not financially profitable to export in 1992 (i.e. the domesti cfinancial costs incurred to earn a dollar from cof fee exports exceeded the official exchange rate at the timeof 325 TShs/$1).
The more recent Bank of Uganda comparative advantage analysis (June 1994, although the report was not available until Nov.24
1994) shows coffee now has a strong comparative advantage, with a DRC ratio of .22.
59
However, the economic analysis (i.e. looking a t it from the point of view of the economy) still showedTanzania had a comparative advantage in exports (i.e. DRC < 1). In ot her words, a simple move away fromthe overvalued official exchange rate (the most distorting policy) would make coffee exports profitabl eagain. Indeed, this appears to be what has happened in Tanzania in recent years. Several positive policychanges have occurred, boosting farmer incentives to produce more high quality coffee:
abolishment of the official exchange rate and 50 percent devaluation that followed.
abolishment in 1992 of the pooling system, resulting in TCMB paying the proceeds of the auctions toUnions within 3 weeks (who in turn must pay the Primary Cooperatives who pay the farmers)
after 1993, the Government stopped announcing the advance payment to made by Unions to farmers(which had previously caused high Union debts)
since March 1993, chemical inputs have been marketed by the private sector.
exporters can retain 10 percent of their earnings in foreign currency (this may be higher now).
The World Bank has been pursuing further liberalization measures with the Government of Tanzaniathat will address the issues of further streamlining the processing and marketing of coffee (e.g. allowingthe private sector to purchase coffee directly from the farmers, and privatizing the curing companies andmills). If implemented properly, these policy changes should lead to lower processing and marketing costs,thereby increasing the competitiveness of Tanzania coffee further.
The financial analysis for Uganda showed tha t coffee was financially profitable to export, with a DRCratio of less than one (.71). However, from a financial profitability point of view, the nontraditional exportcrops vanilla, mulberry silk, cardamon, tobacco, chilies and cashew nuts all ranked higher than coffee in1992 (and 1993). With the recent high world price for coffee, this changed dramatically in 1994 whe nprofits increased to 5 times the 1993 levels (Bank of Uganda, Nov. 1994).
The economic analysis found that Uganda had a relatively strong comparative advantage in coffe eexports, with an economic DRC ratio of .66. It is informative to note that in previous years, comparativeadvantage analyses for Ugandan coffee found that it did not enjoy a compara tive advantage, largely becauseof an overvalued official exchange rate. With the removal of this policy distortion (coffee was brough tunder a market exchange rate in 1992), Uganda has become more competitive in coffee. The 1993 studyalso measured the degree of policy distortions affecting input and output prices, and found that unlik eprevious years when policy distortions created negative incentives, Ugandan farmers and exporters facedpositive incentives to produce coffee .24
In the case of Kenya, no formal 1993 DRC analysis exists for a direct comparison with the Uganda andTanzania data. However, it is interesting to look at what is happening currently in the world coffee market,and how it may impact on Kenya's coffee farmers. Since 1993, world coffee prices have been on the rise,peaking at $5000/ton for Arabica coffee in mid-1994 from a low point of $1500/ton in 1989. They haverecently fallen back down to levels of around $4000/ton.
Assume a world price of $4000/ton ($4/kg, or $1.77/lb.): this is the equivalent of 180 Shs/kg at a nexchange rate of 45 KShs/$1.
Last year, lack of availability of foreign currency coupled with a duty on imported chemicals meant many farmers and25
cooperatives could not get the chemical inputs they desired. There is no longer a duty on these inputs, foreign exchange isreadily available, and farmers can purchase inputs from private traders. All these policy changes have increased the availabilityof inputs, which coffee farmers are starting to use once again.
60
Subtract international transport costs to Mombasa of 10 Shs/kg (adjusted from rates calculated i nKristjanson et al., 1990), to arrive at a f.o.b. Mombasa equivalent pric e of 170 Shs/kg; subtract 6 Shs/kgfor Mombasa — Nairobi transport charges (CMB, personal communication), to get a Nairobi price of164 Shs/kg.
Kenyan smallholders receive on average 70 percent of the world price, therefore, currently Kenya nfarmers should be receiving 115 Shs/kg for their coffee. L ast year, according to the PAM budgets, theyreceived from 19 - 28 Shs/kg. In othe r words, farmers should currently be receiving a price four timeshigher than the price they received last year.
According to the CMB, the current average auction price in Nairobi is $4/kg. The CMB calculates onaverage the milling/CMB charges are 10 percent of the auction price and the cooperative societ ycharges range from an additional 7 to 30 percent, and ave rage around 20 percent. Deducting 30 percentfrom $4/kg implies a farm-level price of 140 Shs/kg (at an exchange rate of $1=45 KShs).
The positive response by Kenyan coffee farmers to better price incentives (and timely payments dueto the new direct sales system) is being seen now through a sharp increase in demand for coffee seedlings.The CMB is now under attack for not being able to supply sufficient seedlings. There is an 18-24 monthtime lag after prices rise before an increase of cherry coffee will be seen in the market, however .Liberalization of the input market is currently benefitting farmers, however, who are now facing no inputavailability problems as they did in the past .25
CONCLUSIONS AND RECOMMENDATIONS FOR COFFEEIt is clear from the analysis that all three countries have a comparative advantage in coffee, with DRC'sbelow one at a time when the world price of coffee was still very low. Currently, they are all extremelycompetitive in world markets, where demand is outstripping supply and quotas are no longer in place forthe time being. It is also clear that they could all be even mo re competitive through reductions in marketingand processing costs (particularly by inefficient cooperatives), and better husbandry practices. Mos tsmallholders have, until recently, applied very low amoun ts of recommended fertilizers and pesticides, andare consequently getting extremely low yields. Policy liberalization has l ed to improved incentives to coffeefarmers via an increase in the percentage of the world price they are receiving.
COMPARATIVE ADVANTAGE/COMPETITIVENESS OF TEXTILES INEAST AFRICAThe comparative advantage analysis for textiles relied primarily on the direct cost methodology. Due tothe extensive data collection requirements of the DRC approach, it was not possible to do a comprehensiveDRC analysis for the countries under this study. DRC analysis has been done previously, however, i nUganda, Kenya and Rwanda, and will be used to complement the analysis performed under the direct costapproach. The analysis will attempt to highlight areas of specific comparative advantage for the countriesin the region and where relevant, the region as a whole.
61
The basis for the analysis will be the cost data presented in Chapter 7 of this report. This will b ecomplemented by secondary data on the subject including DRC analysis that has been performed. Th eanalysis will examine the following categories as measures of efficiency:
Inputs
Labor
Capital/Technology
Managerial skills
Infrastructure
Local Linkages
Export trends
INPUTSThe main inputs in the production process are cotton, synthetics, dyes and chemicals. The analysis i nChapter 7 identified high costs of cotton as a significant constraint in Ken ya. The cotton sub-sector has beenanalyzed thoroughly in Kenya by the Government and the World Bank and as a result it has been full yliberalized recently. The effects of liberalization have not yet been realized but are expected to in the nearfuture as ginning quality and capacity improves and farmers receive adequate incentives for production.In the next few years however, cotton production will be insufficient to meet local demand and will addsignificantly therefore to the costs of production of Kenyan firms.
In Uganda and Tanzania, thus far, sufficient cotton is being supplied to industry and in the case o fTanzania, substantial revenue is earned through exports. In Uganda there have been complaints of lo wquality cotton and inadequate supply, but due to the low level of capacity utilization it has not been a majorissue. In the medium to long term however, it will be necessary to revitalize cotton growing to meet theexpected increase in demand as the publicly owned textile mills are privatized. The government i scommitted to doing just that and recent liberalization measures introduced in the 1994/95 budget, i fimplemented, will greatly help to facilitate improved production.
In the medium to long term, therefore, cotton should be a raw material of easy access for all thre ecountries. Tanzania at present has a comparative advantage over Kenya and Uganda in cotton productionas evidenced by its lower prices and exports to Kenya. All other aspects being equal, Tanzania should havea comparative advantage in cotton based textiles vis a vis the other countries. As will be seen however ,other factors play just as, if not a more important role in determining comparative advantage.
Dyes and ChemicalsThe majority of dyes and chemicals are imported into the region. The prices faced by manufacturer stherefore are world market prices, plus duties and taxes levied on these inputs. From the price dat acollected in the region, the prices faced by Kenya and Uganda are similar. In Tanzania, the prices vary,some being cheaper and others more expensive. Based on the cost structure analyzed in Section 7.2 ,Uganda and Kenya have a cost advantage over Tanzania, however a more detailed analysis of prices andlevel of input use would need to be done to make a definitive conclusion. Kenya has a distinct advantageover Uganda once duties and taxes are removed, since transport cost s add 23 percent to the cost of dyes and
Ministry of Commerce, 1994.26
The short run DRC's are based on the assumption that capital is a sunk cost and is fixed. The long run DRC's assume that27
capital is not fixed but is replaceable in the long run.
62
chemicals in Uganda. This is the actual case for exporters in Kenya, as they can claim duty and VA Texemption for all exported products.
As for the world market, none of the countries i n the region has a cost advantage since these inputs areimported. Products that require a significant input of dyes and chemicals will place these countries at acomparative disadvantage. This has been aggravated by liberalization measures in these countries whichhave resulted in significant currency devaluations making imports even more expensive. This, coupled withhigh finance costs have made it diffic ult for a number of firms in the region to finance the imports of dyesand chemicals. As a result, production quality has suffered.
Synthetic InputsThese include Nylon, Polyester, Terylene, Acrylic and Rayon. None of these inputs are produced in theregion, they come primarily from Europe either as filaments or chips. The costs of transporting thes einputs, particularly the chips is very high. As a result, none of the countries in the region have acomparative advantage globally in synthetic based products or blends. Kenya, due to the technology i nplace and slightly lower costs, may have a comparative advantage in the region for transforming th efilaments or chips into yarn or fabrics and exporting them to countries in the region.
Evidence from export data from Kenya between March and July 1994 suggests that there are exportsof some synthetic products from Kenya to the region. Total exports to the PTA during this period amountedto Kshs 160 million. Of this, 15 percent or Kshs 24 million were synthetic yarns or fabrics. The main exporthas been polyester yarn or fabric which accounted for 87 percent of synthetic exports. 26
Data on the precise destination of these exports was not available, however the fact that Kenyan firmsare able to export to the PTA is evidence of regional comparative advantage, at least for polyester yarn andfabrics. It is doubtful whether this product i s able to compete effectively in international markets however.The World Bank calculated that the s hort run DRC for polyester yarn was 2.25 and the long run DRC was5.63 . The effective protection rate (EPR) was also very high at 806 percent. DRC's and EPR's for other27
polyester fabrics was just as high (see Table 8.4). Although this data was for 1987, it is indicative of theinefficiency of production for this particular product which was only successful due to the high protectiongiven. Efficiency has probably not improved considerably given the high import content (88 percent). Itappears that these Kenyan firms would probably not be able to compete with imports from South East Asiawithout significant protectio n. They are probably able to penetrate the PTA market due to the preferentialtariffs accorded products from the PTA region. In the long term, however, these firms may not be able tocompete as tariff barriers are reduced and cheaper priced synthetics flood the market.
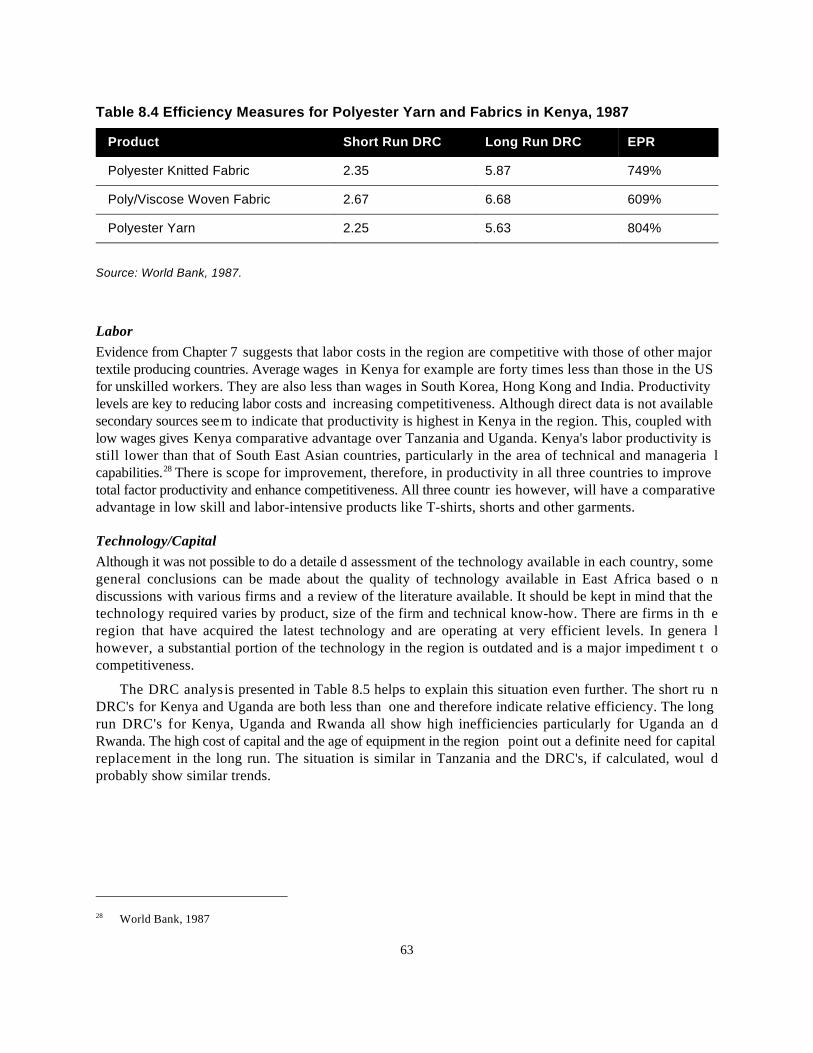
World Bank, 198728
63
Table 8.4 Efficiency Measures for Polyester Yarn and Fabrics in Kenya, 1987
Product Short Run DRC Long Run DRC EPR
Polyester Knitted Fabric 2.35 5.87 749%
Poly/Viscose Woven Fabric 2.67 6.68 609%
Polyester Yarn 2.25 5.63 804%
Source: World Bank, 1987.
LaborEvidence from Chapter 7 suggests that labor costs in the region are competitive with those of other majortextile producing countries. Average wages in Kenya for example are forty times less than those in the USfor unskilled workers. They are also less than wages in South Korea, Hong Kong and India. Productivitylevels are key to reducing labor costs and increasing competitiveness. Although direct data is not availablesecondary sources seem to indicate that productivity is highest in Kenya in the region. This, coupled withlow wages gives Kenya comparative advantage over Tanzania and Uganda. Kenya's labor productivity isstill lower than that of South East Asian countries, particularly in the area of technical and manageria lcapabilities. There is scope for improvement, therefore, in productivity in all three countries to improve28
total factor productivity and enhance competitiveness. All three countr ies however, will have a comparativeadvantage in low skill and labor-intensive products like T-shirts, shorts and other garments.
Technology/CapitalAlthough it was not possible to do a detaile d assessment of the technology available in each country, somegeneral conclusions can be made about the quality of technology available in East Africa based o ndiscussions with various firms and a review of the literature available. It should be kept in mind that thetechnology required varies by product, size of the firm and technical know-how. There are firms in th eregion that have acquired the latest technology and are operating at very efficient levels. In genera lhowever, a substantial portion of the technology in the region is outdated and is a major impediment t ocompetitiveness.
The DRC analysis presented in Table 8.5 helps to explain this situation even further. The short ru nDRC's for Kenya and Uganda are both less than one and therefore indicate relative efficiency. The longrun DRC's for Kenya, Uganda and Rwanda all show high inefficiencies particularly for Uganda an dRwanda. The high cost of capital and the age of equipment in the region point out a definite need for capitalreplacement in the long run. The situation is similar in Tanzania and the DRC's, if calculated, woul dprobably show similar trends.
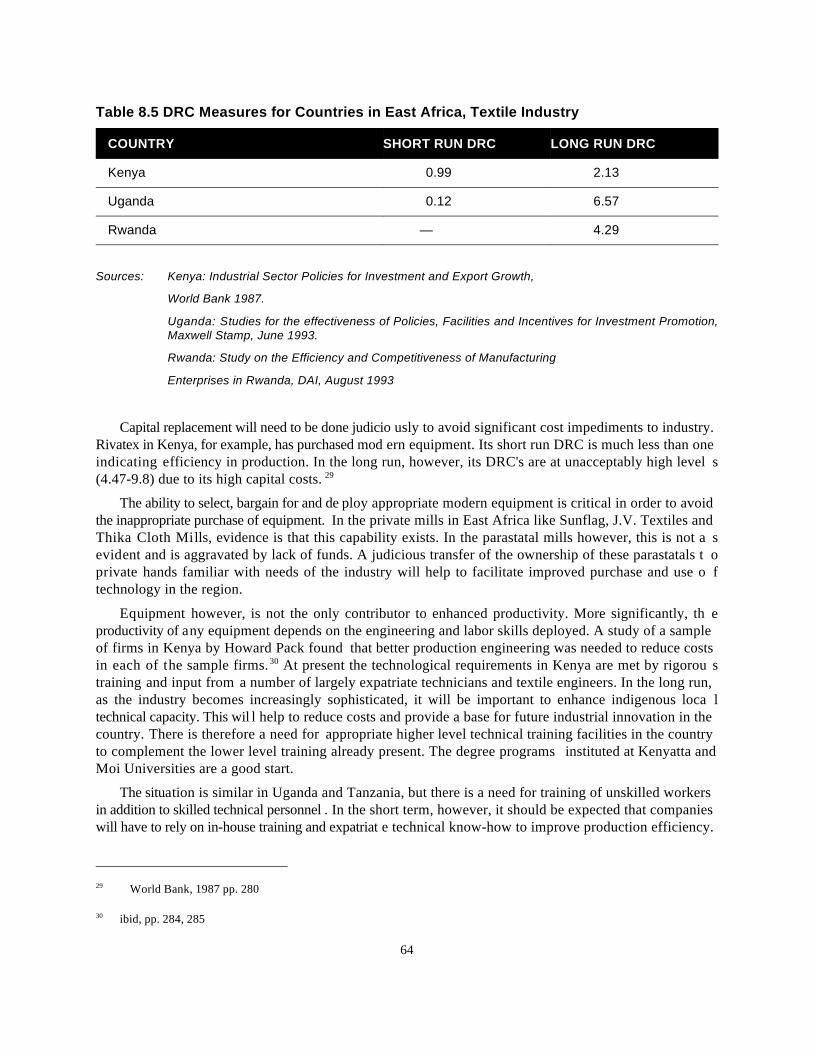
World Bank, 1987 pp. 28029
ibid, pp. 284, 28530
64
Table 8.5 DRC Measures for Countries in East Africa, Textile Industry
COUNTRY SHORT RUN DRC LONG RUN DRC
Kenya 0.99 2.13
Uganda 0.12 6.57
Rwanda — 4.29
Sources: Kenya: Industrial Sector Policies for Investment and Export Growth,
World Bank 1987.
Uganda: Studies for the effectiveness of Policies, Facilities and Incentives for Investment Promotion,Maxwell Stamp, June 1993.
Rwanda: Study on the Efficiency and Competitiveness of Manufacturing
Enterprises in Rwanda, DAI, August 1993
Capital replacement will need to be done judicio usly to avoid significant cost impediments to industry.Rivatex in Kenya, for example, has purchased mod ern equipment. Its short run DRC is much less than oneindicating efficiency in production. In the long run, however, its DRC's are at unacceptably high level s(4.47-9.8) due to its high capital costs. 29
The ability to select, bargain for and de ploy appropriate modern equipment is critical in order to avoidthe inappropriate purchase of equipment. In the private mills in East Africa like Sunflag, J.V. Textiles andThika Cloth Mills, evidence is that this capability exists. In the parastatal mills however, this is not a sevident and is aggravated by lack of funds. A judicious transfer of the ownership of these parastatals t oprivate hands familiar with needs of the industry will help to facilitate improved purchase and use o ftechnology in the region.
Equipment however, is not the only contributor to enhanced productivity. More significantly, th eproductivity of any equipment depends on the engineering and labor skills deployed. A study of a sampleof firms in Kenya by Howard Pack found that better production engineering was needed to reduce costsin each of the sample firms. At present the technological requirements in Kenya are met by rigorou s30
training and input from a number of largely expatriate technicians and textile engineers. In the long run,as the industry becomes increasingly sophisticated, it will be important to enhance indigenous loca ltechnical capacity. This wil l help to reduce costs and provide a base for future industrial innovation in thecountry. There is therefore a need for appropriate higher level technical training facilities in the countryto complement the lower level training already present. The degree programs instituted at Kenyatta andMoi Universities are a good start.
The situation is similar in Uganda and Tanzania, but there is a need for training of unskilled workersin addition to skilled technical personnel . In the short term, however, it should be expected that companieswill have to rely on in-house training and expatriat e technical know-how to improve production efficiency.
65
In this regard, the countries in the East African region are at a comparative disadvantage to countries inEurope and Asia that have a vast po ol of technical expertise to choose from at a relatively lower cost. Thelong term development of indig enous technical capacity in the region will go a long way to improving theproduction efficiency and competitiveness of firms in the region.
Other Managerial SkillsA World Bank study of the textile industry in Kenya identified marketing and product design as skills foundlacking in Kenyan management. The comparative advantage identified for Kenya in the near future as aresult, would be standardized, unbr anded and lower price products as more advanced competitors (the FarEastern NICs) moved into more differentiated, upmarket higher quality products. The data on recen texports from Kenya seems to sub stantiate this prognosis. The main exports to the USA and Europe are T-shirts, shorts, yarn and pillowcases. These are relatively simple, low cost products with a high impor tcontent and requiring very little product design and innovation. The majority of these products ar emanufactured from the EPZ or MUB factories in Kenya, although some firms outside are als omanufacturing for export.
Given similar constraints in Uganda and Tanzania, comparative advantage in these areas would alsobe likely. The advantage of EPZ's and MUB's with access to relati vely good infrastructure is not yet readilyavailable in Uganda and Tanzania which puts them at a slight comparative disadvantage vis-a-vis Kenya.
InfrastructureCheap, readily available and reliable infrastructure is a critical i nput in the production process. The analysisin Chapter 7 highlighted a number of constraints faced by firms in the region. Electricity costs are generallyhigh, but highest in Uganda and Tanzania. Frequent power cuts have affe cted industry in all three countries,but particularly in Uganda and T anzania. Water shortages in Kenya and Tanzania have adversely affectedthe production and output of a number of firms, particularly in Tanzania.
Telecommunication costs are also high in all three countries but particularly in Tanzania wher einternational calls cost as much as $6.00/ minute. Fuel costs are also high due to government taxes, refinerycosts and in the case of Uganda transport costs.
On the whole therefore, infrastructure in all three countries c annot be considered as a major contributorto comparative advantage in textile manufacturing. In fact in many instances it has been a disadvantage.Comparatively, however, Kenya appears to have better infrastructure in place than Uganda or Tanzania.Nevertheless, there is a need for all three countries to focus on improving the infrastructure considerablyin order to reduce costs of production in the textile industry and manufacturing in general.
Local LinkagesApart from local cotton and yarn, textile firms in the region have few backward linkages with the economy.In Kenya for example, the EPZ/MUB firms source all their inputs from overseas, even the fabric. Th emetal/foundry industry is not s ufficiently developed in any of these countries to facilitate the manufactureof spare parts. Some firms have their own inhouse repair workshops bu t this is not dispersed and the benefitto other firms is minimal. The general low level of development of the engineering sector has held backthe growth of supplies of spares and equipment. This has greatly affected the costs of operation an dmaintenance for textile manufacturers in general . Particularly in parastatal firms, there is considerable idlecapacity due to inoperative machines and lack of funds to buy spare parts. The high duties on spare partshave also affected costs of production (45 percent in Kenya for example).
As mentioned earlier, there are also very few technical experts/consultants in the region, which addsto maintenance costs as problems are either solved in-house or left unattended. There is a definite need to
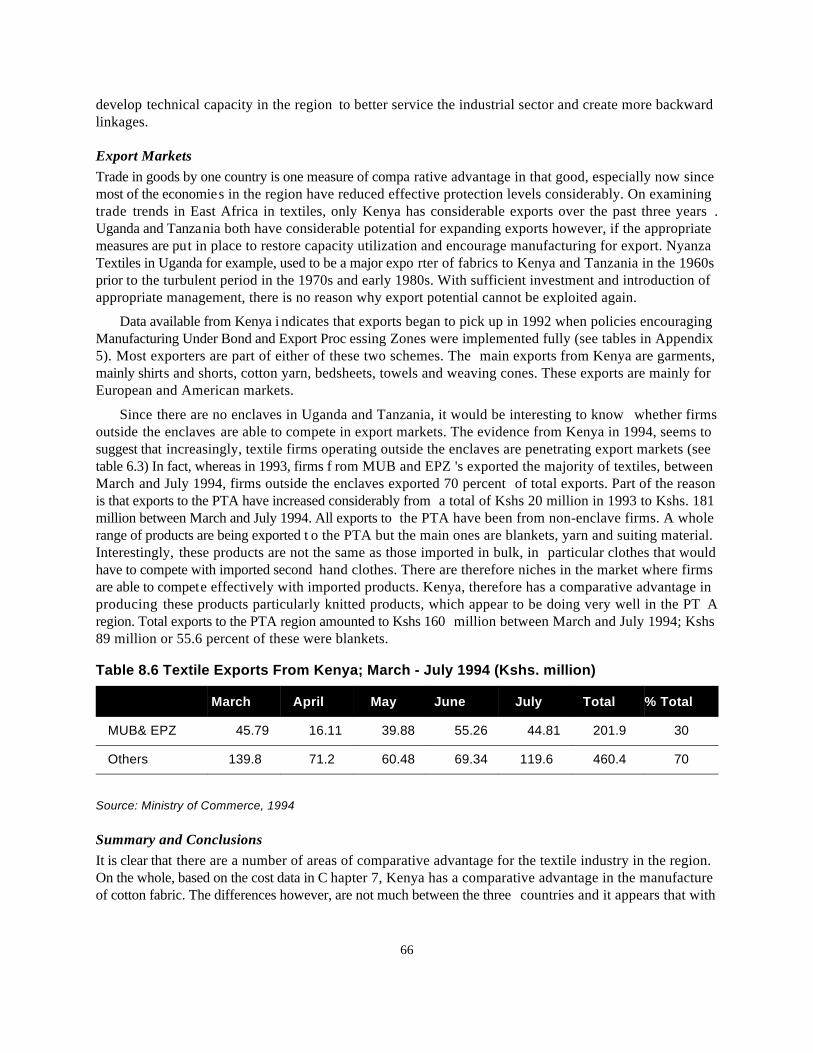
66
develop technical capacity in the region to better service the industrial sector and create more backwardlinkages.
Export MarketsTrade in goods by one country is one measure of compa rative advantage in that good, especially now sincemost of the economies in the region have reduced effective protection levels considerably. On examiningtrade trends in East Africa in textiles, only Kenya has considerable exports over the past three years .Uganda and Tanzania both have considerable potential for expanding exports however, if the appropriatemeasures are put in place to restore capacity utilization and encourage manufacturing for export. NyanzaTextiles in Uganda for example, used to be a major expo rter of fabrics to Kenya and Tanzania in the 1960sprior to the turbulent period in the 1970s and early 1980s. With sufficient investment and introduction ofappropriate management, there is no reason why export potential cannot be exploited again.
Data available from Kenya i ndicates that exports began to pick up in 1992 when policies encouragingManufacturing Under Bond and Export Proc essing Zones were implemented fully (see tables in Appendix5). Most exporters are part of either of these two schemes. The main exports from Kenya are garments,mainly shirts and shorts, cotton yarn, bedsheets, towels and weaving cones. These exports are mainly forEuropean and American markets.
Since there are no enclaves in Uganda and Tanzania, it would be interesting to know whether firmsoutside the enclaves are able to compete in export markets. The evidence from Kenya in 1994, seems tosuggest that increasingly, textile firms operating outside the enclaves are penetrating export markets (seetable 6.3) In fact, whereas in 1993, firms f rom MUB and EPZ 's exported the majority of textiles, betweenMarch and July 1994, firms outside the enclaves exported 70 percent of total exports. Part of the reasonis that exports to the PTA have increased considerably from a total of Kshs 20 million in 1993 to Kshs. 181million between March and July 1994. All exports to the PTA have been from non-enclave firms. A wholerange of products are being exported t o the PTA but the main ones are blankets, yarn and suiting material.Interestingly, these products are not the same as those imported in bulk, in particular clothes that wouldhave to compete with imported second hand clothes. There are therefore niches in the market where firmsare able to compete effectively with imported products. Kenya, therefore has a comparative advantage inproducing these products particularly knitted products, which appear to be doing very well in the PT Aregion. Total exports to the PTA region amounted to Kshs 160 million between March and July 1994; Kshs89 million or 55.6 percent of these were blankets.
Table 8.6 Textile Exports From Kenya; March - July 1994 (Kshs. million)
March April May June July Total % Total
MUB& EPZ 45.79 16.11 39.88 55.26 44.81 201.9 30
Others 139.8 71.2 60.48 69.34 119.6 460.4 70
Source: Ministry of Commerce, 1994
Summary and ConclusionsIt is clear that there are a number of areas of comparative advantage for the textile industry in the region.On the whole, based on the cost data in C hapter 7, Kenya has a comparative advantage in the manufactureof cotton fabric. The differences however, are not much between the three countries and it appears that with
67
significant improvements in capacity ut ilization and the costs of infrastructure, both Uganda and Tanzaniacould reduce their production costs to the same, if not lower, levels than Kenya.
The comparative advantage analysis identified the following points:
Uganda and Tanzania have a comparative advantage in cotton production and with significan timprovements in other areas could produce very cheap cotton based products. Kenya, if the cotto nindustry is revitalized could also be in a similar position in the medium to long term but presently isat a disadvantage vis a vis its neighbors.
Dyes and chemicals contribute negatively to comparative advantage for all three countries, but moreso for Uganda as they face significant transport costs.
None of the countries in the region have a comparative advantage for synthetic based products in theworld market. Kenya has a regional comparative advantage for polyester yarn and fabrics and i sexporting to other PTA countries.
All countries in the region have a comparative advantage in low skill, labor-intensive products like t-shirts, shorts and other garments. Productivity in the region however, is comparatively low vis a visSouth East Asia and if improved would help firms to compete more effectively with the low cos timports flooding the market at present.
Due to the low level of technical ex pertise and the high cost of capital, firms in the region do not havea comparative advantage in capital-intensive, high-tech production, at least in the short term. Criticalfor all three countries is to develop the local technical capacity first and then facilitate greater capitalinvestment.
Sophisticated marketing skills are also not readily available in the regional context, although slowlyas Kenyan firms gain experience in export markets they are becoming increasingly savvy marketers.Still, in the near term, all three countries have a comparative advantage in relatively simple, low costproducts like T-shirts, shorts, blankets yarn and pillowcases.
None of the countries has a relatively superior infrastructure in the global context. Regionally, Kenyahas an advantage due to its slightly superio r infrastructure including the EPZ's. All three countries willneed to improve the quality, reliability and cost of the infrastructure in place in order to reduce costsof production to even more competitive levels in the future.
Backward linkages to industry apart from cotton and yarn are not very prevalent in the region. Thi saffects in particular capital intensive operations that are reliant on spare parts and engineering /maintenance. In the short term, the region has a comparative advantage on simpler operations lik eMUB's cutting, making and packing that are less reliant on outside technical expertise.
Kenya's increasing presence in the export mar kets in the region and internationally is evidence that theregion has the potential to develop efficient, world class industry capable of competing on a globa lscale. Its presence in the export markets is also evidence that presently it has the most competitive andefficient industrial base in the region.

68
69
Appendix 1Statement of Work
COMPARATIVE COSTS OF PRODUCTION ANALYSIS — EAST AFRICA
BackgroundREDSO/ESA is interested in providing a grant for the services of an African based institution, firm o rindividual who will gather and analyze data on the costs of production in East Africa. This will involv ecollecting data on labor, rents, utilities, inputs, other variable costs, capital items, and cost of capita l(interest), for comparable produ ction activities. The consultant shall include any other costs, taxes, duties,etc., which may be associated with determining the regional competitiveness of the five countries in EastAfrica (Kenya, Uganda, Tanzania, Burundi, Rwanda). The analysis will also incorporate comparativ eanalysis of transportation costs conduct ed in another study as well as similar studies which may have beenconducted recently in the region (Rwanda).
Specific TasksThe consultant will carry out the following tasks:
1. Selection of sectors for analysis to include sub-sectors of agriculture and manufacturing. These havebeen pre-selected to include the following:
• maize,
• beans,
• potatoes,
• coffee,
• beer brewing and bottling,
• textiles, and
• soaps and detergents.
2. Comparative costs of labor, rents, utilities, key inputs, other variable costs, capital items, costs o fcapital, and others;
3. Comparative costs associated with the regulatory environment including taxes, etc;
4. Comparative costs of services including tra nsport, insurance, energy (electricity and petroleum inputs)and banking as input costs in the production process of the sub-sectors under review.
5. Analyze the information outlined above to establish a comparative cost structure of production for theselected sub-sectors of the countries in the region. Specifically,
• The analysis of production costs for each of the above sub-sectors should trace and classif yappropriately, all the relevant and comparable production costs in the five East African countries(Kenya, Uganda, Tanzania, Burundi and Rwanda).
70
• Production cost analysis will assume a medium to large scale level of activity for the sub-sectorsunder consideration.
Small Scale : 11 - 50 Employees
Medium Scale: 51 - 100 Employees
Large Scale: 101 & More Employees
• For comparative purposes, the costs should be converted t o US$ equivalent providing the exchangerate used.
• The sub-sector cost analysis shall be summarized into a matrix listing the sub-sector / cos tclassification on the one axis and the countries being compared on the other.
6. Rank the five countries in the region, by sub-sector, according to their competitiveness/costs o fproduction highlighting where countries have a specific advantage ov er others in the region and providerecommendations on how the least competitive countries could improve.
Anticipated Effort It is anticipated that this work will take approximately two months to complete. It is anticipated that fieldtrips to each of the five countries will be made as appropriate. For Rwanda and Burundi, information willhave to be collected from secondary sources since it is not advisable to travel to these countries due to civilstrife. Some of this analysis has been conducted in a recently completed study by the USAID/Rwand amission. It is anticipated that the bulk of the work will be conducted from Nairobi. Work plans, selectionof sub-sectors, and draft reports will be submitted to REDSO/ESA, AFR/ARTS/FARA/FSP, an dappropriate AID missions for review and comment.
OutputsThe sub-grantee/contractor will be responsible for producing draft and final reports which address all ofthe analytical requirements outlined above. Draft and final reports will be prepared covering productioncosts for the region broken down by sub-sector and country. Tables will be provided which allow for easycomparison of cost structures for each country by sub-sector. As appropriate, results will be presented tointerested representatives from the private s ector, host governments and donor community as well as otherresearchers or research institutions.
71
Appendix 2Coffee Cost of Production
KENYASmallholders producing coffee in Kenya have an average of one acre of coffee per farm. The total 1992small-scale coffee acreage for all of Kenya was 310,248 acres, with 64 percent of it grown i nCentral/Eastern Provinces (approximately 200,000 acres).
The major input activities in Central & Eastern Provinces are the following:
Manuring
Minimal spraying
Pruning activities — change of cycle and handling/desuckering: 35-60 mandays/acre
Manual weeding: ranges from 27 - 54 mandays per acre
Representative farm cost of product ion budgets are shown for Kenya's main coffee producing areas inCentral and Eastern Provinces. These were estimated by the PAM team (a USAID/Egerton Universit yproject) and are replicated here. Thanks to the comprehensive work of the PAM team, these detaile dKenyan COP budgets can be used to compare the crop year 1991/92 (the crop year begins in April, and thecoffee is marketed in the following year) to 1992/93, when the world price of coffee had improve dsomewhat (for the 1993/94 season, the world price of coffee has doubled since 1991/92).
Cost of Producing Coffee in Nyeri DistrictNyeri was chosen as a district representative of many areas in Kenya where due to the past low worl dcoffee prices, smallholders have been neglecting their coffee and the practice of intercropping i swidespread. Around 80 percent of Nyeri coffee farmers are intercropping, 10 percent have abandoned theircoffee, and 10 percent still maintain purestand coffee. Average district coffee yields range from 130 k gclean coffee per acre to 300 kgs/acre, although yield potentials are as high as 800 kgs/acre clean coffee.
Table A2.1 presents COP data for Nyeri district. From this comparative budge t, it can be seen that inputcosts increased considerably from 1991/92 to 1992/93, with pesticide costs tripling. This was largely dueto the depreciation of the Kenyan Shilling (from around 30 to 60 Shs/$), which increased the cost o fimported chemical inputs. Total costs per hectare increased from $389 to $478 (23 percent).
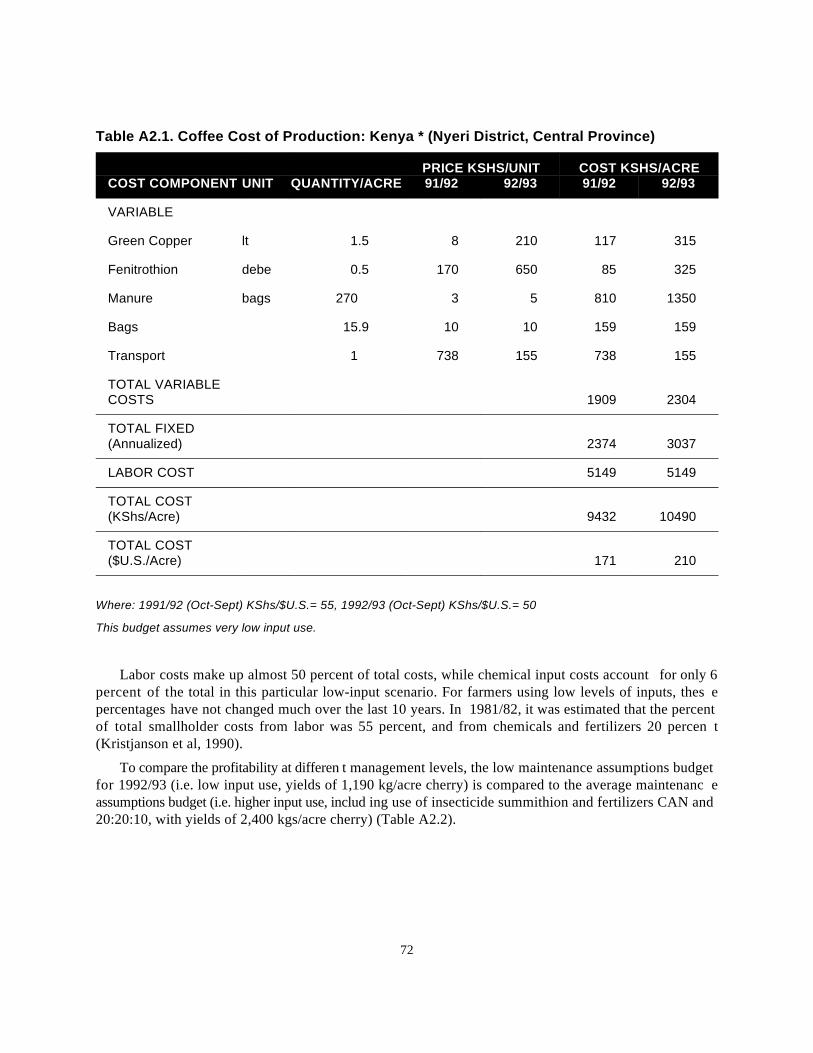
72
Table A2.1. Coffee Cost of Production: Kenya * (Nyeri District, Central Province)
COST COMPONENT UNIT QUANTITY/ACRE 91/92 92/93 91/92 92/93PRICE KSHS/UNIT COST KSHS/ACRE
VARIABLE
Green Copper lt 1.5 8 210 117 315
Fenitrothion debe 0.5 170 650 85 325
Manure bags 270 3 5 810 1350
Bags 15.9 10 10 159 159
Transport 1 738 155 738 155
TOTAL VARIABLECOSTS 1909 2304
TOTAL FIXED(Annualized) 2374 3037
LABOR COST 5149 5149
TOTAL COST(KShs/Acre) 9432 10490
TOTAL COST($U.S./Acre) 171 210
Where: 1991/92 (Oct-Sept) KShs/$U.S.= 55, 1992/93 (Oct-Sept) KShs/$U.S.= 50
This budget assumes very low input use.
Labor costs make up almost 50 percent of total costs, while chemical input costs account for only 6percent of the total in this particular low-input scenario. For farmers using low levels of inputs, thes epercentages have not changed much over the last 10 years. In 1981/82, it was estimated that the percentof total smallholder costs from labor was 55 percent, and from chemicals and fertilizers 20 percen t(Kristjanson et al, 1990).
To compare the profitability at differen t management levels, the low maintenance assumptions budgetfor 1992/93 (i.e. low input use, yields of 1,190 kg/acre cherry) is compared to the average maintenanc eassumptions budget (i.e. higher input use, includ ing use of insecticide summithion and fertilizers CAN and20:20:10, with yields of 2,400 kgs/acre cherry) (Table A2.2).
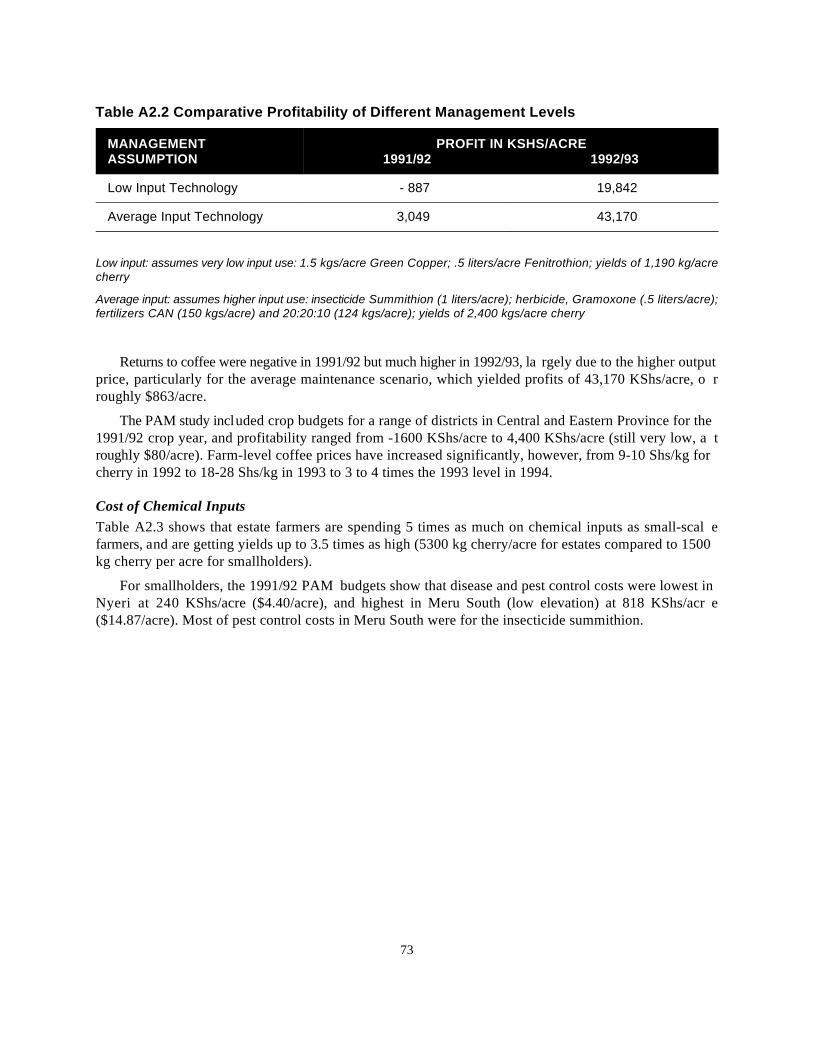
73
Table A2.2 Comparative Profitability of Different Management Levels
MANAGEMENT PROFIT IN KSHS/ACREASSUMPTION 1991/92 1992/93
Low Input Technology - 887 19,842
Average Input Technology 3,049 43,170
Low input: assumes very low input use: 1.5 kgs/acre Green Copper; .5 liters/acre Fenitrothion; yields of 1,190 kg/acrecherry
Average input: assumes higher input use: insecticide Summithion (1 liters/acre); herbicide, Gramoxone (.5 liters/acre);fertilizers CAN (150 kgs/acre) and 20:20:10 (124 kgs/acre); yields of 2,400 kgs/acre cherry
Returns to coffee were negative in 1991/92 but much higher in 1992/93, la rgely due to the higher outputprice, particularly for the average maintenance scenario, which yielded profits of 43,170 KShs/acre, o rroughly $863/acre.
The PAM study included crop budgets for a range of districts in Central and Eastern Province for the1991/92 crop year, and profitability ranged from -1600 KShs/acre to 4,400 KShs/acre (still very low, a troughly $80/acre). Farm-level coffee prices have increased significantly, however, from 9-10 Shs/kg forcherry in 1992 to 18-28 Shs/kg in 1993 to 3 to 4 times the 1993 level in 1994.
Cost of Chemical InputsTable A2.3 shows that estate farmers are spending 5 times as much on chemical inputs as small-scal efarmers, and are getting yields up to 3.5 times as high (5300 kg cherry/acre for estates compared to 1500kg cherry per acre for smallholders).
For smallholders, the 1991/92 PAM budgets show that disease and pest control costs were lowest inNyeri at 240 KShs/acre ($4.40/acre), and highest in Meru South (low elevation) at 818 KShs/acr e($14.87/acre). Most of pest control costs in Meru South were for the insecticide summithion.
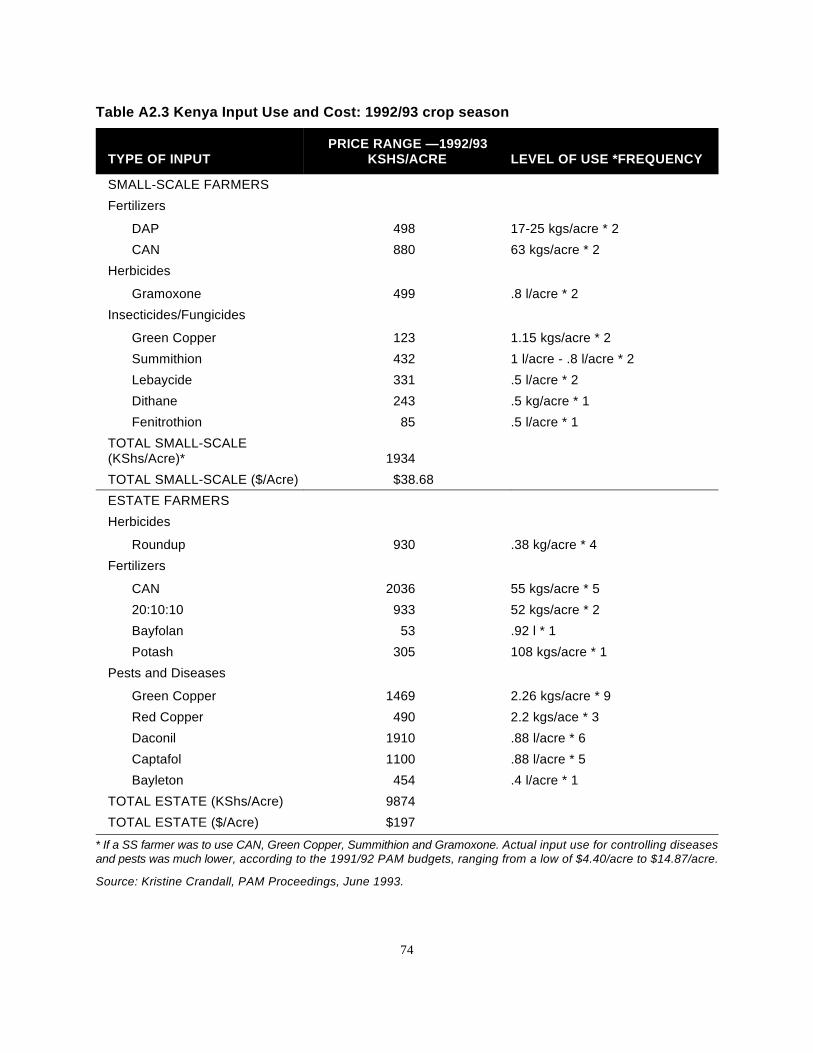
74
Table A2.3 Kenya Input Use and Cost: 1992/93 crop season
TYPE OF INPUT KSHS/ACRE LEVEL OF USE *FREQUENCYPRICE RANGE —1992/93
SMALL-SCALE FARMERS
Fertilizers
DAP 498 17-25 kgs/acre * 2
CAN 880 63 kgs/acre * 2
Herbicides
Gramoxone 499 .8 l/acre * 2
Insecticides/Fungicides
Green Copper 123 1.15 kgs/acre * 2
Summithion 432 1 l/acre - .8 l/acre * 2
Lebaycide 331 .5 l/acre * 2
Dithane 243 .5 kg/acre * 1
Fenitrothion 85 .5 l/acre * 1
TOTAL SMALL-SCALE(KShs/Acre)* 1934
TOTAL SMALL-SCALE ($/Acre) $38.68
ESTATE FARMERS
Herbicides
Roundup 930 .38 kg/acre * 4
Fertilizers
CAN 2036 55 kgs/acre * 5
20:10:10 933 52 kgs/acre * 2
Bayfolan 53 .92 l * 1
Potash 305 108 kgs/acre * 1
Pests and Diseases
Green Copper 1469 2.26 kgs/acre * 9
Red Copper 490 2.2 kgs/ace * 3
Daconil 1910 .88 l/acre * 6
Captafol 1100 .88 l/acre * 5
Bayleton 454 .4 l/acre * 1
TOTAL ESTATE (KShs/Acre) 9874
TOTAL ESTATE ($/Acre) $197
* If a SS farmer was to use CAN, Green Copper, Summithion and Gramoxone. Actual input use for controlling diseasesand pests was much lower, according to the 1991/92 PAM budgets, ranging from a low of $4.40/acre to $14.87/acre.
Source: Kristine Crandall, PAM Proceedings, June 1993.
75
Labor CostsSmallholder labor costs ranged from 1,730 Shs/acre to 8,502 Shs/acre across regions in Kenya, averagingaround 6,000 Shs/acre ($109/acre). Estate labor costs were twice as high, at over 11,000 Shs/acre i n1991/92.
For farmers using better management practices, the PAM budgets show that the proportion of tota lcosts taken up by labor costs falls from around 50 percent to 25 percent of total costs, while chemical inputscosts increase from 20 percent to up to 60 percent of total costs (for the low-input case).
Processing CostsOne of the findings of the PA M team's analysis of coffee was that many farmers receive lower prices dueto inefficient management of p ost-farm operations at the factory and cooperative society levels (Crandall,1993 and Nyoro, 1994). They concluded that the decline in cof fee payments to farmers due to falling worldprices was exacerbated by excess processing, handling, and marketing costs coupled with poor financialmanagement by cooperative societies. An examination of processing costs for 10 cooperative factorie sshowed costs ranging from around 9,000 to 17,0 00 Shs/mt clean coffee, compared to an estate factory costof 7,600 Shs/mt. Efficiency can be measured by the percentage of gross cherry price received by farmers,which ranged from 59 percent for inefficient factories to 78 percent for well-managed ones. Hig hcooperative costs are largely attributed to:
High labor costs (6,000 Shs/mt for some cooperatives versus 1,000 Shs/mt clean coffee for estat efactories) — many managers gauge their popularity by the number of persons employed.
Poor management since most cooperativ e managers have little or no management skills — committeemembers are often elected on the basis of political patronage.
Lack of incentives for managers to increase payments to farmers (many society managemen tcommittee members do not draw a salary but rather an allowance based on the number of meetin gheld) (Nyoro, 1994).
Nyoro's analysis found that if three improvem ents with respect to increasing processing and marketingefficiency were to be made — improvements in labor management by cooperatives, increased capacit yutilization through closing some factories, and removal of the monopoly of CBK in auctioning coffee —coffee payments to farmers as a prop ortion of FOB prices would increase from 57 percent in cooperativesto 77 percent for smallholders, and from 71 percent to 82 percent in the estate sector.
COST OF PRODUCTION OF COFFEE IN UGANDAIn Uganda, the coffee industry is based entirely on smallholder production, and Robusta coffee is a muchmore important crop than Arabica. Robusta accounts for 94 percent of output and Arabica 6 percent (WorldBank Ag. Sector Review, 1993). In the 1992/93 crop year (Oct. - Sept.) there were 204,900 hectares underRobusta production compared to 28,700 ha of Arabica (64,575 acres). Kenya's small-scale Arabica areaof 310,000 acres is roughly 5 times larger.
The soil, rainfall, and climate in Uganda are very f avorable for Robusta. Actual Robusta yields seldomexceed 600 kg/ha clean coffee, whil e Arabica yields have remained at around 450 kg/ha clean coffee overthe last few years (about 60 to 75 percent of reasonable yields under smallholder conditions). Some of thereasons for these low yields include aging Robusta trees, a lack of new Robusta planting material ,competition from other crops, poor field practices, declining Robusta quality, and fungus diseases i n
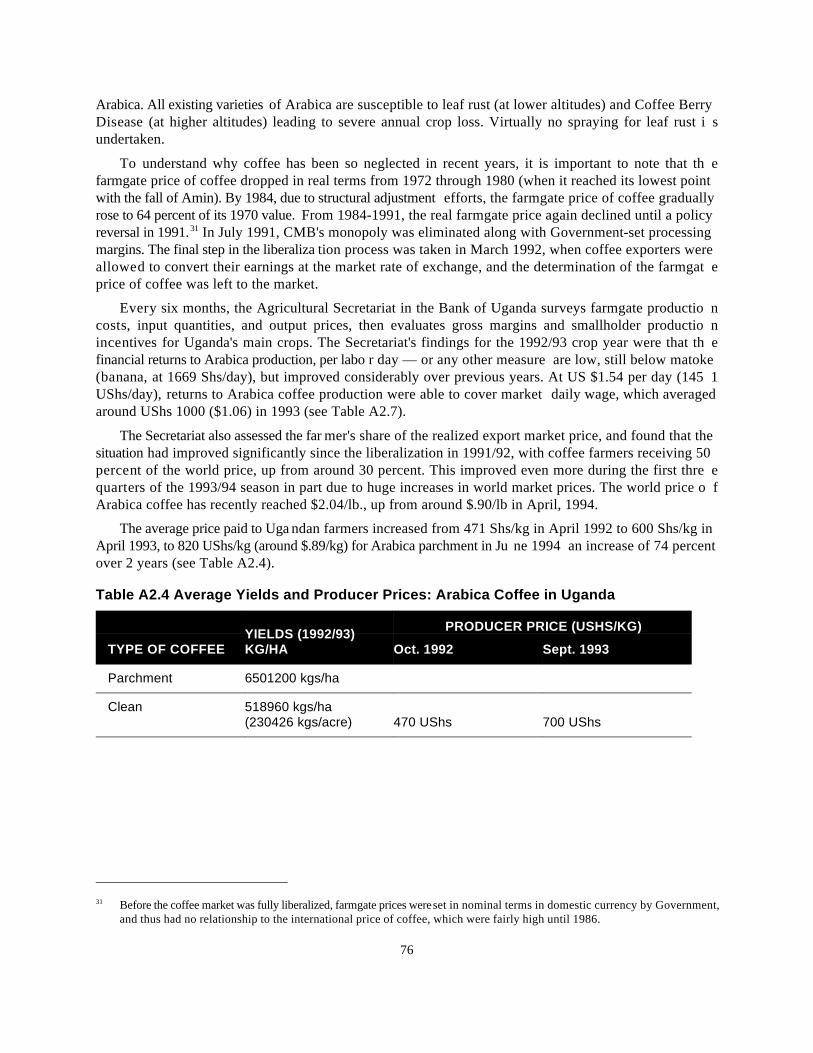
Before the coffee market was fully liberalized, farmgate prices were set in nominal terms in domestic currency by Government,31
and thus had no relationship to the international price of coffee, which were fairly high until 1986.
76
Arabica. All existing varieties of Arabica are susceptible to leaf rust (at lower altitudes) and Coffee BerryDisease (at higher altitudes) leading to severe annual crop loss. Virtually no spraying for leaf rust i sundertaken.
To understand why coffee has been so neglected in recent years, it is important to note that th efarmgate price of coffee dropped in real terms from 1972 through 1980 (when it reached its lowest pointwith the fall of Amin). By 1984, due to structural adjustment efforts, the farmgate price of coffee graduallyrose to 64 percent of its 1970 value. From 1984-1991, the real farmgate price again declined until a policyreversal in 1991. In July 1991, CMB's monopoly was eliminated along with Government-set processing31
margins. The final step in the liberaliza tion process was taken in March 1992, when coffee exporters wereallowed to convert their earnings at the market rate of exchange, and the determination of the farmgat eprice of coffee was left to the market.
Every six months, the Agricultural Secretariat in the Bank of Uganda surveys farmgate productio ncosts, input quantities, and output prices, then evaluates gross margins and smallholder productio nincentives for Uganda's main crops. The Secretariat's findings for the 1992/93 crop year were that th efinancial returns to Arabica production, per labo r day — or any other measure are low, still below matoke(banana, at 1669 Shs/day), but improved considerably over previous years. At US $1.54 per day (145 1UShs/day), returns to Arabica coffee production were able to cover market daily wage, which averagedaround UShs 1000 ($1.06) in 1993 (see Table A2.7).
The Secretariat also assessed the far mer's share of the realized export market price, and found that thesituation had improved significantly since the liberalization in 1991/92, with coffee farmers receiving 50percent of the world price, up from around 30 percent. This improved even more during the first thre equarters of the 1993/94 season in part due to huge increases in world market prices. The world price o fArabica coffee has recently reached $2.04/lb., up from around $.90/lb in April, 1994.
The average price paid to Uga ndan farmers increased from 471 Shs/kg in April 1992 to 600 Shs/kg inApril 1993, to 820 UShs/kg (around $.89/kg) for Arabica parchment in Ju ne 1994 an increase of 74 percentover 2 years (see Table A2.4).
Table A2.4 Average Yields and Producer Prices: Arabica Coffee in Uganda
TYPE OF COFFEE KG/HA Oct. 1992 Sept. 1993YIELDS (1992/93) PRODUCER PRICE (USHS/KG)
Parchment 6501200 kgs/ha
Clean 518960 kgs/ha(230426 kgs/acre) 470 UShs 700 UShs
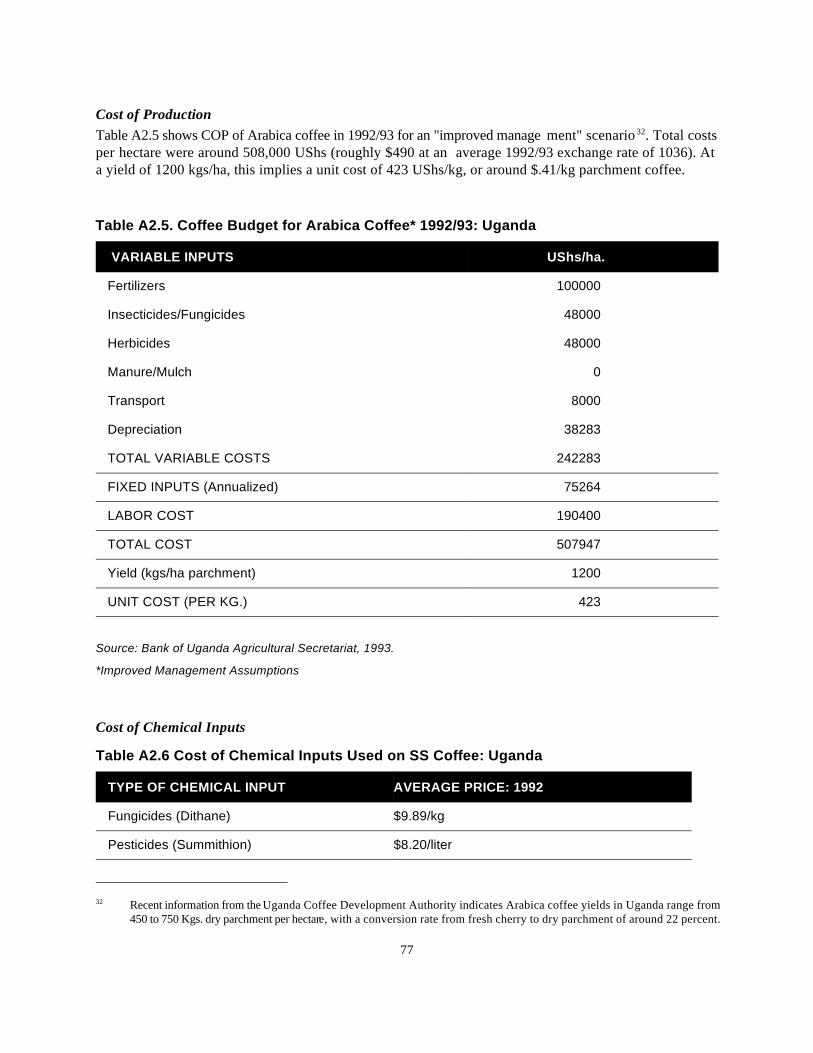
Recent information from the Uganda Coffee Development Authority indicates Arabica coffee yields in Uganda range from32
450 to 750 Kgs. dry parchment per hectare, with a conversion rate from fresh cherry to dry parchment of around 22 percent.
77
Cost of ProductionTable A2.5 shows COP of Arabica coffee in 1992/93 for an "improved manage ment" scenario . Total costs32
per hectare were around 508,000 UShs (roughly $490 at an average 1992/93 exchange rate of 1036). Ata yield of 1200 kgs/ha, this implies a unit cost of 423 UShs/kg, or around $.41/kg parchment coffee.
Table A2.5. Coffee Budget for Arabica Coffee* 1992/93: Uganda
VARIABLE INPUTS UShs/ha.
Fertilizers 100000
Insecticides/Fungicides 48000
Herbicides 48000
Manure/Mulch 0
Transport 8000
Depreciation 38283
TOTAL VARIABLE COSTS 242283
FIXED INPUTS (Annualized) 75264
LABOR COST 190400
TOTAL COST 507947
Yield (kgs/ha parchment) 1200
UNIT COST (PER KG.) 423
Source: Bank of Uganda Agricultural Secretariat, 1993.
*Improved Management Assumptions
Cost of Chemical Inputs
Table A2.6 Cost of Chemical Inputs Used on SS Coffee: Uganda
TYPE OF CHEMICAL INPUT AVERAGE PRICE: 1992
Fungicides (Dithane) $9.89/kg
Pesticides (Summithion) $8.20/liter
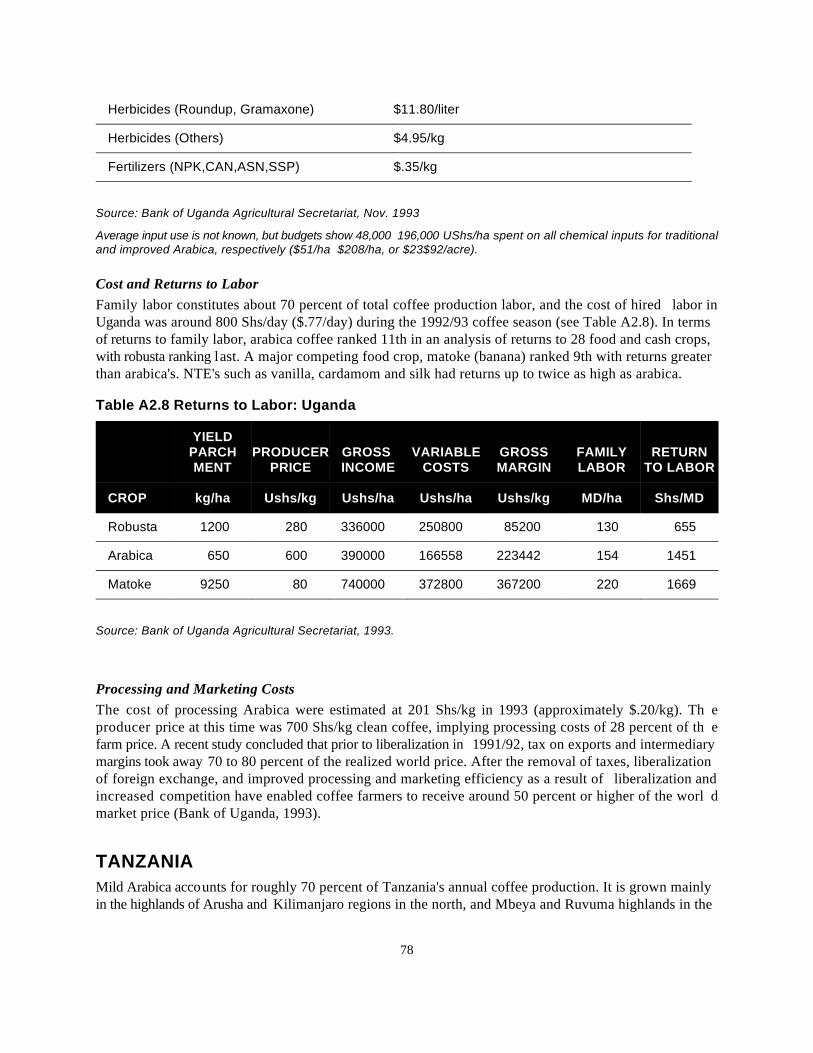
78
Herbicides (Roundup, Gramaxone) $11.80/liter
Herbicides (Others) $4.95/kg
Fertilizers (NPK,CAN,ASN,SSP) $.35/kg
Source: Bank of Uganda Agricultural Secretariat, Nov. 1993
Average input use is not known, but budgets show 48,000 196,000 UShs/ha spent on all chemical inputs for traditionaland improved Arabica, respectively ($51/ha $208/ha, or $23$92/acre).
Cost and Returns to LaborFamily labor constitutes about 70 percent of total coffee production labor, and the cost of hired labor inUganda was around 800 Shs/day ($.77/day) during the 1992/93 coffee season (see Table A2.8). In termsof returns to family labor, arabica coffee ranked 11th in an analysis of returns to 28 food and cash crops,with robusta ranking last. A major competing food crop, matoke (banana) ranked 9th with returns greaterthan arabica's. NTE's such as vanilla, cardamom and silk had returns up to twice as high as arabica.
Table A2.8 Returns to Labor: Uganda
YIELDPARCH PRODUCER GROSS VARIABLE GROSS FAMILY RETURNMENT PRICE INCOME COSTS MARGIN LABOR TO LABOR
CROP kg/ha Ushs/kg Ushs/ha Ushs/ha Ushs/kg MD/ha Shs/MD
Robusta 1200 280 336000 250800 85200 130 655
Arabica 650 600 390000 166558 223442 154 1451
Matoke 9250 80 740000 372800 367200 220 1669
Source: Bank of Uganda Agricultural Secretariat, 1993.
Processing and Marketing CostsThe cost of processing Arabica were estimated at 201 Shs/kg in 1993 (approximately $.20/kg). Th eproducer price at this time was 700 Shs/kg clean coffee, implying processing costs of 28 percent of th efarm price. A recent study concluded that prior to liberalization in 1991/92, tax on exports and intermediarymargins took away 70 to 80 percent of the realized world price. After the removal of taxes, liberalizationof foreign exchange, and improved processing and marketing efficiency as a result of liberalization andincreased competition have enabled coffee farmers to receive around 50 percent or higher of the worl dmarket price (Bank of Uganda, 1993).
TANZANIAMild Arabica accounts for roughly 70 percent of Tanzania's annual coffee production. It is grown mainlyin the highlands of Arusha and Kilimanjaro regions in the north, and Mbeya and Ruvuma highlands in the
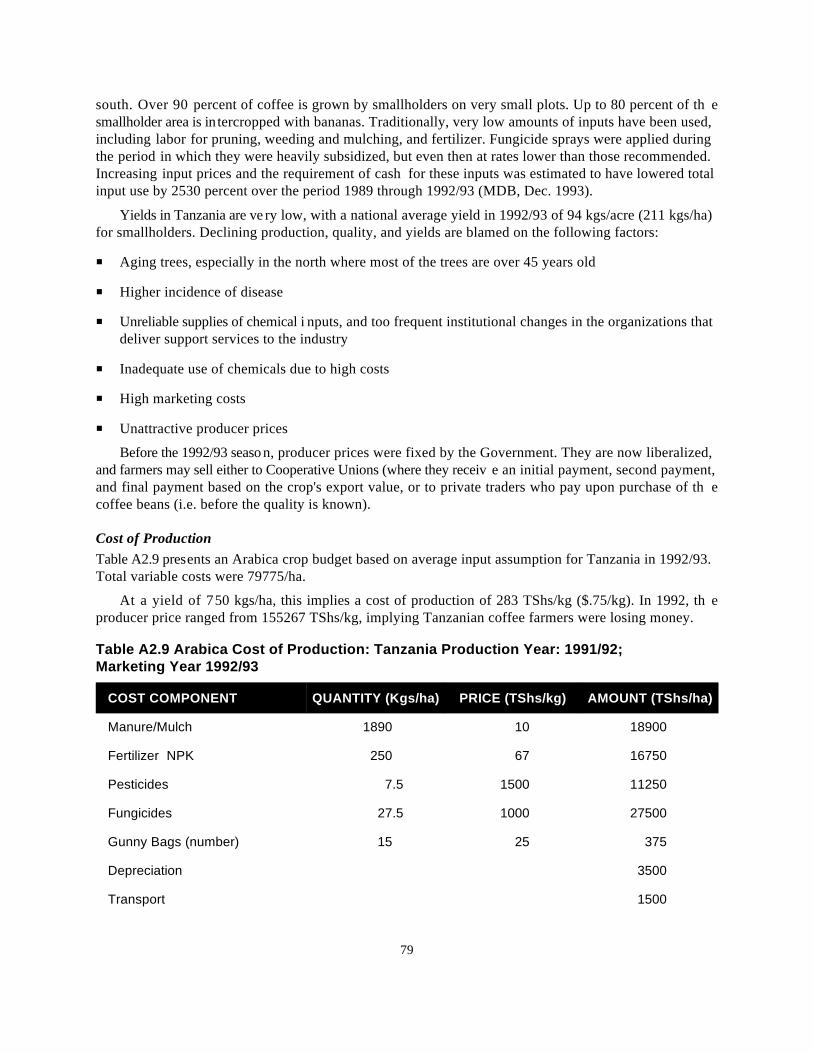
79
south. Over 90 percent of coffee is grown by smallholders on very small plots. Up to 80 percent of th esmallholder area is intercropped with bananas. Traditionally, very low amounts of inputs have been used,including labor for pruning, weeding and mulching, and fertilizer. Fungicide sprays were applied duringthe period in which they were heavily subsidized, but even then at rates lower than those recommended.Increasing input prices and the requirement of cash for these inputs was estimated to have lowered totalinput use by 2530 percent over the period 1989 through 1992/93 (MDB, Dec. 1993).
Yields in Tanzania are ve ry low, with a national average yield in 1992/93 of 94 kgs/acre (211 kgs/ha)for smallholders. Declining production, quality, and yields are blamed on the following factors:
Aging trees, especially in the north where most of the trees are over 45 years old
Higher incidence of disease
Unreliable supplies of chemical i nputs, and too frequent institutional changes in the organizations thatdeliver support services to the industry
Inadequate use of chemicals due to high costs
High marketing costs
Unattractive producer prices
Before the 1992/93 season, producer prices were fixed by the Government. They are now liberalized,and farmers may sell either to Cooperative Unions (where they receiv e an initial payment, second payment,and final payment based on the crop's export value, or to private traders who pay upon purchase of th ecoffee beans (i.e. before the quality is known).
Cost of ProductionTable A2.9 presents an Arabica crop budget based on average input assumption for Tanzania in 1992/93.Total variable costs were 79775/ha.
At a yield of 750 kgs/ha, this implies a cost of production of 283 TShs/kg ($.75/kg). In 1992, th eproducer price ranged from 155267 TShs/kg, implying Tanzanian coffee farmers were losing money.
Table A2.9 Arabica Cost of Production: Tanzania Production Year: 1991/92;Marketing Year 1992/93
COST COMPONENT QUANTITY (Kgs/ha) PRICE (TShs/kg) AMOUNT (TShs/ha)
Manure/Mulch 1890 10 18900
Fertilizer NPK 250 67 16750
Pesticides 7.5 1500 11250
Fungicides 27.5 1000 27500
Gunny Bags (number) 15 25 375
Depreciation 3500
Transport 1500
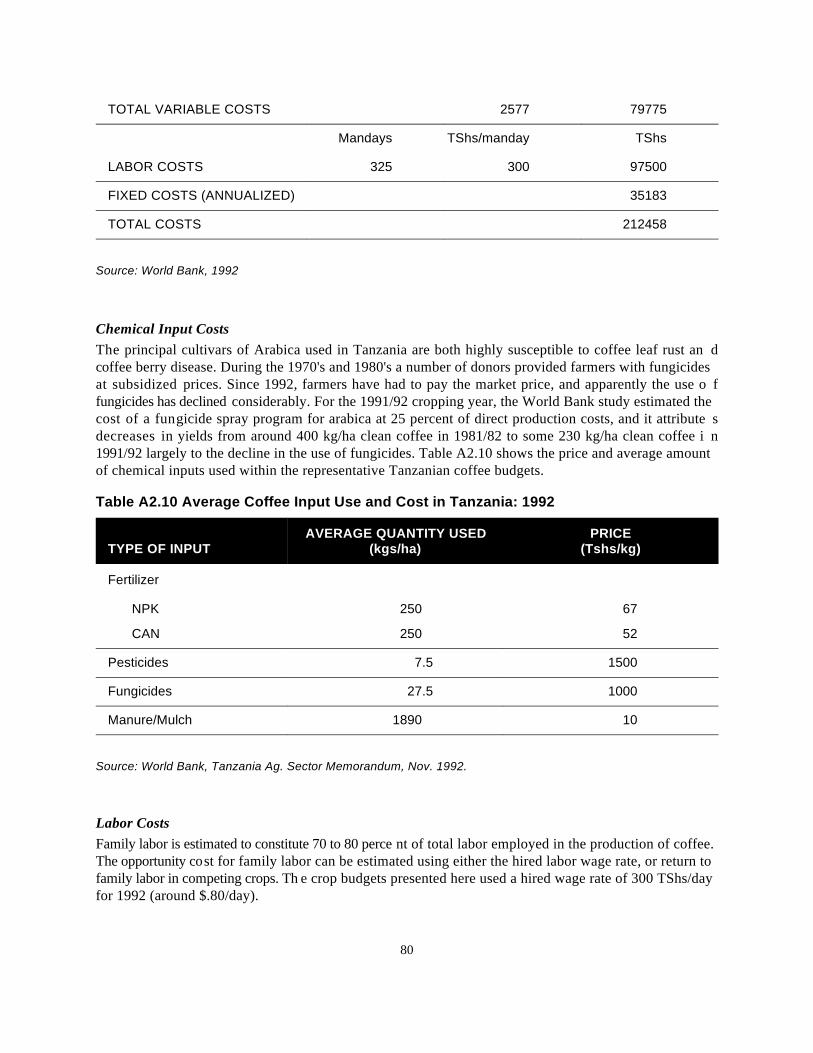
80
TOTAL VARIABLE COSTS 2577 79775
Mandays TShs/manday TShs
LABOR COSTS 325 300 97500
FIXED COSTS (ANNUALIZED) 35183
TOTAL COSTS 212458
Source: World Bank, 1992
Chemical Input CostsThe principal cultivars of Arabica used in Tanzania are both highly susceptible to coffee leaf rust an dcoffee berry disease. During the 1970's and 1980's a number of donors provided farmers with fungicidesat subsidized prices. Since 1992, farmers have had to pay the market price, and apparently the use o ffungicides has declined considerably. For the 1991/92 cropping year, the World Bank study estimated thecost of a fungicide spray program for arabica at 25 percent of direct production costs, and it attribute sdecreases in yields from around 400 kg/ha clean coffee in 1981/82 to some 230 kg/ha clean coffee i n1991/92 largely to the decline in the use of fungicides. Table A2.10 shows the price and average amountof chemical inputs used within the representative Tanzanian coffee budgets.
Table A2.10 Average Coffee Input Use and Cost in Tanzania: 1992
TYPE OF INPUT (kgs/ha) (Tshs/kg)AVERAGE QUANTITY USED PRICE
Fertilizer
NPK 250 67
CAN 250 52
Pesticides 7.5 1500
Fungicides 27.5 1000
Manure/Mulch 1890 10
Source: World Bank, Tanzania Ag. Sector Memorandum, Nov. 1992.
Labor CostsFamily labor is estimated to constitute 70 to 80 perce nt of total labor employed in the production of coffee.The opportunity cost for family labor can be estimated using either the hired labor wage rate, or return tofamily labor in competing crops. Th e crop budgets presented here used a hired wage rate of 300 TShs/dayfor 1992 (around $.80/day).
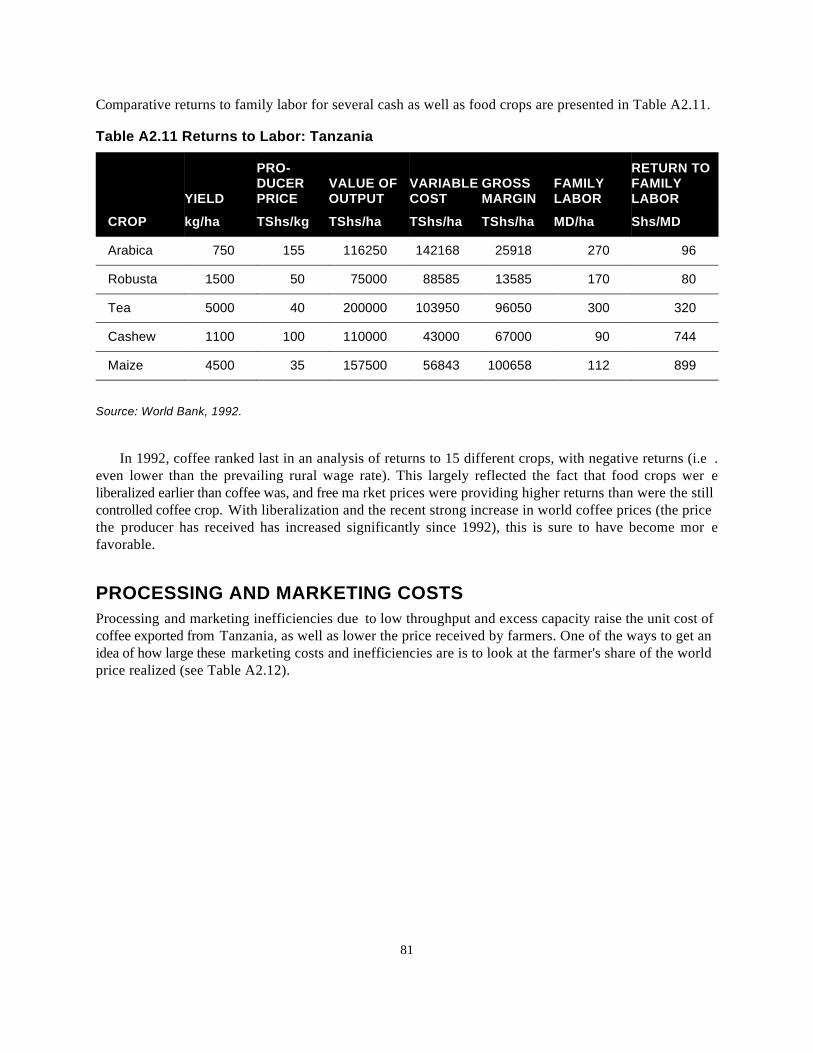
81
Comparative returns to family labor for several cash as well as food crops are presented in Table A2.11.
Table A2.11 Returns to Labor: Tanzania
CROP kg/ha TShs/kg TShs/ha TShs/ha TShs/ha MD/ha Shs/MD
YIELD PRICE OUTPUT COST MARGIN LABOR LABOR
PRO- RETURN TODUCER VALUE OF VARIABLE GROSS FAMILY FAMILY
Arabica 750 155 116250 142168 25918 270 96
Robusta 1500 50 75000 88585 13585 170 80
Tea 5000 40 200000 103950 96050 300 320
Cashew 1100 100 110000 43000 67000 90 744
Maize 4500 35 157500 56843 100658 112 899
Source: World Bank, 1992.
In 1992, coffee ranked last in an analysis of returns to 15 different crops, with negative returns (i.e .even lower than the prevailing rural wage rate). This largely reflected the fact that food crops wer eliberalized earlier than coffee was, and free ma rket prices were providing higher returns than were the stillcontrolled coffee crop. With liberalization and the recent strong increase in world coffee prices (the pricethe producer has received has increased significantly since 1992), this is sure to have become mor efavorable.
PROCESSING AND MARKETING COSTSProcessing and marketing inefficiencies due to low throughput and excess capacity raise the unit cost ofcoffee exported from Tanzania, as well as lower the price received by farmers. One of the ways to get anidea of how large these marketing costs and inefficiencies are is to look at the farmer's share of the worldprice realized (see Table A2.12).
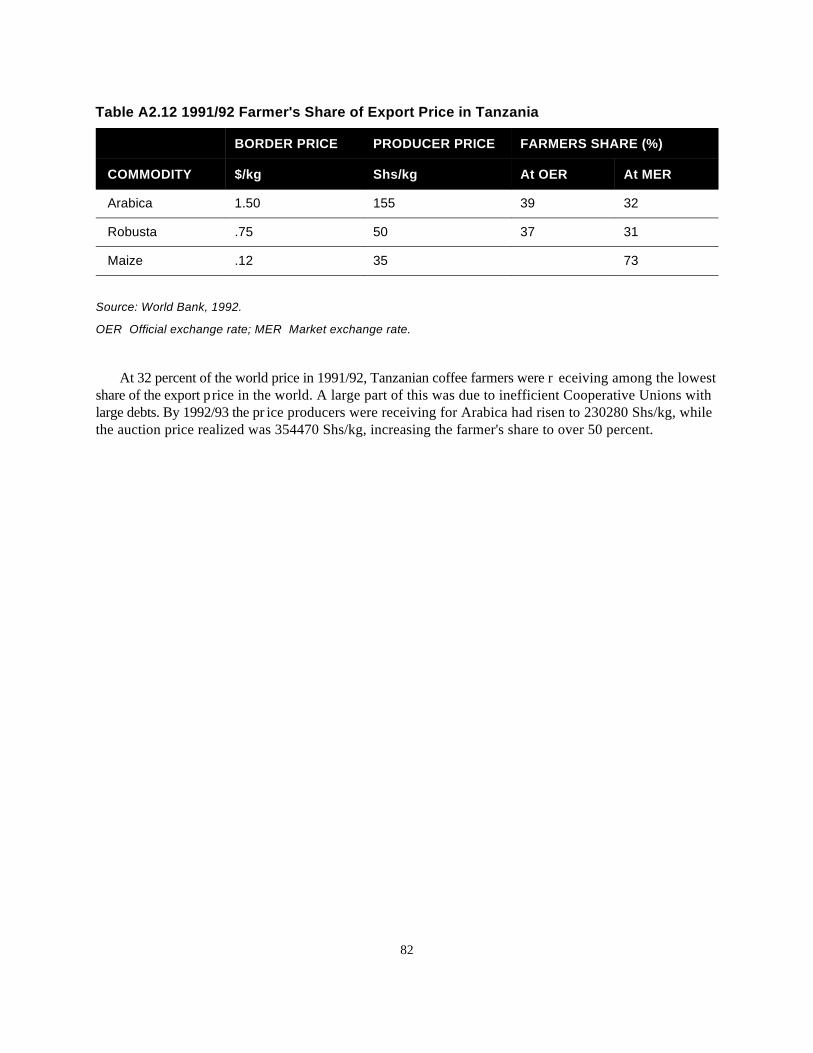
82
Table A2.12 1991/92 Farmer's Share of Export Price in Tanzania
COMMODITY $/kg Shs/kg At OER At MER
BORDER PRICE PRODUCER PRICE FARMERS SHARE (%)
Arabica 1.50 155 39 32
Robusta .75 50 37 31
Maize .12 35 73
Source: World Bank, 1992.
OER Official exchange rate; MER Market exchange rate.
At 32 percent of the world price in 1991/92, Tanzanian coffee farmers were r eceiving among the lowestshare of the export price in the world. A large part of this was due to inefficient Cooperative Unions withlarge debts. By 1992/93 the pr ice producers were receiving for Arabica had risen to 230280 Shs/kg, whilethe auction price realized was 354470 Shs/kg, increasing the farmer's share to over 50 percent.
83
Appendix 3Maize Cost of Production
MAIZE COST OF PRODUCTION IN KENYAMaize production in Kenya takes place under both large-scale and smallholder production systems. It isestimated that smallholder farms produce about 708 0 percent of Kenyan maize while the large-scale farmsaccount for the remaining 2030 percent (AkelloOguttu and Odhiambo, 1986; Odhiambo et al., 1994). Thelarge scale farms are found mostly in the Rift Valley Province in such districts as Trans Nzoia, Uasin Gishuand Nakuru and in some parts of Kisii/Nyamira, and in Kakamega districts in Nyanza and Wester nProvinces.
The large scale production system is fully commercially oriented and employs a lot of moder npurchased inputs like machinery, fertilizers, and other agrochemicals. Smallholder maize production, onthe other hand, takes place under varied technology and levels of husba ndry, ranging from basic subsistenceproduction in some areas to commercially oriented production employing similar purchased inputs foundon the large farms. Given su ch a diverse production system, a definition of a representative maize farm istherefore not easy to portray for Kenya.
For the purposes of this study a repr esentative crop budget was chosen for the large-scale farms foundin Trans Nzoia and Uasin Gishu districts. The small scale crop budgets are derived from a typica lsmallholder in one of the maize surplus districts such as Nandi, Bungoma, Kisii, Nyamira and Kericho.These detailed crop budgets for small and large-scale maize in Kenya are presented in Appendix TablesA3.1 to A3.6. The analysis is based on information for the 1993 crop year.
In summary, on per hectare basis, a typical smallholder maize producer in the maize surplus areas ofKenya carry out the following average husbandry practices:
Hires tractor and machinery services for land preparation (ploughin g and harrowing) costing $67.12/ha;
Uses about 84 mandays of labor, costing $60.14/ha;
Uses intermediate inputs including fertilizers, hybrid seed, gunnies and other material inputs, costing$330/ha.
The total variable costs for such a farmer is estimated at $390.19/ha, which almost represents his totalcosts since he has negligible attributable nonvariable or fixed costs of production ($1.69/ha.). Thus th esmallholder maize grower makes a profit of about $531/ha, or $0.11 per kg of maize produced.
Smallholders in Kenya producing maize under intercropping usually use beans, millet, sorghum ,potatoes or other minor crops with the maize crop. The most common practice is intercropping of maizewith beans. A typical cost of production budget for such a system is presented in the Table A3.3. Usuallysuch intercrops have maize as the main crop and the beans as the suppl ementary crop. The yield per hectarefor both crops is much lower than those obtained in pure stands. For example, in this study a yield of 2224kilograms per hectare for maize and 667 kilograms for beans is assumed. The revenue expected from ahectare of maize is around $411 while the revenue for beans is $249, giving a total revenue of about $660
84
per hectare. This production system is estimated to use about 73.5 mandays per hectare at a cost of about$44. The major material inputs are: planting seed for maize and beans and moderate levels of fertilizersand gunny bags, all estimated to cost about $167 per hectare. The nonvariable costs are negligible, a t$0.85/ha. Total costs therefore come to $211 per hectare, or $ 0.10 per kilogram. With this kind of cos tstructure, the maize/bean intercrop is expected to give a profit of about $448 per hectare or $0.15 pe rkilogram.
Maize beans intercropping systems are common on smallholder farms where mechanized planting andweeding are not practiced. It is also popular because it enables farmers to diversify and produce two o rmore crops on one plot and within the same operations. Where beans are involved, farmers also benefi tfrom nitrogen fixation which improves soil cover and fertility and increases maize yields.
Turning to the large-scale maize production sy stem in Kenya, on average most of the farmers use highinput levels and practice good crop husbandry. The system uses more machinery services and is thereforeless labor intensive, using only about 56 mandays per hectare at a cost of about $37. There is muc hemphasis on the use of purchased material inputs such as fertilizers for planting and top dressing, hybridseed, insecticides, herbicides and also h iring of machinery services for farm operations and transportation.The intermediate and other material input expenses amount to about $650, g iving a total variable cost figureof $687/ha, and a gross margin of $477/ha, implying a return to family labor of $8.52 per day. The fixedcost element, i.e. depreciation, insurance charges, and other overheads, is estimated at $85/ha, and i ssignificantly higher than the fixed costs faced by small farmers.
As expected, the large-scale farms also have higher total costs for maize production. The estimate dtotal cost is around $772 per hectare or $ 0.12 p er kilogram, thus leaving a profit of about $392 per hectareor $0.06 per kilogram.
COST OF MAIZE PRODUCTION IN TANZANIAMaize in Tanzania is produced mainly by smallholders. The major maize surplus areas include the we thighland regions of Arusha, Iringa, Mbeya, Rukwa and Ruvuma, which together account for about 5 0percent of annual production in the country. Other areas with significant maize production include partsof Bukoba, Moshi, Pare, Ngara, Kibondo, Morogoro, Rungwe and Songea.
The total annual maize production in Tanzania is now estimated to be about 2.2 million tons .Production has steadily increased, rising from 870,000 tons in 1970 to its current level of about 2.2 milliontons per year. The production increase is largely due to the expansion of area under the crop and to someextent due to improvement in average yields, which have risen from about 0.86 tons per hectare in 1970to about 1.6 tons per hectare at the moment.
In the crop budget and cost of production a nalysis presented for Tanzanian maize (see Table A3.4), anaverage yield of 5000 kilograms per hectare under high level input technology is represented by th esituation in the Arusha region. The medium input technology is represented by the Dodoma situation, whereaverage yields are estimated at around 4500 kilograms per hectare (Shetty et al, 1992; Mdadila, 1993).
The production system under high input technology (Arusha) is characterized by a mixture o fmechanization and labor intensive operations. Land p reparations (ploughing and harrowing) is mechanizedon some farms, while other operations like planting, weeding, fertilizer applications and chemica lapplications are based on either labor supplie d by the family or hired. It is estimated that maize productionunder such a situation requires about 107 mandays per hectare, at a cost of about $86 per hectare. Th eintermediate and other material inputs used include machinery (usually hired), fertilizers (Triple Supe r
85
Phosphate and Sulphate of Ammonia), insecticides, gunny bags, transportation facilities and workin gcapital all estimated to cost about $146 per hectare.
Total variable costs for a typical Arusha maize farmer are $232/ha. With an expected total revenu eestimated at $555/ha, the gross margin comes to $324 per hectare, or a return to labor of $3.03/manday.The nonvariable costs, represented mainly by depreciation of machinery and tools, are estimated at about$7.78/ha. Thus the total cost for such an area stands at about $239/ha or $0.05/kg. The profit of a maizeenterprise in this example is around $327 per hectare or $0.06 per kilogram.
Under the medium input technology (represented by the Dodoma area), yields are estimated at 4500kilograms per hectare. Farm operations are slightly more labor in tensive (about 127 mandays/ha) comparedto the high input technology. Under this si tuation, land preparation, planting, and weeding are mostly doneby hand using a hoe. Material inputs such as fertilizers, insectici des, gunny bags and transportation are usedin moderation. With nonvariable costs (mainly depreciation) estimated at about $3.89/ha, the total cost ofproduction comes to $205 per hectare, or $0.05/kg. It is worth noting that total production costs unde rmedium input technology are no different than total costs under the high input situation. This implies thatthe reduction in the use of intermediate and other material inputs, though appearing to save on cost, i snegatively compensated for by the lower yields resulting from low use of such inputs. Profits from th emedium input production system are also slightly below those realized under the high input situation i.e.$289.20 per hectare, or $0.06/kg instead of $326.66 per hectare and $0.07/kg.
COST OF MAIZE PRODUCTION IN UGANDAMaize is grown in most parts of Uganda and is estimated to cover about 10 per cent of the annual crop areain the country. The main deficit areas as far as maize production is concerned are mainly in: (a) th eNorthern Region (Arua, Nebbi, Kotido and Moroto); (b) the Central Region (Rakai and Masaka); © theWestern Region (Mbarara and parts of Kabarole).
Whereas in Kenya and Tanzania, maize is regarded as a major staple, in Uganda the crop is relativelyunimportant as a staple and is surpassed in this respect by bananas ( matoke) in the south and by finge rmillet and sorghum in the north. However, in terms of cereals production, maize ranks second to millet.The production is largely if not wholly smallholder ba sed and is characterized by low input technology andpoor husbandry practices. Yields are therefore relatively low compared to Kenya and Tanzania (see TableA3.1 A3.5). There is a widespread belief among most farmers that Uganda's soils are fertile enough anddo not require fertilizers. Another problem is lack of reliable and extensive input distribution systems foragricultural inputs in rural areas. The few that exist are found only in major trading centers which ar etypically located far away from the farmers needing the inputs.
The average national yield of maize in Uganda is about 1300 kilograms per hectare, however for thepurposes of this study an average yield of 2000 kilograms per hectare is used. This is also the figure usedby the Bank of Uganda Agricultural Secretariat in its 1993 report on the Economics of Crop Production.
From Table A3.5, it can be seen that under average crop husbandry practices, maize production costs$242 per hectare, or $0.12 per kilogram. The costs are broken down as follows:
Total labor input costs make up $141/ha;
Intermediate and other material inputs cost about $100 per hectare;
Total variable (a + b) inputs are around $241 per hectare;
86
Non variable or fixed costs are negligible and estimated at $0.97 per hectare. Production is very laborintensive, using about 183 mandays per hectare, with few modern purchased inputs.
Because of low input technology and the resultant low yields, returns and profitability from maiz eproduction in Uganda is low and negative in some cases. Gross margins are estimated at $ 48 per hectareand $0.26/day. Profits are estimated at $ 49 per hectare, implying returns to labor of $ 0.02 per day.
It is reckoned that under such negative returns, maize in Uganda is mostly grown by smallholde rsubsistence farmers who may not be placing high opportunity cost on their family labor and are not usingborrowed capital.
87
Appendix 4Beans Cost of Production
This section is devoted to the analysis of cost of production for beans at the country level. The results fromeach country beans crop budget and costs are us ed in Chapter 5 for intercountry comparative cost analysis.
Beans in Africa is basically a smallholder crop. They are by far the most important pulse crop in theregion grown for both home consumption and as a cash earning enterprise. For the purpose of this study,the term beans is used to refer to dry beans or field beans of the Phaseolus Vulgaris L species commonlygrown and used in East Africa.
COST OF PRODUCTION FOR BEANS IN KENYABeans are widely grown in Kenya mainly by smallholders who in most cases plant it intercropped wit hmaize, sorghum, potatoes and other crops. It is estimated that 63 percent of the total maize area i sintercropped with beans, especially in the regions of the country where land and labor constraints are aproblem. The major bean producing areas in Kenya are:
All the districts in Central Province (i.e. Kiambu, Nyeri, Muranga, Kirinyaga and Nyandarua);
Meru and Embu districts in Eastern Province;
Kakamega, Vihiga, Bungoma and Busia districts in Western Province;
Kisii, Nyamira, Migori and Kuria districts in Nyanza Province and
Parts of Taita, Taveta and Kwale districts in the Coast Province.
In Kenya it is possible to grow one or two crops of beans in a year depending on the region, altitudeand rainfall pattern. Most regions grow beans in the long rains (March June) while some regions in themedium to low altitude with bimodal rainfall pattern grow a second crop during the short rains (SeptemberDecember).
Bean production statistics indicat e that there has been a steady increase in the total output, largely dueto area expansion, while y ields have persistently remained low (see Table A4.5). Between 1970 and 1991the area under beans in Kenya grew from 152,000 hectares to about 501,000 hectares. During the sam eperiod production grew at an average annual rate of about 9.9 per cent per year from 65,000 tons t o215,000 tons. Yields per hectare, on the other hand, grew at an average annual rate of 3.5 percent, from 0.4tons/ha to about 0.85 tons/ha.
The cost of production analysis considered both the purestand and intercropped systems. In the caseof a purestand crop, the study took what would be regarded as an average medium to high input technologyin a typical bean growing area in the country. The intercropped production system chosen for the analysisrepresents a typical average low to medium input technology prevailing in the bean growing areas of Kenyasuch as Kisii, Kakamega, Kiambu, Nyeri and Muranga districts where beans are grown in conjunction with
88
maize and other crops. The case prese nted however, is an intercrop between maize and beans which is thewidespread intercrop practice in the country.
As with the other crops included in this study, the data used for beans crop budget and cost analysis aremainly synthesized from secondary sources and are based on or adjusted for 1993 cropping situations andprices.
As far as the beans pure stand crop budget and costs of production are concerned, a typical goo dhusbandry practice was taken to be capable of realizing a yield of about 2200 kilograms per hectare. Sucha production system would normally be expected to use rela tively higher level of modern purchased inputs,including:
Hired machinery services for land preparation;
Fertilizers;
Pesticides like insecticides and fungicides;
Improved seed; and
Transport services and working capital.
Indeed, the study found that such intermediate or material inputs constitute the bulk of the tota lproduction costs. It was estimated that such inputs, as a group, cost about $318 per hectare. The nex timportant cost element, as would be expected under such smallholder production system is labor inputs forsuch operations like planting, weeding, fertilizer application, and handling. It is estimated that about 106mandays would be required for these operations at a cost of about $72/ha.
The total variable cost for the beans purestand was estimated at $390/ha, or about $0.18/kg. Th enonvariable (fixed) costs were also estimated to be about $1.69/ha, giving a total cost of about $392/ha or$0.18/kg. With the total revenue being estimated at $1044/ha, the purestand bean production syste mgenerates a gross margin of about $654/ha or $6.17 per manday. The gross margins after adjustment fornonvariable costs result in estimated profit of about $652/ha or $0.30/kg. The detailed analysis is presentedin Tables A4.1 to A4.3.
Analysis of bean intercrop production costs in Kenya was meant to depict the situation prevailing onmost smallholder farms where beans are produced mainly for subsistence purposes, with any surpluses ina good year for sale. In this production system, it is assumed that the farmers use mostly family labor andlimited purchased inputs. The labor input is estima ted at about 73.3 mandays per hectare with an estimatedcost of about $44/ha for both maize and beans. The farmers use less amounts of fertilizers but n oinsecticides, fungicides and herbicides. All the int ermediate and material inputs are estimated to cost about$167/ha, again for both maize and beans operations.
The cost of production for two or more crops in an intercrop production s ystem are so extricably relatedthat it would be a futile exercise to try and disaggregate such costs between maize and beans. Operationssuch as land preparations, weeding and fertilize r application are jointly done for the two crops, while otheroperations are specific to each crop within an intercrop system. In the aggregate budget and cost analysis,the maize and beans are estimated to cost about $212/ha, which comes to about $0.07/kg. of either of thecrops. The profitability analysis indicates that such an intercrop would earn a combined profit of abou t$448/ha or $0.15/kg of either crop.
As can be seen from the preceding discussions and from Tables A4.1 to A4.3 and A3.3, the cost of beanproduction under the intercrop system is slightly lower than that of producing beans in purestand.
89
COST OF BEAN PRODUCTION IN UGANDABean production in Uganda i s currently estimated at about 400,000 tons per year. The area under the cropis estimated to be about 500,000 hectares, thus giving an average crop yield of 0.8 tons per hectare (seeTable A4.5). Beans are grown in virtually all parts of Uganda under smallholder conditions. Just as is thecase with maize, the only areas that can be regarded as bean deficit are the central and some parts o fwestern Uganda where bananas ( matoke) and millet tend to predominate.
Bean production in Uganda, like that of maize, is still low technology bordering very much o nsubsistence production. Consultations with research and agricultural experts in Uganda reveal that Ugandacould easily double its current yield levels if o nly farmers could improve on their crop husbandry practicesand also adopt existing high yielding bean varieties.
The cost of production analys is presented here assumes what by Uganda standards would be regardedas an average good farm level performance and data synthesized from secondary sources and counte rchecked through consultations with Ugandan experts and farmers. The budgets and costs were firs tcalculated in local currency and later conve rted into US dollars using the average exchange rate prevailingfor the year 1993 (see Tables A4.1 through A4.3).
Yields under the situation depicted above were assumed to be about 800 kg/ha, resulting in tota lrevenues of about $181/ha. Labor and land are the major inputs in the production system. However, sinceland is mostly inherited and passed down through each generation, it is not costed. This leaves the laborinput as the major cost element in the production system. It is estimated that the production system usesabout 180 mandays with an estimated cost of about $139/ha. On old land where land clearing is no tnecessary, less labor is required, reducing this assumption to 170 mandays at a cost of around $131/ha .Since the production system depicted here uses limited or no purchased inputs, the major material inputsare seeds, gunny bags and transport services which altogether cost about $75/ha. Thus the total variable costcomes to $214/ha, which leads to a negative gross margin of $33/ha or $0.19/day. The relatively high levelof labor use, low yields, and subsequent low or negative return s to labor imply that bean farmers in Ugandamay be merely producing at subsistence level with less emphasis on the opportunity cost of their familylabor used in producing the beans.
The nonvariable cost element is estimated at $17.86 (Bank of Uganda, 1993) which results in a totalcost estimate of $232/ha or $0.29/kg. The bean as a farm enterprise is estimated therefore to yield anegative profit of about $66/ha, or $0.06/kg. Sens itivity analysis using different cost and yield assumptionswas undertaken to determine the impact on total per ki logram costs. In particular, fixed costs were reducedsince the secondary data had what seemed to be unreasonably high fixed cost assumptions (U1 in TableA4.1). This resulted in a slightly lower per kilo cost ($0.26/kg instead of $0.29/kg), but did not affect theoverall ranking of countries in the comparative analysis.
COST OF BEAN PRODUCTION IN TANZANIABeans are widely grown and consumed in Tanzania. However, the major bean producing areas in th ecountry include Kagera, Iringa, Kigoma, Rukwa, Mbeya, Arusha and Kilimanjaro (Bina Mungu, 1993).Like in Kenya and Uganda, beans are mainly produced by smallholders for home consumption, althoughdue to cash demands most of the beans now find their way to the national market and cross border tradefor sale. Although reliable statistics are hard to come by, the current national production is estimated a tabout 508,000 tons. The area under the crop is estimated to be between 550,000 and 600,000 hectare sgiving an average national yield of about 800 to 900 kg/ha. Under good crop husbandry practices, farmers
90
in areas like Kagera, Arusha and Kilimanjaro are capable of obtaining yields of about 1 to 1.5 tons pe rhectare.
The analysis presented in this section has taken yields obt ainable under good husbandry in Kagera (lowinput assumptions and 1000 kg/ha) and in the Kilimanjaro/Arusha area (high input assumptions and 1250kg/ha). In the case of Kagera area , the yield of 1000 kg/ha is expected to generate a total revenue of about$120/ha. This production system is labor intensive, using about 87 mandays per hectare. The system i scharacterized by low input technology, using little or no purchased inputs except for seeds, gunny bags andtransportation services. The total material and ot her intermediate input costs are estimated at about $50/ha.There is little or low no nonvariable (fixed) costs, so total costs are around $90/ha or $0.09/kg. The profitfrom this type of production system is estimated at about $29/ha or $0.03/kg (see Tables A4.1 and A4.4).
Under the high input assumptions for the Arusha/Kilimajaro area, a yield level of 1250 kg/ha is takenas reasonable, giving a total revenue of about $164/ha. This production system is less labor intensive thanthe Kagera case, and is estimated to use only 39 mandays per hectare at a cost of about $21. The use ofintermediate and other material inputs is modest at $67/ha. Total variable costs are $89/ha. The nonvariablecosts, mainly represented by depreciation, are estimated at $4. Total costs are therefore around $93/ha, or$0.07/kg. Profits are estimated at $71/ha or $0.06/kg under such a production system.
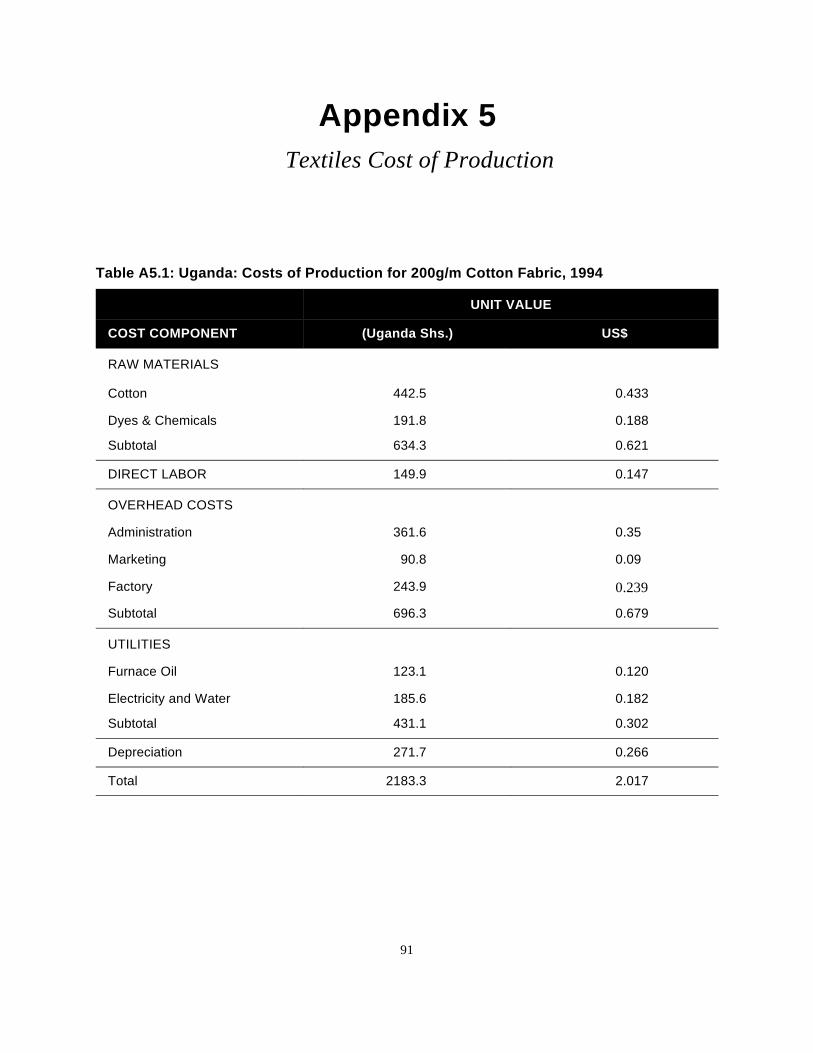
91
Appendix 5Textiles Cost of Production
Table A5.1: Uganda: Costs of Production for 200g/m Cotton Fabric, 1994
UNIT VALUE
COST COMPONENT (Uganda Shs.) US$
RAW MATERIALS
Cotton 442.5 0.433
Dyes & Chemicals 191.8 0.188
Subtotal 634.3 0.621
DIRECT LABOR 149.9 0.147
OVERHEAD COSTS
Administration 361.6 0.35
Marketing 90.8 0.09
Factory 243.9 0.239
Subtotal 696.3 0.679
UTILITIES
Furnace Oil 123.1 0.120
Electricity and Water 185.6 0.182
Subtotal 431.1 0.302
Depreciation 271.7 0.266
Total 2183.3 2.017
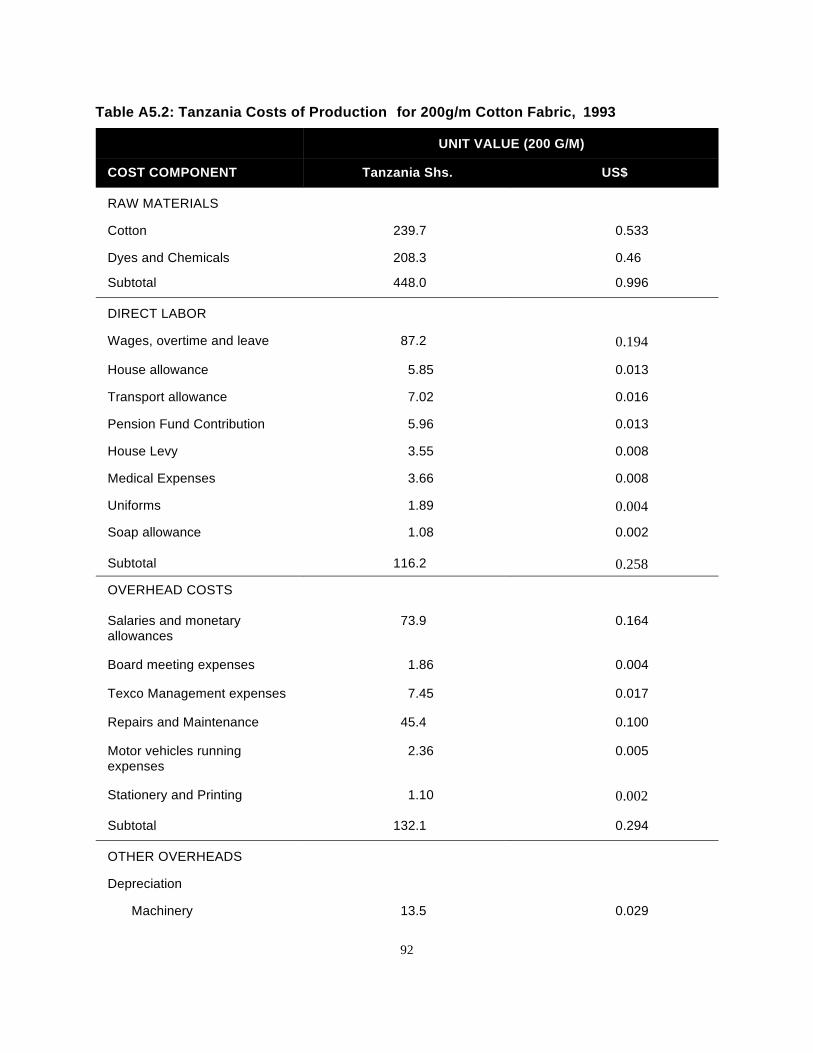
92
Table A5.2: Tanzania Costs of Production for 200g/m Cotton Fabric, 1993
COST COMPONENT Tanzania Shs. US$
UNIT VALUE (200 G/M)
RAW MATERIALS
Cotton 239.7 0.533
Dyes and Chemicals 208.3 0.46
Subtotal 448.0 0.996
DIRECT LABOR
Wages, overtime and leave 87.2 0.194
House allowance 5.85 0.013
Transport allowance 7.02 0.016
Pension Fund Contribution 5.96 0.013
House Levy 3.55 0.008
Medical Expenses 3.66 0.008
Uniforms 1.89 0.004
Soap allowance 1.08 0.002
Subtotal 116.2 0.258
OVERHEAD COSTS
Salaries and monetary 73.9 0.164allowances
Board meeting expenses 1.86 0.004
Texco Management expenses 7.45 0.017
Repairs and Maintenance 45.4 0.100
Motor vehicles running 2.36 0.005expenses
Stationery and Printing 1.10 0.002
Subtotal 132.1 0.294
OTHER OVERHEADS
Depreciation
Machinery 13.5 0.029
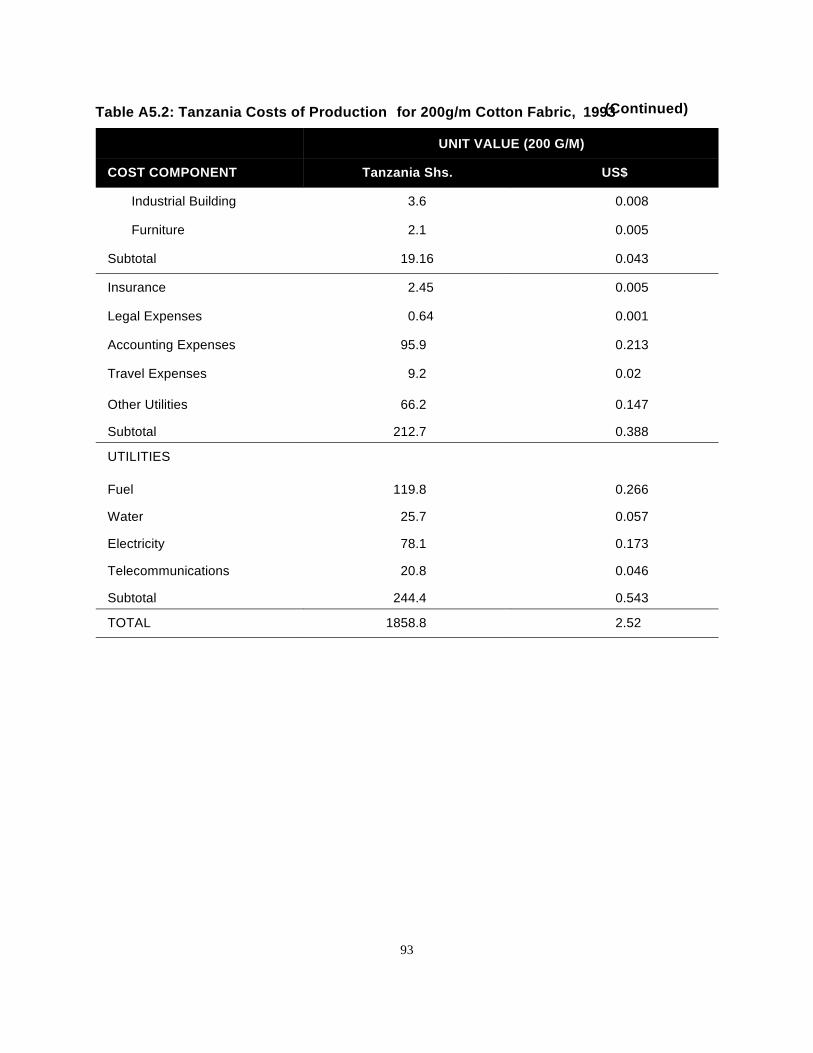
Table A5.2: Tanzania Costs of Production for 200g/m Cotton Fabric, 1993
COST COMPONENT Tanzania Shs. US$
UNIT VALUE (200 G/M)
93
(Continued)
Industrial Building 3.6 0.008
Furniture 2.1 0.005
Subtotal 19.16 0.043
Insurance 2.45 0.005
Legal Expenses 0.64 0.001
Accounting Expenses 95.9 0.213
Travel Expenses 9.2 0.02
Other Utilities 66.2 0.147
Subtotal 212.7 0.388
UTILITIES
Fuel 119.8 0.266
Water 25.7 0.057
Electricity 78.1 0.173
Telecommunications 20.8 0.046
Subtotal 244.4 0.543
TOTAL 1858.8 2.52
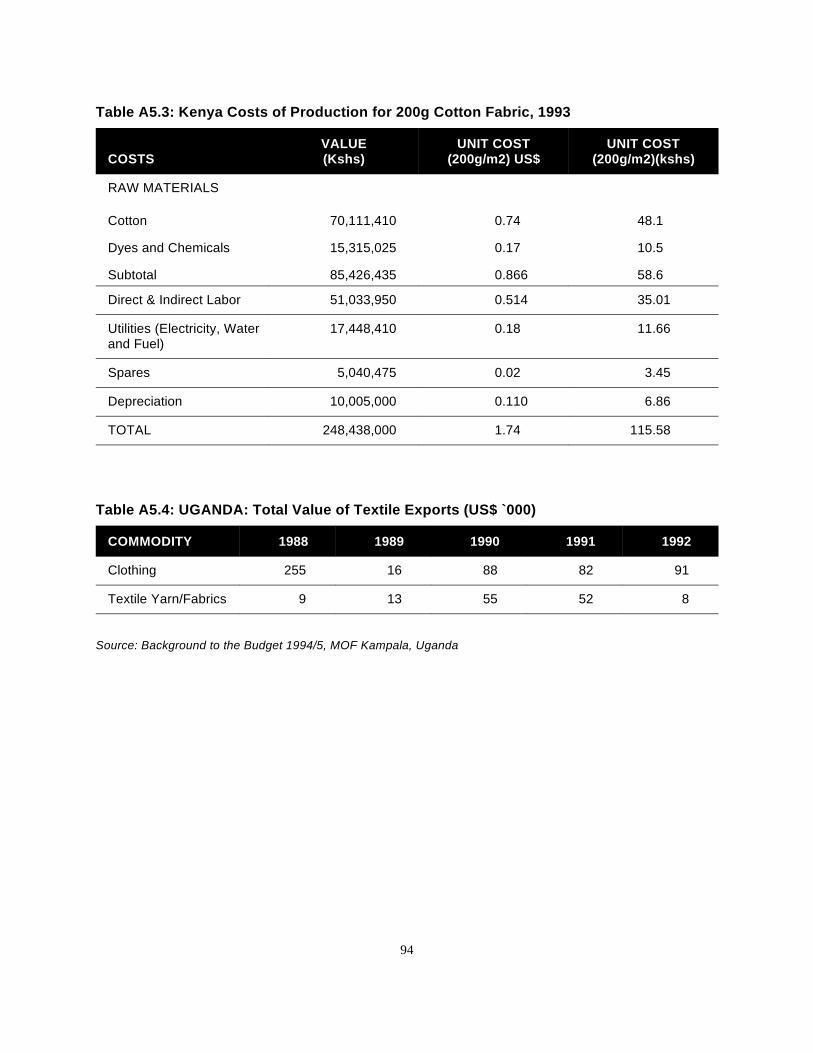
94
Table A5.3: Kenya Costs of Production for 200g Cotton Fabric, 1993
COSTS (Kshs) (200g/m2) US$ (200g/m2)(kshs)VALUE UNIT COST UNIT COST
RAW MATERIALS
Cotton 70,111,410 0.74 48.1
Dyes and Chemicals 15,315,025 0.17 10.5
Subtotal 85,426,435 0.866 58.6
Direct & Indirect Labor 51,033,950 0.514 35.01
Utilities (Electricity, Water 17,448,410 0.18 11.66and Fuel)
Spares 5,040,475 0.02 3.45
Depreciation 10,005,000 0.110 6.86
TOTAL 248,438,000 1.74 115.58
Table A5.4: UGANDA: Total Value of Textile Exports (US$ `000)
COMMODITY 1988 1989 1990 1991 1992
Clothing 255 16 88 82 91
Textile Yarn/Fabrics 9 13 55 52 8
Source: Background to the Budget 1994/5, MOF Kampala, Uganda
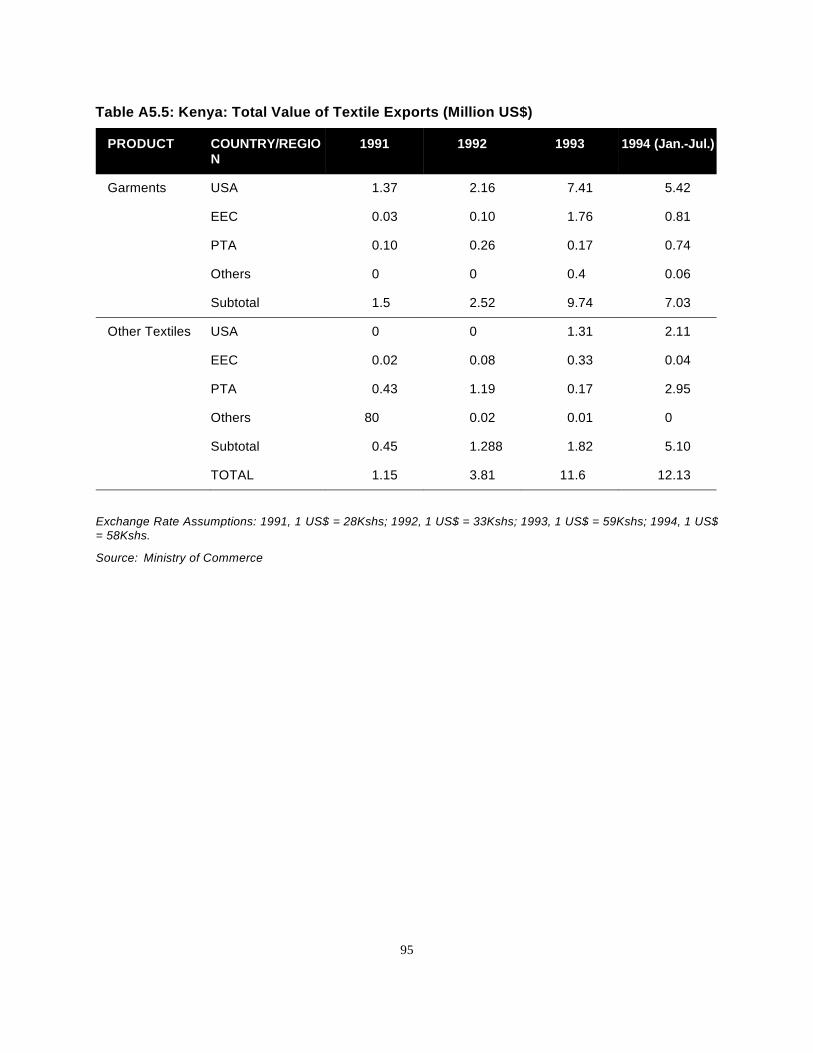
95
Table A5.5: Kenya: Total Value of Textile Exports (Million US$)
PRODUCT COUNTRY/REGIO 1991 1992 1993 1994 (Jan.-Jul.)N
Garments USA 1.37 2.16 7.41 5.42
EEC 0.03 0.10 1.76 0.81
PTA 0.10 0.26 0.17 0.74
Others 0 0 0.4 0.06
Subtotal 1.5 2.52 9.74 7.03
Other Textiles USA 0 0 1.31 2.11
EEC 0.02 0.08 0.33 0.04
PTA 0.43 1.19 0.17 2.95
Others 80 0.02 0.01 0
Subtotal 0.45 1.288 1.82 5.10
TOTAL 1.15 3.81 11.6 12.13
Exchange Rate Assumptions: 1991, 1 US$ = 28Kshs; 1992, 1 US$ = 33Kshs; 1993, 1 US$ = 59Kshs; 1994, 1 US$= 58Kshs.
Source: Ministry of Commerce

96
97
Appendix 6Domestic Resource Cost
Appendix 6 gives the summary tables of the DRC ca lculations for maize and beans by country and by bothregional (East African Nairobi, Kampala and Dares Salaam) and World Markets. Table 6.0 shows th erange of producer prices prevailing in each country, and the expor t prices each country faces in the regional(East African) and the World market for the period covered.
The capital cities of each of the three countries were taken as the regional markets for ease of analysisand for demonstrative purposes. However, the analysis could be extended to cover other towns and urbancenters in each of the countries. In Kenya for example, both domestic maize and beans from productionsurplus areas would go into the Nairobi m arket and fetch a price of $0.18 (for maize) or $0.47 (for beans).Maize and beans from Uganda or Tanzania going into Nairobi would face the same prices for the tw ocommodities.
In Uganda, the export price for maize and beans is based on the World Food Programme base pricewhich is 510 percent above the local Kampala price provided such prices are below the CIF world priceslanded at Kampala. By extension therefore, any maize and beans from Kenya and Tanzania going int oKampala face those export prices.
In Tanzania, there are two "in country" export prices facing maize and beans supplies from surplu sregions. The Dares Salaam prices and the border prices in the Southern regions where such produce i sexported to Zambia, Malawi, Rwanda and Burundi. For example, in such southern borders, maize pricewas given as US $0.20 while the bean pr ice was US $0.50. These prices are given in brackets in Table 6.0under World Export Prices. For the purp oses of this report, these southern border prices are assumed to beonly for Tanzania domestic produ ce and thus Kenyan and Ugandan exports are assumed to face the DaresSalaam prices and hence our analysis and DRC calculations are limited to these prices.
Finally, in the world market all the three cou ntries are assumed to face the same world price estimatedat US $0.12 for maize and US $0.41 for beans. (See Table A6.0)
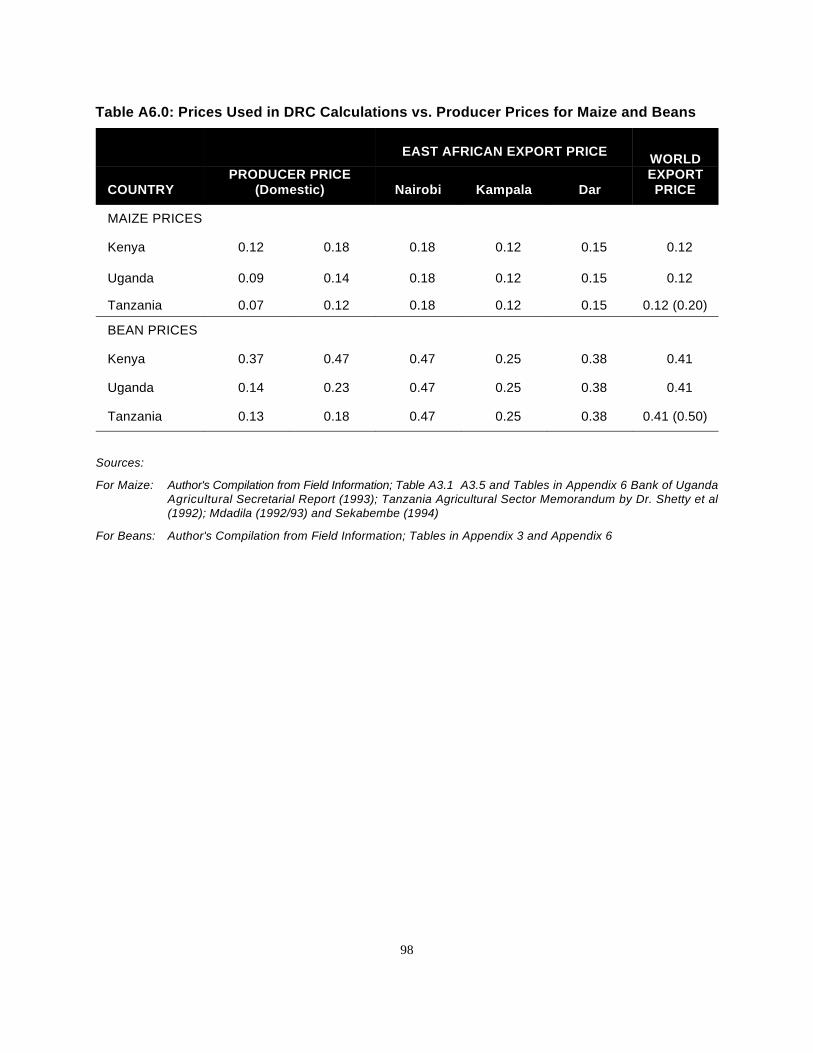
98
Table A6.0: Prices Used in DRC Calculations vs. Producer Prices for Maize and Beans
COUNTRY (Domestic) PRICENairobi Kampala DarPRODUCER PRICE EXPORT
EAST AFRICAN EXPORT PRICE WORLD
MAIZE PRICES
Kenya 0.12 0.18 0.18 0.12 0.15 0.12
Uganda 0.09 0.14 0.18 0.12 0.15 0.12
Tanzania 0.07 0.12 0.18 0.12 0.15 0.12 (0.20)
BEAN PRICES
Kenya 0.37 0.47 0.47 0.25 0.38 0.41
Uganda 0.14 0.23 0.47 0.25 0.38 0.41
Tanzania 0.13 0.18 0.47 0.25 0.38 0.41 (0.50)
Sources:
For Maize: Author's Compilation from Field Information; Table A3.1 A3.5 and Tables in Appendix 6 Bank of UgandaAgricultural Secretarial Report (1993); Tanzania Agricultural Sector Memorandum by Dr. Shetty et al(1992); Mdadila (1992/93) and Sekabembe (1994)
For Beans: Author's Compilation from Field Information; Tables in Appendix 3 and Appendix 6

99
Table A6.1a: Analysis of Comparative Advantage and Competitiveness of KenyanSmallholder Maize in Regional (E. Africa) and World Market (Ksh/Kg)
REGIONAL EAST AFRICAN MARKET
NAIROBI KAMPALA DAR ES SALAAM
Financi Foreign Local Financi Foreign Local Financi Foreign Localal al al
OUTPUT
Export Price 0.18 0.18 0.12 0.12 0.15 0.15US$/Kg
Exchange Rate 59 59 59 59 59 59Ksh/US$
Value of Output 10.62 10.62 7.08 7.08 8.85 8.85Ksh/Kg
ON-FARMCOSTS
Labor 0.70 0 0.70 0.70 0 0.70 0.70 0 0.70
Material Int/ 3.90 0.45 3.45 3.90 0.45 3.45 3.90 0.45 3.45Inputs
Fixed Costs 0.02 0 0.02 0.02 0 0.02 0.02 0 0.02
OFF-FARMCOSTS
Processing Costs 0 0 0 0 0 0 0 0
Marketing Costs 1.11 0.74 0.37 1.65 0.99 0.66 2.86 1.72 1.14
TOTAL COSTS 5.73 1.19 4.54 6.27 1.44 4.83 7.46 2.17 5.31
Net Output Value 4.89 0.81 1.39
DRC Ratio 0.48 0.53 0.62
DRC 28.32 31.27 36.58
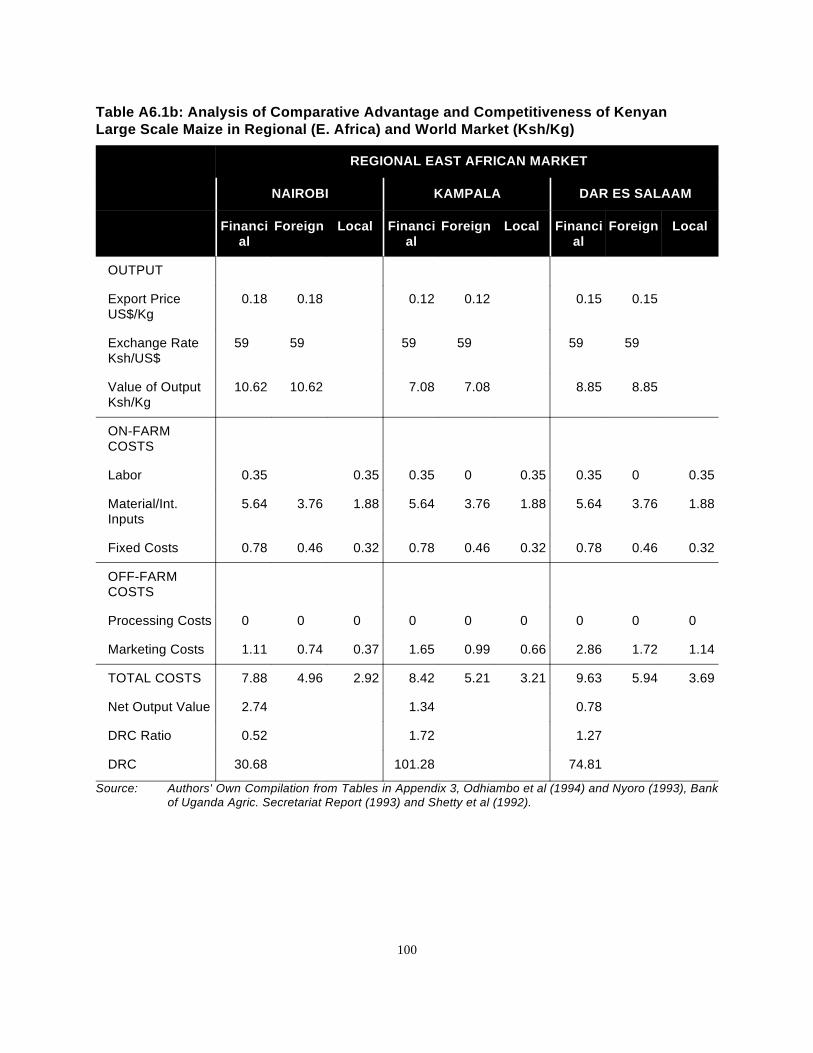
100
Table A6.1b: Analysis of Comparative Advantage and Competitiveness of KenyanLarge Scale Maize in Regional (E. Africa) and World Market (Ksh/Kg)
REGIONAL EAST AFRICAN MARKET
NAIROBI KAMPALA DAR ES SALAAM
Financi Foreign Local Financi Foreign Local Financi Foreign Localal al al
OUTPUT
Export Price 0.18 0.18 0.12 0.12 0.15 0.15US$/Kg
Exchange Rate 59 59 59 59 59 59Ksh/US$
Value of Output 10.62 10.62 7.08 7.08 8.85 8.85Ksh/Kg
ON-FARMCOSTS
Labor 0.35 0.35 0.35 0 0.35 0.35 0 0.35
Material/Int. 5.64 3.76 1.88 5.64 3.76 1.88 5.64 3.76 1.88Inputs
Fixed Costs 0.78 0.46 0.32 0.78 0.46 0.32 0.78 0.46 0.32
OFF-FARMCOSTS
Processing Costs 0 0 0 0 0 0 0 0 0
Marketing Costs 1.11 0.74 0.37 1.65 0.99 0.66 2.86 1.72 1.14
TOTAL COSTS 7.88 4.96 2.92 8.42 5.21 3.21 9.63 5.94 3.69
Net Output Value 2.74 1.34 0.78
DRC Ratio 0.52 1.72 1.27
DRC 30.68 101.28 74.81
Source: Authors' Own Compilation from Tables in Appendix 3, Odhiambo et al (1994) and Nyoro (1993), Bankof Uganda Agric. Secretariat Report (1993) and Shetty et al (1992).
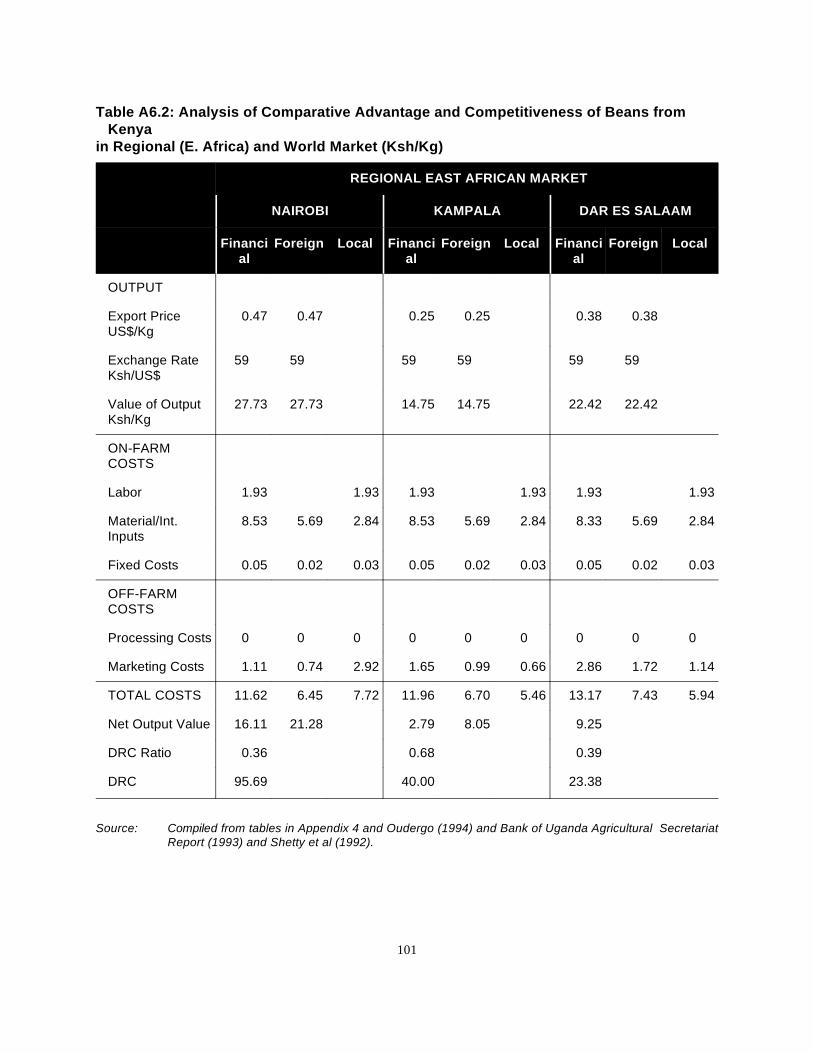
101
Table A6.2: Analysis of Comparative Advantage and Competitiveness of Beans fromKenya
in Regional (E. Africa) and World Market (Ksh/Kg)
REGIONAL EAST AFRICAN MARKET
NAIROBI KAMPALA DAR ES SALAAM
Financi Foreign Local Financi Foreign Local Financi Foreign Localal al al
OUTPUT
Export Price 0.47 0.47 0.25 0.25 0.38 0.38US$/Kg
Exchange Rate 59 59 59 59 59 59Ksh/US$
Value of Output 27.73 27.73 14.75 14.75 22.42 22.42Ksh/Kg
ON-FARMCOSTS
Labor 1.93 1.93 1.93 1.93 1.93 1.93
Material/Int. 8.53 5.69 2.84 8.53 5.69 2.84 8.33 5.69 2.84Inputs
Fixed Costs 0.05 0.02 0.03 0.05 0.02 0.03 0.05 0.02 0.03
OFF-FARMCOSTS
Processing Costs 0 0 0 0 0 0 0 0 0
Marketing Costs 1.11 0.74 2.92 1.65 0.99 0.66 2.86 1.72 1.14
TOTAL COSTS 11.62 6.45 7.72 11.96 6.70 5.46 13.17 7.43 5.94
Net Output Value 16.11 21.28 2.79 8.05 9.25
DRC Ratio 0.36 0.68 0.39
DRC 95.69 40.00 23.38
Source: Compiled from tables in Appendix 4 and Oudergo (1994) and Bank of Uganda Agricultural SecretariatReport (1993) and Shetty et al (1992).

102
Table A6.3: Financial Analysis of Comparative Advantage and Competitiveness ofUgandan
Maize in Regional (E. Africa) and World Market (Ksh/Kg)
REGIONAL EAST AFRICAN MARKET
NAIROBI KAMPALA DAR ES SALAAM
Financi Foreign Local Financi Foreign Local Financi Foreign Localal al al
OUTPUT
Export Price 0.18 0.18 0.12 0.12 0.15 0.15US$/Kg
Exchange Rate 1036 1036 1036 1036 1036 1036Ksh/US$
Value of Output 186.48 186.48 124.32 124.32 155.40 155.40Ksh/Kg
ON-FARMCOSTS
Labor 73.20 73.20 73.20 73.20 73.20
Material/Int. 78.15 29.55 48.60 78.15 29.55 48.60 78.15 29.55Inputs
Fixed Costs 0.50 0.24 0.26 0.50 0.24 0.26 0.50 0.24 26
OFF-FARMCOSTS
Processing Costs
Marketing Costs 16.34 9.08 15.00 9.78 5.22 77.00 50.00
TOTAL COSTS 168.19 38.87 166.85 39.57 127.80 288.85 79.79 9
Net Output Value 18.29 147.61 42.53 84.75 133.45 75.61
DRC Ratio 0.88 1.51 1.97
DRC 907.63 156.25 2042.40
Source: Authors' Own Compilation from Tables in Appendix 3, Odhiambo et al (1994), Bank of Uganda (1993)and Sekabembe (1994).
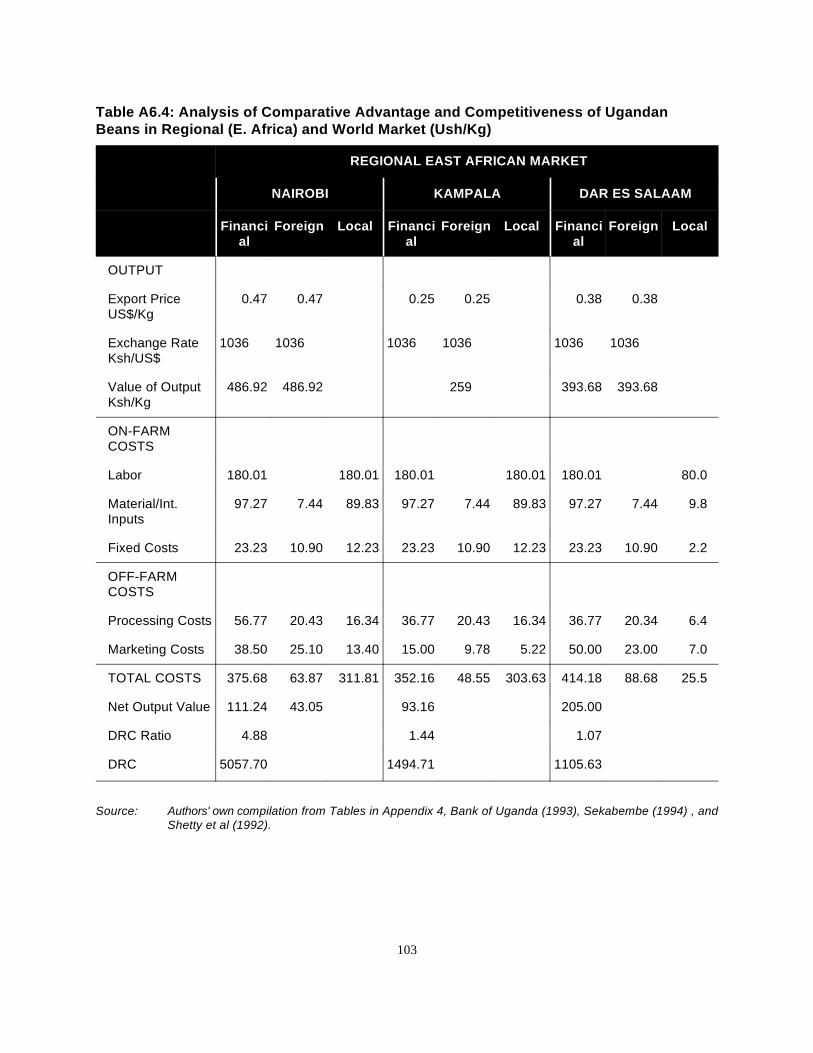
103
Table A6.4: Analysis of Comparative Advantage and Competitiveness of UgandanBeans in Regional (E. Africa) and World Market (Ush/Kg)
REGIONAL EAST AFRICAN MARKET
NAIROBI KAMPALA DAR ES SALAAM
Financi Foreign Local Financi Foreign Local Financi Foreign Localal al al
OUTPUT
Export Price 0.47 0.47 0.25 0.25 0.38 0.38US$/Kg
Exchange Rate 1036 1036 1036 1036 1036 1036Ksh/US$
Value of Output 486.92 486.92 259 393.68 393.68Ksh/Kg
ON-FARMCOSTS
Labor 180.01 180.01 180.01 180.01 180.01 80.0
Material/Int. 97.27 7.44 89.83 97.27 7.44 89.83 97.27 7.44 9.8Inputs
Fixed Costs 23.23 10.90 12.23 23.23 10.90 12.23 23.23 10.90 2.2
OFF-FARMCOSTS
Processing Costs 56.77 20.43 16.34 36.77 20.43 16.34 36.77 20.34 6.4
Marketing Costs 38.50 25.10 13.40 15.00 9.78 5.22 50.00 23.00 7.0
TOTAL COSTS 375.68 63.87 311.81 352.16 48.55 303.63 414.18 88.68 25.5
Net Output Value 111.24 43.05 93.16 205.00
DRC Ratio 4.88 1.44 1.07
DRC 5057.70 1494.71 1105.63
Source: Authors' own compilation from Tables in Appendix 4, Bank of Uganda (1993), Sekabembe (1994) , andShetty et al (1992).
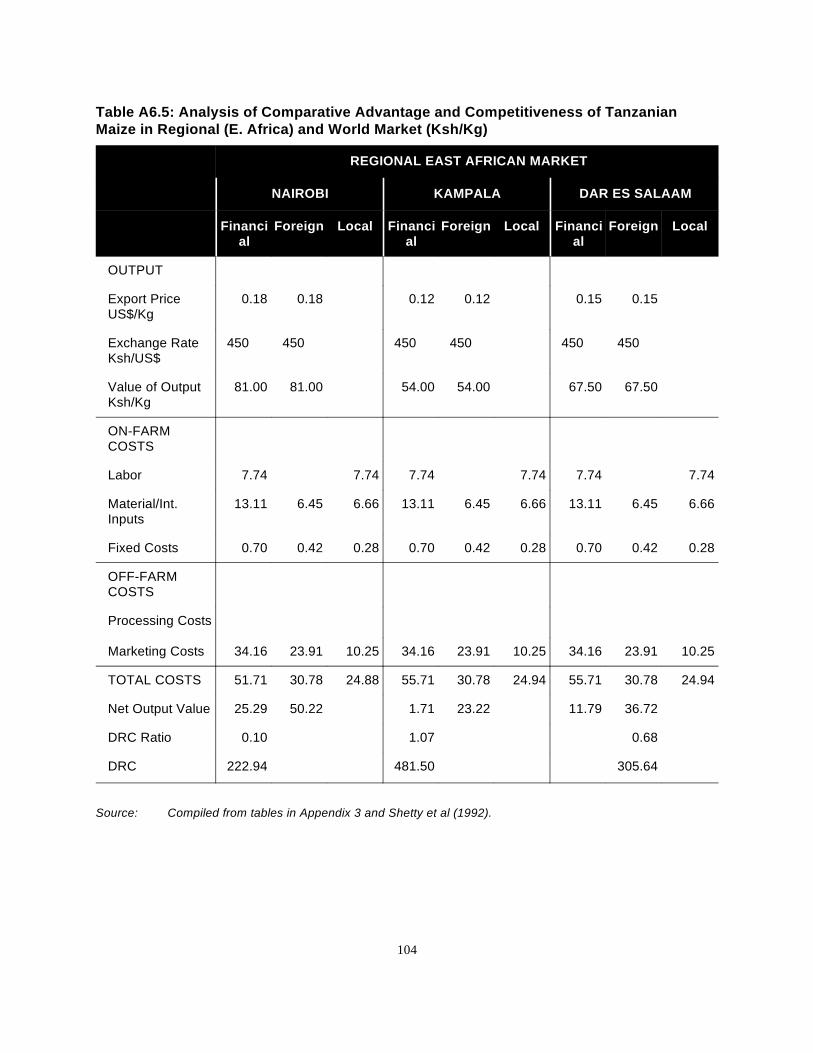
104
Table A6.5: Analysis of Comparative Advantage and Competitiveness of TanzanianMaize in Regional (E. Africa) and World Market (Ksh/Kg)
REGIONAL EAST AFRICAN MARKET
NAIROBI KAMPALA DAR ES SALAAM
Financi Foreign Local Financi Foreign Local Financi Foreign Localal al al
OUTPUT
Export Price 0.18 0.18 0.12 0.12 0.15 0.15US$/Kg
Exchange Rate 450 450 450 450 450 450Ksh/US$
Value of Output 81.00 81.00 54.00 54.00 67.50 67.50Ksh/Kg
ON-FARMCOSTS
Labor 7.74 7.74 7.74 7.74 7.74 7.74
Material/Int. 13.11 6.45 6.66 13.11 6.45 6.66 13.11 6.45 6.66Inputs
Fixed Costs 0.70 0.42 0.28 0.70 0.42 0.28 0.70 0.42 0.28
OFF-FARMCOSTS
Processing Costs
Marketing Costs 34.16 23.91 10.25 34.16 23.91 10.25 34.16 23.91 10.25
TOTAL COSTS 51.71 30.78 24.88 55.71 30.78 24.94 55.71 30.78 24.94
Net Output Value 25.29 50.22 1.71 23.22 11.79 36.72
DRC Ratio 0.10 1.07 0.68
DRC 222.94 481.50 305.64
Source: Compiled from tables in Appendix 3 and Shetty et al (1992).
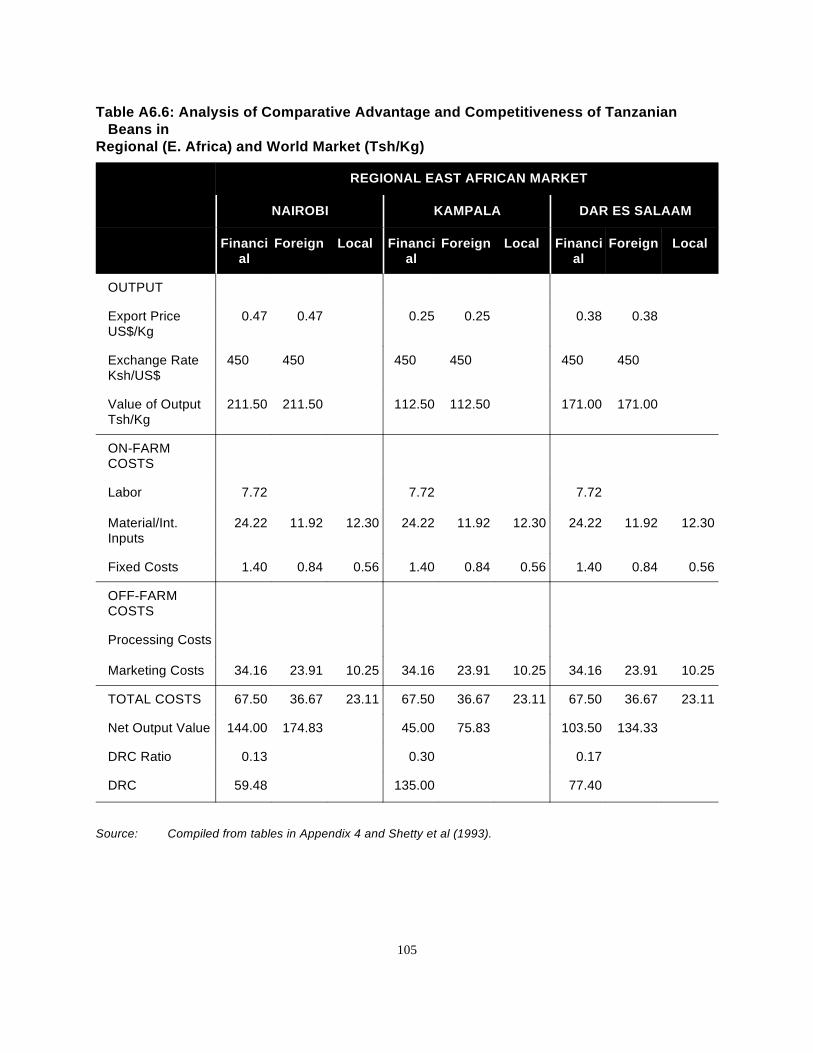
105
Table A6.6: Analysis of Comparative Advantage and Competitiveness of TanzanianBeans in
Regional (E. Africa) and World Market (Tsh/Kg)
REGIONAL EAST AFRICAN MARKET
NAIROBI KAMPALA DAR ES SALAAM
Financi Foreign Local Financi Foreign Local Financi Foreign Localal al al
OUTPUT
Export Price 0.47 0.47 0.25 0.25 0.38 0.38US$/Kg
Exchange Rate 450 450 450 450 450 450Ksh/US$
Value of Output 211.50 211.50 112.50 112.50 171.00 171.00Tsh/Kg
ON-FARMCOSTS
Labor 7.72 7.72 7.72
Material/Int. 24.22 11.92 12.30 24.22 11.92 12.30 24.22 11.92 12.30Inputs
Fixed Costs 1.40 0.84 0.56 1.40 0.84 0.56 1.40 0.84 0.56
OFF-FARMCOSTS
Processing Costs
Marketing Costs 34.16 23.91 10.25 34.16 23.91 10.25 34.16 23.91 10.25
TOTAL COSTS 67.50 36.67 23.11 67.50 36.67 23.11 67.50 36.67 23.11
Net Output Value 144.00 174.83 45.00 75.83 103.50 134.33
DRC Ratio 0.13 0.30 0.17
DRC 59.48 135.00 77.40
Source: Compiled from tables in Appendix 4 and Shetty et al (1993).

106
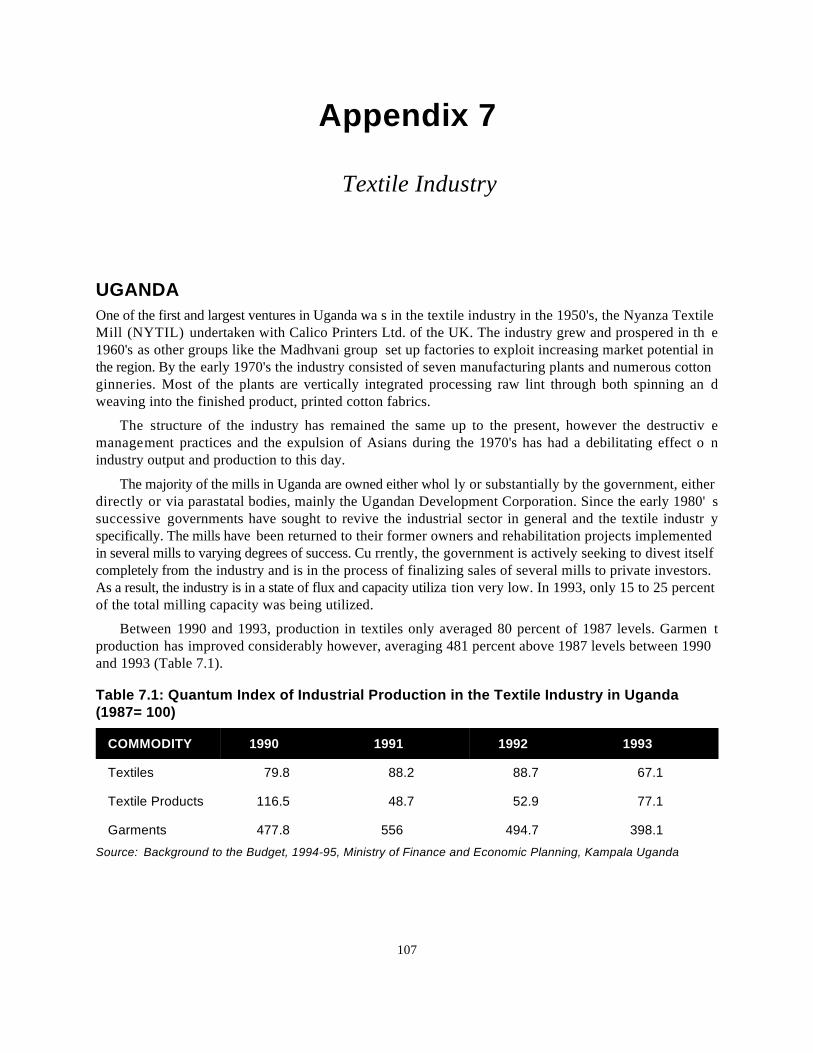
107
Appendix 7
Textile Industry
UGANDAOne of the first and largest ventures in Uganda wa s in the textile industry in the 1950's, the Nyanza TextileMill (NYTIL) undertaken with Calico Printers Ltd. of the UK. The industry grew and prospered in th e1960's as other groups like the Madhvani group set up factories to exploit increasing market potential inthe region. By the early 1970's the industry consisted of seven manufacturing plants and numerous cottonginneries. Most of the plants are vertically integrated processing raw lint through both spinning an dweaving into the finished product, printed cotton fabrics.
The structure of the industry has remained the same up to the present, however the destructiv emanagement practices and the expulsion of Asians during the 1970's has had a debilitating effect o nindustry output and production to this day.
The majority of the mills in Uganda are owned either whol ly or substantially by the government, eitherdirectly or via parastatal bodies, mainly the Ugandan Development Corporation. Since the early 1980' ssuccessive governments have sought to revive the industrial sector in general and the textile industr yspecifically. The mills have been returned to their former owners and rehabilitation projects implementedin several mills to varying degrees of success. Cu rrently, the government is actively seeking to divest itselfcompletely from the industry and is in the process of finalizing sales of several mills to private investors.As a result, the industry is in a state of flux and capacity utiliza tion very low. In 1993, only 15 to 25 percentof the total milling capacity was being utilized.
Between 1990 and 1993, production in textiles only averaged 80 percent of 1987 levels. Garmen tproduction has improved considerably however, averaging 481 percent above 1987 levels between 1990and 1993 (Table 7.1).
Table 7.1: Quantum Index of Industrial Production in the Textile Industry in Uganda(1987= 100)
COMMODITY 1990 1991 1992 1993
Textiles 79.8 88.2 88.7 67.1
Textile Products 116.5 48.7 52.9 77.1
Garments 477.8 556 494.7 398.1
Source: Background to the Budget, 1994-95, Ministry of Finance and Economic Planning, Kampala Uganda
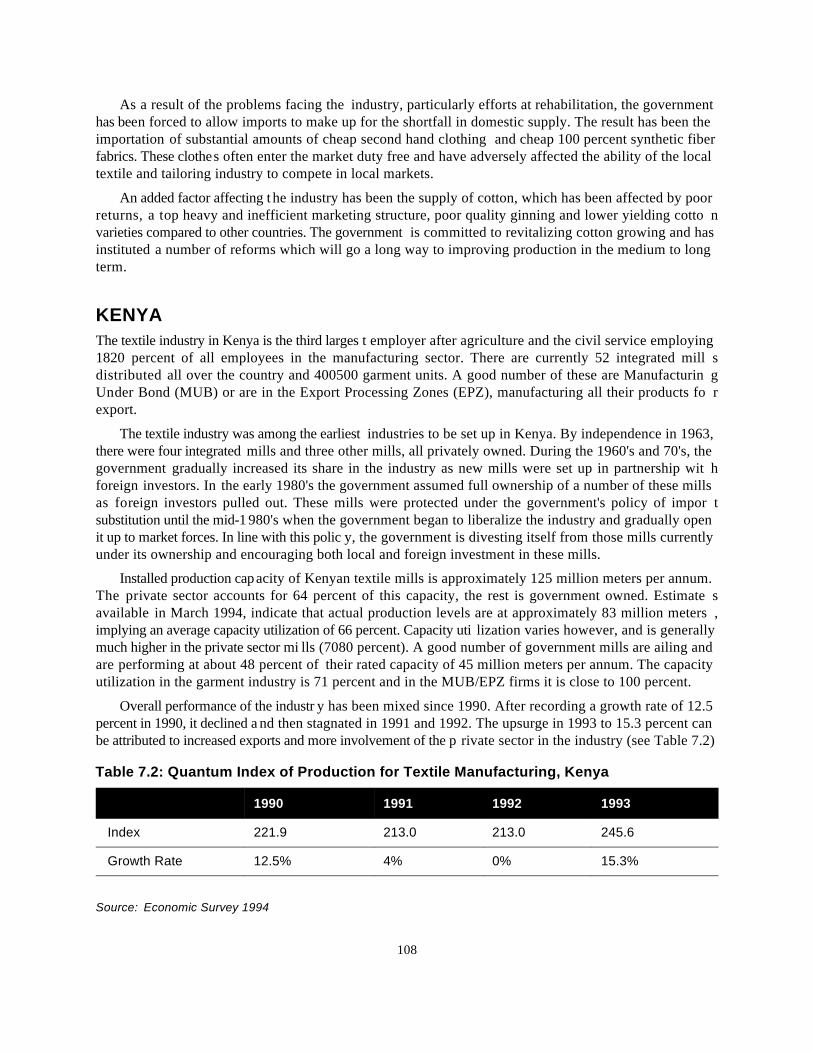
108
As a result of the problems facing the industry, particularly efforts at rehabilitation, the governmenthas been forced to allow imports to make up for the shortfall in domestic supply. The result has been theimportation of substantial amounts of cheap second hand clothing and cheap 100 percent synthetic fiberfabrics. These clothes often enter the market duty free and have adversely affected the ability of the localtextile and tailoring industry to compete in local markets.
An added factor affecting the industry has been the supply of cotton, which has been affected by poorreturns, a top heavy and inefficient marketing structure, poor quality ginning and lower yielding cotto nvarieties compared to other countries. The government is committed to revitalizing cotton growing and hasinstituted a number of reforms which will go a long way to improving production in the medium to longterm.
KENYAThe textile industry in Kenya is the third larges t employer after agriculture and the civil service employing1820 percent of all employees in the manufacturing sector. There are currently 52 integrated mill sdistributed all over the country and 400500 garment units. A good number of these are Manufacturin gUnder Bond (MUB) or are in the Export Processing Zones (EPZ), manufacturing all their products fo rexport.
The textile industry was among the earliest industries to be set up in Kenya. By independence in 1963,there were four integrated mills and three other mills, all privately owned. During the 1960's and 70's, thegovernment gradually increased its share in the industry as new mills were set up in partnership wit hforeign investors. In the early 1980's the government assumed full ownership of a number of these millsas foreign investors pulled out. These mills were protected under the government's policy of impor tsubstitution until the mid-1980's when the government began to liberalize the industry and gradually openit up to market forces. In line with this polic y, the government is divesting itself from those mills currentlyunder its ownership and encouraging both local and foreign investment in these mills.
Installed production capacity of Kenyan textile mills is approximately 125 million meters per annum.The private sector accounts for 64 percent of this capacity, the rest is government owned. Estimate savailable in March 1994, indicate that actual production levels are at approximately 83 million meters ,implying an average capacity utilization of 66 percent. Capacity uti lization varies however, and is generallymuch higher in the private sector mi lls (7080 percent). A good number of government mills are ailing andare performing at about 48 percent of their rated capacity of 45 million meters per annum. The capacityutilization in the garment industry is 71 percent and in the MUB/EPZ firms it is close to 100 percent.
Overall performance of the industr y has been mixed since 1990. After recording a growth rate of 12.5percent in 1990, it declined a nd then stagnated in 1991 and 1992. The upsurge in 1993 to 15.3 percent canbe attributed to increased exports and more involvement of the p rivate sector in the industry (see Table 7.2)
Table 7.2: Quantum Index of Production for Textile Manufacturing, Kenya
1990 1991 1992 1993
Index 221.9 213.0 213.0 245.6
Growth Rate 12.5% 4% 0% 15.3%
Source: Economic Survey 1994
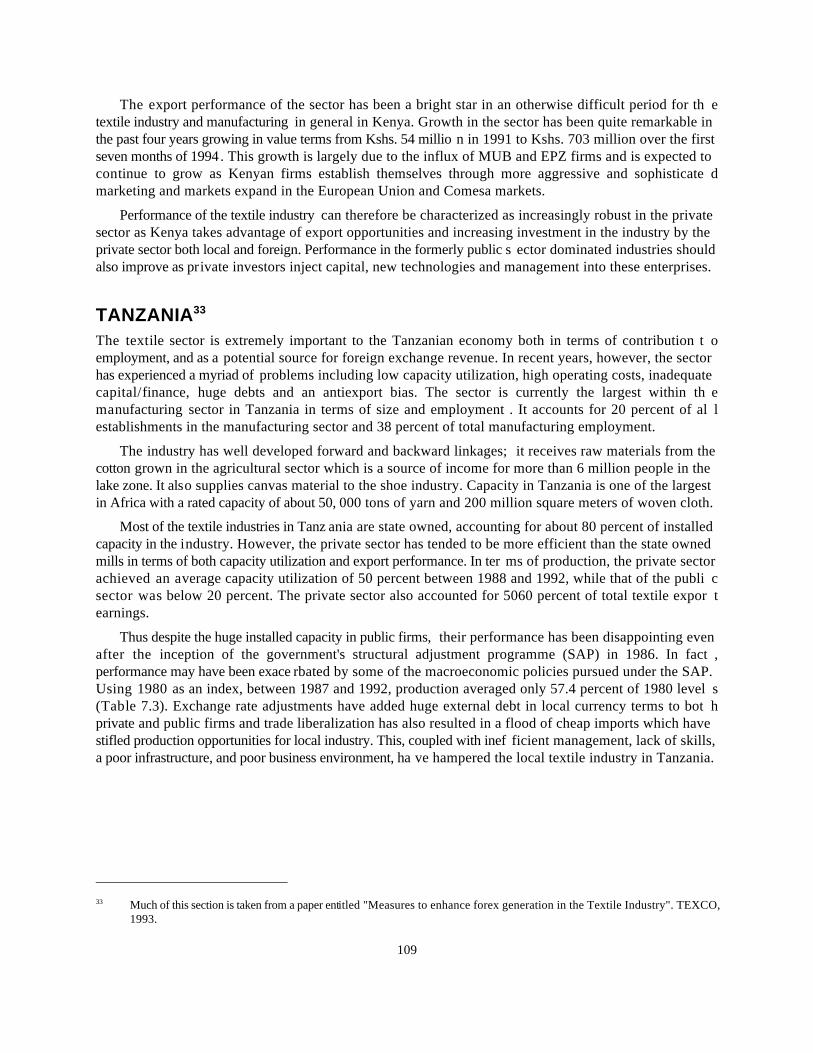
Much of this section is taken from a paper entitled "Measures to enhance forex generation in the Textile Industry". TEXCO,33
1993.
109
The export performance of the sector has been a bright star in an otherwise difficult period for th etextile industry and manufacturing in general in Kenya. Growth in the sector has been quite remarkable inthe past four years growing in value terms from Kshs. 54 millio n in 1991 to Kshs. 703 million over the firstseven months of 1994. This growth is largely due to the influx of MUB and EPZ firms and is expected tocontinue to grow as Kenyan firms establish themselves through more aggressive and sophisticate dmarketing and markets expand in the European Union and Comesa markets.
Performance of the textile industry can therefore be characterized as increasingly robust in the privatesector as Kenya takes advantage of export opportunities and increasing investment in the industry by theprivate sector both local and foreign. Performance in the formerly public s ector dominated industries shouldalso improve as private investors inject capital, new technologies and management into these enterprises.
TANZANIA33
The textile sector is extremely important to the Tanzanian economy both in terms of contribution t oemployment, and as a potential source for foreign exchange revenue. In recent years, however, the sectorhas experienced a myriad of problems including low capacity utilization, high operating costs, inadequatecapital/finance, huge debts and an antiexport bias. The sector is currently the largest within th emanufacturing sector in Tanzania in terms of size and employment . It accounts for 20 percent of al lestablishments in the manufacturing sector and 38 percent of total manufacturing employment.
The industry has well developed forward and backward linkages; it receives raw materials from thecotton grown in the agricultural sector which is a source of income for more than 6 million people in thelake zone. It also supplies canvas material to the shoe industry. Capacity in Tanzania is one of the largestin Africa with a rated capacity of about 50, 000 tons of yarn and 200 million square meters of woven cloth.
Most of the textile industries in Tanz ania are state owned, accounting for about 80 percent of installedcapacity in the industry. However, the private sector has tended to be more efficient than the state ownedmills in terms of both capacity utilization and export performance. In ter ms of production, the private sectorachieved an average capacity utilization of 50 percent between 1988 and 1992, while that of the publi csector was below 20 percent. The private sector also accounted for 5060 percent of total textile expor tearnings.
Thus despite the huge installed capacity in public firms, their performance has been disappointing evenafter the inception of the government's structural adjustment programme (SAP) in 1986. In fact ,performance may have been exace rbated by some of the macroeconomic policies pursued under the SAP.Using 1980 as an index, between 1987 and 1992, production averaged only 57.4 percent of 1980 level s(Table 7.3). Exchange rate adjustments have added huge external debt in local currency terms to bot hprivate and public firms and trade liberalization has also resulted in a flood of cheap imports which havestifled production opportunities for local industry. This, coupled with inef ficient management, lack of skills,a poor infrastructure, and poor business environment, ha ve hampered the local textile industry in Tanzania.
110
Table 7.3: Quantum Index of Production in the Textile Industry in Tanzania
1987 1988 1989 1990 1991 1992
Production ('000 39,064 38,916 41,169 58,381 85,220 30,218Sq. Meters)
Index (1980=100) 43.3 43.2 45.7 84.4 94.5 33.5
Source: Bank of Tanzania, Annual Report, 1992
Despite the problems faced by the industry, the potential for expansion is there if considerable an dconcerted policy measures are put in place to revive the industry.
111
ReferencesAckelloOgutu, and Odhiambo, M. O. 1986. Maize Production in Kenya. A Study of Costs an d
Technological Constraints with Output Expansion . Report to USAID/Kenya.
Acland, J. D. 1971. East African Crops . London, Nairobi: Longmann.
ArgwingsKodhek, G. 1992. Private Maize Marketing in Kenya . Proceedings of Conference on Maiz eSupply and Marketing Under Market Liberalization. Karen, Kenya.
Bank of Uganda Agricultural Secretariat. 1993. Economics of Crop Production: Gross Margin an dComparative Advantage Analysis . Kampala, Uganda: Bank of Uganda.
Barclay, T.; Odhiambo, M. O.; Hughes, D.; and Kariungi, F. 1989. Economic and Social Soundnes sAnalysis for Market Development Program . USAID/DAI.
Binamungu, J. A. 1992-93. Industry Review of Sorghum, Millets, Cassava and Beans . Dar es Salaam:Tanzania Ministry of Agriculture, Marketing Development Bureau.
Booker Agricultural International, and Githiongo & Associates. 1983. Grain Marketing Study . Submittedto Ministry of Finance, GoK, in 1983.
Branson, R. E. and Norvell, D. G. 1983. Introduction to Agricultural Marketing . New York, London:McGrawHill Book Company.
Carl Bro International and Ministry of Commerce, Industry and Cooperative, Government of Uganda .1993. Master Plan for the Grain Marketing Sector, Volume II, Main Report . Carl Bro International.
Coughlin, Peter. 1987. Gradual Maturation of an Important Substitution Industry: The Textile Industry inKenya.
Crandall, Kristine. 1993. "Options for Kenya's Smallholder Coffee Sector," in proceedings of th eConference on Agricultural Exports and Market Development. Nairobi: Egerton University.
Crawford, I. M. 1993. Agricultural and Food Marketing, Volume II, Teaching Notes . Harare, Zimbabwe:FAO Network and Centre for Agricultural Marketing Training in Eastern and Southern Africa.
Commander, S. (ed). 1988. Structural Adjustment and Agriculture: Theor y and Practice in Africa and LatinAmerica. London: Overseas Development Institute.
Crissman, Charles; Crissman, Linda; and Carli, C. 1993. Seed Potato Systems in Kenya: A Case Study .Lima, Peru: International Potato Center.
Crissman, Linda McArthur. 198 9. Evaluation, Choice, and Use of Potato Varieties in Kenya . Lima, Peru:International Potato Center.
DAI. 1993. Study on the Efficiency and Competitiveness of Manufacturing Enterprises in Rwanda .
Development Support Group. 1992. Consultancy for Public Enterprise Reforms, National Cereals ProduceBoard. Republic of Kenya, Office of the Vice President and Ministry of Finance.
Egerton University, Policy Analysis Mat rix. 1993. Proceedings of the Conference on Agricultural Exportsand Market Development .
Ephanto, R. K. 1992. “Patterns and Trends in Maize Consumption in Kenya, ” Proceeding of theConference on Maize Supply and M arketing under Liberalization . Karen, Nairobi: Egerton UniversityPAM Project.
112
Fekaji Investment Consultants. 1994. Sector Study of Textile Industry in Kenya , Draft Report. Fekaj iInvestment Consultants.
Gordon, H. and Spooner, N. 1992. “Grain Marketing in Kenya: Principles and Practice,” PAM/KMDPProceeding of the Conference on Maize Supply and Marketing under Liberalization . Karen, Nairobi:Egerton University PAM Project.
Gray, J. G. and Kariungi, F. T. 1991. Cereal Sector Reform Program. Global Evaluation of the CRSP .Report to GoK.
Gsaenger, H. G. and Schmidt. 1977. Decontrolling the Maize Marketing Sys tem in Kenya, Discussion PaperNo 254 IDS. Nairobi: University of Nairobi.
Guyton, Bill, et al. 1994. Kenya's Irish Potato Subsector , GOK/MOALDM/MIS Report No. 9401.
Hassan, R. and Corbett, J. 1993. Using Climatic Surfaces and Georeferenced Farm Survey Data t oCharacterize Maize Production in Kenya .
Hasselmark, U. and Lorenzl, G. 1976. "Structure and Performance of the Maize Marketing System I nKenya," Zeistschrift fuer Auslaedische Landwirtschaft , pp 171-179.
Holtzman, J. S. 1986. Rapid Appraisal Guidelines for Agricultural Marketing and Food System Researchin Developing Countries , Working Paper No. 30. East Lansing, MD: Michigan State University.
Holtzman, J. S.; Martin, J.; and Abbott, R. D. 1993. Operational Guidelines for Rapid Appraisal o fAgricultural Marketing Systems . Bethesda, MD: Abt Associates Inc.
Journal of the Textile Institute , No. 2. 1991.
Kabyemera, J. K. 1994. Draft Country Paper for Regional Policy Analysis Network Tanzania , RegionalPolicy Analysis Network Workshop. Harare, Zimbabwe.
Kenya, Government of. 1962, revised 1972. "The Maize Marketing Act," Laws of Kenya, Chapter 338. ,Nairobi: Government Printer.
Kenya, Government of. 1972. "The Price Control Act," Laws of Kenya, Chapter 504. Nairobi: GovernmentPrinter.
Kenya, Government of. Statistical Abstracts (various issues). Nairobi: Government Printers.
Kenya, Government of. 1993. Economic Survey of Kenya . Nairobi: Government Printer.
Kenya, Government of. 1988. Memorandum of Understanding Between the GoK and the EEC Concerningthe Cereal Sector Programme .
Kenya, Government of. 1988. Cereal Sector Reform Programme: Agreement on the Implementatio nTimetable.
Kenya, Government of. 1989. National Development Plan 1989-1993 .
Kenya, Government of. 1993. Monthly Market Bulletin . Ministry of Agriculture, Livestock Development,and Marketing Information Branch.
Kenya, Government of. 1994. Production and Export Performance of the Textile Sector in Kenya , DraftReport. Ministry of Commerce and Industry.
Kristjanson, Patricia; Newman, M.; Christensen, C.; and Abel, M. Export Crop Competitiveness: Strategiesfor SubSaharan Africa . Abt Associates, AMP.
113
Kristjanson, P. 1993. A Survey of Market Information Needs of Farmers and Traders in Kenya , Report toGoK. Nairobi: Ministry of Agriculture, Market Information Branch.
Kydd, J. and Spooner, N. 1990. Agricultural Market Liberalization and Structural Adjustment i nSubSaharan Africa .
Lawrence, P. (ed). 1986. World Recession and The Food Crisis in Africa: Review of African Politica lEconomy. London: James Currey Ltd.
Lofchie, M. F. 1989. The Policy Factor: Agricultural Performance in Kenya and Tanzania . Nairobi:Heinmann, Kenya Ltd.
Louis Berger International. 1993. Review of Protection Given to Industry in Uganda , Draft Report. LouisBerger International.
Maritim, H. K. 1982. Maize Marketing in Kenya: An Optimal Commodity Flow Pattern and Polic yStrategy, Ph.D Thesis. Berlin: Technische University of Berlin.
Marketing Development Bureau, December 1993. "Industry Review of Coffee 1992/93", Ministry o fAgriculture, Government of Tanzania.
Maxwell Stamp PLC, 1993. Study of the Effectiveness of Po licies, Facilities and Incentives for InvestmentPromotion.
Mdadila. 1992-93. Industry Review of Maize, Rice and Beans . Dar es Salaam: Marketing Developmen tBureau, Ministry of Agriculture.
Ministry of Finance. 1986. A Review of Rwanda's Textile Clothing Subsector .
National Cereals and Produce Board. 1990. Liberalization under the Cereals Sector Reform Programme .Nairobi: NCPB Forward Planning Unit.
Nyoro, J. K. 1992. Competitiveness of Maize Production System in Kenya .
Nyoro, James. 1994. "Processing and Marketing of Coffee in a Li beralised Market," Conference on MarketReforms. Agricultural Production and Food Security, Egerton University Policy Analysis Matrix.
Odhiambo, M. O. 1988. Policies Related to Grain Market Development. Policy Assessment Study, VolumeIII A, report prepared for USAID/Kenya. Nairobi: Agriconsult Ltd.
Odhiambo, M. O. 1988. Opportunities, Constraints and Possible Solutions to Improve the Access o fUgandan Maize and Beans to Kenyan Market , report to Export Policy Analysis and Development Unit,Ministry of Finance and Economic Planning. International Science and Technology Institute Inc. andHigh Value Horticulture PLC.
Onyacholaa, Martin. 1994. Assessment of Competitiveness of Ugandan Industries .
Ouedraogo, I. S.; Kere, P.; Osore, J.; and Matheka, F. 1994. Dry Beans Subsector in Kenya: A Rapi dAppraisal with Emphasis on Market Informati on Needs and Extension Issues , a report submitted to theGovernment of Kenya, Ministry of Agriculture, Livestock Deve lopment and Marketing, Kenya MarketDevelopment Program (KDMP).
Oxford University. 1994. Adjustment in Africa: Reforms, Results, and the Road Ahead . Oxford UniversityPress.
PAM Project. PAM/KMDP Proceedings of Conference on Maize Supply and Marketing Under Marke tLiberalization. Karen, Nairobi: Egerton University PAM Project.
114
Pearce, Richard. 1992. The Liberalization of Grain Markets i n SubSaharan Africa: A Gradualist Approach ,FAO/AFMESA Technical Paper No. 1, Workshop on the Role Of Grain Marketing Agencies UnderStructural Adjustment. Nairobi.
Pearson, S. R. "Issues and Options in Food Price Stabilization," PAM/KMDP Proceedings of Conferenceon Maize Supply and Marketing Under Market Liberalization. Karen, Nairobi: Egerton Universit yPAM Project.
REPIM Ltd. 1989. Uganda: Effective Assistance to Industry in Support of Structural Adjustment .
Schmidt, Guenter. 1979. Maize and Beans Marketing in Kenya, The Interaction and Effectiveness o fInformal and Formal Marketing Systems , Occasional Paper No. 31. Nairobi: IDS, University O fNairobi.
Sekabembe, B. and Stepanet, J. 1994. Supply Facts in the Maize and Beans Trade to Kenya Export Policy .Kampala, Uganda: Analysis and Development Unit, Ministry of Finance and Economic Planning.
Sergeant, A. and Macartney, J. 1993. Opportunities for Nontraditional Agricultural Exports from Uganda:Volume 4, Cereals, Beans and Oil Crops , report submitted to Export Policy Analysis and DevelopmentUnit, Ministry of Finance and Economic Planning. Kampala, Uganda.
Service Group (The). 1994. Kenya Export Competitiveness Study .
Shetty, Kaduma and Mawalla. 1992. Working Group Paper on Returns to Cropping, Comparativ eAdvantage and Export Competitiveness . Tanzania Agricultural Sector Memorandum.
Technosynesis, S. P. A. and Cooper & Lybrand Associates. 1988. National Cereals and Produce BoardReorganization Study , report to Ministry of Supplies and Marketing.
Texco. 1993. Measures to Enhance Forex Generation from the Textile Industry in Tanzania .
Uganda Manufacturers Association. 1993. Effects of the 1993/94 Budget on Local Industries .
Venegas, M.; Muwanga, J.; and Lwasa, S. 1992. The Marketing System for Beans in Uganda , WorkingPaper No. 922. Makerere University, Department of Agricultural Economics.
Werner International. 1989. Textile Sector Study for Uganda .
World Bank. 1987. Kenya: Industry Sector Policies for Investment and Export Growth, Volume II .
World Bank. 1982. Kenya Maize Marketing and Pricing Subsector Review, World Bank Report N o4005KE.
World Bank. 1993. Tanzania Agricultural Sector Memorandum .
World Bank. 1986. Kenya Agricultural Subsector Report, World Bank Report No. 4629KE .