Embed Size (px)
Citation preview

1
ICA Paper Jan 9 text
Business Environment and Comparative Advantage in Africa: Evidence from the Investment Climate Data*
Benn Eifert Alan Gelb
Vijaya Ramachandran
January 2005
*Benn Eifert is a Junior Professional Associate at the World Bank. Alan Gelb is Director of Development Policy at the World Bank. Vijaya Ramachandran is an Assistant Professor at Georgetown University and a consultant to the World Bank. Data used in this paper were collected by the Regional Program on Enterprise Development in the Africa Private Sector Group of the World Bank. We would like to thank William Cline, James Habyarimana, Mary Hallward-Driemeier, Phil Keefer, Michael Klein, Taye Mengistae, Todd Moss, John Nasir, Guy Pfeffermann, Steven Radelet, Gaiv Tata, Peter Timmer, Manju Shah, and seminar participants at the World Bank, the Center for Global Development, and Cornell University. The views expressed in this paper are solely those of the authors.

2
Abstract This paper ties together the macroeconomic and microeconomic evidence on the competitiveness
of African manufacturing sectors. The conceptual framework is based on the newer theories
that see the evolution of comparative advantage as influenced by the business climate -- a key
public good -- and by external economies between clusters of firms entering in related sectors.
Macroeconomic data from purchasing power parity (PPP) estimates confirms that Africa is high-
cost relative to its levels of income and productivity.
This finding is compared with firm-level evidence from surveys undertaken for Investment
Climate Assessments in 2000-2004. These confirm a pattern of generally low productivity, and
also suggest the importance of high indirect costs and business-environment-related losses in
depressing the productivity of African firms relative to those in other countries. There are
differences between African countries, however, with some showing evidence of a stronger
business community and better business climate.
Finally, the paper adopts a political-economy perspective on the prospects for reform of Africa’s
business climate, considering African attitudes to business and the fractured nature of African
business sectors as between indigenous, minority and foreign investors. The latter have far
higher productivity and a greater propensity to export; however, Africa’s difficult business
climate and the tendency to overcome this by working in ethnic networks slows new entry and
may decrease the incentives of key parts of the business community form constituting an
aggressive pressure group for reform. Even though reforms are moving forward in several
countries, this slows their impact and raises the possibility that countries settle into a low-
productivity equilibrium. The paper concludes with a discussion of the findings for reforms to
boost the competitiveness and diversification of African economies.

3
1 INTRODUCTION
Developing countries were traditionally considered to be primary exporters but that
stereotype has long faded: by 2002 sixty percent of their exports were manufactured goods.
The technology content of developing country exports has also been rising rapidly, especially
in Asia which has seen the emergence of dynamic regional trading networks. Sub-Saharan
Africa (Africa) has lagged in this process of economic diversification -- abstracting from
South Africa and Mauritius, manufacturing and processing capacity remains modest. Slow
progress in economic diversification and technological upgrading has been associated with
weak private sector development, lagging incomes, a falling behind in terms of development
outcomes, and the marginalization of Africa on the world trading stage.
This paper draws on a number of firm surveys undertaken for the World Bank’s Investment
Climate Assessments (ICAs) to better understand the factors underlying Africa’s slow
industrial growth. While a number of studies have used firm surveys to analyze productivity
determinants in Africa (Biggs et al, 1996, Collier et al 2000, Fafchamps 2004; Mengistae and
Pattillo 2002; see also the extensive RPED studies, 1995-present), it is now possible to
combine expanded coverage in Africa with comparisons to other low income countries that
have managed to effect the transition to manufacturing exporter status. This paper attempts
to position African firms amongst a wide range of firms from other regions. It attempts to
analyze the cost structure of firms in Africa relative to those in competitor regions, and to
relate these results to macroeconomic variables. It also applies comparative firm data to
consider why reform tends to be difficult and slow in Africa.
Section 2 of the paper reviews three theories of comparative advantage that offer different
perspectives on Africa’s slow diversification. The first emphasizes the role of factor
endowments in shaping economic structure and the composition of trade. With capital
assumed mobile in the long run, Wood and Mayer (2001) and Wood (2002) compare factor
endowments in terms of the ratios of land (resources) to skills. While this produces powerful
results in terms of trade composition, it does not account for the poverty of Africa in the
presence of resource abundance: neither does it offer a perspective on the long-run evolution

4
of the factor endowments that shape trade patterns at any point in time. The second theory
focuses on the ability of countries to provide public goods to the investment community in
the form of a stable and low-cost business climate: security, good public services and
regulation, and predictability. As surveyed by Collier and Gunning (1997), studies suggest
that Africa is an environment of high costs and high perceived risks and that this constrains
investment in manufacturing. We analyze the deviations from predicted Purchasing Power
Parity (PPP) conversion factors to shed light on the degree to which cost and price levels
deviate from those expected on the basis of income levels. The third theory, ably surveyed
by Burgess and Venables (2004), focuses on the important role of firm entry in creating a
critical mass of industries able to reap knowledge and other dynamic scale externalities to
strengthen their ability to secure competitive niches in world markets. Both of these theories
suggest powerful externalities associated with conglomeration effects, but also that these
effects will be hard to achieve in the absence of a low-cost business environment.
Section 3 turns to the firm-level investment climate (IC) surveys and assesses the
performance gap between Africa and its competitors). Rather than using cross-country
regressions to estimate the impact of particular investment climate variables on productivity
levels, we adopt a simpler approach. We define the concept of net total factor productivity
and consider the contributions of factory floor productivity, indirect costs, and business-
environment-related losses to overall differentials in net TFP. Our data suggest that the
broader context in which firms are operating, rather than solely factory-floor operations, may
be crucial determinants of competitiveness. The results also suggest a range of benchmarking
variables that can be used, in conjunction with repeated surveys, to gauge improvements in
public service delivery and the business climate.
If -- as suggested by the recent WDR (World Bank 2004a) -- the business climate is so
important for growth and development, why have African countries been so slow to improve
it? “Doing Business, 2005” (World Bank 2004b) places Africa low on business climate
indicators and as a laggard in reform relative to other regions. Part of the reason concerns the
particular severity of physical constraints in Africa, but equally important is the
configuration of political interests for and against reforms in business-climate related areas.

5
Section 4 considers the survey evidence from the perspective of ethnicity, highlighting the
fracturing of business interests along ethnic and domestic/foreign lines, and the tradeoffs for
firms (especially the larger ones) between the gains from a better business climate and the
losses from the competitive entry that improvements are likely to encourage. It is argued that
these factors weaken the ability, and perhaps also the motivation, of the business community
to press for a better business climate, and that this compounds the ambivalent attitude
towards business expressed in AfroBarometer surveys and reflected in statements by many
prominent officials. These factors raise the question of whether to attempt reforms across-
the-board or to sequence them to create pockets of opportunity which in turn can build
constituencies for wider reforms.
Section 5 concludes with a summary of policy implications as well as thoughts on further
areas of research. The rapid expansion of data on the global business climate, as well as firm
surveys for African countries and comparators, calls for a substantial increase in the level of
analytical work on competitiveness. Hopefully an increased share of such research will be
internalized in Africa itself. A final objective of this paper is to encourage such research.
2 COMPARATIVE ADVANTAGE AND COSTS IN SUB-SAHARAN AFRICA
2.1 Factor Endowments, Business Climate and Dynamic Scale Economies: Three
Approaches to Comparative Advantage As noted long ago by Chenery and Syrquin (1975) and others, development and structural
change are closely associated, so that growth largely involves the introduction of new, higher
value-added activities and products rather than simply the expansion of old ones. In the initial
stages, this involves the relative contraction of low-productivity agriculture and the rise in the
share of industry. Similarly, overall growth within the industrial sector is the aggregation of
repeated industry cycles of take-off, maturation and stagnation (or migration to less advanced
countries), with more productive economies advancing up the technological ladder. Trade theory
is central to understanding economic structure and structural change because countries will tend
to export goods which they can make most cheaply and efficiently relative to other countries.
And because sustained economic growth is driven by the emergence of new economic activities
6
– rather than the perpetual scaling-up of old activities – trade theory is also key to understanding
growth.
The factor-proportions theory of comparative advantage focuses on the relative abundance of
factors of production, attributing change in the structure of a country’s production and exports to
processes like the accumulation of physical and human capital. Wood and Berge (1997), and
Wood and Mayer (2001) compare Africa’s endowments with those of other regions. With
capital assumed mobile in the long run, relative endowments of skills and land (resources) per
head are shown to have a strong relationship with the composition of exports. Countries higher
up the skills/land spectrum export more manufactures relative to processed or primary goods,
and a larger proportion of higher-technology manufactures. A pessimistic view based on these
results would argue that Africa’s scant human capital and rich natural resource base ensures that
manufactured exports will always be unprofitable.
These theories do not, however, fully account for Africa’s low income level despite its resource
abundance; neither do they explain the dynamic path of factor accumulation (notably pervasive
financial and human capital flight)1 and comparative advantage which has shaped Africa today.
A simple extension of this logic is that comparative advantage is also a function of those
differences in productivity and costs across countries and industries which do not derive from
relative factor abundance (Krugman 1980, 1981, 1983). The main effects here – which play a
major role in the endogenous determination of comparative advantage – are expressed in two
other approaches, one relating to business-environmental factors and the other to dynamic
economies of scale. These factors interact to produce a more flexible theory of dynamic
comparative advantage.
The business environment is the nexus of policies, institutions, physical infrastructure, human
resources, and geographic features which influence the efficiency with which different firms and
industries operate.2 At firm level, the business environment directly influences costs of
production; at the industry level it often relates to market structure and competition. These
1 For estimates of financial and human capital flight see Collier et al (1999) 2 For more detail see World Development Report 2004 “A Business Climate.. and the series of Investment Climate Assessments put out by the World Bank over 1999-2004.
7
effects are felt more heavily in traded sectors which are not particularly intensive in natural
resources (i.e. manufacturing, high-value services) than in primary production and extractive
resource sectors because the former tend to more intensively require “inputs” of logistics,
infrastructure, and regulation (Collier 2000). For example, the combination of macroeconomic
instability, crime and poor security, a weak and politicized financial system, shoddy local roads
and electricity systems, high transport costs, and predatory local officials will have relatively
little influence on the productivity and costs of offshore oil industries, but will be devastating for
small-scale and medium-scale manufacturing. Even efficient firms, able to transform inputs into
outputs with high efficiency and low “factory-floor” costs can be driven out of business by the
increase in indirect costs occasioned by a poor business environment.
The consideration of dynamic economies of scale generated by learning processes, network
effects, and industry-specific spillovers represents a further step beyond classical production and
trade theory (Krugman 1980, 1991). Evidence suggests that dynamic scale economies play a
considerable role in shaping the structure of production, as illustrated by path-dependence in the
development of individual industries, the “lumpy” nature of growth in a particular product across
countries (e.g. high degrees of specialization in narrow industrial lines; see Burgess and
Venables, 2004) and within countries (e.g. urbanization, industrial clusters, and path-dependence
in the development of individual industries; see Krugman, 1991).
Individual firms do not internalize the social value of the potential economies of scale from their
entry into a particular industry in a particular country. Thus entry, investment and the
development of new industries is still dependent on the quality of the business environment,
good policies, and sound infrastructure (Collier 2000), incentives provided by competition in an
appropriate institutional setting (Olofin, 2002, Grossman and Helpman, 1994), and geographic
advantages and disadvantages (Krugman, 1991).3 Business environments do not have to be
perfect, but they have to be ‘good enough’ on a number of crucial dimensions to stimulate
enough investment and competition to launch the self-reinforcing process of industrial growth.
3 Also, Montobbio (2002) has analyzed structural change from the perspective of evolutionary economics. He finds that with firm-level heterogeneity in unit costs, sorting and selection driven by competition and product substitutability drive a process of structural change. Though this approach has very different analytical foundations than endogenous growth and trade theory, one of its fundamental insights – that an economy’s relatively more productive firms and sectors tend to become more important over time in an economy – is similar.

8
This theoretical framework offers insights beyond those of classical trade theory for
understanding patterns of trade and industrialization. First, while many resource-rich countries
have been unable to move past primary products, other notable cases with good policies (Chile,
Malaysia, Australia, United States) built high-value-added resource processing industries in the
early stages of industrialization, using these as a springboard to even higher-value activities.
Second, the broad factor-based specialization predicted by classical trade theory does not map
well onto reality. Countries with similar factor endowments often export different products, and
often to each other. Hausmann and Rodrik (2002) study US-bound exports from Bangladesh,
Dominican Republic, Honduras, Korea, and Taiwan at a very fine level of disaggregation,
finding that exports are characterized by specialization in a narrow range of activities with
surprisingly little overlap across countries. Indeed, African examples of new industries such as
Kenya’s horticulture-floriculture sector and the garment sectors of Madagascar and Lesotho also
suggest the importance of industrial clustering.
Pessimistic evaluations of the prospects of diversification and growth in resource-rich countries,
like some of those surveyed by Bigsten et al (2000)4, therefore miss a large part of the story.
African countries often suffer from poor policies, weak institutions, and shoddy infrastructure
(see Collier and Gunning 1999, Eifert and Ramachandran 2004). High transport costs and
sparseness are also important (Venables and Limao 1994, Winters and Martins 2004): GDP per
square kilometer in Africa (excluding South Africa) is one-tenth the level in Latin America and
one-twentieth that in India. Manufacturing value added per hectare (excluding South Africa) is
only 1.2% that of China: moreover, the GDP of the median country, at barely $3 billion, suggest
that regulatory costs are high relative to domestic market potential. These factors increase costs,
depress productivity, discourage investment, and hence obstruct the self-reinforcing processes of
growth, clustering and dynamic economies of scale. Within Africa, productivity is strongly
related to exports, both as a cause and as a consequence (Collier et al 2000, Soderbom and Teal
2003). But most African firms simply are not productive enough to export manufactures. Even
from a classical perspective, Africa’s factor endowment is consistent with competitiveness in a
4 These include the Mayer-Wood (2001) argument that Africa’s skill deficit and relative abundance in natural resources condemns the continent to primary product exports for the foreseeable future.

9
variety of labor-intensive natural resource processing industries. However, most African
countries have been unable to take even this step towards higher value-added processing.
2. 2 Macroeconomic Evidence on High Costs
Countries with poor business environments can therefore be modeled as having low efficiency in
producing a wide range of non-traded goods and services that serve directly as intermediate
inputs to production or that underpin the efficient operation of services, such as finance, essential
for production. As countries move progressively down the efficiency frontier, the costs to
manufacturing firms of obtaining these inputs rises; this squeezes their value-added between
rising overall costs and the price at which their products can be imported. Few firms can insulate
themselves from high domestic costs: in extreme cases the economy retreats into a combination
of subsistence agriculture and concentrated hydrocarbon or hard-mining activities able to shield
themselves from economy-wide effects.5 This section of the paper approaches costs from a
macroeconomic perspective departing from the PPP conversion factors which can be useful for
comparing price levels across countries (Gelb and Tidrick 2000).
Purchasing Power Parity (PPP) conversion factors—here expressed as the ratio of a country’s
GDP measured in market prices to its income measured in PPP prices --provides an estimate of
its aggregate price level relative to those of other countries. This ratio ranges from less than 0.2
in some poor countries to 1 or higher in OECD countries (see Table 1). Unfortunately, the price
deflators for PPP calculations were last updated for 1993-1996, so this picture is ten years old
and some countries may look different today. A new round of data collection is underway, but it
will take some time for this effort to be completed.
PPP conversion factors are closely related to income levels due to the “Balassa Effect”--
productivity gaps between rich and poor countries are larger in tradeables sectors than in non-
tradeables, while rich countries also have higher demand for non-traded goods and services.
These therefore tend to be relatively more costly in rich countries. International trade tends to
5 Technology can sometimes enable a wider range of firms to overcome high domestic cost structures. Installing their own communications systems enabled Indian software and data-processing firms to bypass ineffective and costly telecommunications systems and build on a strong base of cheap, highly-trained and English-speaking labor. But such cases are likely to be rare.

10
equalize prices of traded goods so that aggregate price level differences tend to be driven by the
prices of non-traded products, although the final prices of most tradeable goods will also be
affected by trade restrictions and the prices of inputs such as port services and domestic
transport. For manufacturing firms, higher-traded goods prices will impact competitiveness
through the cost of imported capital equipment and raw materials, while higher non-traded goods
prices will do so through a wide range of indirect costs: transport, logistics, electricity,
telecommunications, rent, security, and so forth.
With incomes averaging $300 per head, Africa’s poor economies have only four-fifths the
income level of South Asia and one-half that of East Asia. But from PPP conversion factors,
their costs are 75% and 35% higher, respectively than those for these two regions. This provides
an indication of substantially higher costs than would be predicted by the Balassa Effect as
shown in Figure 1. Table 1 also compares actual to predicted costs. Africa’s poor countries are
31% more costly than predicted, while China and South Asia (India, primarily) are 20% and 13%
below their predicted levels.
These results are broadly compatible with the estimates from Sala-i-Martin et al (2003) that
capital costs are one third higher than world levels in Africa and one third lower than world
levels in Asia. These results may also reflect the price of land, which is often very high in Africa
due to various market distortions. But they suggest that cost divergences extend more widely
beyond capital goods to encompass a wide range of goods and services.
Table 1. Ratio of PPP conversion factors and actual relative to predicted prices, by region,
1993-96
Figure 1. Cost levels versus log income, regional aggregates
Moving to the country level, income explains 90 percent of the cross-country variation in price
levels. However, some lie substantially above or below the regression line, including a number
of poorly-performing African countries. While there is noise in the PPP data, there are also some

11
systematic patterns. The most deviant outlier, the Democratic Republic of Congo, provides some
intuition on the causes. Congo is an oil-producing country with a record of political instability
and poor governance and economic management, low capacity, poverty and high inequality, a
harsh tropical climate, and is relatively far from major international markets. Despite the
country’s modest per capita income ($750 at market prices), market prices for goods and services
are close to OECD levels (ER/PPP is 0.80). Table 2 illustrates countries’ price levels and their
deviation from the Balassa income-price curve. Many strong performers lie well below the
regression line--most of these countries have effected the transition to manufactured exporter
status and have created a critical mass of industrial activities able to take advantage of cheap
local inputs to lower costs for other firms and consumers alike. Price levels in Africa’s better-
performing countries, including South Africa and Mauritius which have also shifted from
primary to manufactured exports, are also close to predicted values. Countries above the line are
typically weak performers and most are still at primary exporting stage. Table 2 divides
countries below $1,000 per capita into low, moderate, and major manufacturing exporters and
reports cost levels and deviations from the Balassa curve. There are exceptions – Sudan is one of
the strangest – but the pattern is quite strong.
If the costs facing many African firms are even close to the estimates, they will therefore impact
on competitiveness in many sectors. In addition, to the extent that households and workers also
face high prices, the market value of their wages and incomes overstates their purchasing power
relative to households in other poor, but low-cost, countries. African firms may therefore face
relatively high wage costs for firms but African workers see relatively low purchasing power.
Of course, this highly aggregated exercise is only indicative; it is unclear which areas are driving
the cross-country differences in costs. The next section analyzes microeconomic evidence at the
firm-level, which throws more light on the factors causing African firms to face high costs of
doing business.
Table 2. Costs and Export Structure, 1993-96, countries under $1,000 per capita 3. COSTS AND PRODUCTIVITY: EVIDENCE FROM ICA SURVEYS

12
3.1 The Countries and the Surveys.
This section uses data gathered by the World Bank’s Investment Climate (IC) firm surveys over
the period 2000-2004 to shed light on firm-level patterns.6 Cross-sectional IC data covers
sixteen countries: Eritrea, Ethiopia, Kenya, Mozambique, Nigeria, Senegal, Tanzania, Uganda
and Zambia (Sub-Saharan Africa); India and Bangladesh (South Asia); China (East Asia);
Bolivia and Nicaragua (Latin America); Algeria and Morocco (North Africa). Core productivity
data is available for more than 7,000 firms in 8 industry categories (textiles, garments and
leather; food and beverage processing; metals and machinery; wood and furniture; paper,
printing and publishing; plastics; chemicals and paints; other). Of these, around 2,700 are in
Africa, and 1,800 in Sub-Saharan Africa (see Table 3). There is a fair spread across firm size
groups, though in the African and Latin American cases, more firms are micro, small and
medium enterprises relative to samples in Bangladesh and China.
One question of potential concern is the possibility of systematic bias in the response rates to
questions on sales and costs needed to estimate production functions. Response rates do differ
across countries, but within countries they are remarkably uniform across categories of firms –
domestic-foreign, by ethnic status, by exporter/non-exporter – that are known to correlate
strongly with productivity. While selection bias is always a concern in any survey, we think it
unlikely to pose a major problem for the broad pattern of results. Some African surveys have few
firms in some size categories however, and this cautions against using very fine disaggregation.7
Table 3. Number of firms with productivity data, by size-class (employees) Table 4. Selected Economic Indicators
6 For more information, visit www.worldbank.org/privatesector/ic or www.worldbank.org/rped 7 In particular social and political environments, particular kinds of firms which tend to be more productive and which have greater reason to fear expropriation (foreign firms, ethnic minority firms) might be less likely to provide data on sales and costs, thus artificially reducing the average measured productivity in countries where this is more of a problem. However, response rates do not indicate any such pattern; see Appendix Table X. The only strong pattern in response rates is that micro firms (with less than ten employees) tend to respond less often, which suggests that response rates to detailed sales and costs questions may have more to do with accounting and capacity. Fieldwork experience does suggest that minority forms, in particular, are likely to understate sales. If true, this will tend to accentuate the ethnic productivity gaps shown by the data.
13
Table 4 presents an overview of the economies considered in this analysis. The African countries
are small and cluster towards the poorer end, along with India and Bangladesh, and tend to be
more agrarian. Investment rates also tend to be lower, though Mozambique and Eritrea have
recently benefited from a number of large investments. Manufacturing sectors in the African
countries tend to be modest with very low exports--the manufacturing share of merchandise
exports is 88% in China, 92% in Bangladesh, 77% in India and 64% in Morocco relative to the
average of 15% for the African countries.
However, there are important differences between the African countries themselves. The surveys
in Ethiopia and Eritrea took place in the aftermath of a damaging conflict; this particularly
affected Eritrea’s economy which was still operating on somewhat of a wartime footing with
conscription creating severe labor shortages. By closing off access to Eritrean ports, the conflict
also exacerbated the longstanding isolation of Ethiopia’s economy: relative to other African
countries, state control of private activity was pervasive, with low levels of FDI, a high
prevalence of “party-statal” firms, and a degree of tension between the government and the
traditionally Amharic investment community. Nigeria also has been subject to considerable
instability, and its oil-dominated economy has suffered from extremely poor governance and has
not yet seen a major period of opening. These three economies are distinctive enough that we
would be surprised to find “normal” results. Senegal, Kenya, Uganda, Tanzania, Mozambique
and Zambia share a recent legacy of wide-ranging policies to open their economies to trade and
foreign investment. But of these, only Senegal and Kenya had avoided severe disruption to their
established business community since independence, whether through revolutions and civil
conflict (Uganda, Mozambique) or phases of socialist development and widespread
nationalization (Tanzania, Zambia, Mozambique). In this group, Senegal, Tanzania, Uganda and
Mozambique would be considered as the best-managed,8 with Kenya suffering from an extended
period of bad governance and public sector management and Zambia having experienced an
extended period of inconsistent reforms, macroeconomic instability, and a series of controversial
8 Senegal, Uganda and Tanzania are rated in the top tercile in Africa by the World Bank’s CPIA assessments. Mozambique is also well-rated, but weaker in some areas, notably the financial sector.
14
privatizations that had strained relations between the government, donors, and a business sector
traditionally heavily dependent on mining-related activities.9
These differences between countries and in the strength of their business communities provide a
useful check on the patterns from the surveys. Indeed, Ethiopian, Eritrean and Nigerian
manufacturing firms export very infrequently, while those in Senegal, Kenya, and Zambia do
considerably more often (Figure 2). Another feature shown by the surveys is the importance of
the regional market as an export destination for these firms. Despite the low share of regional
trade in Africa’s total trade (11%), regional integration appears to be offer an important market
for manufacturing firms; on average, it accounted for about half of all exports, with Europe the
next largest destination.
Figure 2. Percentage of Firms Exporting at least 20 percent of production
3.2 Productivity Gaps between Africa and its Competitors This section dissects the firm-level data on productivity and costs. It provides some quantifiable
indicators of relative competitiveness, and suggests that hostile, high-cost business environments
may depress competitiveness in Africa through mechanisms that are not commonly studied.
A number of studies (Dollar, Hallward-Driemeier and Mengistae 2003 & 2004, Clarke 2004,
Batsos and Nasir 2004) estimate proxies for factory-floor productivity and then link them to
components of the business environment. These generally show substantial adverse impacts in
African countries, but it can be difficult to isolate the impact of individual investment climate
variables because of multicollinearity and the possibility that others, out of a wide possible
range, have been excluded. Some studies do not appear to control for country fixed effects and
this leaves open the attribution of productivity differentials to any variables that differ between
the countries. Those which do include fixed effects generally find little independent role for most
BE variables, but the implications are not clear because some such variables (like port quality,
for instance) are essentially cross-country in nature. With a widening range of surveys and data,
9 For a comparative review of some of these countries see Devarajan et al, Aid and Reform in Africa.
15
further econometric work is likely to shed more light on the impact of different aspects of the
business climate. However, this paper applies a simpler, direct method to shed light on a
substantial portion of the variance in productivity. We point specifically at indirect costs and
business losses which seem to be strongly tied to the quality of the business environment.
The first challenge is to measure the operational performance of firms in a relevant way. Our
interest in comparative advantage and economic structure suggests a focus on broad notions of
performance. A good starting point is profitability (sales / costs) and return on capital (profits /
capital stock), which measure the viability of firms at the most fundamental level.10 At a glance,
it is quickly evident that firms in most African countries, with the exception of Senegal, report
substantially lower profit margins at the median than in higher-performing comparator countries
like China, India, Nicaragua and Bangladesh (see Table 4). Median profits appear to be modestly
positive in Kenya, Uganda and Eritrea (in line with Bolivia and Morocco), near-zero in Ethiopia,
Tanzania and Mozambique, and modestly negative in Zambia.11 Profit dispersion is still
significant, so there are pockets of profitable firms in most countries, but most African firms
seem to be struggling to compete. These numbers are consistent with data on export performance
in manufacturing (e.g. Figure 3).
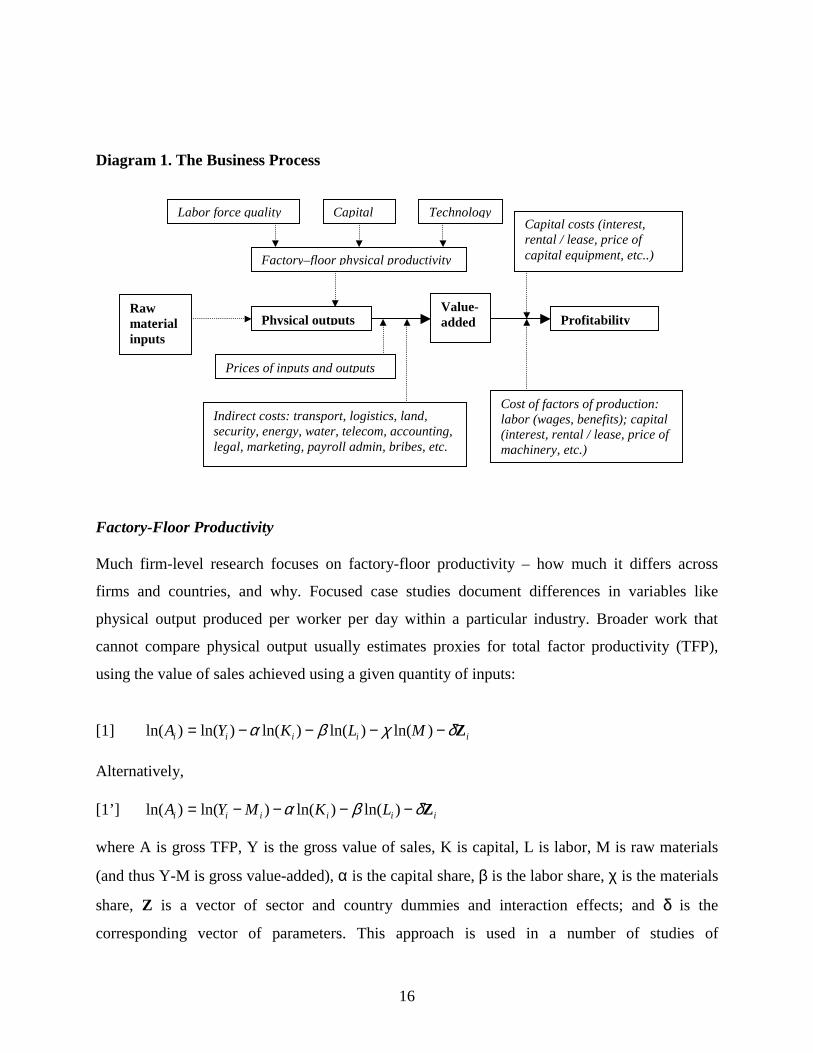
Table 4. Profit margins and return on capital Profitability itself is a product of a chain of factors, including raw materials costs, factory-floor
productivity (i.e. widgets produced per worker-day), factor costs (wages and capital costs),
indirect costs for operations and logistics, and output prices; see Diagram 1. Severe bottlenecks
in any of these areas can thwart competitiveness, despite good performance in other areas. While
much work on competitiveness traditionally focuses on factory-floor productivity and labor
costs, our data suggest that indirect costs are one such bottleneck for many African firms, as well
as (to a lesser extent) additional losses stemming from poor infrastructure, logistics and security.
10 Of course, if output prices differ due to trade barriers and protected markets, import-competing firms may be profitable and internationally uncompetitive at the same time. The fact that African economies are more concentrated and expensive than their comparators emphasizes the significance of the gap in profitability. 11 There is the possibility of under-reporting of profits by African firms. However, it is not immediately evident that firms in our African countries have a greater incentive to under-report profits than, for instance, Chinese firms.
16
Diagram 1. The Business Process Factory-Floor Productivity Much firm-level research focuses on factory-floor productivity – how much it differs across
firms and countries, and why. Focused case studies document differences in variables like
physical output produced per worker per day within a particular industry. Broader work that
cannot compare physical output usually estimates proxies for total factor productivity (TFP),
using the value of sales achieved using a given quantity of inputs:
[1] iiiii MLKYA Zδχβα −−−−= )ln()ln()ln()ln()ln(
Alternatively, [1’] iiiiii LKMYA Zδβα −−−−= )ln()ln()ln()ln( where A is gross TFP, Y is the gross value of sales, K is capital, L is labor, M is raw materials
(and thus Y-M is gross value-added), α is the capital share, β is the labor share, χ is the materials
share, Z is a vector of sector and country dummies and interaction effects; and δ is the
corresponding vector of parameters. This approach is used in a number of studies of
Factory–floor physical productivity
Raw material inputs
Indirect costs: transport, logistics, land, security, energy, water, telecom, accounting, legal, marketing, payroll admin, bribes, etc.
Profitability Physical outputs
Capital Labor force quality
Cost of factors of production: labor (wages, benefits); capital (interest, rental / lease, price of machinery, etc.)
Capital costs (interest, rental / lease, price of capital equipment, etc..)
Prices of inputs and outputs
Value-added
Technology

17
manufacturing in developing countries, including an important recent contribution by Dollar,
Hallward-Driemeier and Mengistae (2003). Gross TFP is important: if a firm can produce more
physical output or value of sales for a given quantity of inputs, and if it can hold down the costs
of its factors of production, its competitiveness clearly improves. As such, factory-floor
productivity, either as gross value-added per worker or gross TFP, is often compared to labor
costs to make statements about relative competitiveness.
From most accounts, factory-floor TFP tends to be lower in African firms than in their
competitors. Skills and human capital shortages (Wood and Mayer, 2001) and technology use
(Basant and Fikkert 1996) play a major role here. In addition, the IC surveys provide a lens into
another set of factors that depress factory-floor productivity. Hostile business environments often
push firms’ revenue below potential due to losses related to infrastructure shortcomings, crime,
and so forth. For example, variants of the following question were widely asked: “What percent
of your annual sales did you lose last year due to power outages or surges from the public grid?
Please include losses due to lost production time from the outage, time needed to reset machines
and production that may be ruined due to processes being interrupted.” Similar questions were
asked about delivery delays, shipment losses, and crime.12 Figure 4 illustrates their relative
magnitude across countries, suggesting that firms in most African countries suffer
disproportionately from these types of losses. These losses push output and sales below their
potential,13 suggesting a useful metric, potential gross TFP:
[2] iiiiiii LKLOMYA Zδβα −−−+−= )ln()ln()ln(*)ln( where LOi is a measure of business-environment related losses. Figure 4. Business environment related losses
12 Because (like all larger-scale studies) TFP is a proxy for factory-floor productivity based on sales revenue, the depressing effect of some types of losses are definitionally considered to impact TFP though they do happen outside of the factory floor. A good example is a sales shipment lost in transit. 13 As such, these losses are perhaps in part related to low average capacity utilization rates in Africa (see below). This is a subject for further study, but preliminary evidence indicates a link between capacity utilization and losses from power outages.

18
However, it is not immediately evident that factory-floor productivity is low enough (relative to
wages) in most African countries to single-handedly explain the continent’s weak manufacturing
competitiveness. In a study of garment industries, Cadot and Nasir (2001) find that the countries
with the lowest factory-floor labor productivity (Mozambique and Ghana) are at roughly half the
level of China, a differential that is more than made up by lower wages (see Table 5). If factory-
floor productivity were the bottom line for competitiveness, garment firms in Madagascar,
Kenya, Ghana, Mozambique and Lesotho would dominate those in Chinese export-processing
zones, with 40-60% of the physical unit labor costs (per men’s casual shirt). These findings
mirror earlier work by Biggs et al (1996) which suggested that African firms are well-placed to
compete on labor costs. Eifert and Ramachandran (2004) note that the African countries with the
lowest median unit labor costs (labor costs / gross value-added) at the firm level are Eritrea and
Nigeria, while Uganda and Mauritius have high unit labor costs, suggesting that this metric may
be of limited usefulness. Evidently, Africa’s shortfall in competitiveness arises in large part from
other parts of the business process.14
Table 5. Factory floor productivity and labor costs Indirect Costs The impacts of poor business environments on firms are often felt through indirect costs. Many
African firms incur heavy costs for transport, logistics, telecom, water, electricity, land and
buildings, marketing, accounting, security, bribes, and so forth. These may be regarded as quasi-
fixed costs reflecting prices and quantities of a range of intermediate business inputs.15 In
developed countries where these costs are low and relatively invariant, research in industrial
organization pays them little attention. But it is crucial to take these costs into account in
developing countries where they are high and variable. Firms which are quite good at producing
physical output at low cost within the factory gates may be unable to survive due to high costs
outside of the productive process.
14 Unsurprisingly, Soderbom and Teal (2003) find that TFP is a strong predictor of African firms’ propensity to invest and export, with causality running in both directions. We find the same strong correlation in our larger dataset. 15 Our survey data allow us to decompose these to some degree – for instance, we know that transport costs are usually a large share (25-30%) – but in general the category is a residual which usually includes various specific lines plus a line described as “other overhead costs”.
19
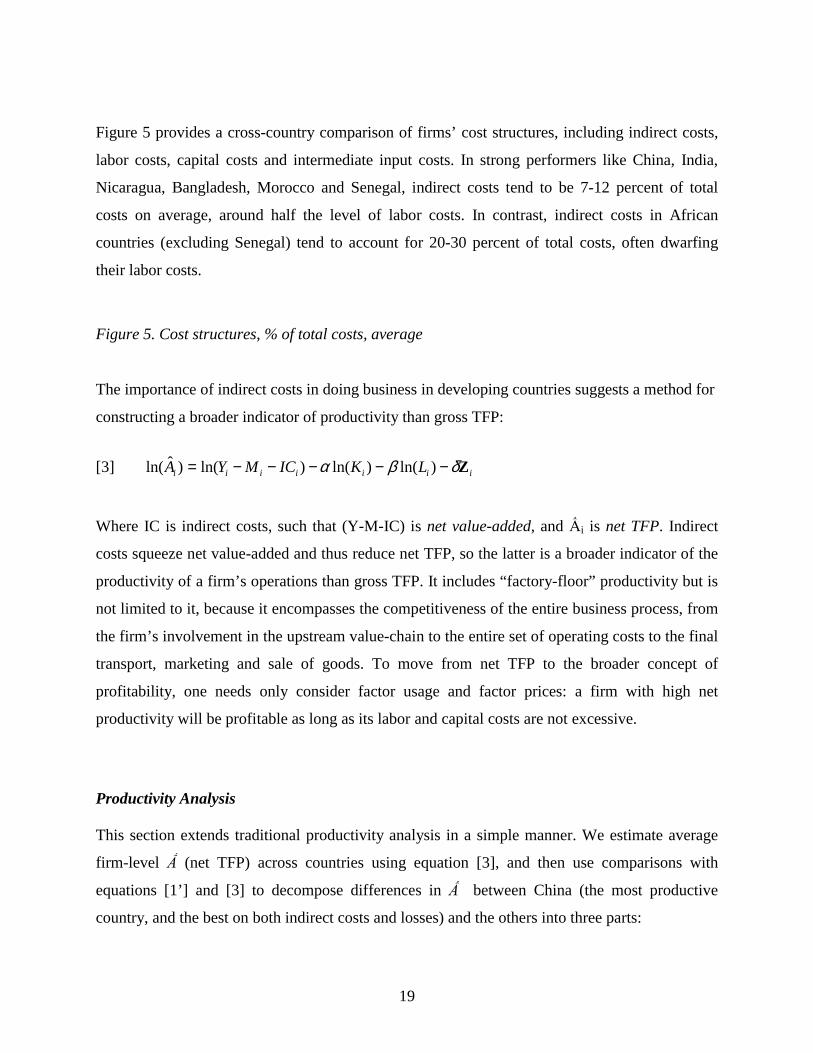
Figure 5 provides a cross-country comparison of firms’ cost structures, including indirect costs,
labor costs, capital costs and intermediate input costs. In strong performers like China, India,
Nicaragua, Bangladesh, Morocco and Senegal, indirect costs tend to be 7-12 percent of total
costs on average, around half the level of labor costs. In contrast, indirect costs in African
countries (excluding Senegal) tend to account for 20-30 percent of total costs, often dwarfing
their labor costs.
Figure 5. Cost structures, % of total costs, average The importance of indirect costs in doing business in developing countries suggests a method for
constructing a broader indicator of productivity than gross TFP:
[3] iiiiiii LKICMYA Zδβα −−−−−= )ln()ln()ln()ˆln(
Where IC is indirect costs, such that (Y-M-IC) is net value-added, and Ấi is net TFP. Indirect
costs squeeze net value-added and thus reduce net TFP, so the latter is a broader indicator of the
productivity of a firm’s operations than gross TFP. It includes “factory-floor” productivity but is
not limited to it, because it encompasses the competitiveness of the entire business process, from
the firm’s involvement in the upstream value-chain to the entire set of operating costs to the final
transport, marketing and sale of goods. To move from net TFP to the broader concept of
profitability, one needs only consider factor usage and factor prices: a firm with high net
productivity will be profitable as long as its labor and capital costs are not excessive.
Productivity Analysis This section extends traditional productivity analysis in a simple manner. We estimate average
firm-level Ấ (net TFP) across countries using equation [3], and then use comparisons with
equations [1’] and [3] to decompose differences in Ấ between China (the most productive
country, and the best on both indirect costs and losses) and the others into three parts:

20
• unexplained differences in factory-floor productivity, potentially attributable to skills,
technology, and so forth (differences in A*);
• differences in factory-floor productivity due to BE-related losses (differences in A less
differences in A*);
• differences in indirect costs (differences in Ấ less differences in A).
First, in a comparative exercise such as this it is crucial to deal with issues of relative prices.
Firms in different countries (or even different sectors or regions within a given country) likely
face different prices for their outputs and their capital and intermediate inputs.16 Productivity will
appear higher where output prices are inflated and will appear lower where capital goods prices
are inflated. The authors are not aware of any effort in the firm-survey literature that attempts to
deal with this problem. To enable some sensitivity analyses of the impact of pricing differences,
we combine our data on aggregate price levels from Section 2 with information on the relative
prices of investment and consumption goods from Sala-i-Martin et al (2003). Capital inputs are
adjusted using investment good prices, and outputs are adjusted using consumption good prices.
Table 6 illustrates this correction process.
Table 6. Price corrections: investment goods (PI) and consumption (PC) goods Table 7 shows simple comparisons of net value-added and capital intensity per worker across
countries in nominal terms; the price-corrected table can be found in the Appendix. Median
value-added per worker in most African countries is low, particularly in the micro, small and
medium enterprises (MSMEs) that dominate the African business landscape. Value-added per
worker tends to climb for larger firms, though in some countries a bell-curve effect is visible,
with the largest firms (often state-owned or monopolistic) being less productive than medium-
sized counterparts. Capital-labor ratios are surprisingly high in Africa, and remain so even
allowing for the higher cost of investment goods. Capital stocks tend to be used inefficiently
16 For instance, firms in concentrated markets may receive oligopoly rents in the form of high output prices, and firms in remote areas with poor transport systems may pay a very high price for capital equipment and thus have fewer machines per dollar than their comparators, but may also be able to sell comparable products at higher prices because transport costs provide a degree of natural protection.
21
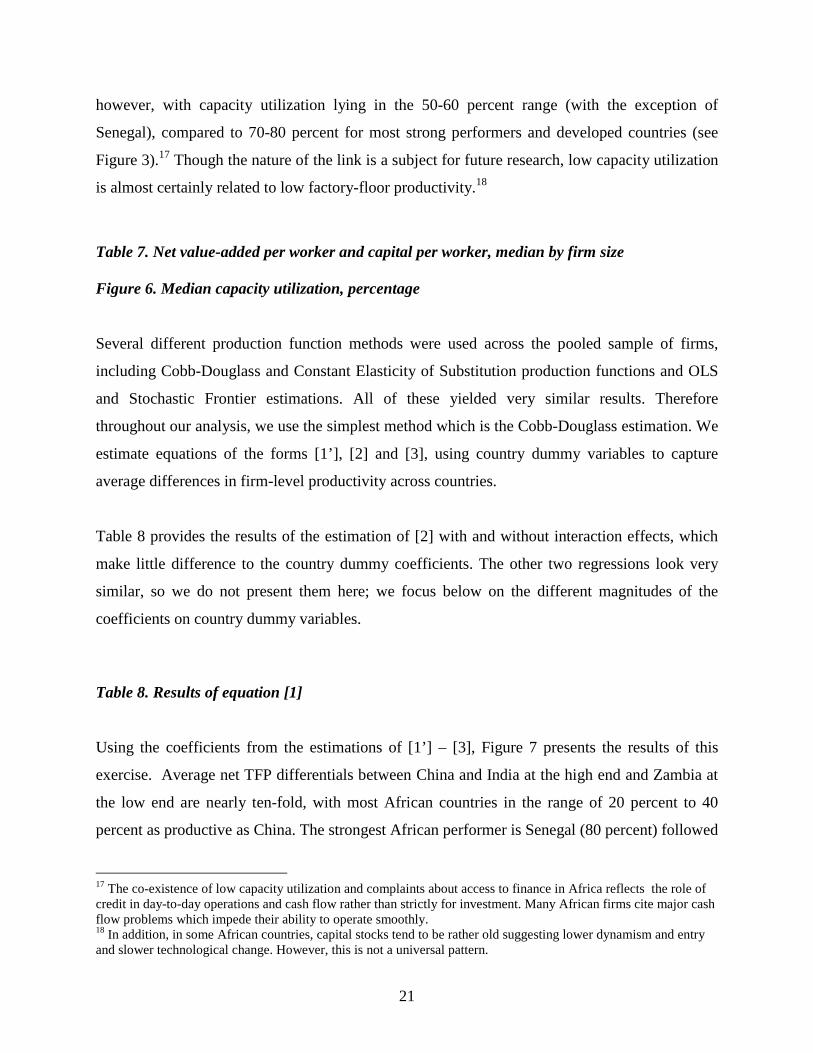
however, with capacity utilization lying in the 50-60 percent range (with the exception of
Senegal), compared to 70-80 percent for most strong performers and developed countries (see
Figure 3).17 Though the nature of the link is a subject for future research, low capacity utilization
is almost certainly related to low factory-floor productivity.18
Table 7. Net value-added per worker and capital per worker, median by firm size Figure 6. Median capacity utilization, percentage Several different production function methods were used across the pooled sample of firms,
including Cobb-Douglass and Constant Elasticity of Substitution production functions and OLS
and Stochastic Frontier estimations. All of these yielded very similar results. Therefore
throughout our analysis, we use the simplest method which is the Cobb-Douglass estimation. We
estimate equations of the forms [1’], [2] and [3], using country dummy variables to capture
average differences in firm-level productivity across countries.
Table 8 provides the results of the estimation of [2] with and without interaction effects, which
make little difference to the country dummy coefficients. The other two regressions look very
similar, so we do not present them here; we focus below on the different magnitudes of the
coefficients on country dummy variables.
Table 8. Results of equation [1] Using the coefficients from the estimations of [1’] – [3], Figure 7 presents the results of this
exercise. Average net TFP differentials between China and India at the high end and Zambia at
the low end are nearly ten-fold, with most African countries in the range of 20 percent to 40
percent as productive as China. The strongest African performer is Senegal (80 percent) followed
17 The co-existence of low capacity utilization and complaints about access to finance in Africa reflects the role of credit in day-to-day operations and cash flow rather than strictly for investment. Many African firms cite major cash flow problems which impede their ability to operate smoothly. 18 In addition, in some African countries, capital stocks tend to be rather old suggesting lower dynamism and entry and slower technological change. However, this is not a universal pattern.

22
by Kenya and Tanzania (45 percent). For a more comprehensive picture, Table 9 shows the
frequency distribution of firms across five categories of productivity. Firms in African countries
are usually clustered in the very low, low and moderate productivity categories (with the
exception of Senegal). To compare the effect of the price corrections, Annex Figure 1.1 shows
TFP estimates using unadjusted prices; the pattern is similar, but countries with high price levels
(especially Zambia, Senegal, Tanzania) appear somewhat stronger.
Figure 7. Decomposition of Net TFP The decomposition of the gaps in net TFP is particularly revealing.19 Gaps in actual factory-
floor productivity are represented by the sum of the light blue and yellow bars. Firms in most
African countries have significantly lower gross TFP than their counterparts in high-performing
economies, but the gaps are generally in the range of 2.5:1 or less, findings that are consistent
with previous research. If one considers the ‘underlying’ TFP gaps represented by the blue bars
alone – reflecting skills, technology, branding, etc. – most African countries do substantially
better, because firms’ TFP relative to China is depressed by excess losses from electricity
fluctuations, supplier delays, and so forth. The African countries with the best gross TFP are
Kenya and Senegal, though Kenyan firms suffer heavily from losses (particularly power- and
crime-related); a finding that corresponds with intuition. The poorest are Ethiopia, Nigeria,
Zambia and Mozambique within Africa, and Bolivia outside of Africa.
Though gaps in factory-floor productivity are significant, the further effect of firms being
squeezed heavily by indirect costs is enormous: a further twofold expansion of the productivity
gap in the case of Mozambique, and threefold in the case of Zambia. The mid-range African
countries which were in the range of 60-80% of the gross TFP of China fall to 40-60% of the net
TFP. Only in Senegal are indirect costs modest enough that the effect is mild.
19 To compare the effect of the price corrections, Annex Figure 1.1 shows TFP estimates using unadjusted prices; the pattern is similar, but countries with high price levels (especially Zambia, Senegal, Tanzania) appear somewhat stronger.

23
These numbers tell a powerful story. Zambia and Mozambique provide examples of countries
where firms find their value-added squeezed so badly that relief from excessive costs would have
an enormous effect. Kenya’s strong potential gross TFP but much weaker net TFP shows what
the combination of a strong business community plus low indirect costs and losses could do for
competitiveness. Senegal’s strong performance on gross TFP as well as net TFP indicates that its
business environment provides a relatively hospitable environment where firms can do well.
Soderbom and Teal (2003) find a relationship between firm-level productivity (net TFP) and
propensity to export, controlling for country fixed effects. Their estimates suggest that African
firms which are productive enough are often able to export; the problem is that most are not
productive enough to do so, as Table 9’s frequency distribution of net TFP illustrates.20
Table 9. Frequency distribution of productivity (percentage of firms in each quintile) We now turn to possible explanations for the numbers described above, which in turn may help
us design policy solutions to address the problems described above.
4 REFORMING THE BUSINESS CLIMATE: A POLITICAL ECONOMY PERSPECTIVE
“Why should we open our economy all for the benefit of South African and Asian business?”
Comment to World Bank during the discussion of an ICA in Africa. The third theory of comparative advantage discussed above stresses the value of having dense
networks of firms operating in a competitive environment and able to generate “thick markets”
and learning externalities. This highlights the importance of entry for Africa’s extremely sparse
economies (Wood 2002). The ICAs indicate a long list of entry barriers; many governments in
Africa are now more aware of these constraints and are taking action to improve the business
climate. But overall, progress has lagged other developing regions. Recently, the World Bank’s
vice president for Africa remarked in a speech in Nairobi that despite a vast amount of analytical
20 Our preliminary analysis shows that the relationship appears to be quadratic, with the propensity to export rising rapidly at first with productivity and then slowly leveling off.

24
work on the private sector, no real dialogue has emerged between the private sector and the
government. Why is change not faster?
Money is part of the problem – easing the severe infrastructure constraints identified in the
surveys requires major investments. But many other aspects of the business climate involve
improving the delivery of business services and reflect the need to consider the political
economy that underlies state performance and capacity. We argue that reforms will need to
confront the presence of long-established rent-seeking arrangements that benefit both the
political and private sector elites. These arrangements are remarkably stable, reflecting the
coexistence of strong presidential systems of governance, weak administrative and technical
capacity, non-credible donor conditionality, and small domestic private sectors dominated by a
few large and highly profitable firms, often foreign or minority-owned. The investment climate
data reinforce the findings of the political economy literature which must be considered in
designing economic reforms.
4.1 Is the African Private Sector in a Low-Level Political Equilibrium? Political analyses of Africa, both old and new, shed light on the twin problems of slow growth
and partially successful reforms. In his analysis of the political economy of the African private
sector, Tangri argues that the minority Asian community in East Africa, which has thrived even
in difficult times, often coexists with a small, wealthy, Black private sector. The latter is often
closely aligned with the president or his associates. The success of this group is more defined by
political connections and rent-sharing, than by entrepreneurial talent (Tangri, 1999). A recent,
comprehensive analysis of African economies reinforces this perspective (van de Walle, 2003).
Van de Walle argues that the political elite in Africa have learned to adapt to the currency of
reform, while finding ways to preserve rent-seeking arrangements (p.170):
“Leaders’ notion of the political viability of reform has changed over time. Their initial
reaction was almost entirely negative because they viewed rapid reform as incompatible
with the methods of rule they had fashioned over several decades of rule. Over time, this
has changed: from the view that reform was not viable, leaders have understood that they
had no choice but to adapt their methods of rule to the evolving environment……over
25
time and through experimentation, they found that their hold on power could withstand
the partial implementation of adjustment programs. It remains true that political elites
do not believe they can survive without recourse to a policy regime of systematic
interference, but they have learned to adapt this interference…”
Thus, as donor-driven reforms have been introduced the government has simply changed its
methods of rent-seeking. This has translated into a series of partial reforms without much
change in the ability of the private sector to do business, leading to what is termed a “permanent
crisis” in Africa. For the private sector, it has meant keeping up with ever-changing forms of
government interference, as the sources of rents and the modalities of rent-seeking have shifted
with reform efforts.
According to Van de Walle, in contrast to Asia and Latin America, there has been little policy
learning in Africa. Technocrats within the government have often been hostile to reforms
because their involvement and inputs are limited relative to foreign experts. Moreover, partial
reforms have been largely successful at keeping donors satisfied, often leading to repeated
rounds of financing to address the same issues, and ultimately resulting in toothless
conditionality, the preservation of rent-seeking arrangements and little real reform despite
apparent progress at the macro level.21 All of this has served to reinforce the lack of momentum
on private sector development.
While ICAs are mostly technical, some recent studies have begun to focus on the political
feasibility of business climate reform. Reducing administrative barriers in Africa is enormously
difficult, not because of technical feasibility but because state apparatus have long been used as
patronage vehicles (Emery, 2003; World Bank, 1995). Privatization programs have not been
entirely successful at eliminating rent-seeking parastatals, and the privatization process itself has
offered various opportunities for rent-seeking and patronage. In a detailed analysis of the
administrative requirements for setting up a business in Africa, Emery notes how “overall
complexity places a premium on means of circumventing, or speeding up the process, which 21 Trade reforms in Africa, for example, been driven by adjustment programs negotiated with the Bretton Woods Institutions rather than a reciprocal process of negotiation with other countries to open market access. It is therefore less surprising to see the persistence of widespread impediments to exporting firms despite declines in levels of protection. (Can Africa Claim the 21st Century? Chapter 7).

26
creates a flourishing environment for corruption.” Most, if not all, businesses are operating
outside the law in at least one or more aspects, and are vulnerable to government inspectors, no
matter how minor the deviance. The survival of a business is consequently heavily dependent on
a personal relationship with a minister or other high government official, which is often difficult
to document or quantify. These relationships are crucial to firms which need to anticipate ad hoc
policy or regulatory changes – a major concern of business as shown in the ICA surveys. Emery
concludes that “this vulnerability, combined with the arbitrary nature of enforcement arising
from poor governance means that firms can be closed down or worse for operating in exactly the
same way as their neighbors, their competitors, or their clients and suppliers (Emery, 2003).”
Failure to broaden the base of the business community increases the public’s skepticism of the
private sector, and particularly of foreign-owned firms, in sub-Saharan Africa. While the World
Bank and other donors focus their dialogue on technical solutions to private sector development
such as better roads, more power generation and reduction of the regulatory burden, dialogues in
the domestic press in Africa have focused largely on the proposition that the persistence of a
private sector elite (whether foreign, ethnic minority, or Black) has prevented economic
empowerment of the majority of Black Africans.
This configuration of interests increases the likelihood of countries falling into a low-level
equilibrium. With a dominant part of the business sector identified as not indigenous, and
shielded from “outside” entry by the adverse business environment, the fractured business
community has less ability, and perhaps less incentive, to act as a powerful pressure group in
favor of business climate reform. The difficulty of shifting out of such an equilibrium is
mirrored in African attitudes towards the private sector. While support for market-based
approach to growth and development may be growing, it is still far from widespread, as
measured by public attitude surveysi. The Afro-Barometer surveys are particularly useful
(Bratton et al, 2004) in that they reveal widely differing and contradictory views of the private
sector as provided by respondents in 15 African countries (Botswana, Cape Verde, Ghana,
Kenya, Lesotho, Malawi, Mali, Mozambique, Namibia, Nigeria, Senegal, South Africa,
Tanzania, Uganda and Zambia) . Only in 6 out of 15 countries did a majority of respondents feel
that a free market economy was preferable to an economy run by the government. The

27
percentage of respondents indicating this preference averaged to about 54 percent; Uganda was
the highest at 57 percent. Only 24 percent of respondents in Botswana expressed a preference
for a free market over a government-run economy; that number is 26 percent for Lesotho, 39
percent for Namibia and 37 percent for South Africa. In most countries, well over 50 percent of
respondents supported the government being in charge of planning production and distribution of
all goods and services.
A majority of respondents in most countries surveyed indicated that the government should bear
the main responsibility for ensuring the well-being of people: in Ghana, for example, 66 percent
of respondents believed that “the government should retain ownership of its factories, businesses
and farms.” Despite the recognition that corruption was widespread, over 72 percent of
respondents agreed that “all civil servants should keep their jobs, even if paying their salaries is
costly to the country.” Finally, 58 percent of all respondents indicated that the government
should be primarily responsible for job creation in the economy. Most reform programs are
greeted with lukewarm support or opposition—62 percent of respondents supported user fees, 54
percent supported market pricing, but only 35 percent support privatization and 32 percent
supported civil service reform across the countries surveyed. The results appear to indicate that
most Africans do not believe that the private sector will deliver broad-based growth; this belief is
consistent with the discussions in the press of elite capture of the private sector.
4.2 Beneath Aggregate Gaps: Size, Ethnicity, and Foreign Ownership in Africa While firm-level productivity and propensity to export is considerably lower in most African
economies than in other parts of the world, African economies are often segmented, with small
clusters of large, foreign and/or ethnic minority-owned firms which are quite different in
character from their indigenous counterparts.22 The performance of this small cluster appears to
be much better; they tend to be considerably more productive and to be much more likely to
export. They also seem to have more market power, and a sustained presence in Africa despite
economic and political uncertainties. Our data, and the existing literature (Tangri, 1999; van de
22 In some countries, ethnic fragmentation between indigenous groups is also an issue: for Ethiopia, see Mengistae (2001).
28
Walle, 2001), suggest that this group relies on trust between its members and on alliances with
the political elite to generate rents on a continuing basis.
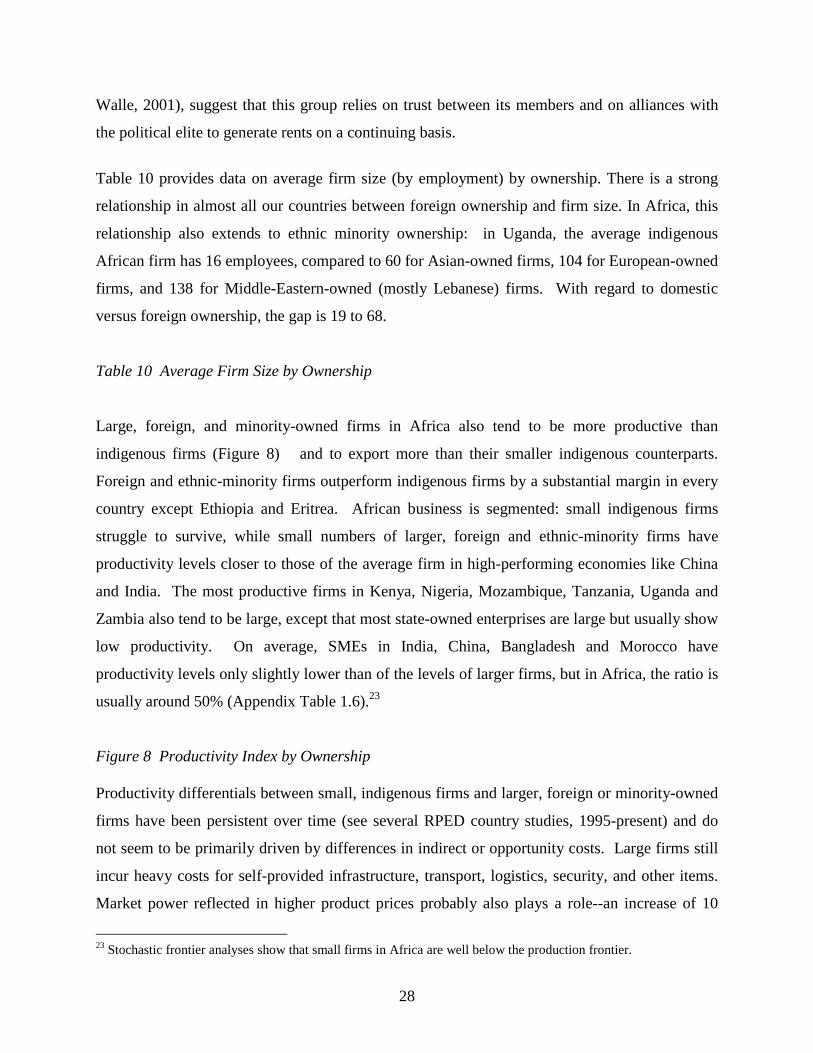
Table 10 provides data on average firm size (by employment) by ownership. There is a strong
relationship in almost all our countries between foreign ownership and firm size. In Africa, this
relationship also extends to ethnic minority ownership: in Uganda, the average indigenous
African firm has 16 employees, compared to 60 for Asian-owned firms, 104 for European-owned
firms, and 138 for Middle-Eastern-owned (mostly Lebanese) firms. With regard to domestic
versus foreign ownership, the gap is 19 to 68.
Table 10 Average Firm Size by Ownership
Large, foreign, and minority-owned firms in Africa also tend to be more productive than
indigenous firms (Figure 8) and to export more than their smaller indigenous counterparts.
Foreign and ethnic-minority firms outperform indigenous firms by a substantial margin in every
country except Ethiopia and Eritrea. African business is segmented: small indigenous firms
struggle to survive, while small numbers of larger, foreign and ethnic-minority firms have
productivity levels closer to those of the average firm in high-performing economies like China
and India. The most productive firms in Kenya, Nigeria, Mozambique, Tanzania, Uganda and
Zambia also tend to be large, except that most state-owned enterprises are large but usually show
low productivity. On average, SMEs in India, China, Bangladesh and Morocco have
productivity levels only slightly lower than of the levels of larger firms, but in Africa, the ratio is
usually around 50% (Appendix Table 1.6).23
Figure 8 Productivity Index by Ownership Productivity differentials between small, indigenous firms and larger, foreign or minority-owned
firms have been persistent over time (see several RPED country studies, 1995-present) and do
not seem to be primarily driven by differences in indirect or opportunity costs. Large firms still
incur heavy costs for self-provided infrastructure, transport, logistics, security, and other items.
Market power reflected in higher product prices probably also plays a role--an increase of 10
23 Stochastic frontier analyses show that small firms in Africa are well below the production frontier.

29
percent in market share is associated with a 4.5% – 7.5% increase in measured productivity,
controlling for country fixed effects. While large foreign firms are more likely to be exporters,
many also sell to the domestic market. It is interesting to note that while foreign firms in Asia
tend to control a smaller share of their market, in Africa’s small economies they tend to control a
greater share; typically around a third (see Table 11). Nigeria, the country with the lowest
competition, is also perhaps the country with the least support for liberalization from the
business community.
Table 11 Median of Firm’s Self-reported Market Share, by Ownership Various investment climate indicators suggest that, while large firms may face many of the same
constraints as small firms, they are able to adapt to this climate in different ways. The best
example is generator ownership: most large firms in Africa own a generator – except in Senegal
where the power system works relatively well, and firms are notified well in advance of rolling
blackouts – but not so for small firms (Table 12).
Finance is another service segmenting the private sector, as shown in Table 13. The share of
large firms with access to a loan is much higher than that of small firms in many countries in
Africa. Productivity differentials are in part related to access to finance; controlling for country
fixed effects, firms which have a loan or overdraft account are around 6 percent more productive.
Finally, Table 14 shows the amount of time that firms are in contact with the government. It is
clear that large firms bear a substantially greater burden of dealing with regulations and
regulators. But these data may also shed light on how rents and favors are shared between
business and government. The persistence of profitability of a limited number of large, foreign-
owned and/or ethnic minority firms is consistent with larger amounts of time spent appeasing the
government, as seen in our data.
Table 12 Share of Firms owning a Generator by Size Table 13 Share of Firms with Access to Loans by size Table 14 Median Inspection Days and Time Spent dealing with Regulations by Size
30
Networks, usually of ethnic minorities, help firms to overcome the limitations of financial
markets by increasing access to trade credit (Fafchamps, 2004; Biggs and Shah, 2004). These
networks are based on trust between members of a relatively small group. Such ethnic networks
operate in many other regions including fast-growing Asia and have similarly positive effects in
enabling their members to compensate for dysfunctional market institutions. But their overall
impact is likely to be different in economically dense and sparse regions. In the former, their
adverse effect in stifling competition is likely to be small because of the competitive pressure of
many firms belonging to many networks; in Africa’s very small economies, the adverse effect is
likely to be far larger. Firms in sparse Africa are therefore likely to weigh more heavily the
costs and risks of business environment reforms in encouraging entry than firms in dense
economies, particularly in Asia.
5 CONCLUSION The macroeconomic and microeconomic evidence described in this paper identify the key factors
which influence the ability to diversify the economy away from primary products. Macro data
based on PPP conversion factors confirm that Africa is a relatively high cost region, with price
levels some 30% above levels that would be predicted on the basis of income per head. In
contrast, developing countries that have successfully emerged as manufactured exporters and
developed a critical mass of firms able to provide a wide range of goods based on cheap local
labor and inputs, show low cost levels, some 20% below those predicted by income level.
The Investment Climate Surveys carried out over 2000-2004 provide a micro-level look at these
issues. We define a relatively broad concept of net TFP, demonstrate that it varies much more
across countries than gross TFP or factory-floor productivity alone, and then decompose
differences in net TFP into 1) unexplained differences in gross TFP; 2) differences in gross TFP
explained by business losses from power outages, logistical failures and crime; and 3)
differences in indirect costs. We thus advance the discussion of performance from its traditional
focus on labor costs and the skills and the technical capacity of firms, finding that the hostile
business environments facing many African firms are reflected in disproportionately high
indirect costs and losses which squeeze value-added. In many African countries the problem is
31
not so much that labor is high-cost relative to factory-floor productivity; it is rather that a weak
business climate lowers the return to labor in production and thus depresses labor demand and
real wages.
The story varies considerably across and within countries. Zambian and Mozambican firms have
relatively weak factory-floor productivity to begin with, and their value-added is heavily
squeezed by high costs. This is also true, if to a somewhat lesser extent, in Nigeria and Ethiopia.
Uganda and Tanzania appear to be middle-of-the-road performers, in addition to Eritrea, though
the data on the latter are probably heavily influenced by state favoritism and anticompetitive
rents. In Kenya, a long history of entrepreneurship is reflected in strong potential factory-floor
productivity, but high costs and losses impede competitiveness. Senegal provides an example of
what an African country can achieve with a strong business community and a relatively good
business environment.
Within African countries, business sectors appear to be strongly segmented on the basis of
ownership and firm size. Large foreign and minority firms typically have much stronger factory-
floor productivity than their smaller indigenous counterparts, though they still face high costs.
However, while these firms are more likely to export, they also sell domestically, tend to have
significant market power, and often do not exhibit a drive to expand, suggesting that in part their
high value-added reflects noncompetitive rents.
This story of high costs and market segmentation so far lends itself to standard technical
recommendations. While unfavorable geography is a problem in some countries, there is much
African governments could do to mitigate the effects of geography and to reduce costs across
their economies. High-yielding business climate reforms typically include improving roads and
transport systems, building low-cost and predictable electricity systems, improving public
protection and police forces, reducing corruption, facilitating trade and regional integration,
increasing entry and competition into markets, and so forth.
However, business environments usually improve only slowly, and in Africa, these reforms
seem to have occurred even more slowly than elsewhere. A search of World Bank documents
32
revealed that the Bank argued no less than 14 times between 1990 and the present that Africa
was about to turn the corner in terms of policy reform (Easterly, 2003). Donors have contributed
billions of dollars to road construction across Africa, but the overall quality of road networks has
improved little due to poor maintenance. Easterly, 2003, observes that the World Bank has made
several loans to Kenya for road improvements with little to show for it.
Analysts have increasingly pointed to political economy factors in obstructing change. Poor
business environments increase costs, but also generate entry barriers that provide larger firms
with anticompetitive rents. The large firms which might potentially push for reform are faced
with a choice between a hostile business environment which they have learned to negotiate and
an unknown situation with potentially large increases in entry and competition. The risk is that
Africa will remain locked into a slowly evolving low-level equilibrium, characterized by rent-
seeking behavior on the part of the public sector and quiet acquiescence on the part of the private
sector. The likelihood that this equilibrium is sustained is buttressed by the ambivalent attitudes
towards the business sector expressed in AfroBarometer surveys. The fact that in most countries
the business sector is heavily segmented, with expatriate and minority firms occupying the upper
echelons in terms of productivity and capacity to export, does nothing to make this situation less
complex. In the low-level equilibrium, measures to open Africa’s economies by reducing levels
of protection will have a limited effect because of the failure to focus on business services and
the institutional ingredients of competitiveness.
How can the momentum of reform be accelerated? Benchmarking performance in the various
areas highlighted by ICAs will facilitate more constructive dialog on business-climate variables
in discussions between governments, firms and donors. However, in thinking about moving
forward on the BE agenda, solutions need to be framed by political economy considerations, if
donors are not to end up making the same loan over and over again, as in the agricultural sector
in Kenya over the 1990s (Dollar and Easterly 1999).
Accelerating reform requires the difficult task of breaking up alliances between the private sector
elite and the political elite. One possibility is gradual or segmented reform whereby rents in
established areas are slowly eroded over time, while new opportunities are created for the private

33
sector. This can help to convince the private sector elite that the profits in a relatively open
economy may well be greater than current levels, particularly if costs can be significantly
reduced at the same time. Policies that encourage the arrival of new entrants into the private
sector are also very useful. Several policy suggestions emerge:
(a) Enclave Growth: EPZs and Clusters. Even if political resistance and weak capacity stalls
sweeping country-wide reforms, it may be feasible to radically improve business environments
in limited, high-profile areas such as export processing zones. Within EPZs, service delivery
standards can be benchmarked and regularly evaluated with the assistance of donors. EPZs also
help address the problem of dispersed spatial distribution and low firm density in Africa; they
can reduce infrastructure costs and encourage technology diffusion and knowledge spillovers.
They may also serve to attract new entrants.
(b) Level the Playing Field. Building strong domestic political support for private sector
development will require improving the performance and capacity of indigenous firms, removing
the perception that BE reforms primarily benefit foreigners or minorities. Programs to mitigate
political risk, for example, are currently only available to foreign investors; they should be
extended to domestic investors on similar terms. Tax incentives should be extended to small
businesses as well as large ones. Capacity-building is needed for the private sector as well as the
public sector; for example, outside of South Africa, Sub-Saharan Africa has not a single
accredited business school.
(c) Use Gains to Build Constituencies for Reform. Success in even a single enclave sector can
generate demonstration effects across an economy, weakening the perception among large firms
and governments that a low-level equilibrium characterized by high costs and low competition is
preferable. Press accounts of the Indian experience suggest that the enormous success of the
high-technology sector in the early 1990s (accomplished largely without government assistance)
set the standard for the rest of India’s private sector; both firms and the government wanted to
share the limelight and started to move away from the old model of the “license raj.” In Africa,
examples such as Kenya’s agribusiness sector (which links large firms, small firms and farms)
and the EPZs of Mauritius and Madagascar, offer potential examples, which should become far

34
better known. In China, successful local development rebounded directly to the advantage of
local officials, setting up strong competition between local governments to attract investments
(Byrd and Gelb 1988). Africa might consider how such incentives can be structured to boost,
rather than retard, productivity. For example, top customs officials might receive incentive
payments based on both revenue and clearance time standards, along the lines of Tanzania’s
SASE program (Levy and Kpundeh 2004).
(d) Enhance the Credibility of Reforms and Donor Support through New Instruments. Donor-
funded programs could be developed to enable firms to purchase insurance against shortfalls in
service delivery from standards agreed as part of reform programs – for example, customs
clearance times, or VAT rebates for exporters, initially within EPZs. This would both provide
impetus for accurate measurement of performance (and targets to focus capacity-building efforts)
and ensure that lapses in performance were speedily raised to a high policy level. Once
confirmed, these service standards and the insurance programs could be rolled our more broadly
across the economy.
(e) Capitalize on the Concern over Donor Dependence. Increasing donor dependence is
inevitable for African countries if they are to embark on a determined push towards achieving
the MDGs. Yet countries such as Uganda and Mozambique, with 50% of their budgets
dependent on donors, perceive the political implications of this and aim to reduce donor
dependence from present levels. In a recent speech, the president of Uganda urged his
countrymen to become less dependent on foreign aid. Tanzania, which hosts 1000 donor
meetings every year and prepares 2500 donor reports every quarter, may also feel the need to
reduce donor dependence (Birdsall 2004). More explicit political linkage between private sector
development and a reduction in donor dependence may serve to hasten the implementation of
reform.

35
Table 1. Ratio of exchange rate to PPP conversion factor, by region, 1993-96
LAC EAP SSA OECD South
Am. Central
Am. Carib-bean
MENA ECA All China
SAR All Poor*
Costs 1.19 0.64 0.46 0.55 0.42 0.42 0.29 0.23 0.22 0.37 0.31 Ratio of costs to predicted costs
1.07 1.16 0.93 1.07 0.93 0.90 0.91 0.80 0.87 1.07 1.28
Income per capita (market prices)
26,500 4,000 2,850 3,200 2,200 2,450 750 550 375 550 300
*less South Africa, Namibia, Botswana, Mauritius & Cape Verde, middle-income well-managed countries. ** Note: a value of 1 implies that a group lies right on the Balassa trend-line from Figure 1. Figure 1. Cost levels versus log income, regional aggregates
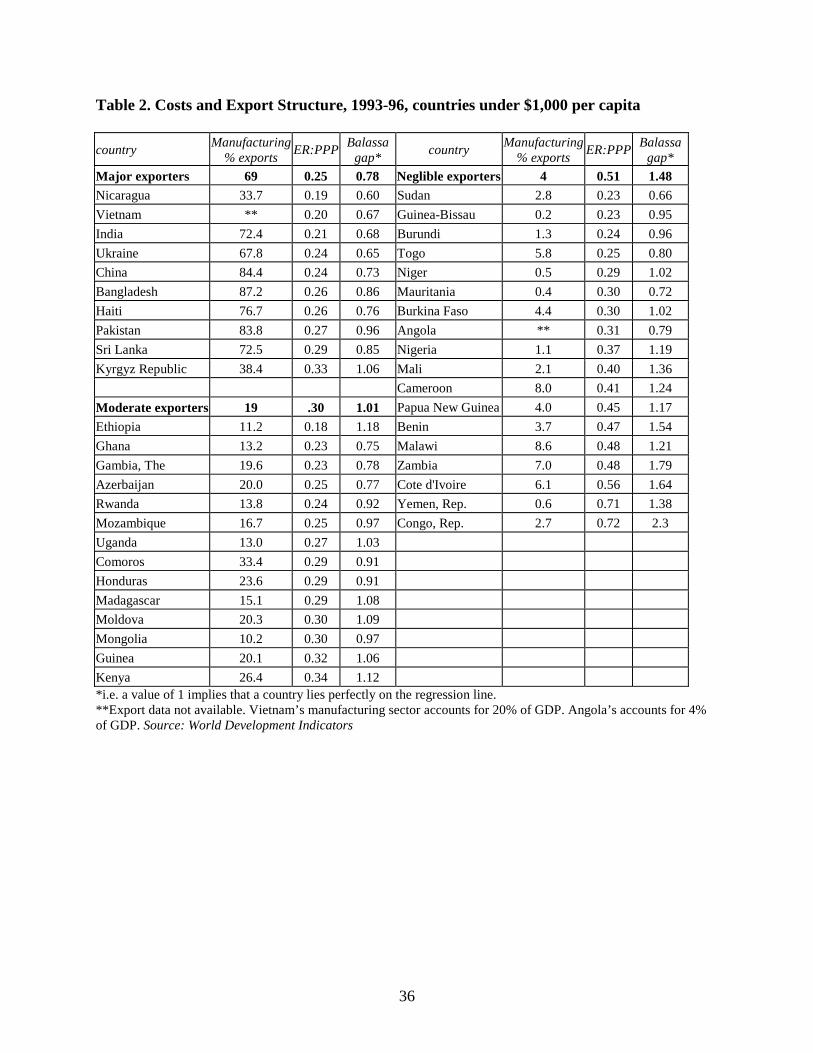
36
Table 2. Costs and Export Structure, 1993-96, countries under $1,000 per capita
country Manufacturing
% exports ER:PPP
Balassa gap*
country Manufacturing
% exports ER:PPP
Balassa gap*
Major exporters 69 0.25 0.78 Neglible exporters 4 0.51 1.48 Nicaragua 33.7 0.19 0.60 Sudan 2.8 0.23 0.66
Vietnam ** 0.20 0.67 Guinea-Bissau 0.2 0.23 0.95
India 72.4 0.21 0.68 Burundi 1.3 0.24 0.96
Ukraine 67.8 0.24 0.65 Togo 5.8 0.25 0.80
China 84.4 0.24 0.73 Niger 0.5 0.29 1.02
Bangladesh 87.2 0.26 0.86 Mauritania 0.4 0.30 0.72
Haiti 76.7 0.26 0.76 Burkina Faso 4.4 0.30 1.02
Pakistan 83.8 0.27 0.96 Angola ** 0.31 0.79
Sri Lanka 72.5 0.29 0.85 Nigeria 1.1 0.37 1.19
Kyrgyz Republic 38.4 0.33 1.06 Mali 2.1 0.40 1.36
Cameroon 8.0 0.41 1.24
Moderate exporters 19 .30 1.01 Papua New Guinea 4.0 0.45 1.17
Ethiopia 11.2 0.18 1.18 Benin 3.7 0.47 1.54
Ghana 13.2 0.23 0.75 Malawi 8.6 0.48 1.21
Gambia, The 19.6 0.23 0.78 Zambia 7.0 0.48 1.79
Azerbaijan 20.0 0.25 0.77 Cote d'Ivoire 6.1 0.56 1.64
Rwanda 13.8 0.24 0.92 Yemen, Rep. 0.6 0.71 1.38
Mozambique 16.7 0.25 0.97 Congo, Rep. 2.7 0.72 2.3
Uganda 13.0 0.27 1.03
Comoros 33.4 0.29 0.91
Honduras 23.6 0.29 0.91
Madagascar 15.1 0.29 1.08
Moldova 20.3 0.30 1.09
Mongolia 10.2 0.30 0.97
Guinea 20.1 0.32 1.06
Kenya 26.4 0.34 1.12 *i.e. a value of 1 implies that a country lies perfectly on the regression line. **Export data not available. Vietnam’s manufacturing sector accounts for 20% of GDP. Angola’s accounts for 4% of GDP. Source: World Development Indicators

37
Table 3. Number of firms with productivity data, by size-class (employees)
Micro Small Medium Large Very Large Country
<10 11-50 51-249 250-1000 >1000 Total
Eritrea 8 35 12 13 1 69 Ethiopia 162 118 18 43 23 364 Nigeria .. 41 33 75 29 178 Kenya 9 82 38 65 28 222 Mozambique 20 50 16 15 .. 101 Senegal 28 104 30 37 9 208 Tanzania 41 100 45 43 15 244 Uganda 53 139 30 43 9 274 Zambia .. 70 51 48 6 175 Bolivia 17 178 41 70 18 324 Nicaragua 180 198 33 29 6 446 Bangladesh 24 178 115 465 167 949 India 315 936 156 188 78 1673 China 15 97 159 375 316 962 Morocco 4 404 145 272 27 852
Table 4. Selected Economic Indicators, 2000–2002
Country GNI per capita, $
Trade %GDP
Ag %GDP
Investment (FDI), %GDP
Manufacturing %GDP (growth)
Manufacturing, % merchandise
exports Eritrea 160 111 21 39 (5.3) 8 (5.4) - Ethiopia 100 49 52 18 (1.2) 7 (5.0) 9.8 Nigeria 290 81 35 20 (2.4) 4 (3.7) 0.2 Kenya 360 57 19 14 (0.4) 13 (1.0) 22 Mozambique 210 79 23 40 (8.6) 13 (9.2) 7.5 Senegal 480 38 18 18 (1.3) 13 (7.3) 37 Tanzania 280 71 45 17 (3.7) 8 (5.9) 18 Uganda 250 40 31 20 (2.6) 10 (2.9) 6.5 Zambia 330 75 22 18 (2.9) 11 (4.5) 17 China 940 52 15 37 (3.7) 38 (8.7) 88 Bangladesh 380 33 23 23 (0.3) 16 (5.6) 92 India 480 31 23 22 (0.6) 15 (5.6) 77 Algeria 1,720 61 10 23 (1.6) 8 (-1.0) 2.3 Morocco 1,190 66 16 25 (4.2) 17 (4.0) 64 Bolivia 900 49 15 16 (9.3) 15 (1.9) 17* Nicaragua 720 73 18 29 (5.0) 14 (1.2) 13 *was 40% in 1999, but oil & gas production has reduced it rapidly since

38
Figure 2. Percentage of firms exporting at least 20 percent of production
0
10
20
30
40
50
60
Nigeria
Ethiop
ia
Bolivia
Moz
ambiq
ue
Eritrea
Ugand
a
Tanza
niaIn
dia
Nicarag
ua
Kenya
Zambi
a
Seneg
al
China
Bangla
desh
Mor
occo%
fir
ms
expo
rtin
g >
20%
of
prod
uctio
n
Figure 3. Median profit margin & median return on capital
-0.20
-0.10
0.00
0.10
0.20
0.30
0.40
0.50
0.60
Eritrea
Ethiop
ia
Nigeria
Zambia
Tanza
nia
Moz
ambiq
ue
Ugand
a
Kenya
Seneg
al
Mor
occo
Bolivia
Nicarag
ua
Bangla
desh
China
India
profit margin return on capital
*profit margin = (profits / sales – 1); return on capital = (profits / capital – 1)
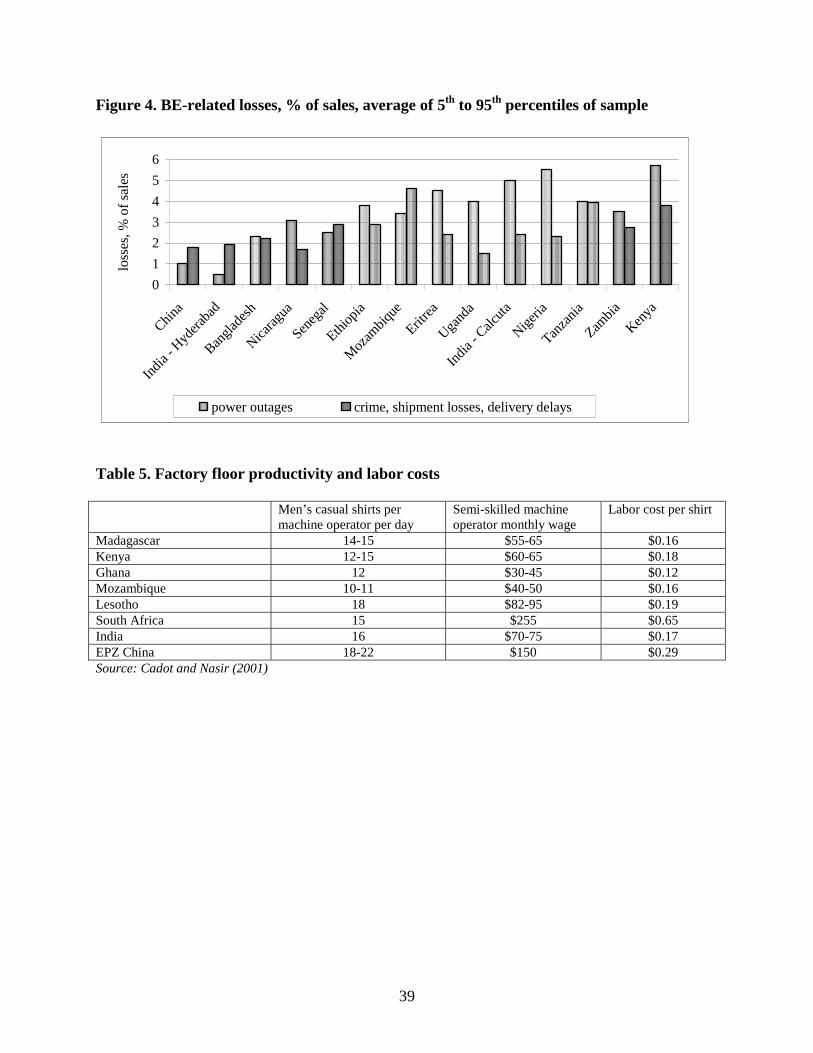
39
Figure 4. BE-related losses, % of sales, average of 5th to 95th percentiles of sample
0
1
2
3
4
5
6
China
India
- Hyd
eraba
d
Bangla
desh
Nicarag
ua
Seneg
al
Ethiop
ia
Moz
ambi
que
Eritrea
Ugand
a
India
- Calc
uta
Nigeria
Tanza
nia
Zambia
Kenya
loss
es, %
of
sale
s
power outages crime, shipment losses, delivery delays
Table 5. Factory floor productivity and labor costs Men’s casual shirts per
machine operator per day Semi-skilled machine operator monthly wage
Labor cost per shirt
Madagascar 14-15 $55-65 $0.16 Kenya 12-15 $60-65 $0.18 Ghana 12 $30-45 $0.12 Mozambique 10-11 $40-50 $0.16 Lesotho 18 $82-95 $0.19 South Africa 15 $255 $0.65 India 16 $70-75 $0.17 EPZ China 18-22 $150 $0.29 Source: Cadot and Nasir (2001)
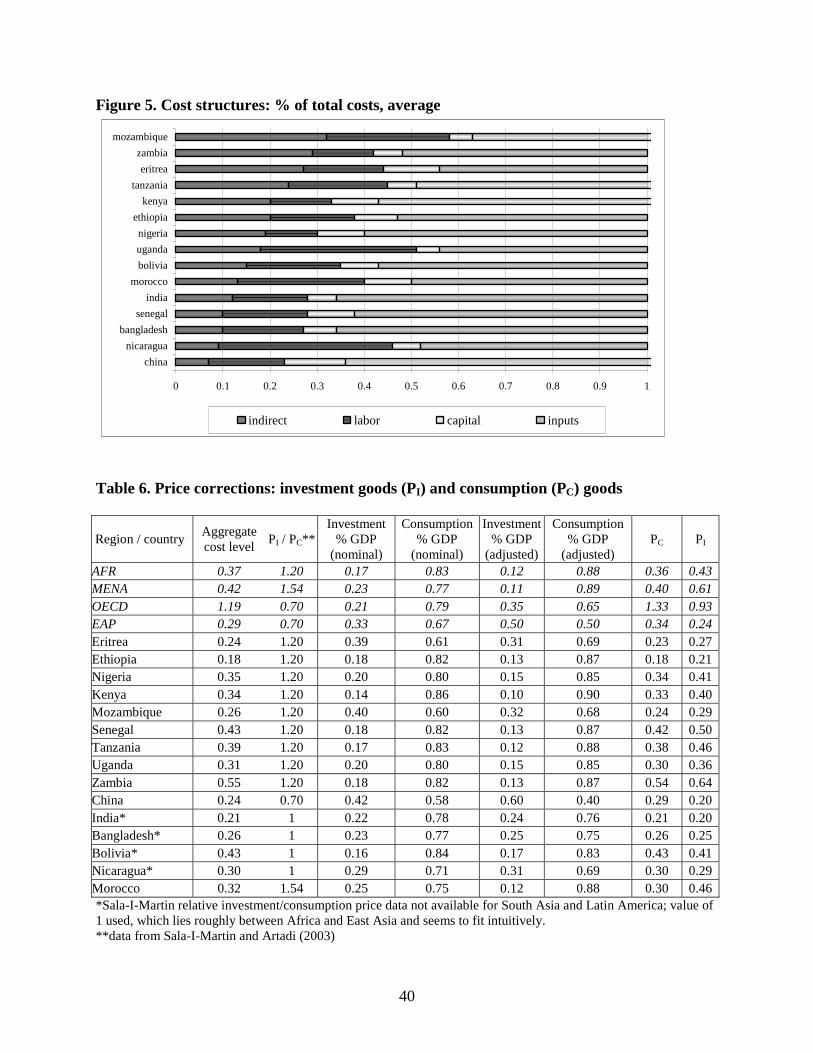
40
Figure 5. Cost structures: % of total costs, average
0 0.1 0.2 0.3 0.4 0.5 0.6 0.7 0.8 0.9 1
china
nicaragua
bangladesh
senegal
india
morocco
bolivia
uganda
nigeria
ethiopia
kenya
tanzania
eritrea
zambia
mozambique
indirect labor capital inputs
Table 6. Price corrections: investment goods (PI) and consumption (PC) goods
Region / country Aggregate cost level
PI / PC** Investment
% GDP (nominal)
Consumption % GDP
(nominal)
Investment % GDP
(adjusted)
Consumption % GDP
(adjusted) PC PI
AFR 0.37 1.20 0.17 0.83 0.12 0.88 0.36 0.43 MENA 0.42 1.54 0.23 0.77 0.11 0.89 0.40 0.61 OECD 1.19 0.70 0.21 0.79 0.35 0.65 1.33 0.93 EAP 0.29 0.70 0.33 0.67 0.50 0.50 0.34 0.24 Eritrea 0.24 1.20 0.39 0.61 0.31 0.69 0.23 0.27 Ethiopia 0.18 1.20 0.18 0.82 0.13 0.87 0.18 0.21 Nigeria 0.35 1.20 0.20 0.80 0.15 0.85 0.34 0.41 Kenya 0.34 1.20 0.14 0.86 0.10 0.90 0.33 0.40 Mozambique 0.26 1.20 0.40 0.60 0.32 0.68 0.24 0.29 Senegal 0.43 1.20 0.18 0.82 0.13 0.87 0.42 0.50 Tanzania 0.39 1.20 0.17 0.83 0.12 0.88 0.38 0.46 Uganda 0.31 1.20 0.20 0.80 0.15 0.85 0.30 0.36 Zambia 0.55 1.20 0.18 0.82 0.13 0.87 0.54 0.64 China 0.24 0.70 0.42 0.58 0.60 0.40 0.29 0.20 India* 0.21 1 0.22 0.78 0.24 0.76 0.21 0.20 Bangladesh* 0.26 1 0.23 0.77 0.25 0.75 0.26 0.25 Bolivia* 0.43 1 0.16 0.84 0.17 0.83 0.43 0.41 Nicaragua* 0.30 1 0.29 0.71 0.31 0.69 0.30 0.29 Morocco 0.32 1.54 0.25 0.75 0.12 0.88 0.30 0.46 *Sala-I-Martin relative investment/consumption price data not available for South Asia and Latin America; value of 1 used, which lies roughly between Africa and East Asia and seems to fit intuitively. **data from Sala-I-Martin and Artadi (2003)

41
Table 7. Net value-added per worker and capital per worker, median by firm size
VA / L, $ K / L, $ country Micro small medium large very large Micro small medium large very large Eritrea 2,900 2,450 5,450 2,000 1,600 14,750 17,700 52,050 52,650 14,500 Ethiopia 600 550 750 1,050 650 950 2,450 3,750 4,600 4,400 Nigeria .. 1,400 1,500 2,850 3,100 .. 17,200 12,850 24,900 19,150 Kenya .. 1,750 3,100 6,300 2,300 12,600 6,800 11,700 10,000 6,800 Mozambique 350 1,250 2,800 2,200 .. 2,700 6,200 5,600 12,250 .. Senegal 6,150 7,500 17,100 15,600 14,500 9,450 6,900 11,300 11,950 1,000 Tanzania 1,350 1,850 4,200 3,400 6,800 1,050 5,900 4,750 13,250 13,150 Uganda 925 1,000 1,600 4,800 950 800 1,550 4,700 8,850 1,050 Zambia .. 800 950 1,250 2,500 .. 9,650 14,000 6,700 13,750 Bangladesh 950 1,300 1,650 1,200 1,150 400 1,450 1,650 800 1,150 India 1,850 3,500 3,200 3,800 5,750 1,500 1,500 1,850 2,850 6,000 Bolivia 1,300 1,700 3,050 2,450 7,350 1,200 2,150 4,700 5,350 11,050 Nicaragua 2,100 2,450 3,650 10,200 3,700 950 1,300 1,250 5,700 1,350 China 1,850 2,350 4,150 3,850 4,250 1,400 850 1,250 1,400 4,200
Morocco 4,100 4,850 3,600 5,250 5,750 4,350 2,150 2,550
Figure 6. Median capacity utilization, percentage
0
10
20
30
40
50
60
70
80
90
eritre
a
ethio
pia
mozam
bique
nigeri
a
boliv
ia
keny
a
tanza
nia
ugan
da
zambia
mor
occo
nicara
gua
bang
lades
hch
ina
sene
gal
india
capa
city
uti
lizat
ion,
%, m
edia
n

42
Model 1 Model 2 Table 8. Results of equation [2]
coefficient t-statistic coefficient t-statistic
log capital 0.28 30.6 0.28 13.4
log labor 0.76 49.9 0.77 22.2
Constant term 4.56 28.5 4.27 17.3
Bangladesh 1.54 10.9 1.61 11.4
Bolivia 1.17 8.1 1.15 7.9
China 2.25 15.9 2.23 15.8
Eritrea 1.31 5.4 1.33 5.6
Ethiopia 1.05 6.7 1.05 6.6
India 2.22 17.7 2.21 17.6
Kenya 1.44 9.6 1.45 9.2
Morocco 2.08 17.1 1.99 17.1
Mozambique 0.85 3.9 0.87 3.8
Nicaragua 1.95 15.5 1.98 15.6
Nigeria 1.02 5.9 1.00 5.9
Senegal 2.02 14.2 1.99 14.3
Tanzania 1.53 9.6 1.49 9.5
Uganda 1.33 8.6 1.34 8.5
Chemicals 0.08 1.2 -0.58 -1.6
Construction materials 0.11 0.6 0.09 1.2
Food & beverage processing 0.01 0.2 -0.16 -0.5
Metals and machinery -0.22 -3.8 -0.33 -1.0
Plastics -0.09 -0.7 0.19 2.0
Paper, printing and publishing -0.16 -1.2 -0.23 -0.3
Textiles, garments and leather -0.27 -5.2 0.09 3.4
Wood and furniture -0.44 -5.1 -0.10 -0.3
Capital * chemicals 0.04 1.0
Capital * construction materials -0.09 -1.2
Capital * food and beverage 0.02 0.6
Capital * metals and machinery 0.03 0.8
Capital * plastics -0.21 -2.5
Capital * paper, printing and publishing -0.06 -0.8
Capital * textiles, garments and leather -0.07 -2.5
Capital * wood and furniture -0.03 -0.7
Labor * chemicals 0.06 1.0
Labor * construction materials 0.13 0.7
Labor * food and beverage -0.01 -0.3
Labor * metals and machinery -0.07 -1.2
Labor * plastics 0.24 1.9
Labor * paper, printing and publishing 0.26 1.9
Labor * textiles, garments and leather -0.07 -1.6
Labor * wood 0.03 0.4
Model R2 0.717 0.714

43
Figure 7. Decomposition of Net TFP
0.000.100.200.300.400.500.600.700.800.901.00
Ethiop
ia
Eritrea
Nigeria
Zambia
Moz
ambiq
ue
Ugand
a
Kenya
Tanza
nia
Seneg
al
Bolivia
Nicarag
ua
Mor
occo
Bangla
desh
India
China
net TFP indirect costs gap losses gap unexplained factory floor gap
*Notes: vertical height of dark blue bars indicate net TFP relative to China. Gaps between each country and China are decomposed into three parts: gap due to excess indirect costs (red); gap in factory-floor productivity due to excess business-environment-related losses (yellow); unexplained gap in factory-floor productivity (light blue). **Note: no data on excess losses for Morocco or Bolivia Table 9. Frequency distribution of net TFP (%)
Very low Low Medium High Very high
<10th percentile 10th to 33rd 33rd to 66th 66th to 90th >90th percentile Bangladesh 5.5 43.6 37.7 11.3 1.9 Bolivia 13.1 27.3 38.5 17.3 3.8 China 4.8 13.7 24.5 39.2 17.8 Eritrea 12.4 43.8 31.4 12.4 0.0 Ethiopia 38.6 34.5 19.9 5.6 1.4 India 5.1 18.0 39.1 30.4 7.4 Kenya 10.5 27.2 33.8 21.0 7.5 Morocco 14.9 16.5 21.4 21.3 25.9 Mozambique 35.5 24.2 29.1 6.4 4.9 Nicaragua 3.7 14.8 45.0 28.7 7.9 Nigeria 19.6 32.2 33.0 11.8 3.3 Senegal 3.3 12.1 23.8 36.5 22.3 Tanzania 13.4 29.9 22.8 22.8 11.1 Uganda 22.6 20.4 32.9 16.0 8.1 Zambia 36.0 34.1 17.0 8.9 4.0

44
Table 10. Average firm size (# workers) by ownership Country Domestic Foreign African European Asian Middle Eastern Other
Bangladesh 149 340
China 232 284
Eritrea 38 52 40 52
Ethiopia 22 15
India 27 252
Kenya 73 230 60 90 59 85 249
Morocco 52 100
Mozambique 34 45
Nicaragua 14 60
Nigeria 81 252 84 310 216 156 904
Senegal 29 63 24 65 28 35
Tanzania 29 159 23 84 46 43
Uganda 19 68 16 104 60 138
Figure 8. Productivity index by ownership
0.000.20
0.400.600.80
1.001.20
1.401.60
Zambia
Moz
ambiq
ue
Ethiop
ia
Nigeria
Tanza
nia
Ugand
a
Kenya
Eritrea
Bangla
desh
Nicarag
ua
Seneg
alIn
diaChin
a
TF
P r
elat
ive
to C
hina
ave
rage
domestic foreign
45
Figure 8b. Relative productivity of large firms and SMEs
0.00
0.50
1.00
1.50
2.00
2.50
3.00
Ethiop
ia
Eritrea
Bangla
desh
China
Seneg
al
Mor
occo
India
Tanza
nia
Bolivia
Kenya
Nigeria
Ugand
a
Nicarag
ua
Moz
ambi
que
Zambia
prod
ucti
vity
of
larg
e fi
rms
vers
us S
ME
Table 11. Median of firms’ self-reported market share, by ownership Domestic firms Foreign firms African Asian European Middle Eastern
china 5 5
ethiopia 5 5
india 3 5
kenya 15 35 7.5 10 38 52
morocco 4 1.5
mozambique 10 23 10 12.5 15 20
nicaragua 10 12.5
senegal 25 50 25 45 25
tanzania 5 15 5 10 50 15
uganda 4.5 30 2 30 12.5 15
zambia 20 31
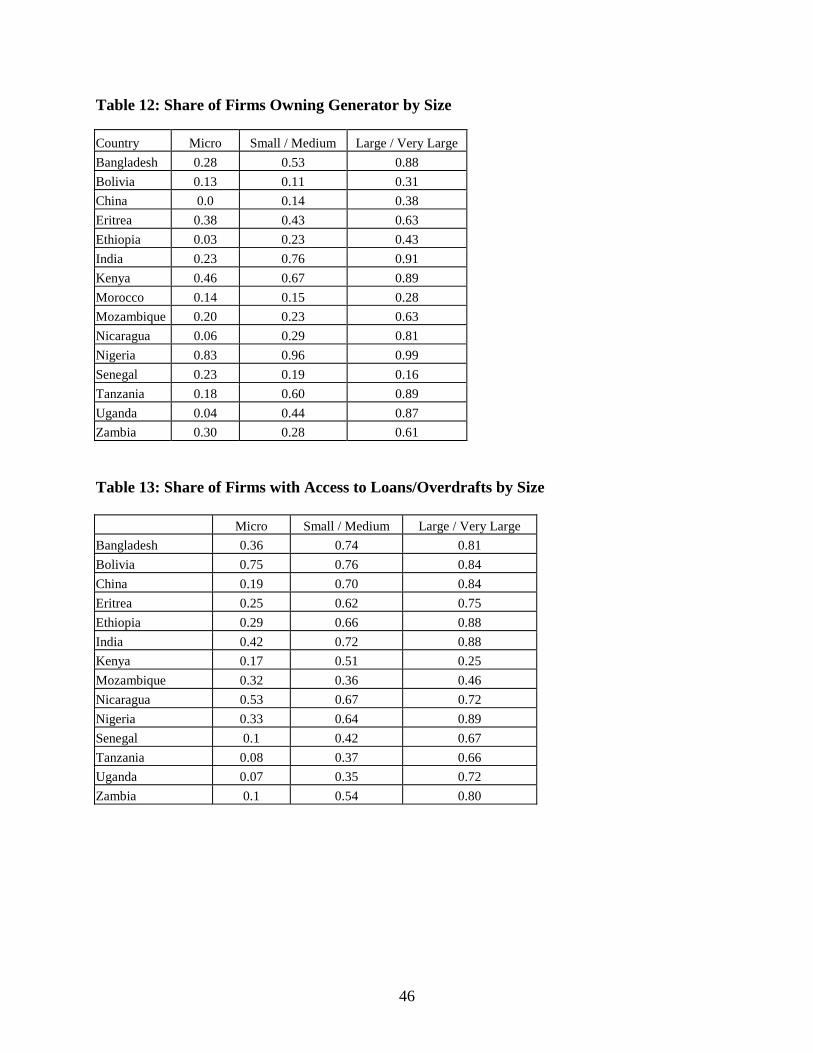
46
Table 12: Share of Firms Owning Generator by Size
Country Micro Small / Medium Large / Very Large
Bangladesh 0.28 0.53 0.88
Bolivia 0.13 0.11 0.31
China 0.0 0.14 0.38
Eritrea 0.38 0.43 0.63
Ethiopia 0.03 0.23 0.43
India 0.23 0.76 0.91
Kenya 0.46 0.67 0.89
Morocco 0.14 0.15 0.28
Mozambique 0.20 0.23 0.63
Nicaragua 0.06 0.29 0.81
Nigeria 0.83 0.96 0.99
Senegal 0.23 0.19 0.16
Tanzania 0.18 0.60 0.89
Uganda 0.04 0.44 0.87
Zambia 0.30 0.28 0.61
Table 13: Share of Firms with Access to Loans/Overdrafts by Size Micro Small / Medium Large / Very Large
Bangladesh 0.36 0.74 0.81
Bolivia 0.75 0.76 0.84
China 0.19 0.70 0.84
Eritrea 0.25 0.62 0.75
Ethiopia 0.29 0.66 0.88
India 0.42 0.72 0.88
Kenya 0.17 0.51 0.25
Mozambique 0.32 0.36 0.46
Nicaragua 0.53 0.67 0.72
Nigeria 0.33 0.64 0.89
Senegal 0.1 0.42 0.67
Tanzania 0.08 0.37 0.66
Uganda 0.07 0.35 0.72
Zambia 0.1 0.54 0.80

47
Table 14: Burden of Government by Size
Inspection days, median % senior management time spent dealing with regulation,
median Country
Micro Small / Medium
Large / Very Large
Micro Small / Medium
Large / Very Large
Bangladesh 6.5 10 12 1 3 3 China 5 5 5 Eritrea 7 4 4 1 2 5 Ethiopia 3 7 6 1 1 1
India 3 7 12 5 10 13
Kenya 11 16 17 7.5 10 10
Morocco 0 1 3
Mozambique 3 3 3 10 5 8
Nicaragua 4 15 32 6 18 17
Senegal 9 13 13
Tanzania 12 32 62 5 10 13
Uganda 2 5 17 1 1 6
Zambia 52 64 75 15 11 13

48
Appendix Tables 1.1. Response rates for sales and costs data by ownership and exporter status
domestic foreign non-exporter exporter country sales costs sales costs sales costs sales costs
bangladesh 0.98 0.89 1 0.85 0.87 0.89 1 0.9
bolivia 0.61 0.43 0.67 0.49
china 1 0.79 1 0.79 1 0.74 1 0.81
eritrea 0.52 0.4 0.59 0.53 0.56 0.45 0.29 0.29
ethiopia 0.99 0.92 1 0.95 0.99 0.92 0.96 0.93
india 1 0.63 1 0.73 1 0.53 1 0.61
kenya 0.59 0.57 0.76 0.6 0.6 0.57 0.67 0.61
morocco 1 0.96 1 0.96 1 0.95 1 0.96
mozambique 0.75 0.36 0.67 0.33 0.72 0.34 0.86 0.5
nicaragua 1 0.6 1 0.64 1 0.59 1 0.65
nigeria 0.92 0.75 0.86 0.82 0.89 0.78 1 0.78
senegal 0.89 0.51 0.86 0.55 0.88 0.53 0.92 0.49
tanzania 0.88 0.44 0.78 0.48 0.86 0.42 0.84 0.6
uganda 0.52 0.28 0.52 0.3 0.67 0.26 0.66 0.4
zambia 0.84 0.85 0.72 0.76 0.8 0.84 0.84 0.78
Table 1.2 Response rates by ethnicity african european asian middle eastern sales costs sales costs sales costs sales costs
eritrea 0.53 0.43 0.5 0.5 kenya 0.61 0.61 0.7 0.6 0.58 0.57 mozambique 0.7 0.29 0.8 0.39 0.72 0.34 nigeria 0.93 0.76 0.84 0.76 0.88 0.88 0.74 0.67 senegal 0.92 0.46 0.8 0.53 0.82 0.63 tanzania 0.86 0.37 0.75 0.44 0.81 0.54 0.9 0.2 uganda 0.69 0.22 0.5 0.5 0.56 0.32

49
Table 1.3. Response rates by size micro small medium large Very large sales costs sales costs sales costs sales costs sales costs bangladesh 0.68 0.6 1 0.91 1 0.94 1 0.89 1 0.94 bolivia 0.22 0.11 0.86 0.58 0.87 0.72 0.83 0.67 0.87 0.78 china 1 0.38 0.99 0.69 1 0.75 1 0.83 1 0.82 eritrea 0.75 0.25 0.46 0.39 0.43 0.43 0.69 0.63 0.5 0.5 ethiopia 0.97 0.9 1 0.91 1 0.93 1 1 1 0.82 india 1 0.65 1 0.53 1 0.8 1 0.86 1 0.82 kenya 0.3 0.2 0.59 0.62 0.83 0.74 0.65 0.59 0.62 0.5 morocco 1 1 1 0.95 1 0.93 1 0.95 1 0.93 mozambique 0.73 0.29 0.84 0.42 0.57 0.35 0.65 0.31 1 0.5 nicaragua 1 0.48 1 0.63 1 0.82 1 0.86 1 0.67 nigeria 0.5 0.17 0.86 0.57 0.89 0.84 0.93 0.87 0.97 0.91 senegal 0.8 0.33 0.9 0.49 0.92 0.45 0.85 0.47 0.91 0.46 tanzania 0.85 0.1 0.86 0.33 0.81 0.48 0.9 0.66 0.82 0.29 uganda 0.7 0.06 0.67 0.13 0.56 0.12 zambia 0.1 0.1 0.79 0.8 0.87 0.84 0.89 0.83 0.85 0.92 Table 1.4. Value-added and capital per worker, price-adjusted
VA / L, $ K / L, $ country Micro small medium large very large Micro small medium large very large
Eritrea 12,826 10,836 24,105 8,846 7,077 54,365 65,238 191,843 194,055 53,443 Ethiopia 3,422 3,136 4,277 5,988 3,707 4,515 11,643 17,820 21,860 20,909 Nigeria 4,118 4,413 8,384 9,119 42,164 31,500 61,040 46,944 Kenya 5,252 9,303 18,906 6,902 31,510 17,005 29,259 25,008 17,005 Mozambique 1,431 5,112 11,451 8,997 9,202 21,130 19,085 41,748 Senegal 14,681 17,903 40,819 37,239 34,613 18,798 13,726 22,479 23,772 1,989 Tanzania 3,548 4,862 11,037 8,935 17,870 2,299 12,921 10,402 29,017 28,798 Uganda 3,072 3,321 5,314 15,942 3,155 2,214 4,290 13,008 24,494 2,906 Zambia 1,493 1,773 2,333 4,666 15,008 21,773 10,420 21,384 Bangladesh 3,654 5,000 6,346 4,615 4,423 1,538 5,577 6,346 3,077 4,423 India 8,810 16,667 15,238 18,095 27,381 7,143 7,143 8,810 13,571 28,571 Bolivia 3,023 3,953 7,093 5,698 17,093 2,791 5,000 10,930 12,442 25,698 Nicaragua 7,000 8,167 12,167 34,000 12,333 3,167 4,333 4,167 19,000 4,500 China 6,329 8,040 14,198 13,171 14,540 6,842 4,154 6,109 6,842 20,527 Morocco 13,665 16,165 11,999 17,498 12,444 9,415 4,653 5,519
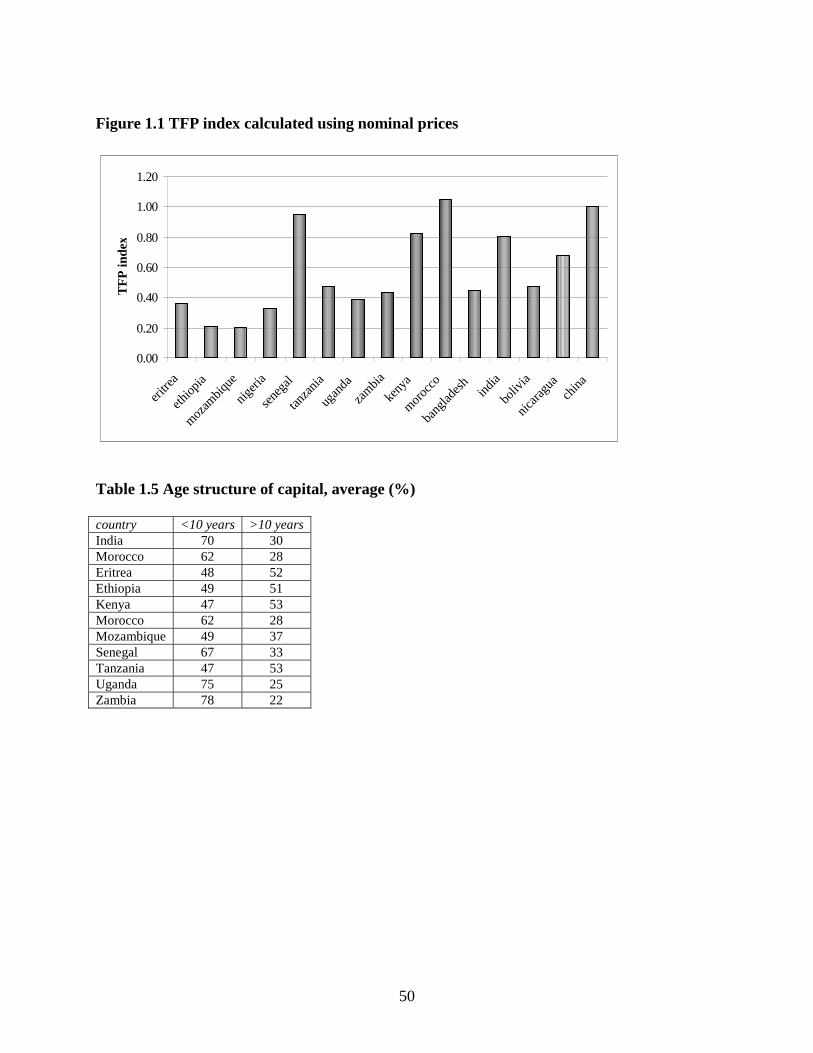
50
Figure 1.1 TFP index calculated using nominal prices
0.00
0.20
0.40
0.60
0.80
1.00
1.20
eritre
a
ethiop
ia
mozam
bique
nigeri
a
sene
gal
tanza
nia
ugan
da
zambia
keny
a
moroc
co
bang
lades
hind
ia
boliv
ia
nicara
gua
china
TF
P in
dex
Table 1.5 Age structure of capital, average (%) country <10 years >10 years India 70 30 Morocco 62 28 Eritrea 48 52 Ethiopia 49 51 Kenya 47 53 Morocco 62 28 Mozambique 49 37 Senegal 67 33 Tanzania 47 53 Uganda 75 25 Zambia 78 22
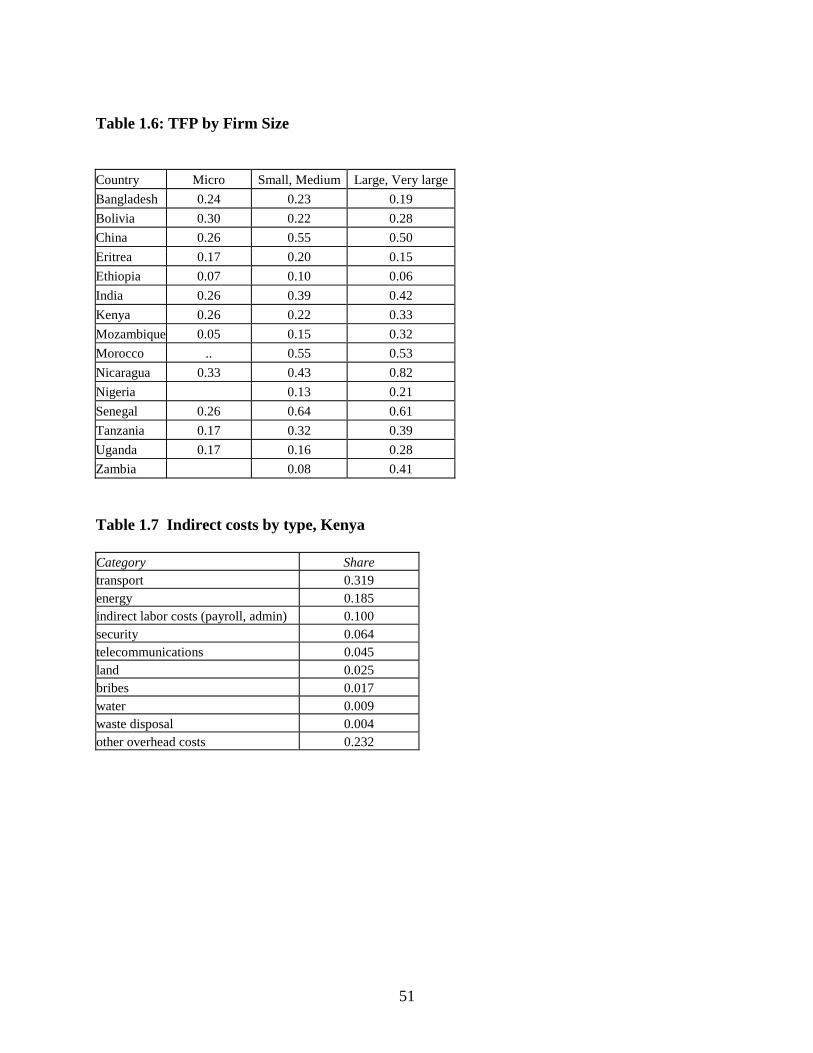
51
Table 1.6: TFP by Firm Size Country Micro Small, Medium Large, Very large
Bangladesh 0.24 0.23 0.19
Bolivia 0.30 0.22 0.28
China 0.26 0.55 0.50
Eritrea 0.17 0.20 0.15
Ethiopia 0.07 0.10 0.06
India 0.26 0.39 0.42
Kenya 0.26 0.22 0.33
Mozambique 0.05 0.15 0.32
Morocco .. 0.55 0.53
Nicaragua 0.33 0.43 0.82
Nigeria 0.13 0.21
Senegal 0.26 0.64 0.61
Tanzania 0.17 0.32 0.39
Uganda 0.17 0.16 0.28
Zambia 0.08 0.41
Table 1.7 Indirect costs by type, Kenya Category Share transport 0.319 energy 0.185 indirect labor costs (payroll, admin) 0.100 security 0.064 telecommunications 0.045 land 0.025 bribes 0.017 water 0.009 waste disposal 0.004 other overhead costs 0.232

52
References Basant, Rakesh and Fikkert, Brian (1996), “The effects of R&D, foreign technology purchase, and domestic and international spillovers on productivity in Indian firms,” Review of Economic Statistics, 78, 2: 187-99 Batsos, Fabiano and Nasir, John (2004), “Productivity and the Investment Climate: what matters most?” World Bank Policy Research Working Paper #3335 Biggs, Tyler et al (1996), « Technological Capabilities and Learning in African Enterprises, » RPED Working Paper #AFT288, The World Bank. Biggs, Tyler and Shah, Manju (2004), “African SMEs, Networks and Manufacturing Performance,” Mimeo. Birdsall, Nancy (2004), “New Issues in Development Assistance,” mimeo. Byrd, William and Gelb, Alan “Why Industrialize? The Incentives for Rural Community Governments” in Byrd W. and Lin Qingsong Burgess, Robin and Venables, Anthony (2004), “Towards a microeconomics of growth,” World Bank Policy Research Working Paper 3257. Chenery, Hollis and Syrquin, Moshe (1975), Patterns of Development: 1950-1970, (Oxford: Oxford University Press). Clarke, George (2004) “Why Don’t African Manufacturing Enterprises Export More? The Role of Trade Policy, Infrastructure Quality and Enterprise Characteristics,” mimeo. Collier, Paul (2000), “Africa’s Comparative Advantage,” in H. Jalilian, M. Tribe and J. Weiss (eds), Industrial Development and Policy in Africa, (Cheltenham: Edward Elgar). Collier et al (2000), “Exports and firm-level efficiency in African manufacturing,” CSAE WPS/2000-16 Collier, Paul; Hoeffler, Anke and Patillo, Catherine (1999), ‘Flight Capital as a Portfolio Choice,’ World Bank Working Paper no. 2066. Collier, Paul and Gunning, Jan (1997), “Explaining African Economic Performance,” WPS/97-2.2, Center for the Study of African Economies, 1997. Devarajan, Shantayan et al. (2001), Aid and Reform in Africa, (Washington, DC: The World Bank). Dollar, David, Hallward-Driemeier, Mary and Mengistae, Taye (2003), “Investment Climate and Firm Performance in Developing Economies,” mimeo.
53
Dollar, David, Hallward-Driemeier, Mary and Mengistae, Taye (2004), “Investment Climate and International Integration,” World Bank Policy Research Working Paper no. 3323. Dollar, David and Easterly, William (1999), “The Search for the Key: Aid, Investment and Policies in Africa,” World Bank Policy Research Working Paper no. 2070. Durkin, J. (1997), "Perfect Competition and Endogenous Comparative Advantage", Review of International Economics, Vol. 5, no 3, pp. 401-411 Easterly, William (2002), “The Cartel of Good Intentions: The Problem of Bureaucracy in Foreign Aid,” Journal of Policy Reform, December; 5(4): 223-50 Easterly, William (2003), “Can Foreign Aid Buy Growth?” Journal of Economic Perspectives; 17, No. 3:23-48, Summer. Eifert, Benn and Ramachandran, Vijaya (2004), “Competitiveness and Private Sector Development in Africa: Cross-Country Evidence from the World Bank’s Investment Climate Data,” Institute for African Studies, Cornell University, Occasional Paper Series.
Emery, James (2003), “Governance and Private Investment in Africa,” in Van de Walle, Ball and Ramachandran, eds., Beyond Structural Adjustment: The Institutional Context of African Development (New York: Palgrave Macmillan). Fafchamps, Marcel (2004), Market Institutions in Sub-Saharan Africa: Theory and Evidence, (Cambridge, MA: The MIT Press). Foellmi, Reto and Zweimuller, Josef (2002), “Structural change and the Kaldor facts of economic growth,” IZA Discussion Paper No. 472; Zurich IEER Working Paper No. 111 Gelb, Alan and Tidrick, Gene (2000), “Growth and job creation in Africa,” in Strategies for Growth and Job Creation in Southern Africa, Gaborone, Botswana: Friedrich Ebert Stiftung Grossman, Gene and Helpman, Elhanan (1990), “Comparative advantage and long-run growth,” The American Economic Review, 80, 4: 796-815 Krugman, Paul (1980), “Scale economies, product differentiation, and the pattern of trade,” The American Economic Review, 70, 5: 950-959
– (1981), “Intraindustry specialization and the gains from trade,” Journal of Political Economy, 89, 5: 959-973 – (1983), “New theories of trade among industrialized countries,” The American Economic Review, 73, 2: 343-347 – (1991), “Increasing returns and economic geography,” Journal of Political Economy, 99, 3: 483-499
54
– (1991), “History and industry location: the case of the manufacturing belt,” The American Economic Review, 81, 2: 80-83
Levy, Brian and Kpundeh, Sahr (2004) eds., Building State Capacity in Africa: new approaches, emerging lessons, (Washington, DC: WBI Development Studies, The World Bank). Mengistae, Taye (2001), “Indigenous ethnicity and entrepreneurial success in Africa: some evidence from Ethiopia,” World Bank Policy Research Working Paper #2534 Mengistae, Taye and Pattillo, Catherine (2002), “Export Orientation and Productivity in Sub-Saharan Africa,” IMF Working Paper WP/02/89. Montobbio, Fabio (2002), “An evolutionary model of industrial growth and structural change,” Structural Change and Economic Dynamics, 13: 387-414 Ngai, Rachel and Pissarides, Christopher (2004), “Structural change in a multi-sector model of growth,” working paper, available at www.iue.it/ECO/ResearchActivities/ ResearchWorkshops/papers2004-5/Term1/Pissarides.pdf Qian, Yingyi (2003), “How Reform Worked in China,” in Dani Rodrik, ed, In Search of Prosperity, (Princeton, NJ: Princeton University Press). Radelet, Steven (1999), “Manufactured Exports, Export Platforms and Economic Growth,” Harvard Institute for International Development, CAER Discussion Paper no. 43. Ramachandran, Vijaya and Shah, Manju (1999) “Minority Entrepreneurs and Private Sector Growth in sub-Saharan Africa,” Journal of Development Studies, vol. 36, no.2, December. Regional Program on Enterprise Development (1995-present), Africa Private Sector Group, The World Bank, various papers, see www.worldbank.org/rped Sala-i-Martin, Xavier and Artadi, Elsa (2003), “The Tragedy of the Twentieth Century: Growth in Africa,” Columbia University Economics Discussion Paper 0203-17 Soderbom, Mans and Teal, Francis (2003), “Are Manufactured Exports the Key to Economic Success in Africa?,” Journal of African Economies, Vol 12, no.1, pp. 1-29. Tangri, Roger (1999), The Politics of Patronage in Africa (Trenton, NJ: Africa World Press. United Nations Industrial Development Organization (UNIDO) (2004), Industrialization, Environment and the Millenium Development Goals in Sub-Saharan Africa, Vienna, UNIDO Van de Walle, Nicolas (2001), African Economies and the Politics of Permanent Crisis, 1979-1999, (Cambridge: Cambridge University Press).

55
Venables, Antony and Limao, Nuno (1994), “Infrastructure, geographical disadvantage and transport costs,” The World Bank. Wood, Adrian and Berge, Kersti (1997), “Exporting Manufactures: human resources, natural resources, and trade policy,” Journal of Development Studies; 34: 35-59, October. Wood, Adrian and Mayer, Jorg (2001), “Africa’s export structure in a comparative perspective,” Cambridge Journal of Economics, 25: 369:394 Wood, Adrian (2002), “Could Africa Be More Like America?” Mimeo. World Bank, Investment Climate Assessments, various, 1999-2004, available at http://www.worldbank.org/privatesector/ic/ic_ica.htm and www.worldbank.org/rped World Bank, 2004a A Better Business Climate for All. World Development Report 2005 World Bank 2004b Doing Business 2005 World Economic Forum (2004), Africa Competitiveness Report 2004 (Geneva: World Economic Forum). Winters, Alan and Martins, Pedro (2004), “When comparative advantage is not enough: business costs in small, remote economies,” World Trade Review, 3: 1-37