Embed Size (px)
Citation preview
INTERNATIONAL JOURNAL OF PROGRESSIVE RESEARCH IN SCIENCE AND ENGINEERING, VOL.2, NO.6, JUNE 2021.
SAMUEL ETIM EFFIONG., et.al: COMPARATIVE ANALYSIS OF GLOBAL SYSTEM FOR MOBILE COMMUNICATION (GSM) NETWORK IN IKOT EKPENE LOCAL GOVERNMENT OF AKWA IBOM STATE, NIGERIA USING GSM NETWORK ANALYZER
73
Comparative Analysis of Global System for Mobile Communication
(GSM) Network in Ikot Ekpene Local Government of Akwa Ibom
State, Nigeria Using GSM Network Analyzer
Samuel Etim Effiong 1, Aniekan Inyang 1 1Lecturer II, Department of Electrical / Electronics Engineering Akwa Ibom State Polytechnic Ikot Osurua, Ikot Ekpene Local Government,
AkwaIbom State, Nigeria.
Corresponding Author: [email protected]
Abstract: - As the erratic nature of the services of cellular networks become increasingly worrisome, the signal strengths and
qualities of four available cellular networks operating in Ikot Ekpene Local Government Area, Akwa Ibom State Nigeria are
compared to ascertain the network with a better signal strength. Measurement of signal strength (SS) and quality of signal (QoS) at
particular time intervals were made for the four networks. The global system for mobile communication (GSM) analyzer is slotted
with the subscriber identification module (SIM) card of each service provider of the telecommunication outfit. Results show that
the network with the highest values of signal strength has the best quality of service, the average mean signal strengths for the four
networks obtained were -86.25dBm, -86.33dBm,-86.71dBm and -86.71dBm and -86.42dBm for MTN Nigeria, Airtel, Globacom
and 9 Mobile respectively. Also, the average mean quality of signal for four networks obtained were 43.38%, 43.38%, 43.38%, and
43.25%, for MTN Nigeria, Airtel, Globacom and 9 Mobile Respectively. The study shows that the type of network technology used
does not influence the signal strength and quality. Network congestion is not influenced by signal strength but only influenced by
number of users and bandwidth.
Key Words: —GSM, Signal Strength, Signal Quality, Base Station and Base Transceiver Stations.
I. INTRODUCTION
Mobile phones started to be widely utilized in Nigeria in 2002,
since then, the utilization of them has rapidly risen. More and
more people use them day by day. Because of the augmenting
number of mobile phone users, the numbers of base stations
which enable mobile phones to connect to other mobile phones
are to be increased to provide a well communication chance.[9]
Therefore, base stations are to be mounted closer to each other
at a specified distance. Global System for Mobile
communication (GSM) signal strength of the various Base
Station (BS) will be measured and evaluated at Ikot Ekpene
Local Government Area.
Ikot Ekpene Local Government is known throughout Nigeria as
Raffia city or locally simply as “IK” is an historic town in the
Southern Nigeria, in Akwa Ibom State.
It is the political and cultural capital of the Annang ethnic group
in Nigeria. The town is located on the A 342 highway that
parallels the coast between Calabar to the South East and Aba
to the West, with the state capital, Uyo to the East.
Umuahia is the next major town to the North. Ikot Ekpene is
known as a regional center of commerce with notable exports
of palm products, kernels, and raffia products including raffia
fibers and its sweet wine, as well as ground crops of yams,
cassava and corn [4]. The town is at the coordinate of latitude
and longitude of (5,055982ON and 7.877246OE) [11].
The signal strength of MTN, GLO, AIRTEL and 9 Mobile
networks will be measured with TECNO Android Mobile
receiver from the Base Transceiver Station (BTS) at intervals
of 30 seconds. The measured data will be analyze graphically
and compared with each other to see the performance of each
of the GSM network operators in the study area.
Manuscript revised June 14, 2021; accepted June 15, 2021.
Date of publication June 17, 2021.
This paper available online at www.ijprse.com
ISSN (Online): 2582-7898
INTERNATIONAL JOURNAL OF PROGRESSIVE RESEARCH IN SCIENCE AND ENGINEERING, VOL.2, NO.6, JUNE 2021.
SAMUEL ETIM EFFIONG., et.al: COMPARATIVE ANALYSIS OF GLOBAL SYSTEM FOR MOBILE COMMUNICATION (GSM) NETWORK IN IKOT EKPENE LOCAL GOVERNMENT OF AKWA IBOM STATE, NIGERIA USING GSM NETWORK ANALYZER
74
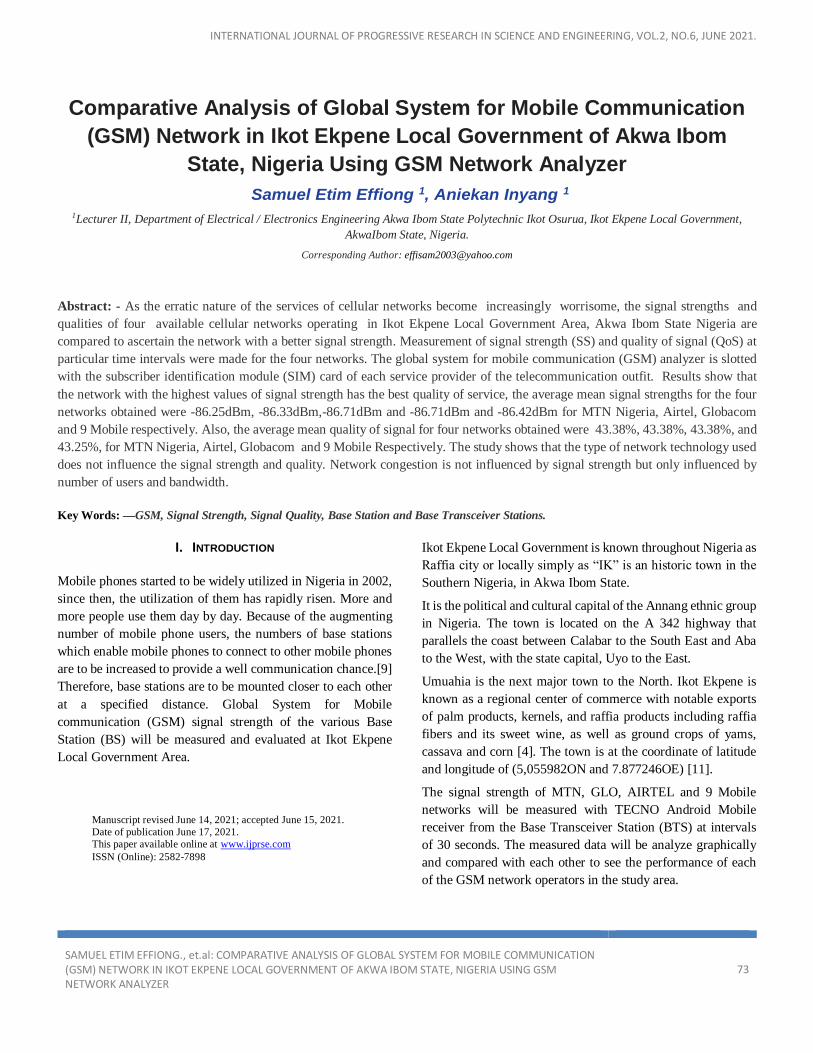
Fig.1. Map of Ikot Ekpene Local Government showing Location of
Measurement
II. STATEMENT OF RESEARCH PROBLEM
In recent times services rendered by these cellular network has
been epileptic and this has attributed to the weakness in the
strength of these cellular network in which case the quality of
their signals is analyzed with a view to determining the network
with better signals quality and at what period of the day signal
is strongest .
As the erratic nature of the service of some cellular network
become increasingly worrisome, the signal strength of the
cellular phone need to be compared and check the cause of
reduction in their strength[7].
The problems that is associated to the reduction of GSM signal
strength in any location are range, channel reuse, signal limit
factor, cellular multipath fading and radio power.
The range, which mobile devices connect reliably to the cell
site, is not a fixed figure. It will depend on a number of factors,
which are:
Height of antenna over surrounding terrain (Line-of-
sight propagation).
The frequency of signal in use [2].
Timing limitations in some technologies (e.g., GSM is
limited to 35km, with 70km being possible with
special equipment).
The transmitter’s rated power.
The required uplink/downlink data rate of the
subscriber’s device.
Reflection and absorption of radio energy by buildings
or vegetation.
It may also be limited by local geographical or
regulatory factors and weather condition [2]
III. OBJECTIVE OF THE RESEARCH
To enable the cellular users to know the range of signal
strength and quality of signals of the network they are
using in Ikot Ekpene.
To know if the off peak hours affect the signal strength
in Ikot Ekpene.
To enable the users to know if there is distinction on
signal between GSM and CDMA.
To enable the user to know the distinction between one
cellular network and the other based on the quality of
the signal.
IV. SCOPE OF THE RESEARCH
The research investigation is carry out in Ikot Ekpene Local
Government Area of Akwa Ibom State, Nigeria on four cellular
networks namely, MTN, Nigeria, Globacom, Airtel and 9
Mobile. The location of the study area is Ikot Ekpene Local
Government, Akwa Ibom State Southern Nigeria. The town is
located on the A 342 highway that parallels the coast between
Calabar to the South East and Aba to the West, with the state
capital, Uyo to the East .The town is at the coordinate of latitude
and longitude of (5,055982ON and 7.877246OE)[13].
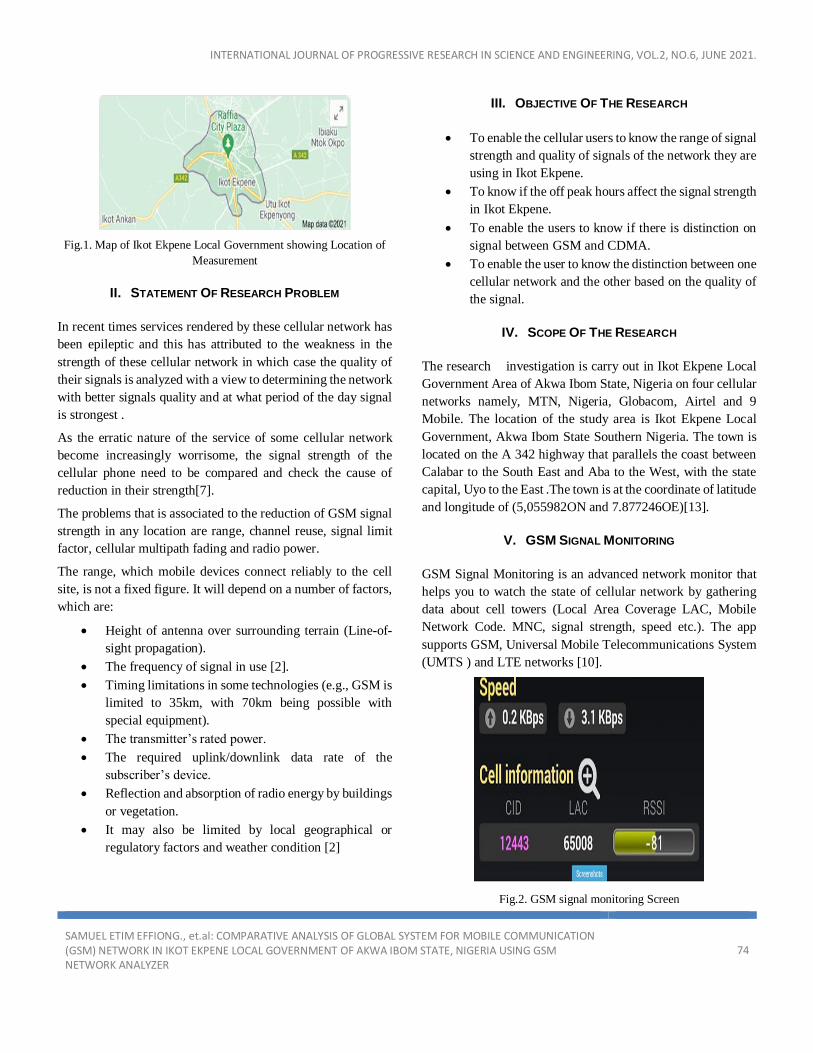
V. GSM SIGNAL MONITORING
GSM Signal Monitoring is an advanced network monitor that
helps you to watch the state of cellular network by gathering
data about cell towers (Local Area Coverage LAC, Mobile
Network Code. MNC, signal strength, speed etc.). The app
supports GSM, Universal Mobile Telecommunications System
(UMTS ) and LTE networks [10].
Fig.2. GSM signal monitoring Screen
INTERNATIONAL JOURNAL OF PROGRESSIVE RESEARCH IN SCIENCE AND ENGINEERING, VOL.2, NO.6, JUNE 2021.
SAMUEL ETIM EFFIONG., et.al: COMPARATIVE ANALYSIS OF GLOBAL SYSTEM FOR MOBILE COMMUNICATION (GSM) NETWORK IN IKOT EKPENE LOCAL GOVERNMENT OF AKWA IBOM STATE, NIGERIA USING GSM NETWORK ANALYZER
75
VI. TERMINOLOGY OF NETWORK CELL INFO LITE 3.12.5.1
APK VERSION
CID - A GSM Cell ID (CID) is a generally unique number used
to identify each Base transceiver station (BTS) or sector of a
BTS within a Location area code (LAC) if not within a GSM
network. In some cases, the first or last digit of CID represents
cells' Sector ID [3].
Value 0 is used for omnidirectional antenna.
Values 1, 2, 3 are used to identify sectors of tri-sector
or bisector antennas.
LAC- Location Area Code:
It is a set of base stations that are grouped together to optimize
signaling. Typically, tens or even hundreds of base stations
share a single Base Station Controller (BSC) in GSM, or a
Radio Network Controller (RNC) in UMTS, the intelligence
behind the base stations.
The BSC handles allocation of radio channels, receives
measurements from the mobile phones, and controls handovers
from base station to base station [12].
To each location area, a unique number called a "location area
code" is assigned. The location area code is broadcast by each
base station, known as a "base transceiver station" BTS in
GSM, or a Node B in UMTS, at regular intervals.
Routing Area:
The routing area is the packet-switched domain equivalent of
the location area. A "routing area" is normally a subdivision of
a "location area". Routing areas are used by mobiles, which are
GPRS-attached. GPRS is optimized for "bursty" data
communication services, such as wireless internet/intranet, and
multimedia services.
It is also known as GSM-IP ("Internet Protocol") because it will
connect users directly to Internet Service Providers.
HSPA- High Speed Packet Access:
Is an amalgamation of two mobile protocols, High Speed
Downlink Packet Access (HSDPA) and High Speed Uplink
Packet Access (HSUPA), that extends and improves the
performance of existing 3G mobile telecommunication
networks utilizing the WCDMA protocols [8].
UMTS - Universal Mobile Telecommunications System:
Is a third generation mobile cellular system for networks based
on the GSM standard. Developed and maintained by the 3GPP
(3rd Generation Partnership Project), UMTS is a component of
the International Telecommunications Union IMT-2000
standard set and compares with the CDMA2000 standard set
for networks based on the competing CDMA One technology.
UMTS uses wideband code division multiple access (W-
CDMA) radio access technology to offer greater spectral
efficiency and bandwidth to mobile network operators [8].
UMTS specifies a complete network system, which includes
the radio access network (UMTS Terrestrial Radio Access
Network, or UTRAN), the core network (Mobile Application
Part, or MAP) and the authentication of users via SIM
(subscriber identity module) cards.
The Radio Network Controller (or RNC) is a governing element
in the UMTS radio access network (UTRAN) and is responsible
for controlling the Node Bs that are connected to it. The RNC
carries out radio resource management, some of the mobility
management functions and is the point where encryption is
done before user data is sent to and from the mobile. The RNC
connects to the Circuit Switched Core Network through Media
Gateway (MGW) and to the SGSN (Serving GPRS Support
Node) in the Packet Switched Core Network [7].
RSSI- In telecommunications, received signal strength
indicator is a measurement of the power present in a received
radio signal. RSSI is usually invisible to a user of a receiving
device. However, because signal strength can vary greatly and
affect functionality in wireless networking, IEEE 802.11
devices often make the measurement available to users [2].
A mobile phone signal (also known as reception and service) is
the signal strength (measured in dBm) received by a mobile
phone from a cellular network (on the downlink). Depending
on various factors, such as proximity to a tower, any
obstructions such as buildings or trees, etc., this signal strength
will vary. Most mobile devices use a set of bars of increasing
height to display the approximate strength of this received
signal to the mobile phone user. [1]
ASU - Arbitrary Strength Unit:
Is an integer value proportional to the received signal strength
measured by the mobile phone. It is possible to calculate the
real signal strength measured in dBm (and thereby power in
Watts) by a formula. However, there are different formulas for
INTERNATIONAL JOURNAL OF PROGRESSIVE RESEARCH IN SCIENCE AND ENGINEERING, VOL.2, NO.6, JUNE 2021.
SAMUEL ETIM EFFIONG., et.al: COMPARATIVE ANALYSIS OF GLOBAL SYSTEM FOR MOBILE COMMUNICATION (GSM) NETWORK IN IKOT EKPENE LOCAL GOVERNMENT OF AKWA IBOM STATE, NIGERIA USING GSM NETWORK ANALYZER
76
2G, 3G and 4G networks. In GSM networks, ASU maps to
RSSI (received signal strength indicator)[5].
Received signal code power (RSCP):
In the UMTS cellular communication system, received signal
code power (RSCP) denotes the power measured by a receiver
on a particular physical communication channel. It is used as an
indication of signal strength, as a handover criterion, in
downlink power control, and to calculate path loss. In CDMA
systems, a physical channel corresponds to a particular
spreading code, hence the name (Received signal code power)
[3].
VII. RESEARCH METHODOLOGY
The material needed for analysis of signal strength include a
GSM Network Cell Info Lite monitor version 3.12.5. APK for
android (a software to monitor and analyze the received signal
strength indicator (RSSI) and quality of signal of cellular
network); laptops, android cell phones with SIM card, the
satellite mast that links cellular phone to their base stations and
the communication satellite in the orbit around the earth, metre
rule and clock.
VIII. METHOD OF DATA COLLECTION AND ANALYSIS
The data were collected by measuring the varying signal
strength in a repeated pattern to have accurate result. Four
different stations were picked within the study area. The
stations were the local government headquarters.
The D7 Techno android handset or mobile phone device was
set up at the height of 1.5 – 1.7 m above the ground. The signal
strength of MTN, Airtel, 9 Mobile and Globacom network were
measured simultaneously at a particular station, Android
mobile receiver from the base transceiver stations (BTS) at the
interval of one hour for 24 hours.
The software functions only with android phones at any time
the program is loaded, it automatically monitors and analyses
the corresponding data as specified by the administrator.
The results of the primary data were tabulated and subjected to
the Pearson Product Moment Correlation (PPMC) Statistical
analysis through statistical package for social scientist (SPSS).
And compared with each other to see the performance of each
of the GSM network operators in the study area. Microsoft
excel was used in generating graph plots of measured quantities
against time in hours.
The following analyses were carried out on these networks:
To find out how the quality of signal varies with signal
strength.
To find out if the signal strength is affected by peak
hour’s activities.
The signal strengths of these networks as they vary
with time.
To discover the hours of the day with higher level of
signal strength.
The quality of signal provided by these networks as
their signal strengths vary.
The mean signal strength and quality of signal for each
network.
The standard deviation in signal strength and quality
of signal for each network.
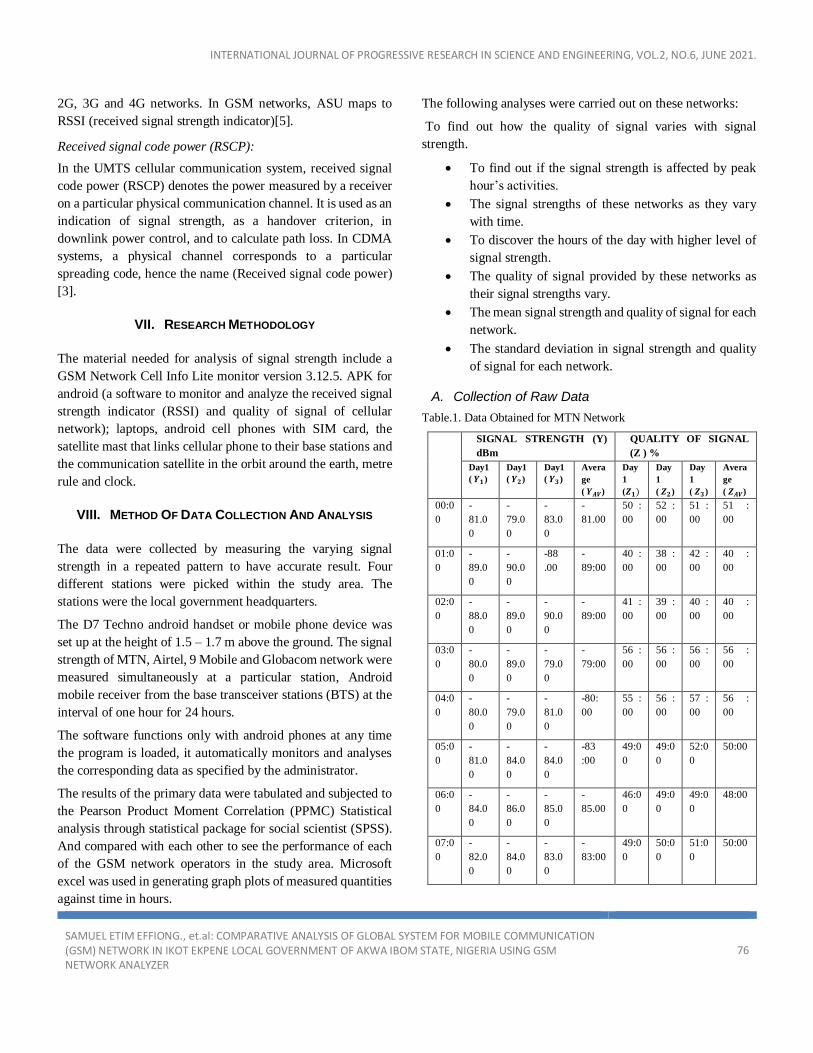
A. Collection of Raw Data
Table.1. Data Obtained for MTN Network
SIGNAL STRENGTH (Y)
dBm
QUALITY OF SIGNAL
(Z ) %
Day1
( 𝒀𝟏)
Day1
( 𝒀𝟐)
Day1
( 𝒀𝟑)
Avera
ge
( 𝒀𝑨𝑽)
Day
1
(𝒁𝟏)
Day
1
( 𝒁𝟐)
Day
1
( 𝒁𝟑)
Avera
ge
( 𝒁𝑨𝑽)
00:0
0
-
81.0
0
-
79.0
0
-
83.0
0
-
81.00
50 :
00
52 :
00
51 :
00
51 :
00
01:0
0
-
89.0
0
-
90.0
0
-88
.00
-
89:00
40 :
00
38 :
00
42 :
00
40 :
00
02:0
0
-
88.0
0
-
89.0
0
-
90.0
0
-
89:00
41 :
00
39 :
00
40 :
00
40 :
00
03:0
0
-
80.0
0
-
89.0
0
-
79.0
0
-
79:00
56 :
00
56 :
00
56 :
00
56 :
00
04:0
0
-
80.0
0
-
79.0
0
-
81.0
0
-80:
00
55 :
00
56 :
00
57 :
00
56 :
00
05:0
0
-
81.0
0
-
84.0
0
-
84.0
0
-83
:00
49:0
0
49:0
0
52:0
0
50:00
06:0
0
-
84.0
0
-
86.0
0
-
85.0
0
-
85.00
46:0
0
49:0
0
49:0
0
48:00
07:0
0
-
82.0
0
-
84.0
0
-
83.0
0
-
83:00
49:0
0
50:0
0
51:0
0
50:00
INTERNATIONAL JOURNAL OF PROGRESSIVE RESEARCH IN SCIENCE AND ENGINEERING, VOL.2, NO.6, JUNE 2021.
SAMUEL ETIM EFFIONG., et.al: COMPARATIVE ANALYSIS OF GLOBAL SYSTEM FOR MOBILE COMMUNICATION (GSM) NETWORK IN IKOT EKPENE LOCAL GOVERNMENT OF AKWA IBOM STATE, NIGERIA USING GSM NETWORK ANALYZER
77
08:0
0
-
83.0
0
-
86.0
0
-
86.0
0
-
85:00
47:0
0
49:0
0
48:0
0
48:00
09:0
0
-
85.0
0
-
86.0
0
-
87.0
0
-
86:00
45:0
0
46:0
0
47:0
0
46:00
10:0
0
-
85.0
0
-
86.0
0
-
84.0
0
-
85:00
48:0
0
48:0
0
48:0
0
48:00
11:0
0
-
86.0
0
-
87.0
0
-
85.0
0
-
86:00
46:0
0
47:0
0
45:0
0
46:00
12:0
0
-
87.0
0
-
86.0
0
-
88.0
0
-
87:00
45:0
0
45:0
0
45:0
0
45:00
13:0
0
-
86.0
0
-
85.0
0
-
87.0
0
-
86:00
47:0
0
48:0
0
43:0
0
46:00
14:0
0
-
87.0
0
-
78.0
0
-
80.0
0
-
79:00
54:0
0
57:0
0
57:0
0
56:00
15:0
0
-
86.0
0
-
86.0
0
-
86.0
0
-
86:00
47:0
0
46:0
0
45:0
0
46:00
16:0
0
-
100.
00
-
99.0
0
-
98.0
0
-
99:00
11:0
0
12:0
0
13:0
0
12:00
17:0
0
-
79.0
0
-
79.0
0
-
79.0
0
-
79:00
56:0
0
56:0
0
56:0
0
56:00
18:0
0
-
99.0
0
-
98.0
0
-
100.
00
-
99:00
12:0
0
12:0
0
12:0
0
12:00
19:0
0
-
77.0
0
-
76.0
0
-
78.0
0
-
77:00
65:0
0
65:0
0
65:0
0
65:00
20:0
0
-
83.0
0
-
83.0
0
-
83.0
0
-
83:00
51:0
0
50:0
0
49:0
0
50:00
21:0
0
-
91.0
0
-
88.0
0
-
88.0
0
-
89:00
41:0
0
41:0
0
38:0
0
40:00
22:0
0
-
93.0
0
-
96.0
0
-
96.0
0
-
95.00
26:0
0
27:0
0
28:0
0
27:00
23:0
0
-
99.0
0
-
100.
00
-
100.
00
-
100.0
0
08:0
0
06:0
0
07:0
0
07:00
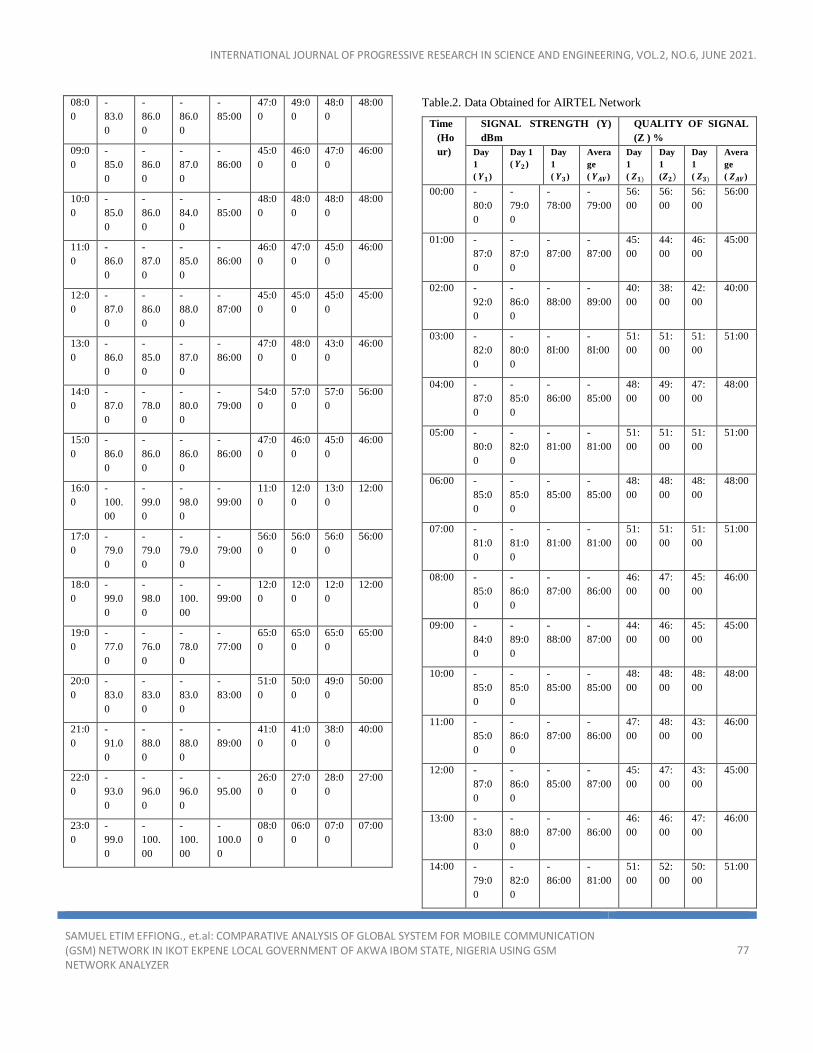
Table.2. Data Obtained for AIRTEL Network
Time
(Ho
ur)
SIGNAL STRENGTH (Y)
dBm
QUALITY OF SIGNAL
(Z ) %
Day
1
( 𝒀𝟏)
Day 1
( 𝒀𝟐)
Day
1
( 𝒀𝟑)
Avera
ge
( 𝒀𝑨𝑽)
Day
1
( 𝒁𝟏)
Day
1
(𝒁𝟐)
Day
1
( 𝒁𝟑)
Avera
ge
( 𝒁𝑨𝑽)
00:00 -
80:0
0
-
79:0
0
-
78:00
-
79:00
56:
00
56:
00
56:
00
56:00
01:00 -
87:0
0
-
87:0
0
-
87:00
-
87:00
45:
00
44:
00
46:
00
45:00
02:00 -
92:0
0
-
86:0
0
-
88:00
-
89:00
40:
00
38:
00
42:
00
40:00
03:00 -
82:0
0
-
80:0
0
-
8I:00
-
8I:00
51:
00
51:
00
51:
00
51:00
04:00 -
87:0
0
-
85:0
0
-
86:00
-
85:00
48:
00
49:
00
47:
00
48:00
05:00 -
80:0
0
-
82:0
0
-
81:00
-
81:00
51:
00
51:
00
51:
00
51:00
06:00 -
85:0
0
-
85:0
0
-
85:00
-
85:00
48:
00
48:
00
48:
00
48:00
07:00 -
81:0
0
-
81:0
0
-
81:00
-
81:00
51:
00
51:
00
51:
00
51:00
08:00 -
85:0
0
-
86:0
0
-
87:00
-
86:00
46:
00
47:
00
45:
00
46:00
09:00 -
84:0
0
-
89:0
0
-
88:00
-
87:00
44:
00
46:
00
45:
00
45:00
10:00 -
85:0
0
-
85:0
0
-
85:00
-
85:00
48:
00
48:
00
48:
00
48:00
11:00 -
85:0
0
-
86:0
0
-
87:00
-
86:00
47:
00
48:
00
43:
00
46:00
12:00 -
87:0
0
-
86:0
0
-
85:00
-
87:00
45:
00
47:
00
43:
00
45:00
13:00 -
83:0
0
-
88:0
0
-
87:00
-
86:00
46:
00
46:
00
47:
00
46:00
14:00 -
79:0
0
-
82:0
0
-
86:00
-
81:00
51:
00
52:
00
50:
00
51:00
INTERNATIONAL JOURNAL OF PROGRESSIVE RESEARCH IN SCIENCE AND ENGINEERING, VOL.2, NO.6, JUNE 2021.
SAMUEL ETIM EFFIONG., et.al: COMPARATIVE ANALYSIS OF GLOBAL SYSTEM FOR MOBILE COMMUNICATION (GSM) NETWORK IN IKOT EKPENE LOCAL GOVERNMENT OF AKWA IBOM STATE, NIGERIA USING GSM NETWORK ANALYZER
78
15:00 -
86:0
0
-
86:0
0
-
86:00
-
86:00
46:
00
46:
00
46:
00
46:00
16:00 -
100:
00
-
99:0
0
-
98:00
-
99:00
12:
00
13:
00
11:
00
12:00
17:00 -
103:
00
-
103:
00
-
103:0
0
-
103:0
0
05:
00
05:
00
04:
00
05:00
18:00 -
99:0
0
-
99:0
0
-
99:00
-
99:00
12:
00
12:
00
12:
00
12:00
19:00 -
92:0
0
-
97:0
0
-
96:00
-
95:00
27:
00
27:
00
27:
00
27:00
20:00 -
83:0
0
-
83:0
0
-
83:00
-
83:00
51:
00
51:
00
48:
00
50:00
21:00 -
89:0
0
-
89:0
0
-
89:00
-
89:00
40:
00
40:
00
40:
00
40:00
22:00 -
73:0
0
-
77:0
0
-
76:00
-
75:00
66:
00
67:
00
65:
00
66:00
23:00 -
78:0
0
-
76:0
0
-
77:00
-
77:00
65:
00
66:
00
64:
00
65:00
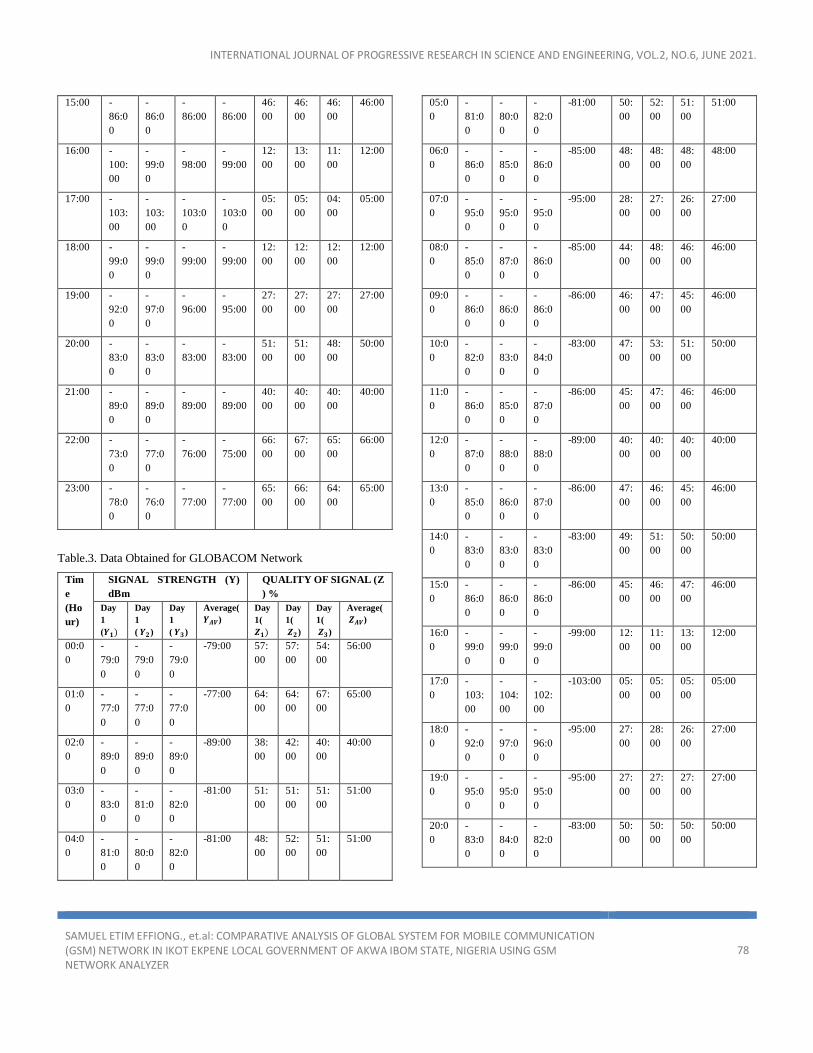
Table.3. Data Obtained for GLOBACOM Network
Tim
e
(Ho
ur)
SIGNAL STRENGTH (Y)
dBm
QUALITY OF SIGNAL (Z
) %
Day
1
(𝒀𝟏)
Day
1
( 𝒀𝟐)
Day
1
( 𝒀𝟑)
Average(
𝒀𝑨𝑽)
Day
1(
𝒁𝟏)
Day
1(
𝒁𝟐)
Day
1(
𝒁𝟑)
Average(
𝒁𝑨𝑽)
00:0
0
-
79:0
0
-
79:0
0
-
79:0
0
-79:00 57:
00
57:
00
54:
00
56:00
01:0
0
-
77:0
0
-
77:0
0
-
77:0
0
-77:00 64:
00
64:
00
67:
00
65:00
02:0
0
-
89:0
0
-
89:0
0
-
89:0
0
-89:00 38:
00
42:
00
40:
00
40:00
03:0
0
-
83:0
0
-
81:0
0
-
82:0
0
-81:00 51:
00
51:
00
51:
00
51:00
04:0
0
-
81:0
0
-
80:0
0
-
82:0
0
-81:00 48:
00
52:
00
51:
00
51:00
05:0
0
-
81:0
0
-
80:0
0
-
82:0
0
-81:00 50:
00
52:
00
51:
00
51:00
06:0
0
-
86:0
0
-
85:0
0
-
86:0
0
-85:00 48:
00
48:
00
48:
00
48:00
07:0
0
-
95:0
0
-
95:0
0
-
95:0
0
-95:00 28:
00
27:
00
26:
00
27:00
08:0
0
-
85:0
0
-
87:0
0
-
86:0
0
-85:00 44:
00
48:
00
46:
00
46:00
09:0
0
-
86:0
0
-
86:0
0
-
86:0
0
-86:00 46:
00
47:
00
45:
00
46:00
10:0
0
-
82:0
0
-
83:0
0
-
84:0
0
-83:00 47:
00
53:
00
51:
00
50:00
11:0
0
-
86:0
0
-
85:0
0
-
87:0
0
-86:00 45:
00
47:
00
46:
00
46:00
12:0
0
-
87:0
0
-
88:0
0
-
88:0
0
-89:00 40:
00
40:
00
40:
00
40:00
13:0
0
-
85:0
0
-
86:0
0
-
87:0
0
-86:00 47:
00
46:
00
45:
00
46:00
14:0
0
-
83:0
0
-
83:0
0
-
83:0
0
-83:00 49:
00
51:
00
50:
00
50:00
15:0
0
-
86:0
0
-
86:0
0
-
86:0
0
-86:00 45:
00
46:
00
47:
00
46:00
16:0
0
-
99:0
0
-
99:0
0
-
99:0
0
-99:00 12:
00
11:
00
13:
00
12:00
17:0
0
-
103:
00
-
104:
00
-
102:
00
-103:00 05:
00
05:
00
05:
00
05:00
18:0
0
-
92:0
0
-
97:0
0
-
96:0
0
-95:00 27:
00
28:
00
26:
00
27:00
19:0
0
-
95:0
0
-
95:0
0
-
95:0
0
-95:00 27:
00
27:
00
27:
00
27:00
20:0
0
-
83:0
0
-
84:0
0
-
82:0
0
-83:00 50:
00
50:
00
50:
00
50:00
INTERNATIONAL JOURNAL OF PROGRESSIVE RESEARCH IN SCIENCE AND ENGINEERING, VOL.2, NO.6, JUNE 2021.
SAMUEL ETIM EFFIONG., et.al: COMPARATIVE ANALYSIS OF GLOBAL SYSTEM FOR MOBILE COMMUNICATION (GSM) NETWORK IN IKOT EKPENE LOCAL GOVERNMENT OF AKWA IBOM STATE, NIGERIA USING GSM NETWORK ANALYZER
79
21:0
0
-
89:0
0
-
89:0
0
-
89:0
0
-89:00 40:
00
40:
00
40:
00
40:00
22:0
0
-
85:0
0
-
85:0
0
-
85:0
0
-85:00 50:
00
47:
00
47:
00
48:00
23:0
0
-
77:0
0
-
78:0
0
-
76:0
0
-77:00 67:
00
64:
00
64:
00
65:00
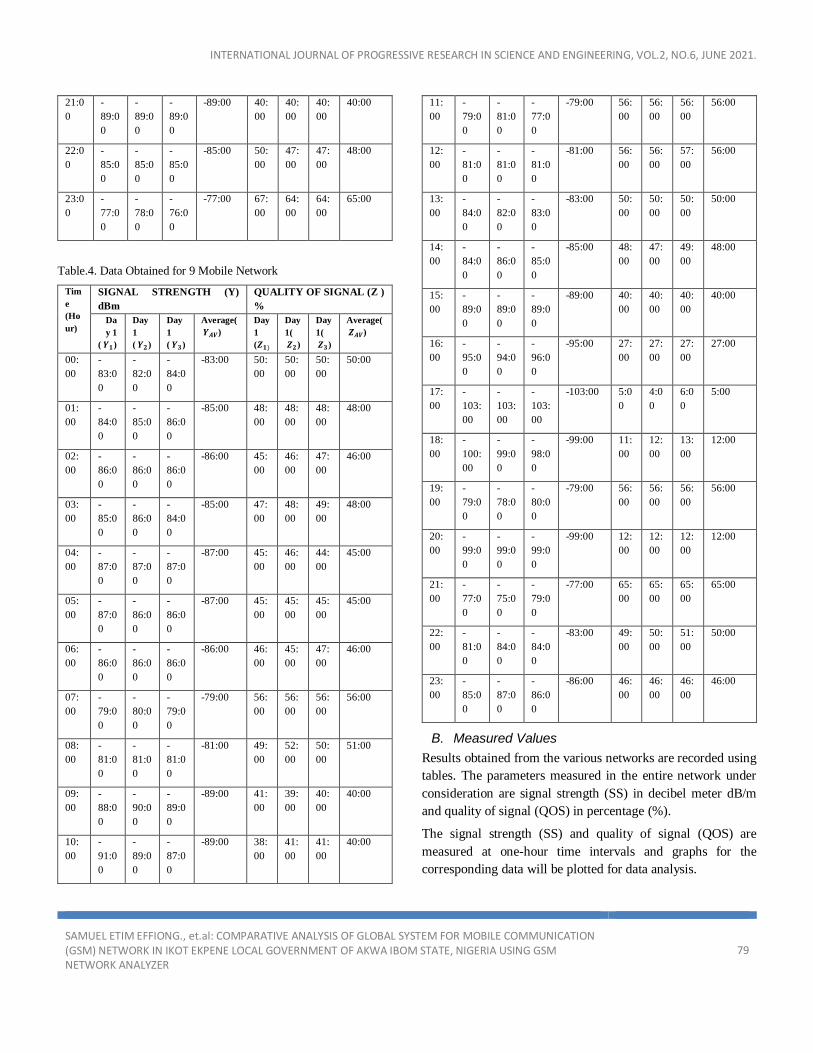
Table.4. Data Obtained for 9 Mobile Network
Tim
e
(Ho
ur)
SIGNAL STRENGTH (Y)
dBm
QUALITY OF SIGNAL (Z )
%
Da
y 1
( 𝒀𝟏)
Day
1
( 𝒀𝟐)
Day
1
( 𝒀𝟑)
Average(
𝒀𝑨𝑽)
Day
1
(𝒁𝟏)
Day
1(
𝒁𝟐)
Day
1(
𝒁𝟑)
Average(
𝒁𝑨𝑽)
00:
00
-
83:0
0
-
82:0
0
-
84:0
0
-83:00 50:
00
50:
00
50:
00
50:00
01:
00
-
84:0
0
-
85:0
0
-
86:0
0
-85:00 48:
00
48:
00
48:
00
48:00
02:
00
-
86:0
0
-
86:0
0
-
86:0
0
-86:00 45:
00
46:
00
47:
00
46:00
03:
00
-
85:0
0
-
86:0
0
-
84:0
0
-85:00 47:
00
48:
00
49:
00
48:00
04:
00
-
87:0
0
-
87:0
0
-
87:0
0
-87:00 45:
00
46:
00
44:
00
45:00
05:
00
-
87:0
0
-
86:0
0
-
86:0
0
-87:00 45:
00
45:
00
45:
00
45:00
06:
00
-
86:0
0
-
86:0
0
-
86:0
0
-86:00 46:
00
45:
00
47:
00
46:00
07:
00
-
79:0
0
-
80:0
0
-
79:0
0
-79:00 56:
00
56:
00
56:
00
56:00
08:
00
-
81:0
0
-
81:0
0
-
81:0
0
-81:00 49:
00
52:
00
50:
00
51:00
09:
00
-
88:0
0
-
90:0
0
-
89:0
0
-89:00 41:
00
39:
00
40:
00
40:00
10:
00
-
91:0
0
-
89:0
0
-
87:0
0
-89:00 38:
00
41:
00
41:
00
40:00
11:
00
-
79:0
0
-
81:0
0
-
77:0
0
-79:00 56:
00
56:
00
56:
00
56:00
12:
00
-
81:0
0
-
81:0
0
-
81:0
0
-81:00 56:
00
56:
00
57:
00
56:00
13:
00
-
84:0
0
-
82:0
0
-
83:0
0
-83:00 50:
00
50:
00
50:
00
50:00
14:
00
-
84:0
0
-
86:0
0
-
85:0
0
-85:00 48:
00
47:
00
49:
00
48:00
15:
00
-
89:0
0
-
89:0
0
-
89:0
0
-89:00 40:
00
40:
00
40:
00
40:00
16:
00
-
95:0
0
-
94:0
0
-
96:0
0
-95:00 27:
00
27:
00
27:
00
27:00
17:
00
-
103:
00
-
103:
00
-
103:
00
-103:00 5:0
0
4:0
0
6:0
0
5:00
18:
00
-
100:
00
-
99:0
0
-
98:0
0
-99:00 11:
00
12:
00
13:
00
12:00
19:
00
-
79:0
0
-
78:0
0
-
80:0
0
-79:00 56:
00
56:
00
56:
00
56:00
20:
00
-
99:0
0
-
99:0
0
-
99:0
0
-99:00 12:
00
12:
00
12:
00
12:00
21:
00
-
77:0
0
-
75:0
0
-
79:0
0
-77:00 65:
00
65:
00
65:
00
65:00
22:
00
-
81:0
0
-
84:0
0
-
84:0
0
-83:00 49:
00
50:
00
51:
00
50:00
23:
00
-
85:0
0
-
87:0
0
-
86:0
0
-86:00 46:
00
46:
00
46:
00
46:00
B. Measured Values
Results obtained from the various networks are recorded using
tables. The parameters measured in the entire network under
consideration are signal strength (SS) in decibel meter dB/m
and quality of signal (QOS) in percentage (%).
The signal strength (SS) and quality of signal (QOS) are
measured at one-hour time intervals and graphs for the
corresponding data will be plotted for data analysis.
INTERNATIONAL JOURNAL OF PROGRESSIVE RESEARCH IN SCIENCE AND ENGINEERING, VOL.2, NO.6, JUNE 2021.
SAMUEL ETIM EFFIONG., et.al: COMPARATIVE ANALYSIS OF GLOBAL SYSTEM FOR MOBILE COMMUNICATION (GSM) NETWORK IN IKOT EKPENE LOCAL GOVERNMENT OF AKWA IBOM STATE, NIGERIA USING GSM NETWORK ANALYZER
80
IX. RESULT ANALYSIS
The result analysis is done using statistical tool subjected to
pearson product moment correlation (PPMC) statistical
analysis through Statistical package for social scientist (SPSS).
A. PPMC Analysis Summary for MTN Network in Ikot
Ekpene Local Government Area (L.G.A) Akwa Ibom
State
Table.5. Summary of PPMC analysis of the relationship between
average signal strength (Y) and average quality of signal (Z) for
MTN Nigeria Ikot Ekpene L.G.A
WHERE 95% ACCURACY P ≤ 0.05
DEGREE OF FREEDOM DF = 23
RELIABILITY OF COEFFICIENT R = 0.4227
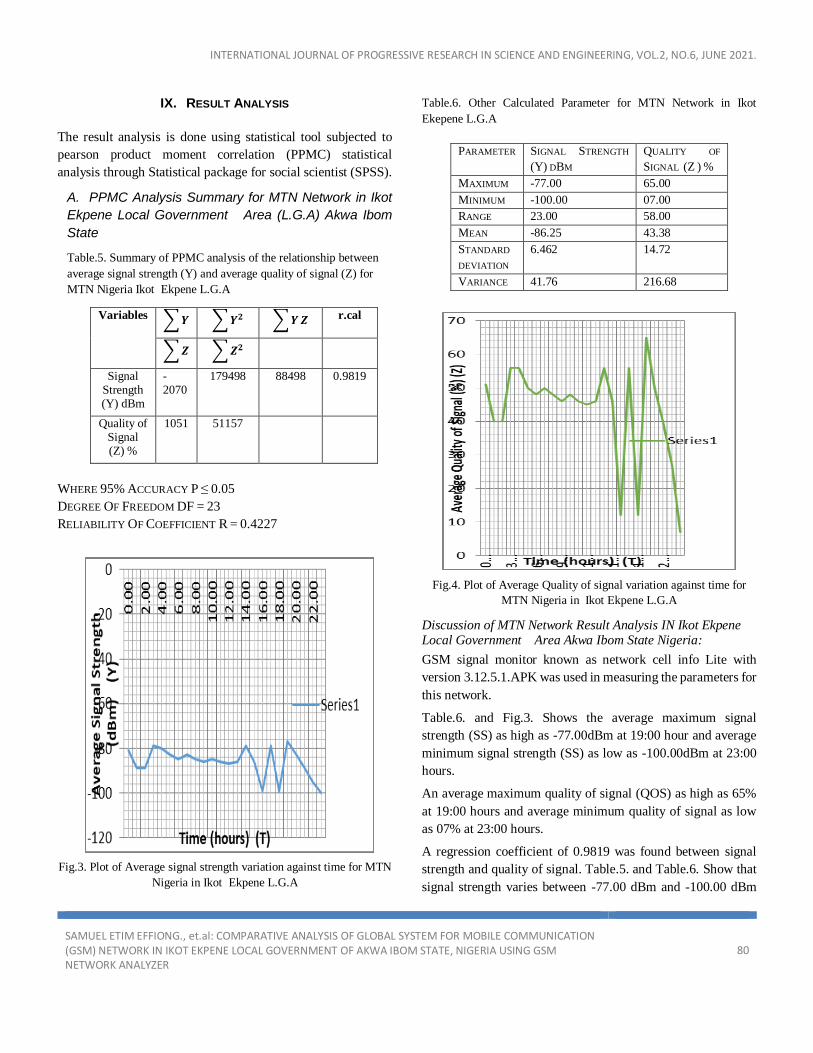
Fig.3. Plot of Average signal strength variation against time for MTN
Nigeria in Ikot Ekpene L.G.A
Table.6. Other Calculated Parameter for MTN Network in Ikot
Ekepene L.G.A
PARAMETER SIGNAL STRENGTH
(Y) DBM
QUALITY OF
SIGNAL (Z ) %
MAXIMUM -77.00 65.00
MINIMUM -100.00 07.00
RANGE 23.00 58.00
MEAN -86.25 43.38
STANDARD
DEVIATION
6.462 14.72
VARIANCE 41.76 216.68
Fig.4. Plot of Average Quality of signal variation against time for
MTN Nigeria in Ikot Ekpene L.G.A
Discussion of MTN Network Result Analysis IN Ikot Ekpene Local Government Area Akwa Ibom State Nigeria:
GSM signal monitor known as network cell info Lite with
version 3.12.5.1.APK was used in measuring the parameters for
this network.
Table.6. and Fig.3. Shows the average maximum signal
strength (SS) as high as -77.00dBm at 19:00 hour and average
minimum signal strength (SS) as low as -100.00dBm at 23:00
hours.
An average maximum quality of signal (QOS) as high as 65%
at 19:00 hours and average minimum quality of signal as low
as 07% at 23:00 hours.
A regression coefficient of 0.9819 was found between signal
strength and quality of signal. Table.5. and Table.6. Show that
signal strength varies between -77.00 dBm and -100.00 dBm
Variables ∑ 𝒀 ∑ 𝒀𝟐 ∑ 𝒀 𝒁 r.cal
∑ 𝒁 ∑ 𝒁𝟐
Signal Strength (Y) dBm
-2070
179498 88498 0.9819
Quality of Signal (Z) %
1051 51157
INTERNATIONAL JOURNAL OF PROGRESSIVE RESEARCH IN SCIENCE AND ENGINEERING, VOL.2, NO.6, JUNE 2021.
SAMUEL ETIM EFFIONG., et.al: COMPARATIVE ANALYSIS OF GLOBAL SYSTEM FOR MOBILE COMMUNICATION (GSM) NETWORK IN IKOT EKPENE LOCAL GOVERNMENT OF AKWA IBOM STATE, NIGERIA USING GSM NETWORK ANALYZER
81
while quality of signal vary between 65% and 07%. The figure
also shows a more consistency period between the hours of
01:00 and 02:00.
The regression coefficient obtained from the analysis in table.6.
It was found to be significant when compared to the critical
value of 0.4227 at 0.05 level of accuracy with 23 degree of
freedom (DF). This shows a high positive relationship between
signal strength and quality of for MNT network.
B. PPMC ANALYSIS SUMMARY FOR AIRTEL NETWORK IN
IKOT EKPENE LOCAL GOVERNMENT AREA (L.G.A) AKWA
IBOM STATE
Table.7. Summary of PPMC analysis of the relationship between
average signal strength (Y) and average quality of signal (Z) for
AIRTEL Nigeria Ikot Ekpene L.G.A
Where 95% accuracy P ≤ 0.05
Degree of freedom DF = 23
Reliability of coefficient R = 0.4227
Table.8. Other Calculated Parameter for AIRTEL Network in Ikot
Ekepene L.G.A
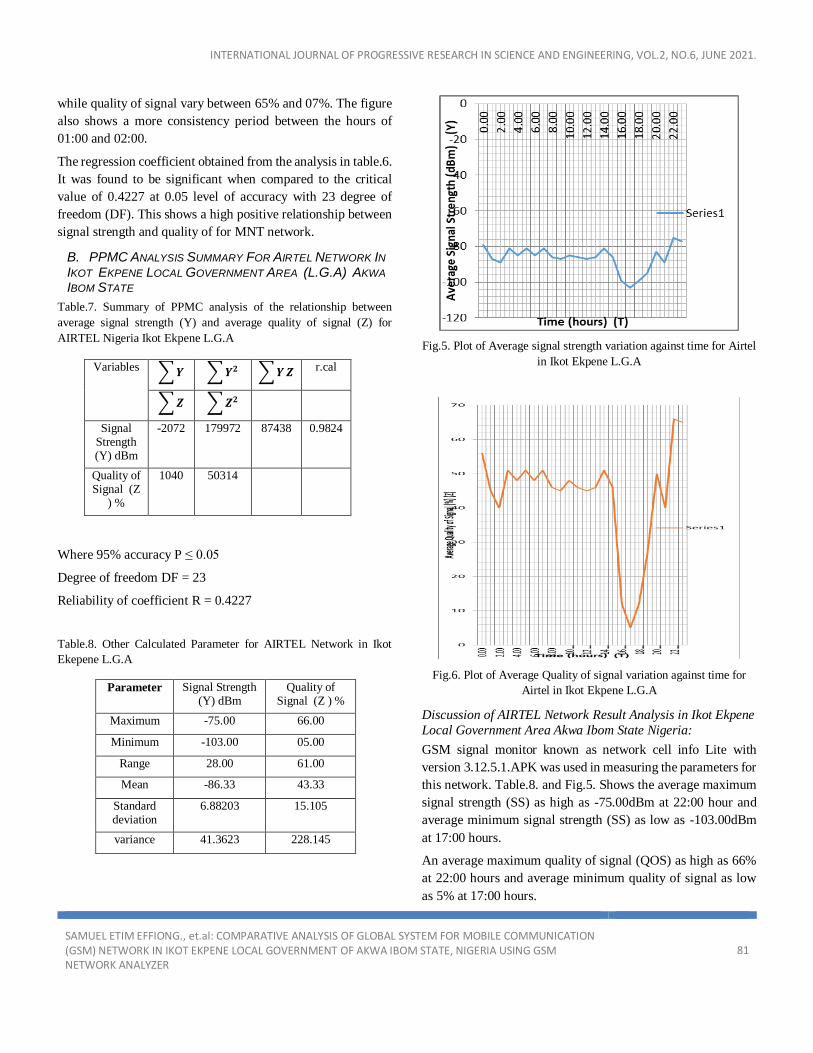
Fig.5. Plot of Average signal strength variation against time for Airtel
in Ikot Ekpene L.G.A
Fig.6. Plot of Average Quality of signal variation against time for
Airtel in Ikot Ekpene L.G.A
Discussion of AIRTEL Network Result Analysis in Ikot Ekpene
Local Government Area Akwa Ibom State Nigeria:
GSM signal monitor known as network cell info Lite with
version 3.12.5.1.APK was used in measuring the parameters for
this network. Table.8. and Fig.5. Shows the average maximum
signal strength (SS) as high as -75.00dBm at 22:00 hour and
average minimum signal strength (SS) as low as -103.00dBm
at 17:00 hours.
An average maximum quality of signal (QOS) as high as 66%
at 22:00 hours and average minimum quality of signal as low
as 5% at 17:00 hours.
Variables ∑ 𝒀 ∑ 𝒀𝟐 ∑ 𝒀 𝒁 r.cal
∑ 𝒁 ∑ 𝒁𝟐
Signal Strength (Y) dBm
-2072 179972 87438 0.9824
Quality of Signal (Z
) %
1040 50314
Parameter Signal Strength (Y) dBm
Quality of Signal (Z ) %
Maximum -75.00 66.00
Minimum -103.00 05.00
Range 28.00 61.00
Mean -86.33 43.33
Standard deviation
6.88203 15.105
variance 41.3623 228.145
INTERNATIONAL JOURNAL OF PROGRESSIVE RESEARCH IN SCIENCE AND ENGINEERING, VOL.2, NO.6, JUNE 2021.
SAMUEL ETIM EFFIONG., et.al: COMPARATIVE ANALYSIS OF GLOBAL SYSTEM FOR MOBILE COMMUNICATION (GSM) NETWORK IN IKOT EKPENE LOCAL GOVERNMENT OF AKWA IBOM STATE, NIGERIA USING GSM NETWORK ANALYZER
82
A regression coefficient of 0.9824 was obtained from the
analysis as seen in table.7. It was found to be significant when
compared to the critical value of 0.4227 at 0.05 accuracy with
23 degree of freedom. This reveal a high positive relationship
between signal strength and quality signal for Airtel network.
Observing fig.5. And Fig.6. Reveals that signal strength varies
between -77.00 dBm and -103.00 dBm while quality of signal
vary between 5% and 65%.
C. PPMC Analysis Summary for GLOBACOM Network
in Ikot Ekpene Local Government Area (L.G.A) Akwa
Ibom State
Table.9. Summary of PPMC analysis of the relationship between
average signal strength(Y) and average quality of signal (Z) for
GLOBACOM Nigeria Ikot Ekpene L.G.A
Where 95% accuracy P ≤ 0.05
Degree of freedom DF = 23
Reliability of coefficient R = 0.4227
Table.10. Other Calculated Parameter for GLOBACOM Network in
Ikot Ekepene L.G.A
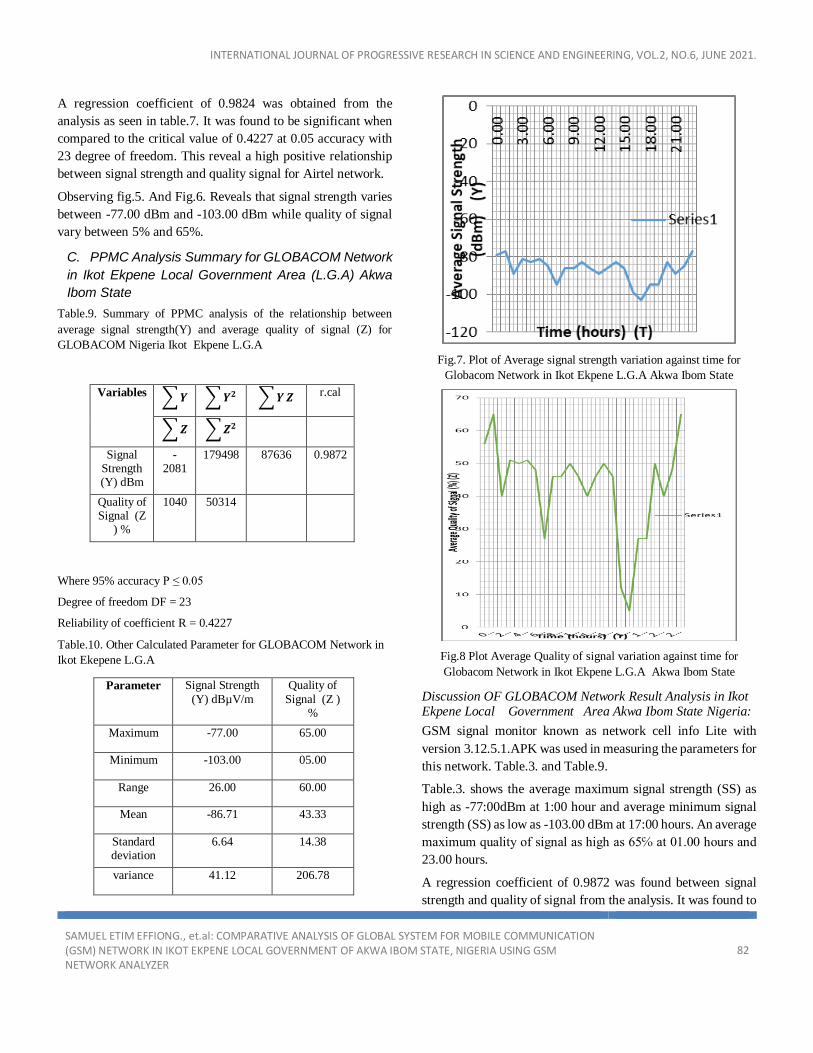
Fig.7. Plot of Average signal strength variation against time for
Globacom Network in Ikot Ekpene L.G.A Akwa Ibom State
Fig.8 Plot Average Quality of signal variation against time for
Globacom Network in Ikot Ekpene L.G.A Akwa Ibom State
Discussion OF GLOBACOM Network Result Analysis in Ikot Ekpene Local Government Area Akwa Ibom State Nigeria:
GSM signal monitor known as network cell info Lite with
version 3.12.5.1.APK was used in measuring the parameters for
this network. Table.3. and Table.9.
Table.3. shows the average maximum signal strength (SS) as
high as -77:00dBm at 1:00 hour and average minimum signal
strength (SS) as low as -103.00 dBm at 17:00 hours. An average
maximum quality of signal as high as 65℅ at 01.00 hours and
23.00 hours.
A regression coefficient of 0.9872 was found between signal
strength and quality of signal from the analysis. It was found to
Variables ∑ 𝒀 ∑ 𝒀𝟐 ∑ 𝒀 𝒁 r.cal
∑ 𝒁 ∑ 𝒁𝟐
Signal Strength (Y) dBm
-2081
179498 87636 0.9872
Quality of Signal (Z
) %
1040 50314
Parameter Signal Strength
(Y) dBµV/m
Quality of
Signal (Z ) %
Maximum -77.00 65.00
Minimum -103.00 05.00
Range 26.00 60.00
Mean -86.71 43.33
Standard deviation
6.64 14.38
variance 41.12 206.78
INTERNATIONAL JOURNAL OF PROGRESSIVE RESEARCH IN SCIENCE AND ENGINEERING, VOL.2, NO.6, JUNE 2021.
SAMUEL ETIM EFFIONG., et.al: COMPARATIVE ANALYSIS OF GLOBAL SYSTEM FOR MOBILE COMMUNICATION (GSM) NETWORK IN IKOT EKPENE LOCAL GOVERNMENT OF AKWA IBOM STATE, NIGERIA USING GSM NETWORK ANALYZER
83
be significant when compared to the critical reliability
coefficient of 0.4227 at 0.05 with degree of freedom of 23. This
reveal a high positive relationship between signal strength and
quality of signal for Globacom network.
Fig.7. and 8 shows that the range for signal strength varies
between -77.00 dBm and -77.00 dBm ,while that of quality of
signal is 65%. The figures also show a more consistency period
between 08:00 – 09:00 hours and 18:00 -19:00 hours.
D. PPMC Analysis Summary For ETISALAT Network In Ikot Ekpene Local Government Area (L.G.A) Akwa Ibom State
Table.11. Summary of PPMC analysis of the relationship between
average signal strength (Y) and average quality of signal (Z) for
9Mobile Nigeria Ikot Ekpene L.G.A
Where 95% accuracy P ≤ 0.05
Degree of freedom df = 23
Reliability of coefficient r = 0.4227
Table.12. Other Calculated Parameter for 9Mobile Network in Ikot
Ekepene L.G.A
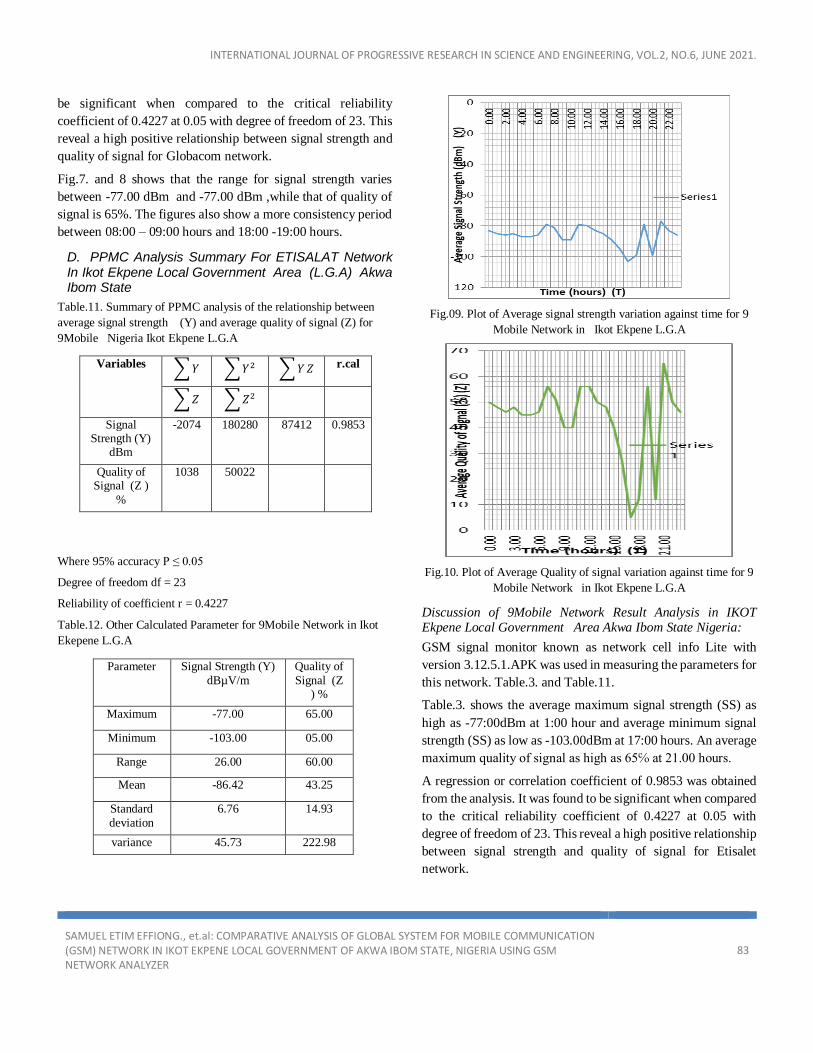
Fig.09. Plot of Average signal strength variation against time for 9
Mobile Network in Ikot Ekpene L.G.A
Fig.10. Plot of Average Quality of signal variation against time for 9
Mobile Network in Ikot Ekpene L.G.A
Discussion of 9Mobile Network Result Analysis in IKOT Ekpene Local Government Area Akwa Ibom State Nigeria:
GSM signal monitor known as network cell info Lite with
version 3.12.5.1.APK was used in measuring the parameters for
this network. Table.3. and Table.11.
Table.3. shows the average maximum signal strength (SS) as
high as -77:00dBm at 1:00 hour and average minimum signal
strength (SS) as low as -103.00dBm at 17:00 hours. An average
maximum quality of signal as high as 65℅ at 21.00 hours.
A regression or correlation coefficient of 0.9853 was obtained
from the analysis. It was found to be significant when compared
to the critical reliability coefficient of 0.4227 at 0.05 with
degree of freedom of 23. This reveal a high positive relationship
between signal strength and quality of signal for Etisalet
network.
Variables ∑ 𝑌 ∑ 𝑌2 ∑ 𝑌 𝑍 r.cal
∑ 𝑍 ∑ 𝑍2
Signal Strength (Y)
dBm
-2074 180280 87412 0.9853
Quality of Signal (Z )
%
1038 50022
Parameter Signal Strength (Y)
dBµV/m
Quality of
Signal (Z ) %
Maximum -77.00 65.00
Minimum -103.00 05.00
Range 26.00 60.00
Mean -86.42 43.25
Standard
deviation
6.76 14.93
variance 45.73 222.98

INTERNATIONAL JOURNAL OF PROGRESSIVE RESEARCH IN SCIENCE AND ENGINEERING, VOL.2, NO.6, JUNE 2021.
SAMUEL ETIM EFFIONG., et.al: COMPARATIVE ANALYSIS OF GLOBAL SYSTEM FOR MOBILE COMMUNICATION (GSM) NETWORK IN IKOT EKPENE LOCAL GOVERNMENT OF AKWA IBOM STATE, NIGERIA USING GSM NETWORK ANALYZER
84
Fig.9. and 10 shows that the range for signal strength varies
between -77.00 dBm and -103.00 dBm, while that of quality of
signal varies between 5% to 65%.
Fig.11. Average Signal Strength Variation with time for four (4)
Networks
Table.13. Average Signal Strength Variation with Time for the four
(4) Networks
Time
(hours)
(T)
Signal
Strength
(dBm)(Y)
for MTN
Signal
Strength
(dBm)(Y)
for
AIRTEL
Signal
Strength
(dBm)(Y)
for GLO
Signal
Strength
(dBm)(Y)
for 9
MOBILE
00.00 -81.00 -79.00 -79.00 -83.00
01.00 -89.00 -87.00 -77.00 -85.00
02.00 -89.00 -89.00 -89.00 -86.00
03.00 -79.00 -81.00 -81.00 -85.00
04.00 -80.00 -85.00 -83.00 -87.00
05.00 -83.00 -81.00 -81.00 -87.00
06.00 -85.00 -85.00 -85.00 -86.00
07.00 -83.00 -81.00 -95.00 -79.00
08.00 -85.00 -86.00 -86.00 -81.00
09.00 -86.00 -87.00 -86.00 -89.00
10.00 -85.00 -85.00 -83.00 -89.00
11.00 -86.00 -86.00 -86.00 -79.00
12.00 -87.00 -87.00 -89.00 -80.00
13.00 -86.00 -86.00 -86.00 -83.00
14.00 -79.00 -81.00 -83.00 -85.00
15.00 -86.00 -86.00 -86.00 -89.00
16.00 -99.00 -99.00 -99.00 -95.00
17.00 -79.00 -103.00 -103.00 -103.00
18.00 -99.00 -99.00 -95.00 -99.00
19.00 -77.00 -95.00 -95.00 -79.00
20.00 -83.00 -83.00 -83.00 -99.00
21.00 -89.00 -89.00 -89.00 -77.00
22.00 -95.00 -75.00 -85.00 -83.00
23.00 -100.00 -77.00 -77.00 -86.00
Table.14. Average Quality of Signal Variation with time for the four
(4) Networks
Time
(hours)
(T)
Quality of
Signal (%)
(Z) for
MTN
Quality of
Signal (%)
(Z) for
AIRTEL
Quality of
Signal
(%)(Z)
for GLO
Quality of
Signal
(%)(Z)
for 9MOBILE
00.00 51.00 56.00 56.00 50.00
01.00 40.00 45.00 65.00 48.00
02.00 40.00 40.00 40.00 46.00
03.00 56.00 51.00 51.00 48.00
04.00 56.00 48.00 50.00 45.00
05.00 50.00 51.00 51.00 45.00
06.00 48.00 48.00 48.00 46.00
07.00 50.00 51.00 27.00 56.00
08.00 48.00 46.00 46.00 51.00
09.00 46.00 45.00 46.00 40.00
10.00 48.00 48.00 50.00 40.00
11.00 46.00 46.00 46.00 56.00
12.00 45.00 45.00 40.00 56.00
13.00 46.00 46.00 46.00 50.00
14.00 56.00 51.00 50.00 48.00
15.00 46.00 46.00 46.00 40.00
16.00 12.00 12.00 12.00 27.00
17.00 56.00 05.00 05.00 05.00
18.00 12.00 12.00 27.00 12.00
-120
-100
-80
-60
-40
-20
0
0.00 1.00 2.00 3.00 4.00 5.00 6.00 7.00 8.00 9.00 10.00 11.00 12.00 13.00 14.00 15.00 16.00 17.00 18.00 19.00 20.00 21.00 22.00 23.00
Ave
rage S
ignal Str
ength
(d
Bµv/
m)
Time (hours)
Quality of Services (%) (Z) for MTN Quality of Services (%) (Z) for AIRTEL
Quality of Services (%)(Z) for GLO Quality of Services (%)(Z) for ETISALAT
INTERNATIONAL JOURNAL OF PROGRESSIVE RESEARCH IN SCIENCE AND ENGINEERING, VOL.2, NO.6, JUNE 2021.
SAMUEL ETIM EFFIONG., et.al: COMPARATIVE ANALYSIS OF GLOBAL SYSTEM FOR MOBILE COMMUNICATION (GSM) NETWORK IN IKOT EKPENE LOCAL GOVERNMENT OF AKWA IBOM STATE, NIGERIA USING GSM NETWORK ANALYZER
85
19.00 65.00 27.00 27.00 56.00
20.00 50.00 50.00 50.00 12.00
21.00 40.00 40.00 40.00 65.00
22.00 27.00 66.00 48.00 50.00
23.00 07.00 65.00 65.00 46.00
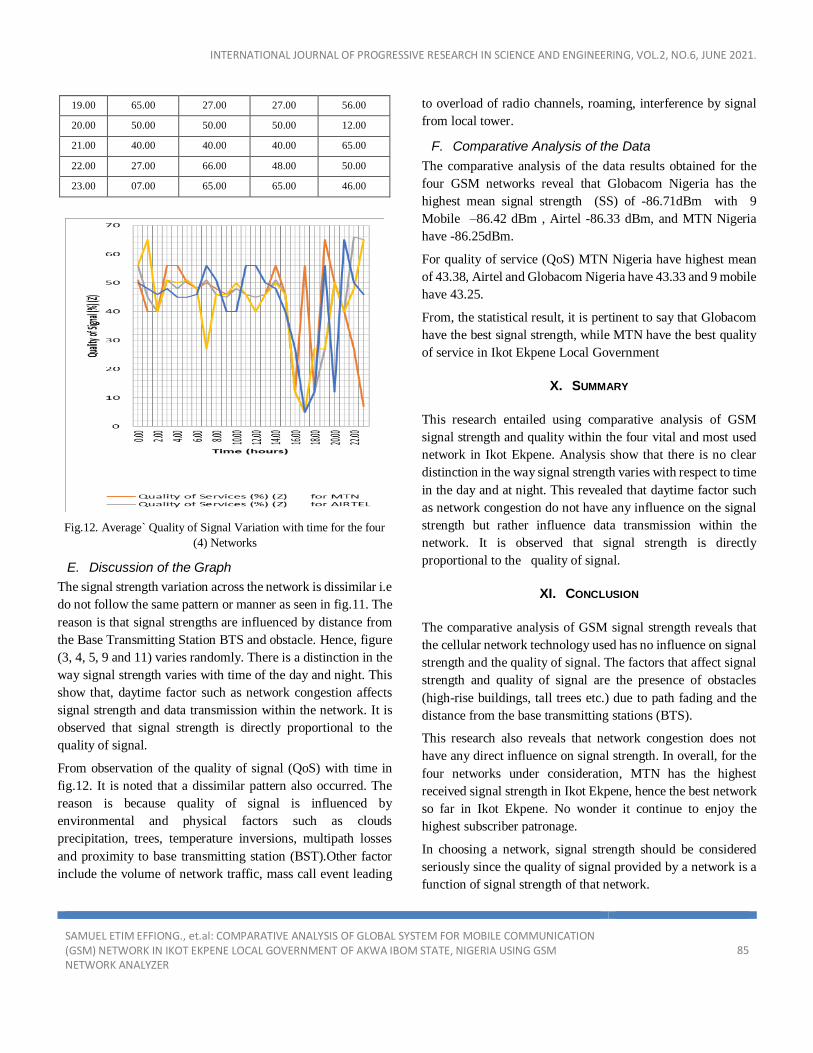
Fig.12. Average` Quality of Signal Variation with time for the four
(4) Networks
E. Discussion of the Graph
The signal strength variation across the network is dissimilar i.e
do not follow the same pattern or manner as seen in fig.11. The
reason is that signal strengths are influenced by distance from
the Base Transmitting Station BTS and obstacle. Hence, figure
(3, 4, 5, 9 and 11) varies randomly. There is a distinction in the
way signal strength varies with time of the day and night. This
show that, daytime factor such as network congestion affects
signal strength and data transmission within the network. It is
observed that signal strength is directly proportional to the
quality of signal.
From observation of the quality of signal (QoS) with time in
fig.12. It is noted that a dissimilar pattern also occurred. The
reason is because quality of signal is influenced by
environmental and physical factors such as clouds
precipitation, trees, temperature inversions, multipath losses
and proximity to base transmitting station (BST).Other factor
include the volume of network traffic, mass call event leading
to overload of radio channels, roaming, interference by signal
from local tower.
F. Comparative Analysis of the Data
The comparative analysis of the data results obtained for the
four GSM networks reveal that Globacom Nigeria has the
highest mean signal strength (SS) of -86.71dBm with 9
Mobile –86.42 dBm , Airtel -86.33 dBm, and MTN Nigeria
have -86.25dBm.
For quality of service (QoS) MTN Nigeria have highest mean
of 43.38, Airtel and Globacom Nigeria have 43.33 and 9 mobile
have 43.25.
From, the statistical result, it is pertinent to say that Globacom
have the best signal strength, while MTN have the best quality
of service in Ikot Ekpene Local Government
X. SUMMARY
This research entailed using comparative analysis of GSM
signal strength and quality within the four vital and most used
network in Ikot Ekpene. Analysis show that there is no clear
distinction in the way signal strength varies with respect to time
in the day and at night. This revealed that daytime factor such
as network congestion do not have any influence on the signal
strength but rather influence data transmission within the
network. It is observed that signal strength is directly
proportional to the quality of signal.
XI. CONCLUSION
The comparative analysis of GSM signal strength reveals that
the cellular network technology used has no influence on signal
strength and the quality of signal. The factors that affect signal
strength and quality of signal are the presence of obstacles
(high-rise buildings, tall trees etc.) due to path fading and the
distance from the base transmitting stations (BTS).
This research also reveals that network congestion does not
have any direct influence on signal strength. In overall, for the
four networks under consideration, MTN has the highest
received signal strength in Ikot Ekpene, hence the best network
so far in Ikot Ekpene. No wonder it continue to enjoy the
highest subscriber patronage.
In choosing a network, signal strength should be considered
seriously since the quality of signal provided by a network is a
function of signal strength of that network.
INTERNATIONAL JOURNAL OF PROGRESSIVE RESEARCH IN SCIENCE AND ENGINEERING, VOL.2, NO.6, JUNE 2021.
SAMUEL ETIM EFFIONG., et.al: COMPARATIVE ANALYSIS OF GLOBAL SYSTEM FOR MOBILE COMMUNICATION (GSM) NETWORK IN IKOT EKPENE LOCAL GOVERNMENT OF AKWA IBOM STATE, NIGERIA USING GSM NETWORK ANALYZER
86
REFERENCES
[1]. Andrea, F. (2020). History of the International
Telecommunication Union (ITU). First Edition, De Gruyter
Oldenbourg Publisher.
[2]. Berlo, D.K. (2009). The Process of Communication, New
York, Holt, Rinehart and Winston, USA.
[3]. Covind, P. A. (2019). Nonlinear Fiber Optics. 6th Edition,
Academic Press Publisher.
[4]. Ette, E.U. (2009). Colonialism and Acculturative Stress among
the Annang of Nigeria. Indiana Xlibris Press.
[5]. Freeman, R.L. (2013). Fundamentals of
Telecommunications. John Wiley and Sons. Second Edition.
[6]. Fasio, C. and Antonio, D. (2019). Photonic Applications for
Radio System and Networks. Artech House Publisher.
[7]. Forouzan, B.A. (2007). Data Communication and Networking.
Fourth Edition. Singapore.
[8]. Glistic, S.G and Leppanen, A. (2013). Wireless
Communication TDMA versus CDMA Springerverlog,
New York Inc.
[9]. Jacob, O. E. (2019). Telecommunication Law and Practice in
Nigeria: Perspective on Consumer Protection. Malthouse
Press.
[10]. Khan, F. (2009). LTE for 4G Mobile Broad band .Cambridge
University Press.
[11]. Noah, Effiong (1988). Minutes of the Ibibio State Union, Uyo,
Modern Business Press.
[12]. Sajal, K. D. (2010). Mobile Handset Design. John Wiley &
Sons. Texas, USA.
[13]. Udo. E.U. (1993).The History of the Annang People, Calabar,
Nigeria. Apcon Press Ltd.