Embed Size (px)
Citation preview

COMPANY UPDATE 07 JUN 2018
Hindustan Unilever BUY
HDFC securities Institutional Research is also available on Bloomberg HSLB <GO>& Thomson Reuters
Disruptor, not disrupted We attended HUL’s annual investor meet. Our interaction with the company’s senior management has further increased our confidence on its earnings trajectory over the next two to three years. After outperforming in FY18, HUL has ‘re-imagined’ strategy for the next leg of growth. Focus is now moving towards ‘big data analytics’ so as to (1) Know the consumer better, (2) Become glocal, (3) Enhance the supply chain, (4) Target marketing (digital) and (5) Drive cost savings. HUL’s core strategy revolves around premiumisation, market development, penetrate channels of the future and strengthening its core portfolio. Its five anchor brands (Lifebuoy, F&L, Surf Excel, Wheel, Brooke Bond) are >Rs 20bn and another 7 brands are >Rs 10bn. HUL has a very balanced portfolio of core and aspirational brands, which have a presence across the consumption pyramid. Core strategy remains unchanged but we sense an aspiration to be more agile on execution. Consistent market
development and share gains have been the result of superior execution. Our call on HUL over FY18 was that strong leadership and superior execution would drive gains in a challenging period (demonet and GST). Macro tailwinds are now kicking in (rising rural incomes, normal monsoon, faster GDP growth, GST) ergo HUL should gain further. This also makes HUL a safe hedge against rising volatility in Indian markets.
Net net, high valuations are justified, considering consistent market share gain, margin expansion and a hungry management not willing to lower its guard. Our TP rises to Rs 1,701 on 45x Jun-20E EPS (earlier Mar-20). Maintain BUY. Near-term outlook: With improving macros, greater
pricing power (GST rate revision) and moderate inflation, we believe earnings growth will continue to be strong. We recommend investors to look at the company’s long term potential.
Financial Summary (Consolidated) (Rs mn) FY17 FY18 FY19E FY20E FY21E Net Revenue 3,31,620 3,55,450 4,03,433 4,57,915 5,19,715 EBITDA 63,396 74,989 89,433 1,06,579 1,25,042 APAT 19,770 20,790 25,940 30,689 35,926 EPS (Rs) 19.6 23.7 29.4 35.6 42.7 P/E (x) 80.1 66.3 53.6 44.2 36.8 EV/EBITDA (x) 52.9 44.5 37.1 31.0 26.2 Core RoCE (%) 61.4 70.5 78.4 81.0 80.7 Source: Company, HDFC sec Inst Research
INDUSTRY FMCG
CMP (as on 6 Jun 2018) Rs 1,571
Target Price Rs 1,701
Nifty 10,685
Sensex 35,179
KEY STOCK DATA Bloomberg HUVR IN
No. of Shares (mn) 2,165
MCap (Rs bn)/(US$ mn) 3,401/50,786
6m avg traded value (Rs mn) 1,692
STOCK PERFORMANCE (%)
52 Week high / low Rs 1,625 / 1,064
3M 6M 12M
Absolute (%) 21.5 23.2 43.9
Relative (%) 15.9 15.2 31.2
SHAREHOLDING PATTERN (%)
Promoters 67.20
FIs & Local MFs 5.66
FPIs 13.26
Public & Others 13.88 Source : BSE
Naveen Trivedi [email protected] +91-22-6171-7324
Siddhant Chhabria [email protected] +91-22-6171-7336

HUL: COMPANY UPDATE
Page | 2
FMCG continues to be a big opportunity in India
To capitalise on this opportunity and compete in an age of disruption, HUL re-imagines its strategy HUL believes that in an age of disruption it is crucial to be consumer centric and agile to react to changing trends (GST, naturals, digitisation etc). After outperforming in FY18, they re-imagine their strategy for the next leg of growth. We observed that the crux of their focus is now moving towards technology so as to (1) know the consumer better, (2) become glocal, (3) enhance supply chain, (4) target marketing and (5) drive cost savings
(1) Re-imagining the structure KEY THRUSTS ACTION/COVERAGE Winning in Many Indias (WIMI) Cluster level strategy, empowering cluster heads for faster decision making Building a culture for long term growth Build new business models, focus on talent, explore acquisitions
(2) Re-imagining the portfolio KEY THRUSTS ACTION/COVERAGE Strengthening the core Focus on penetration, innovation, SKU strategy, making the core more aspirational Creating categories for the future Opportunities to premiumise and up trade; huge headroom for growth Market development & Premiumisation Futuristic products growing at ~2x HUL average Building naturals Naturals portfolio growing at 2.5x HUL average Source: Company, HDFC sec Inst Research
With growing per capita income of India, FMCG consumption would continue to grow in tandem. This growth will be driven by penetration and premiumisation of FMCG products.
Winning in Many India’s
Futuristic products
Source: company

HUL: COMPANY UPDATE
Page | 3
Low penetration in premium products offers long runway for growth
(3) Re-imagining magic in marketing KEY THRUSTS ACTION/COVERAGE Building brands with purpose Building iconic engagement platforms Example: Lux Golden Rose awards, Lakme Fashion Week Building differentiated content Varied strategy based on marketing channel (4) Re-imagining trade channels KEY THRUSTS ACTION/COVERAGE General trade will continue to be large With 10mn outlets, GT even after 10 years, will remain an important channel Building channels of the future Driving visibility in modern trade (5) Re-imagining the value chain KEY THRUSTS ACTION/COVERAGE Technology driven analytics Analytics driven decision making, aim to disrupt than be disrupted (6) Re-imagining customer development KEY THRUSTS ACTION/COVERAGE Demand capture Enhance salesman productivity with chatbots, scale up Shikhar app Demand Fulfil Project shogun, scale up impact app Demand generate Scaling up B2C, leverage technology to improve shelf presence Source: Company, HDFC sec Inst Research
Analytical platform
Jarvis: Decision making tool
Growth and profitability in Ecommerce > Modern Trade > Traditional channel Ecommerce business now ~1.5% of HUL

HUL: COMPANY UPDATE
Page | 4
(7) Re-imagining fuel for growth KEY THRUSTS ACTION/COVERAGE Constant reinvention Max the mix, end-end cost focus Demand Fulfil Project shogun, scale up impact app Demand generate Scaling up B2C, leverage technology to improve shelf presence Source: Company, HDFC sec Inst Research (8) Re-imagining culture of the organization KEY THRUSTS ACTION/COVERAGE Change in mindset Empowerment, collaboration, experimentation, ownership mindset Source: Company, HDFC sec Inst Research
Fuel for growth

HUL: COMPANY UPDATE
Page | 5
HUL’s Core Strategy HUL’s core strategy remains the same but the company consistently is looking to be more agile with respect to execution and ahead of its competitors. Consistent market development and share gain have been the result of superior execution. The company has delivered one of the strongest operational performances among its peers in FY18 despite several challenges. Our call was that HUL with strong leadership, superior management execution would be the key beneficiary in a challenging period (Demonet and GST implementation). Considering macro
tailwinds are now kicking in, HUL would remain key gainer with its strong product portfolio (covering full pyramid). HUL plays a similar strategy for all its categories which are as follows: (A) Drive premiumisation and upgradation (B) Invest in market development (C) Win in channels of the future (D) Wining in Many Indias (WiMI)
(A) Drive premiumisation and upgradation Categories Strategy
Personal Care (PC) Making core brands aspirational Consistent focus on new benefits space and adopting the leading trends Pond’s pollution range is to further upgrade consumers
Home Care Laundry has seen significant premiumisation, led by Surf Excel Home Care EBIT clocked ~28% CAGR during FY16-18 while revenue grew by only 9% Surf Excel monthly penetration is single digit, provides enough head room to grow
Foods & Refreshment (F&R)
Premium Tea has seen significant 5x growth in 2017 vs. category Consistent brand extension of Kissan and Knorr brands has been driven by consumer upgradation Co commands high EBIT margin in F&R despite Tea contributes large share in segment HUL has 12% volume share in Tea, enough head room for growth
PC has 7 brands with >Rs 10bn revenue size Lifebuoy extended into naturals segment (Haldi) FAL has seen several value additions to upgrade consumer Surf Excel “Daag Achhe Hai” campaign has been successfully aired for the last 13 years HUL has number 1 position in 6 F&R categories. In Ice Cream, HUL is number 2 in pan-India but in top-cities it is number 1 Green tea is helping the EBIT margin in the tea portfolio

HUL: COMPANY UPDATE
Page | 6
PC portfolio to win across channels and segments To accelerate premiumisation
Source: Company, HDFC sec Inst Research Premiumisation in laundry Tea – Strong focus on and share gain in the premium
segment
Source: Company, HDFC sec Inst Research

HUL: COMPANY UPDATE
Page | 7
(B) Invest in market development Categories Strategy
Personal Care
Building the anti-perspirant market Body lotion is still has very low penetration and low uses WiMI is very helpful in personal care since consumer preference in personal care varies a lot Axe access packs should be helpful in Deo market which as of now growing at very slow pace than
historical pace Sampling has increased by 1.5x in 2017 vs. 2016 to develop the market Building the naturals portfolio
Home Care
Liquid detergent and Matic powders are growing at 3x to laundry growth Focus on consumer upgradation and engagement for superior products Globally, dishwash is driven by liquid, while in India bar has high share than liquid. Company expects
that India would continue to shift towards liquid Toilet cleaners (especially for lower pyramid) has huge potential and co is focusing on developing
the market Water purifiers with a connector that cleans the vegetable/fruits
Foods & Refreshment
Tapping the snacking opportunity Knorr noodles (Italian taste) has been test market in Maharashtra, strong consumer response Catering the natural segment with Lever Ayush brand extended to breakfast segment, test launch in
South Ice cream has significant room for market development, India’s consumption is very vs. world Cornetto OREO and Sandwich Ice cream would further develop the market
HUL investing in market development in PC Various ways to scale the market in PC
Indulekha has seen strong consumer response, higher than expected by the co at the time of acquisition Domex proposition is to clean and smelly. Domex is available in powder, liquid and rim block Ice cream portfolio is gaining traction through global experience

HUL: COMPANY UPDATE
Page | 8
Matic and liquid laundry growing at 3x of laundry Driving liquid dishwash
ICE Cream Consumption: India vs. World Developing new segments in ice cream
Source: Company, HDFC sec Inst Research

HUL: COMPANY UPDATE
Page | 9
(C) Win in channels of the future Categories Strategy
Personal Care Focus on exclusive product range for ecommerce Partnership with all the winners in ecommerce and modern trade Creating effective content for online to influence consumers
Home Care The growth in ecommerce is 1.4x vs. other channels Premium segment gaining share in modern trades Keep consumer journey in ecommerce in mind while designing
Foods & Refreshment Kwality Wall’s presence has increased from 40 cities in 2014 to >400 cities in 2018 Taj Mahal has strong focus on ecommerce channel Digital landscape helping for several F&R products
Leading in a digital world with measurable metrics Ecommerce share is higher than other channel
KWALITY WALL’S PRESENCE: From 40 cities in 2014 to 400 cities in 2018
Source: Company, HDFC sec Inst Research

HUL: COMPANY UPDATE
Page | 10
(D) Wining in Many Indias (WiMI) Categories Strategy
Personal Care Consumer centric approach to upgrade consumer to premium segment WiMI helping for product upgrade (FAL, Lifebuoy, Dove presence across consumption pyramids)
Home Care In laundry, Uttar Pradesh has more demand for mass products so co is targeting to upgrade. In
contrast, Tamil Nadu has demand for mid segment so co is focusing on liquid and value added products
Foods & Refreshment F&R has separate consumer preference across India, WiMI is helping the category with more focused
approach. West Bengal has seen 50% growth in F&R through WiMI Coffee and Tea, due to rapid consumer preference, has benefiting a lot through WiMI
Successfully developing WiMI in laundry WiMI developed in Tea and Coffee
Source: Company, HDFC sec Inst Research

HUL: COMPANY UPDATE
Page | 11
Segmental Performance Personal Care Performance Particulars (Rs mn) Sep-15 Dec-15 Mar-16 Jun-16 Sep-16 Dec-16 Mar-17 Jun-17 Sep-17 Dec-17 Mar-18 Revenue 40,413 40,905 37,700 42,220 40,280 39,802 40,750 43,680 39,100 40,900 40,960 YoY Gr. (%) 2.1% -0.3% -2.7% 8.1% 3.5% 8.0% 20.0% 13.0% Revenue Mix (%) 48.5% 48.8% 45.3% 48.0% 47.6% 47.9% 45.9% 47.4% 47.1% 47.6% 45.0% EBIT 8,906 9,907 9,030 10,210 9,226 9,208 9,840 10,790 9,480 10,070 10,660 EBIT Margin (%) 22.0% 24.2% 24.0% 24.2% 22.9% 23.1% 24.1% 24.7% 24.2% 24.6% 26.0% EBIT Mix (%) 69.4% 70.0% 62.2% 64.7% 66.0% 68.9% 60.9% 59.4% 60.9% 65.8% 57.2% Note: Like-to-like revenue growth for 2QFY18-4QFY18
Home Care Performance Particulars (Rs mn) Sep-15 Dec-15 Mar-16 Jun-16 Sep-16 Dec-16 Mar-17 Jun-17 Sep-17 Dec-17 Mar-18 Revenue 26,908 26,617 27,980 28,760 27,770 26,891 30,040 30,470 27,390 27,410 31,020 YoY Gr. (%) 6.8% 3.2% 1.0% 7.4% 5.9% 13.0% 17.0% 21.0% Revenue Mix (%) 32.3% 31.8% 33.6% 32.7% 32.8% 32.4% 33.8% 33.1% 33.0% 31.9% 34.1% EBIT 2,246 2,356 3,020 3,560 2,800 2,342 3,890 4,480 3,830 3,540 5,090 EBIT Margin (%) 8.3% 8.9% 10.8% 12.4% 10.1% 8.7% 12.9% 14.7% 14.0% 12.9% 16.4% EBIT Mix (%) 17.5% 16.7% 20.8% 22.6% 20.0% 17.5% 24.1% 24.7% 24.6% 23.1% 27.3% Note: Like-to-like revenue growth for 2QFY18-4QFY18
Refreshment Performance Particulars (Rs mn) Sep-15 Dec-15 Mar-16 Jun-16 Sep-16 Dec-16 Mar-17 Jun-17 Sep-17 Dec-17 Mar-18 Revenue 10,789 10,764 11,760 12,150 11,692 11,641 13,000 13,460 12,220 12,480 14,090 YoY Gr. (%) 7.6% 8.4% 8.1% 10.5% 10.8% 4.5% 7.2% 8.4% Revenue Mix (%) 12.9% 12.9% 14.1% 13.8% 13.8% 14.0% 14.6% 14.6% 14.7% 14.5% 15.5% EBIT 1,469 1,595 1,943 1,921 1,726 1,713 2,190 2,550 2,140 1,690 2,560 EBIT Margin (%) 13.6% 14.8% 16.5% 15.8% 14.8% 14.7% 16.8% 18.9% 17.5% 13.5% 18.2% EBIT Mix (%) 11.5% 11.3% 13.4% 12.2% 12.3% 12.8% 13.6% 14.0% 13.8% 11.0% 13.7% Note: Like-to-like revenue growth for 2QFY18-4QFY18
Foods Performance Particulars (Rs mn) Sep-15 Dec-15 Mar-16 Jun-16 Sep-16 Dec-16 Mar-17 Jun-17 Sep-17 Dec-17 Mar-18 Revenue 2,712 2,772 2,880 2,720 2,778 2,785 2,950 2,840 2,820 3,000 2,990 YoY Gr. (%) 4.7% 2.4% 0.5% 2.4% 4.4% 11.0% 18.0% 10.0% Revenue Mix (%) 3.3% 3.3% 3.5% 3.1% 3.3% 3.4% 3.3% 3.1% 3.4% 3.5% 3.3% EBIT 164 349 381 170 137 261 280 410 170 110 310 EBIT Margin (%) 6.0% 12.6% 13.2% 6.2% 4.9% 9.4% 9.5% 14.4% 6.0% 3.7% 10.4% EBIT Mix (%) 1.3% 2.5% 2.6% 1.1% 1.0% 2.0% 1.7% 2.3% 1.1% 0.7% 1.7% Source: Company, HDFC sec Inst Research| Note: Like-to-like revenue growth for 2QFY18-4QFY18
Personal care witnessed slower 7% EBIT growth vs. 10% like-like revenue growth owing to higher brand investment Home Care EBIT growth in FY18 was at 35% due to premiumisation (Surf Excel) Foods and Refreshment witnessed robust 18% EBIT growth in FY18

HUL: COMPANY UPDATE
Page | 12
Quarterly Financials (Standalone) Particulars 4QFY18 4QFY17 YoY (%) 3QFY18 QoQ (%) FY18 FY17 YoY (%) Net Sales 90,030 81,000 11.1 83,230 8.2 339,260 312,980 8.4 Other Operating Income 940 1,130 (16.8) 2,670 (64.8) 5,990 5,920 1.2 Total Income 90,970 82,130 10.8 85,900 5.9 345,250 318,900 8.3 Material Expenses 43,140 40,220 7.3 39,050 10.5 162,320 156,850 3.5 Employee Expenses 4,000 3,880 3.1 4,910 (18.5) 17,450 16,200 7.7 ASP 10,700 8,530 25.4 11,070 (3.3) 41,050 34,700 18.3 Other Operating Expenses 12,650 12,990 (2.6) 14,070 (10.1) 51,670 50,680 2.0 EBITDA 20,480 16,510 24.0 16,800 21.9 72,760 60,470 20.3 Depreciation 1,280 1,080 18.5 1,210 5.8 4,780 3,960 20.7 EBIT 19,200 15,430 24.4 15,590 23.2 67,980 56,510 20.3 Other Income 1,000 830 20.5 1,520 (34.2) 5,690 5,260 8.2 Interest Cost 40 60 (33.3) 55 (27.3) 200 220 (9.1) PBT 20,160 16,200 24.4 17,055 18.2 73,470 61,550 19.4 Exceptional (640) (10) na (210) na (620) 2,410 PBT (after exceptional) 19,520 16,190 20.6 16,845 15.9 72,850 63,960 13.9 Tax 6,010 4,360 37.8 3,590 67.4 20,480 19,060 7.5 RPAT 13,510 11,830 14.2 13,255 1.9 52,370 44,900 16.6 APAT 14,090 11,180 26.0 11,980 17.6 51,350 42,480 20.9 EPS (Adjusted) 6.5 5.2 26.0 5.5 17.6 23.7 19.6 20.9 As % Of Net Revenue 4QFY18 4QFY17 YoY (bps) 3QFY18 QoQ (bps) FY18 FY17 YoY (bps) Material Expenses 47.4 49.0 (155) 45.5 196 47.0 49.2 (217) Employee Expenses 4.4 4.7 (33) 5.7 (132) 5.1 5.1 (3) ASP Expenses 11.8 10.4 138 12.9 (112) 11.9 10.9 101 Other Operating Expenses 13.9 15.8 (191) 16.4 (247) 15.0 15.9 (93) EBITDA Margin 22.5 20.1 241 19.6 296 21.1 19.0 211 Tax Rate 30.8 26.9 386 21.3 948 28.1 29.8 (169) APAT Margin 15.5 13.6 188 13.9 154 14.9 13.3 155 Source: Company, HDFC sec Inst Research
Like-to-like revenue growth was at 16% vs. our expectation of 12% Higher ASP spend to support new launches (Lever Ayush, etc) and to gain market share Inspiring EBITDA growth of 24% YoY HUL reported a one-time expense of Rs 640mn owing to deferred consideration payable on account of Indulekha acquisition >800 SKU’s have been revised owing to GST rate revision Fiscal tax benefit (Assam and Uttaranchal excise free zones) contributing ~4% of revenues were added to other operating income

HUL: COMPANY UPDATE
Page | 13
Quarterly Segmental (Standalone) Year to March (Rs mn) 4QFY18 4QFY17 YoY (%) 3QFY18 QoQ (%) FY18 FY17 YoY (%) Segmental Revenues Home Care 31,020 30,040 3.3 27,410 13.2 116,290 113,461 2.5 PC 40,960 40,750 0.5 40,900 0.1 164,640 163,051 1.0 Foods 2,990 2,950 1.4 3,000 (0.3) 11,650 11,233 3.7 Refreshment 14,090 13,000 8.4 12,480 12.9 52,250 48,483 7.8 Others 1,910 2,010 (5.0) 2,110 (9.5) 7,200 8,185 (12.0) Total 90,970 88,750 (150.0) 85,900 (118.2) 352,030 344,413 2.2 Segmental EBIT Home Care 5,090 3,890 30.8 3,540 43.8 16,940 12,593 34.5 PC 10,660 9,840 8.3 10,070 5.9 41,000 38,484 6.5 Foods 310 280 10.7 110 181.8 1,000 848 17.9 Refreshment 2,560 2,190 16.9 1,690 51.5 8,940 7,549 18.4 Others 20 (40) (150.0) (110) (118.2) (210) (204) 2.9 Total 18,640 16,160 15.3 15,300 21.8 67,670 59,270 14.2 (a) Interest Cost & Bank Charges 40 60 (33.3) 50 (20.0) 210 215 (2.1) (b) Other Un-allocable Expenses 20 (40) (150.0) (110) (118.2) (5,380) (4,911) 9.5 PBT 19,520 16,190 (28.9) 16,850 20.8 72,840 63,967 13.9 Capital Employed Home Care (7,650) (4,450) na (8,570) na (7,650) (4,450) na PC 13 2,820 (99.5) (1,940) na 13 2,820 (99.5) Foods (170) 460 na (450) na (170) 460 na Refreshment 6,190 7,350 (15.8) 4,960 24.8 6,190 7,350 (15.8) Others 640 900 (28.9) 530 20.8 640 900 (28.9) Total (977) 7,080 na (5,470) na (977) 7,080 na Unallocable Capital Employed 71,610 57,820 23.8 62,800 14.0 71,610 57,820 23.8 Total Capital Employed 70,633 64,900 8.8 57,330 23.2 70,633 64,900 8.8 Source: Company, HDFC sec Inst Research EBIT Margin EBIT Margin 4QFY18 4QFY17 YoY (bps) 3QFY18 QoQ (bps) FY18 FY17 YoY (bps) Home Care 16.4 12.9 346 12.9 349 14.6 11.1 347 PC 26.0 24.1 188 24.6 140 24.9 23.6 130 Foods 10.4 9.5 88 3.7 670 8.6 7.5 103 Refreshment 18.2 16.8 132 13.5 463 17.1 15.6 154 Others 1.0 (2.0) na (5.2) na (2.9) (2.5) na Total 20.5 18.2 228 17.8 268 19.2 17.2 201 Source: Company, HDFC sec Inst Research
Home care reported healthy 21% like-to-like growth. Popular and premium laundry business continued to do well. PC registered 13% like-to-like growth. Personal wash witnessed strong growth. Refreshments grew by 14% on a like-to-like basis. Food grew by 18% on like-to-like basis, with Kissan Ketchups leading the growth Home care segment continued to show premium segment-led growth. Home Care EBIT grew by a stellar 31%

HUL: COMPANY UPDATE
Page | 14
Segment Revenue Performance (Like to like)
4QFY18 FY18 Segments Like-to-like Rev. Gr. (%) EBIT Gr. (%) Like-to-like Rev. Gr. (%) EBIT Gr. (%) Personal Care 13% 8% 10% 7% Home Care 21% 31% 15% 35% Refreshment 14% 17% 12% 18% Food 10% 11% 11% 18% Total 16% 15% 12% 14% Source: Company, HDFC sec Inst Research Net Revenue Growth Underlying Volume Growth
Source: Company, HDFC sec Inst Research Note: Like-to-like growth for 2QFY18-4QFY18
Source: Company, HDFC sec Inst Research
We are encouraged by HUL’s broad-based growth HUL grew by an impressive 12% YoY in a year (FY18) marked by disruptions
8
5 4
3 4 4
1
(1)
6 5
10
1716
(3)
-
3
6
9
12
15
18
Q4F
Y15
Q1F
Y16
Q2F
Y16
Q3F
Y16
Q4F
Y16
Q1F
Y17
Q2F
Y17
Q3F
Y17
Q4F
Y17
Q1F
Y18
Q2F
Y18
Q3F
Y18
Q4F
Y18
%%%%
6 67
6
4 4
-1
-4
4
0
4
11 11
-6
-4
-2
0
2
4
6
8
10
12
Q4F
Y15
Q1F
Y16
Q2F
Y16
Q3F
Y16
Q4F
Y16
Q1F
Y17
Q2F
Y17
Q3F
Y17
Q4F
Y17
Q1F
Y18
Q2F
Y18
Q3F
Y18
Q4F
Y18
%

HUL: COMPANY UPDATE
Page | 15
EBITDA APAT
Source: Company, HDFC sec Inst Research Source: Company, HDFC sec Inst Research Personal Care Performance Home Care Performance
Source: Company, HDFC sec Inst Research Source: Company, HDFC sec Inst Research
Consistent expansion in EBITDA margin for the last five years HUL’s strategy is to drive volume growth resulting in favourable operating leverage led margin expansion, which is reinvested in brands to drive volumes NPM continued to expand and touched 15.5% during the quarter Indulekha has performed better than mgt’s expectation. Oral care growth was driven by new naturals variant. Lever Ayush received positive response post the pan-India launch in 2QFY18. GST led price-cuts are aiding in driving growth for premium products
10.0
13.0
16.0
19.0
22.0
-
4,000
8,000
12,000
16,000
20,000
24,000
Q4F
Y15
Q1F
Y16
Q2F
Y16
Q3F
Y16
Q4F
Y16
Q1F
Y17
Q2F
Y17
Q3F
Y17
Q4F
Y17
Q1F
Y18
Q2F
Y18
Q3F
Y18
Q4F
Y18
EBITDA EBITDA Margin (%) - RHS
%Rs mn
8
10
12
14
16
-
4,000
8,000
12,000
16,000
Q4F
Y15
Q1F
Y16
Q2F
Y16
Q3F
Y16
Q4F
Y16
Q1F
Y17
Q2F
Y17
Q3F
Y17
Q4F
Y17
Q1F
Y18
Q2F
Y18
Q3F
Y18
Q4F
Y18
APAT NPM (%) - RHS
%Rs mn
15.0
20.0
25.0
30.0
34,000
36,000
38,000
40,000
42,000
44,000
Q1F
Y16
Q2F
Y16
Q3F
Y16
Q4F
Y16
Q1F
Y17
Q2F
Y17
Q3F
Y17
Q4F
Y17
Q1F
Y18
Q2F
Y18
Q3F
Y18
Q4F
Y18
Revenue EBIT Margin - RHS
%Rs mn
6.0
8.0
10.0
12.0
14.0
16.0
20,500
22,000
23,500
25,000
26,500
28,000
29,500
31,000
32,500
Q1F
Y16
Q2F
Y16
Q3F
Y16
Q4F
Y16
Q1F
Y17
Q2F
Y17
Q3F
Y17
Q4F
Y17
Q1F
Y18
Q2F
Y18
Q3F
Y18
Q4F
Y18
Revenue EBIT Margin - RHS
%Rs mn

HUL: COMPANY UPDATE
Page | 16
Refreshment Performance Food Performance
Source: Company, HDFC sec Inst Research Source: Company, HDFC sec Inst Research
HUL expanded its distribution for Ice-creams resulting in double-digit volume growth
8.0
10.0
12.0
14.0
16.0
18.0
20.0
10,200
10,800
11,400
12,000
12,600
13,200
13,800
Q1F
Y16
Q2F
Y16
Q3F
Y16
Q4F
Y16
Q1F
Y17
Q2F
Y17
Q3F
Y17
Q4F
Y17
Q1F
Y18
Q2F
Y18
Q3F
Y18
Q4F
Y18
Revenue EBIT Margin - RHS
%Rs mn
-
2.0
4.0
6.0
8.0
10.0
12.0
14.0
16.0
2,250
2,500
2,750
3,000
Q1F
Y16
Q2F
Y16
Q3F
Y16
Q4F
Y16
Q1F
Y17
Q2F
Y17
Q3F
Y17
Q4F
Y17
Q1F
Y18
Q2F
Y18
Q3F
Y18
Q4F
Y18
Revenue EBIT Margin - RHS
%Rs mn
HUL: COMPANY UPDATE
Page | 17
Assumptions
FY17 FY18 FY19E FY20E FY21E Revenue Growth (%)
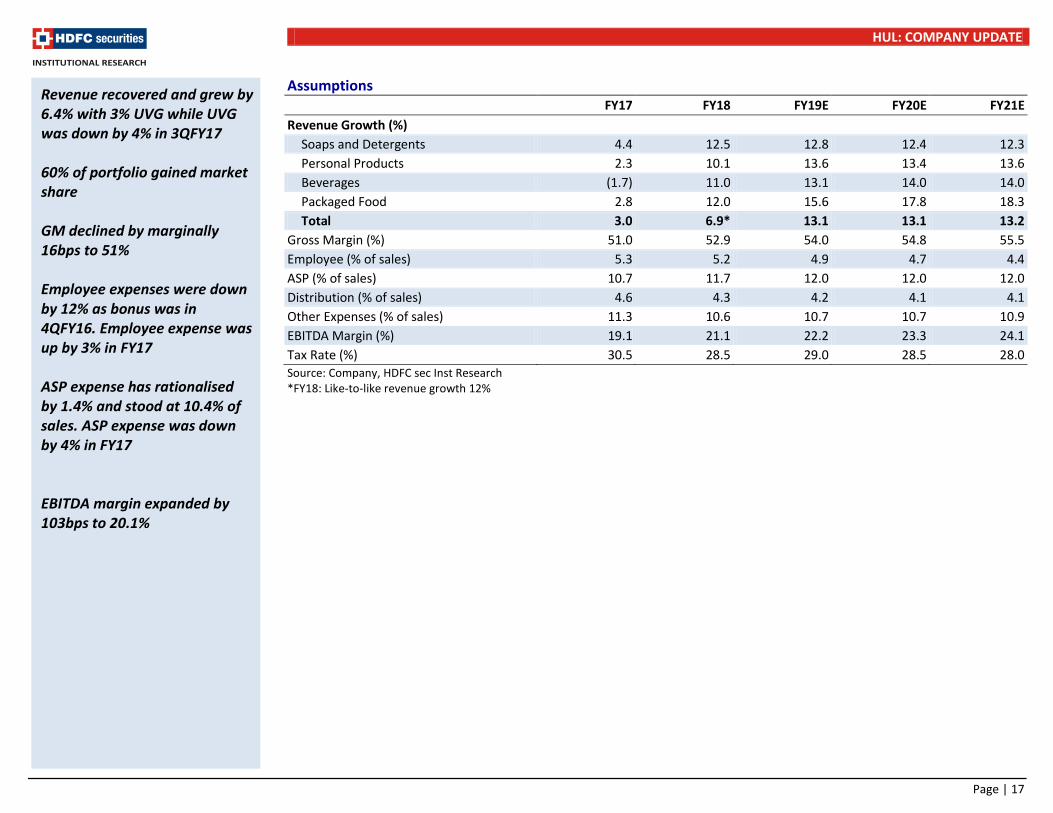
Soaps and Detergents 4.4 12.5 12.8 12.4 12.3 Personal Products 2.3 10.1 13.6 13.4 13.6 Beverages (1.7) 11.0 13.1 14.0 14.0 Packaged Food 2.8 12.0 15.6 17.8 18.3 Total 3.0 6.9* 13.1 13.1 13.2
Gross Margin (%) 51.0 52.9 54.0 54.8 55.5 Employee (% of sales) 5.3 5.2 4.9 4.7 4.4 ASP (% of sales) 10.7 11.7 12.0 12.0 12.0 Distribution (% of sales) 4.6 4.3 4.2 4.1 4.1 Other Expenses (% of sales) 11.3 10.6 10.7 10.7 10.9 EBITDA Margin (%) 19.1 21.1 22.2 23.3 24.1 Tax Rate (%) 30.5 28.5 29.0 28.5 28.0 Source: Company, HDFC sec Inst Research *FY18: Like-to-like revenue growth 12%
Revenue recovered and grew by 6.4% with 3% UVG while UVG was down by 4% in 3QFY17 60% of portfolio gained market share GM declined by marginally 16bps to 51% Employee expenses were down by 12% as bonus was in 4QFY16. Employee expense was up by 3% in FY17 ASP expense has rationalised by 1.4% and stood at 10.4% of sales. ASP expense was down by 4% in FY17 EBITDA margin expanded by 103bps to 20.1%

HUL: COMPANY UPDATE
Page | 18
Income Statement (Consolidated) (Rs mn) FY17 FY18 FY19E FY20E FY21E Net Revenues 331,620 355,450 403,433 457,915 519,715 Growth (%) 3.0 7.2* 13.5 13.5 13.5 Material Expenses 162,573 167,300 185,579 206,978 231,273 Employee Expense 17,430 18,601 19,907 21,405 23,015 ASP Expense 35,420 41,530 48,548 55,105 62,541 Distribution Expenses 15,255 15,284 16,944 18,775 21,308 Other expenses 37,546 37,746 43,021 49,075 56,536 EBITDA 63,396 74,989 89,433 106,579 125,042 EBITDA Growth (%) 5.4 18.3 19.3 19.2 17.3 EBITDA Margin 19.1 21.1 22.2 23.3 24.1 Depreciation 4,320 5,200 5,290 5,569 5,848 EBIT 59,076 69,789 84,143 101,010 119,194 Other Income (Including EO Items) 6,060 3,510 5,306 6,671 9,114
Interest 350 260 - - - PBT 64,786 73,039 89,450 107,681 128,307 Tax 19,770 20,790 25,940 30,689 35,926 RPAT 44,896 52,269 63,531 77,016 92,408 adjustment (2,416) (919) - - - APAT 42,480 51,350 63,531 77,016 92,408 APAT Growth (%) 2.0 20.9 23.7 21.2 20.0 Adjusted EPS (Rs) 19.6 23.7 29.4 35.6 42.7 EPS Growth (%) 1.9 20.9 23.7 21.2 20.0
Source: Company, HDFC sec Inst Research *FY18: Like-to-like revenue growth 12%
Balance Sheet (Consolidated) (Rs mn) FY17 FY18 FY19E FY20E FY21E SOURCES OF FUNDS Share Capital - Equity 2,164 2,164 2,164 2,164 2,164 Reserves 65,500 72,907 84,740 101,012 123,627 Total Shareholders Funds 67,664 75,071 86,905 103,176 125,792 Minority Interest 220 200 178 154 127 Long Term Debt - - - - - Short Term Debt 2,770 - - - - Total Debt 2,770 - - - - Net Deferred Taxes (2,033) (2,033) (2,033) (2,033) (2,033) Long Term Provisions & Others 11,530 15,550 16,505 17,566 18,699 TOTAL SOURCES OF FUNDS 80,151 88,788 101,554 118,863 142,584 APPLICATION OF FUNDS Net Block 44,190 45,280 44,490 43,421 42,073 CWIP 2,290 4,610 2,305 1,153 576 LT Loans & Advances 7,046 7,805 8,646 9,578 10,612 Total Non-current Assets 53,526 57,695 55,441 54,152 53,261 Distribution Expense 25,410 25,130 28,222 31,795 35,842 Debtors 10,850 13,100 14,868 16,876 19,154 Other Expenses 13,807 14,071 14,880 15,770 16,749 Cash & Equivalents 52,053 64,934 80,172 98,602 122,662 Total Current Assets 102,120 117,235 138,142 163,043 194,406 Creditors 61,860 71,700 76,719 82,089 87,836 Other Current Liabilities & Provns 13,635 14,442 15,309 16,243 17,248 Total Current Liabilities 75,495 86,142 92,028 98,332 105,083 Net Current Assets 26,625 31,093 46,113 64,711 89,323 TOTAL APPLICATION OF FUNDS 80,151 88,788 101,554 118,863 142,584
Source: Company, HDFC sec Inst Research

HUL: COMPANY UPDATE
Page | 19
Cash Flow Statement (Consolidated) (Rs mn) FY17 FY18 FY19E FY20E FY21E Reported PBT 64,786 73,039 89,450 107,681 128,307 Non-operating & EO Items - - - - - Interest Expenses 350 260 - - - Depreciation 4,320 5,200 5,290 5,569 5,848 Working Capital Change 5,527 11,674 332 (38) (454) Tax Paid (19,470) (20,790) (25,940) (30,689) (35,926) OPERATING CASH FLOW ( a ) 55,513 69,383 69,131 82,522 97,776 Capex (14,140) (8,610) (2,195) (3,348) (3,924) Free Cash Flow (FCF) 41,373 60,773 66,936 79,175 93,852 Investments (12,280) 5,980 (3,500) (3,500) (3,500) Non-operating Income 447 - - - - INVESTING CASH FLOW ( b ) (25,973) (2,630) (5,695) (6,848) (7,424) Debt Issuance/(Repaid) 1,000 (2,770) - - - Interest Expenses (350) (260) - - - FCFE 42,023 57,743 66,936 79,175 93,852 Share Capital Issuance - - - - - Dividend (36,793) (36,793) (43,286) (50,861) (58,436) Others (7,150) (7,150) (8,412) (9,884) (11,356) FINANCING CASH FLOW ( c ) (43,293) (46,973) (51,698) (60,745) (69,792) NET CASH FLOW (a+b+c) (13,753) 19,780 11,738 14,930 20,560 EO Items, Others (430) 919 - - - Closing Cash & Equivalents 14,113 32,974 44,712 59,642 80,202
Source: Company, HDFC sec Inst Research
Key Ratios (Consolidated) FY17 FY18 FY19E FY20E FY21E PROFITABILITY (%) GPM 51.0 52.9 54.0 54.8 55.5 EBITDA Margin 19.1 21.1 22.2 23.3 24.1 EBIT Margin 17.8 19.6 20.9 22.1 22.9 APAT Margin 12.8 14.4 15.7 16.8 17.8 RoE 63.7 72.0 78.4 81.0 80.7 RoIC 250.4 350.1 708.2 1,277.4 2,227.8 RoCE 61.4 70.5 78.4 81.0 80.7 EFFICIENCY Tax Rate (%) 30.5 28.5 29.0 28.5 28.0 Fixed Asset Turnover (x) 4.3 4.3 4.6 5.0 5.4 Inventory (days) 28.0 25.8 25.5 25.3 25.2 Debtors (days) 11.9 13.5 13.5 13.5 13.5 Other Current Assets (days) 15.2 14.4 13.5 12.6 11.8 Payables (days) 68.1 73.6 69.4 65.4 61.7 Other Current Liab & Provns (days) 15.0 14.8 13.9 12.9 12.1 Cash Conversion Cycle (days) (28.0) (34.7) (30.8) (27.0) (23.4) Net D/E (x) (0.7) (0.9) (0.9) (1.0) (1.0) PER SHARE DATA (Rs) EPS 19.6 23.7 29.4 35.6 42.7 CEPS 21.6 26.1 31.8 38.2 45.4 Dividend 17.0 20.0 23.5 27.0 30.5 Book Value 31.3 34.7 40.2 47.7 58.1 VALUATION P/E (x) 80.1 66.3 53.6 44.2 36.8 P/BV (x) 50.3 45.3 39.1 33.0 27.0 EV/EBITDA (x) 52.9 44.5 37.1 31.0 26.2 EV/Revenues (x) 10.1 9.4 8.2 7.2 6.3 OCF/EV (%) 1.7 2.1 2.1 2.5 3.0 FCF/EV (%) 1.2 1.8 2.0 2.4 2.9 FCFE/Mkt Cap (%) 1.2 1.7 2.0 2.3 2.8 Dividend Yield (%) 1.1 1.3 1.5 1.7 1.9
Source: Company, HDFC sec Inst Research

HUL: COMPANY UPDATE
Page | 20
RECOMMENDATION HISTORY
Rating Definitions BUY : Where the stock is expected to deliver more than 10% returns over the next 12 month period NEUTRAL : Where the stock is expected to deliver (-)10% to 10% returns over the next 12 month period SELL : Where the stock is expected to deliver less than (-)10% returns over the next 12 month period
Date CMP Reco Target 5-Jun-17 1,086 BUY 1,200 19-Jul-17 1,158 BUY 1,304 22-Sep-17 1,240 BUY 1,363 10-Oct-17 1,220 BUY 1,363 26-Oct-17 1,272 BUY 1,401 13-Nov-17 1,291 BUY 1,458 27-Dec-17 1,347 BUY 1,514 12-Jan-18 1,375 BUY 1,514 28-Feb-18 1,340 BUY 1,514 11-Apr-18 1,390 BUY 1,559 15-May-18 1,504 BUY 1,615
7-Jun-18 1,571 BUY 1,701
1,000
1,100
1,200
1,300
1,400
1,500
1,600
1,700
Jun-
17
Jul-1
7
Aug-
17
Sep-
17
Oct
-17
Nov-
17
Dec-
17
Jan-
18
Feb-
18
Mar
-18
Apr-
18
May
-18
Jun-
18
HUVR TP

HUL: COMPANY UPDATE
Page | 21
Disclosure: We, Naveen Trivedi, MBA & Siddhant Chhabria, PGDBM, authors and the names subscribed to this report, hereby certify that all of the views expressed in this research report accurately reflect our views about the subject issuer(s) or securities. HSL has no material adverse disciplinary history as on the date of publication of this report. We also certify that no part of our compensation was, is, or will be directly or indirectly related to the specific recommendation(s) or view(s) in this report. Research Analyst or his/her relative or HDFC Securities Ltd. does not have any financial interest in the subject company. Also Research Analyst or his relative or HDFC Securities Ltd. or its Associate may have beneficial ownership of 1% or more in the subject company at the end of the month immediately preceding the date of publication of the Research Report. Further Research Analyst or his relative or HDFC Securities Ltd. or its associate does not have any material conflict of interest. Any holding in stock –No HDFC Securities Limited (HSL) is a SEBI Registered Research Analyst having registration no. INH000002475. Disclaimer: This report has been prepared by HDFC Securities Ltd and is meant for sole use by the recipient and not for circulation. The information and opinions contained herein have been compiled or arrived at, based upon information obtained in good faith from sources believed to be reliable. Such information has not been independently verified and no guaranty, representation of warranty, express or implied, is made as to its accuracy, completeness or correctness. All such information and opinions are subject to change without notice. This document is for information purposes only. Descriptions of any company or companies or their securities mentioned herein are not intended to be complete and this document is not, and should not be construed as an offer or solicitation of an offer, to buy or sell any securities or other financial instruments. This report is not directed to, or intended for display, downloading, printing, reproducing or for distribution to or use by, any person or entity who is a citizen or resident or located in any locality, state, country or other jurisdiction where such distribution, publication, reproduction, availability or use would be contrary to law or regulation or what would subject HSL or its affiliates to any registration or licensing requirement within such jurisdiction. If this report is inadvertently send or has reached any individual in such country, especially, USA, the same may be ignored and brought to the attention of the sender. This document may not be reproduced, distributed or published for any purposes without prior written approval of HSL. Foreign currencies denominated securities, wherever mentioned, are subject to exchange rate fluctuations, which could have an adverse effect on their value or price, or the income derived from them. In addition, investors in securities such as ADRs, the values of which are influenced by foreign currencies effectively assume currency risk. It should not be considered to be taken as an offer to sell or a solicitation to buy any security. HSL may from time to time solicit from, or perform broking, or other services for, any company mentioned in this mail and/or its attachments. HSL and its affiliated company(ies), their directors and employees may; (a) from time to time, have a long or short position in, and buy or sell the securities of the company(ies) mentioned herein or (b) be engaged in any other transaction involving such securities and earn brokerage or other compensation or act as a market maker in the financial instruments of the company(ies) discussed herein or act as an advisor or lender/borrower to such company(ies) or may have any other potential conflict of interests with respect to any recommendation and other related information and opinions. HSL, its directors, analysts or employees do not take any responsibility, financial or otherwise, of the losses or the damages sustained due to the investments made or any action taken on basis of this report, including but not restricted to, fluctuation in the prices of shares and bonds, changes in the currency rates, diminution in the NAVs, reduction in the dividend or income, etc. HSL and other group companies, its directors, associates, employees may have various positions in any of the stocks, securities and financial instruments dealt in the report, or may make sell or purchase or other deals in these securities from time to time or may deal in other securities of the companies / organizations described in this report. HSL or its associates might have managed or co-managed public offering of securities for the subject company or might have been mandated by the subject company for any other assignment in the past twelve months. HSL or its associates might have received any compensation from the companies mentioned in the report during the period preceding twelve months from t date of this report for services in respect of managing or co-managing public offerings, corporate finance, investment banking or merchant banking, brokerage services or other advisory service in a merger or specific transaction in the normal course of business. HSL or its analysts did not receive any compensation or other benefits from the companies mentioned in the report or third party in connection with preparation of the research report. Accordingly, neither HSL nor Research Analysts have any material conflict of interest at the time of publication of this report. Compensation of our Research Analysts is not based on any specific merchant banking, investment banking or brokerage service transactions. HSL may have issued other reports that are inconsistent with and reach different conclusion from the information presented in this report. Research entity has not been engaged in market making activity for the subject company. Research analyst has not served as an officer, director or employee of the subject company. We have not received any compensation/benefits from the subject company or third party in connection with the Research Report. HDFC securities Limited, I Think Techno Campus, Building - B, "Alpha", Office Floor 8, Near Kanjurmarg Station, Opp. Crompton Greaves, Kanjurmarg (East), Mumbai 400 042 Phone: (022) 3075 3400 Fax: (022) 2496 5066 Compliance Officer: Binkle R. Oza Email: [email protected] Phone: (022) 3045 3600 HDFC Securities Limited, SEBI Reg. No.: NSE-INB/F/E 231109431, BSE-INB/F 011109437, AMFI Reg. No. ARN: 13549, PFRDA Reg. No. POP: 04102015, IRDA Corporate Agent License No.: HDF 2806925/HDF C000222657, SEBI Research Analyst Reg. No.: INH000002475, CIN - U67120MH2000PLC152193 Mutual Funds Investments are subject to market risk. Please read the offer and scheme related documents carefully before investing.

HUL: COMPANY UPDATE
Page | 22
HDFC securities Institutional Equities Unit No. 1602, 16th Floor, Tower A, Peninsula Business Park, Senapati Bapat Marg, Lower Parel,Mumbai - 400 013 Board : +91-22-6171 7330www.hdfcsec.com


![Sea destiny web presentation [update 5 jun-15]](https://img.pdfslide.us/doc/110x75/55c45522bb61eba24e8b45ae/sea-destiny-web-presentation-update-5-jun-15.jpg)