Embed Size (px)
Citation preview
317121
Company: San Diego Gas & Electric Company (U 902 M) Proceeding: 2019 General Rate Case Application: A.17-10-___ Exhibit: SDG&E-19
SDG&E
DIRECT TESTIMONY OF LISA C. DAVIDSON
(CUSTOMER SERVICE INFORMATION AND TECHNOLOGIES)
October 6, 2017
BEFORE THE PUBLIC UTILITIES COMMISSION OF THE STATE OF CALIFORNIA
LCD-i
TABLE OF CONTENTS
I. INTRODUCTION .............................................................................................................. 1
A. Summary of Customer Service Information and Technologies Costs and Activities ................................................................................................................. 1
B. Summary of Safety and Risk-Related Costs ........................................................... 4
C. Summary of Costs Related to Fueling our Future (FOF) ....................................... 5
D. Organization of Testimony ..................................................................................... 6
II. RISK ASSESSMENT MITIGATION PHASE AND SAFETY CULTURE RAMP ................................................................................................................................. 6
III. NON-SHARED COSTS ..................................................................................................... 8
A. Residential Customer Services ............................................................................... 9
Description of Costs and Underlying Activities ......................................... 9
Forecast Method........................................................................................ 11
Cost Drivers .............................................................................................. 11
Employee Retirement – Voluntary Retirement Enhancement Program (VREP) ........................................................................... 12
Capital Project Impacts – Customer Authorization Project .......... 12
Customer Information Advisor ..................................................... 13
Privacy Training............................................................................ 14
Cool Zones .................................................................................... 14
Expansion of Clean Transportation .............................................. 15
Electric Vehicle Education & Outreach ........................................ 16
Memorandum Accounts ............................................................................ 18
Memorandum Account – AFVMA ............................................... 18
Memorandum Account - EDRMA................................................ 19
B. Business Services .................................................................................................. 20
Description of Costs and Underlying Activities ....................................... 20
Forecast Method........................................................................................ 24
Cost Drivers .............................................................................................. 25
AB802 – Commercial Benchmarking Support ............................. 25
Business Optimization - FOF ....................................................... 25
Memorandum Account – AB802 Commercial Benchmarking ................ 26
C. Marketing, Research & Analytics ......................................................................... 27

LCD-ii
Description of Costs and Underlying Activities ....................................... 27
Forecast Method........................................................................................ 33
Cost Drivers .............................................................................................. 34
Rate Education and Outreach ........................................................ 34
Marketing Automation .................................................................. 36
Outage Communication ................................................................ 36
Customer Insight - Surveys ........................................................... 37
Multicultural Campaign ................................................................ 38
Contact Information Campaign ..................................................... 38
RAMP – Summer and Winter Prep Communication .................... 39
Business Optimization - FOF ....................................................... 39
Memorandum Account - RRMA .............................................................. 39
D. Customer Programs, Pricing, and Other Office (CP&P) ...................................... 44
Description of Costs and Underlying Activities ....................................... 44
Forecasting Methodology ......................................................................... 46
Cost Drivers .............................................................................................. 46
Customer Pricing – Full Year Labor and Non-Labor Impact ....... 47
Customer Pricing Regulatory Compliance ................................... 48
Medical Baseline (MBL) Recertification Process and Related System Enhancements .................................................................. 48
RAMP – CO Testing/NGAT ........................................................ 48
System Enhancements for Neighbor to Neighbor Data Base Move to Energy Efficiency Collaboration Platform (EECP) .................. 49
Business Optimization - FOF ....................................................... 49
IV. SHARED COSTS ............................................................................................................. 49
A. Customer Service Technologies ........................................................................... 50
B. Business Strategy & Development ....................................................................... 50
Description of Costs and Underlying Activities ....................................... 50
Forecast Method........................................................................................ 51
Cost Drivers .............................................................................................. 51
C. Low Emission Vehicle Program ........................................................................... 51
Description of Costs and Underlying Activities ....................................... 51
Forecast Method........................................................................................ 51

LCD-iii
Cost Drivers .............................................................................................. 52
V. CAPITAL .......................................................................................................................... 52
Business Optimization .............................................................................. 53
Demand Response Management System Phase 1 (DRMS) (Project # T15831) and DRMS Phase 3 (Project T19003) ........... 54
Improving Customer Experience .............................................................. 54
My Account Reliability & Software Inspection Report (SIR) Bundled Work (Project # T16027) ............................................... 54
CAP (Project # T16036) ............................................................... 55
Gas Customer Choice Automation (GCCA) (Project # T19004) . 55
Mandated................................................................................................... 55
Residential TOU Default Pilot Program (Project # T19006) ........ 56
Residential Rate Reform RROIR/RDW (Project # T15076) and Residential Rate Reform TOU (Project # T16037) ................ 56
GRC Phase 2 (Project # T19007).................................................. 57
AB802 Benchmarking Project (Project # T16038) ....................... 57
Enterprise Hourly TOU Metering/Billing (Project # T16033) ..... 57
VI. ENERGY INNOVATION CENTER ............................................................................... 58
VII. CONCLUSION ................................................................................................................. 58
VIII. WITNESS QUALIFICATIONS ....................................................................................... 59
APPENDIX
APPENDIX A - GLOSSARY OF TERMS ....................................................................... LCD-A-1
LCD-iv
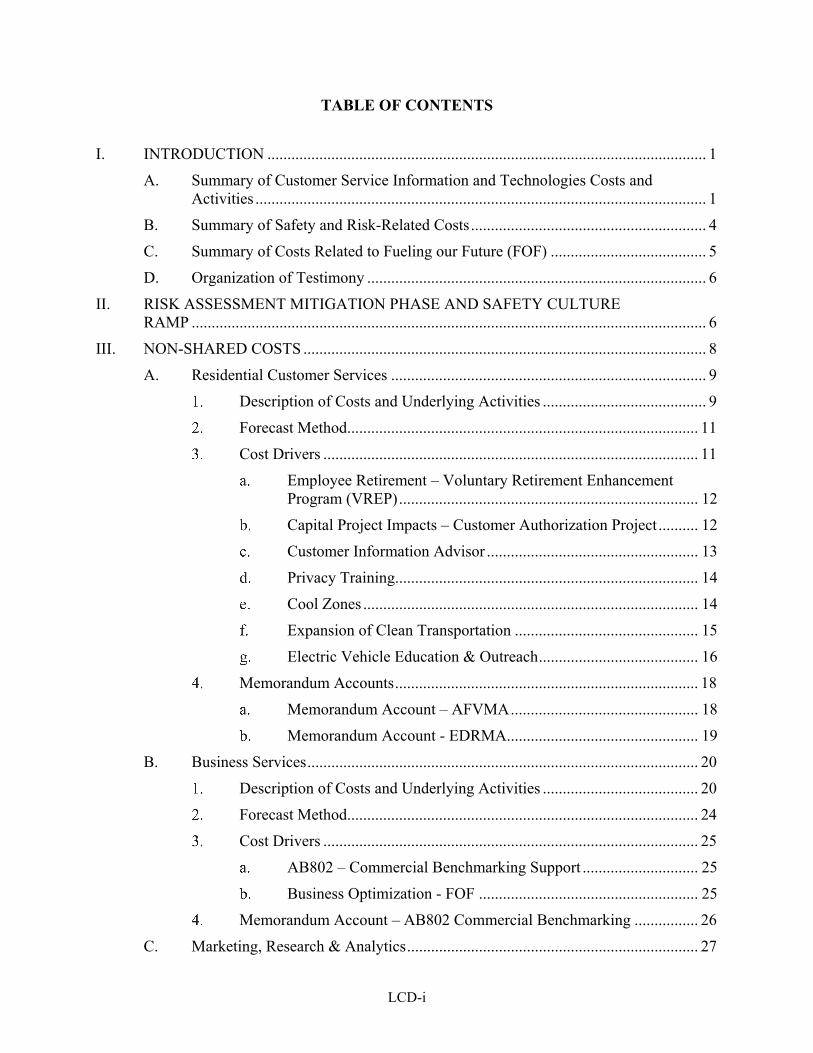
SUMMARY
TY 2019 Summary of Total O&M Costs
CS - INFORMATION & TECHNOLOGIES (In 2016 $)
2016 Adjusted-Recorded
(000s)
TY 2019 Estimated
(000s)
Change (000s)
Total Non-Shared Services 21,744 26,058 4,314Total Shared Services (Incurred) 343 343 0Total O&M 22,087 26,401 4,314
TY 2019 Summary of Total Capital IT Costs
INFORMATION TECHNOLOGY (In 2016 $)
Categories of Management Estimated 2017(000s)
Estimated 2018 (000s)
Estimated TY 2019
(000s) CS – Information & Technologies 20,583 21,109 1,818
Summary of Requests
San Diego Gas & Electric Company’s (SDG&E) Customer Service Information and
Technologies is requesting $26.401 million for Test Year (TY) 2019, which represents a 20%
increase from 2016 adjusted recorded costs. The requested funding supports SDG&E’s goal of
providing safe, reliable and efficient gas and electric service, and serving as a trusted energy advisor
to customers by offering relevant information about their energy consumption, pricing plans,
programs and tools to manage and control their use. This request will allow us to provide
customers with residential customer services, business services, marketing and communications,
research and analytics, customer programs, and customer pricing, among other services.
SDG&E’s request reflects the effects of the following:
System upgrades, research and rate education to prepare customers for
new and changing pricing plans and program options related to residential
rate reform and rate education plans that have been requested and/or
previously approved by the Commission;
Support for the wide array of business customers’ energy needs;

LCD-v
Expansion of research and communication to engage customers in diverse
and disadvantaged communities;
Customer privacy and data access initiatives to comply with new
regulations and make it easier for customers to securely share their energy
usage data with third parties;
Increased support for rate design strategy, rate changes and impacts;
Expansion of clean transportation programs in support of ambitious state
greenhouse gas reduction goals;
Risk Assessment Mitigation Phase (RAMP) – Natural Gas Appliance
Testing (NGAT) and seasonal safety communications; and
Operational efficiency projects.
I chose a base year forecast method for Customer Service Information and Technologies.
For reasons described in my testimony, a base year forecast represents the appropriate starting
point to calculate TY 2019 operation and maintenance (O&M) expenses for the activities listed
above.
LCD-1
SDG&E DIRECT TESTIMONY OF LISA C. DAVIDSON 1 (CUSTOMER SERVICE INFORMATION AND TECHNOLOGIES) 2
I. INTRODUCTION 3
A. Summary of Customer Service Information and Technologies Costs and 4 Activities 5
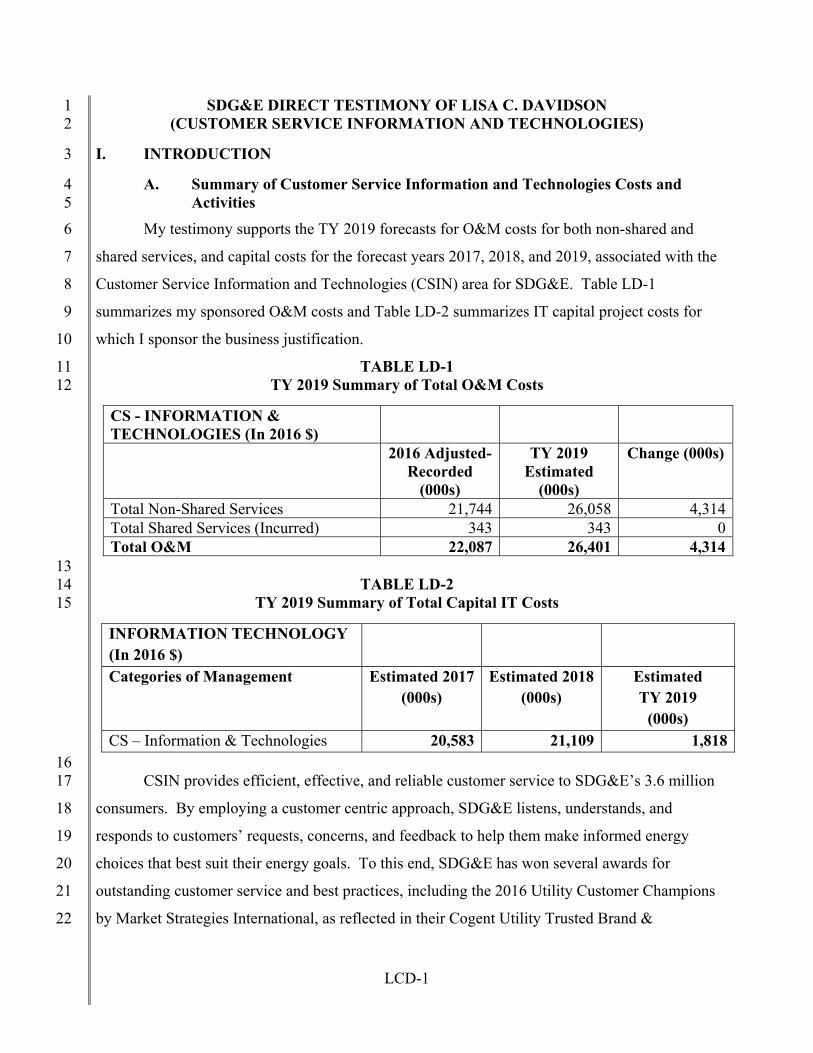
My testimony supports the TY 2019 forecasts for O&M costs for both non-shared and 6
shared services, and capital costs for the forecast years 2017, 2018, and 2019, associated with the 7
Customer Service Information and Technologies (CSIN) area for SDG&E. Table LD-1 8
summarizes my sponsored O&M costs and Table LD-2 summarizes IT capital project costs for 9
which I sponsor the business justification. 10
TABLE LD-1 11 TY 2019 Summary of Total O&M Costs 12
CS - INFORMATION & TECHNOLOGIES (In 2016 $)
2016 Adjusted-Recorded
(000s)
TY 2019 Estimated
(000s)
Change (000s)
Total Non-Shared Services 21,744 26,058 4,314Total Shared Services (Incurred) 343 343 0Total O&M 22,087 26,401 4,314
13 TABLE LD-2 14
TY 2019 Summary of Total Capital IT Costs 15
INFORMATION TECHNOLOGY (In 2016 $)
Categories of Management Estimated 2017(000s)
Estimated 2018 (000s)
Estimated TY 2019
(000s) CS – Information & Technologies 20,583 21,109 1,818
16 CSIN provides efficient, effective, and reliable customer service to SDG&E’s 3.6 million 17
consumers. By employing a customer centric approach, SDG&E listens, understands, and 18
responds to customers’ requests, concerns, and feedback to help them make informed energy 19
choices that best suit their energy goals. To this end, SDG&E has won several awards for 20
outstanding customer service and best practices, including the 2016 Utility Customer Champions 21
by Market Strategies International, as reflected in their Cogent Utility Trusted Brand & 22

LCD-2
Customer Engagement Benchmark Residential survey.1 SDG&E was among 46 champions 1
nationally in 2016 (of 130 utilities included in the study) and one of the two winning California 2
utilities. In 2016, SDG&E received Chartwell’s Silver Award for Best Practices in Billing and 3
Payment Programs2 for our enhanced Bill Ready Notification email, which provides My Account 4
customers with a snapshot of key billing and usage information through charts and infographics, 5
as well as customized energy-management solutions via messages and videos based on 6
customers’ past interactions. In 2014, SDG&E was ranked third out of 35 participating utilities 7
in an Esource survey for our Account Management services for business customers.3 We are 8
proud of these recognitions and strive every day to deliver positive value-added service and 9
experiences for our customers. 10
Advancements in technology have increased customer expectations. Today’s customer is 11
connected in a twenty-four hour, data-driven, social media culture. Customers have come to 12
expect fast, personalized service. They expect to be able to interact over the channel or device of 13
their choice, at any time, day or night, and receive an expeditious response. As energy-related 14
issues, regulations, and options increase in complexity, customers expect SDG&E to be a trusted 15
energy advisor, providing them with services and an experience that is personalized and relevant 16
to them. To meet these expectations, SDG&E is delivering solutions that are integrated and 17
customized, while providing simplified processes that make it seamless for a customer to transact 18
with us and tools and services that meet each customers’ individual needs. 19
SDG&E strives to provide the right message to the right customer at the right time using 20
the right channel. We do this by providing information on programs, products, and pricing 21
options in various languages, at various times, and through multiple channels. Our outreach 22
efforts are active year-round and we partner with community and trade organizations that help us 23
reach underserved communities and customer segments. 24
1 Report by Market Strategies International, per their Cogent Utility Trusted Brand & Customer Engagement Benchmark Residential survey http://landing.marketstrategies.com/2016-utility-brand-trust-customer-engagement-residential-study-ecr-scores.
2 Chartwell’s Best Practices Awards recognize excellence among electric and gas utilities with respect to projects, programs and initiatives. The awards program is open to all utilities – large, small, investor owned utilities (IOU), cooperatives, and municipals – across North America.
3 https://www.esource.com/ES-PR-AMA-2014-07/Press-Release/AMA.

LCD-3
SDG&E also provides account management services to commercial and industrial 1
customers. Account Executives are assigned to market segments, which creates in-depth 2
knowledge and familiarity with the complexity of energy use and service needs of each industry. 3
This has produced strong relationships with our business customers that are built on knowledge 4
and trust. 5
SDG&E is implementing a portfolio of Clean Transportation programs that provide 6
solutions for reducing the carbon footprint in San Diego. Our Clean Transportation team 7
provides customers with electric transportation information on metering, rates, charging 8
equipment and installation, safety, reliability, and the benefits of off-peak charging. 9
SDG&E’s customers encompass a wide range of market segments with varying levels of 10
sophistication, energy knowledge and know-how. As such, SDG&E offers customers numerous 11
options for receiving information and interacting with us. As an example, these options include 12
the use of social media for the tech savvy customer who prefers a more immediate response and 13
is likely to self-serve, compared to our customers at the other end of the spectrum who prefer a 14
more individualized personal interaction with the Customer Contact Center (CCC). Whatever 15
the preferred experience, SDG&E continuously works to meet or exceed customers’ 16
expectations. 17
As the energy environment changes, and customer needs and expectations evolve, 18
SDG&E is committed to developing a deeper understanding and insights into its diverse 19
customer segments. This is done through research and analytics and the continuous monitoring 20
of our customer service efforts, utilizing customer surveys. We leverage our Customer 21
Connection Survey to measure customers’ experience when they transact with SDG&E. Some 22
of these transactions include in-person payments, the Call Center, Field Technician service 23
orders, and Interactive Voice Response (IVR) transactions. This survey provides actionable 24
feedback that translates into enhancements to our customer service efforts. The final year-end 25
score for 2016 showed 80% of customers who transacted with us scored the experience as 26
excellent or very good. 27
SDG&E is also dedicated to providing customers with choices and information on their 28
energy pricing plans and program options that will allow them to select the best rate that meets 29
their lifestyle or business needs. SDG&E’s business customers are enrolled in time varying 30
pricing plans, and we are focused on preparing residential customers for future phases of rate 31
LCD-4
reform and the transition to default time-of-use (TOU) pricing plans. Our goal is to increase 1
residential customers’ awareness, understanding, and engagement with rate options and the 2
energy management tools and behaviors that can help better manage electricity use and thereby 3
increase adoption and retention of customers on TOU. 4
In addition to sponsoring my own organization’s costs, my testimony also supports 5
business justification for the following areas: 6
Information Technologies (IT) capital costs that support CSIN are 7
sponsored by SDG&E witness Christopher Olmsted (Exhibit SDG&E-24). 8
However, I will cover in my testimony the business rationale for these 9
costs. 10
Memorandum account proposals are sponsored by SDG&E witness 11
Norma Jasso (Exhibit SDG&E-41). However, I sponsor the 12
reasonableness of costs recorded to the Alternative Fuel Vehicle 13
Memorandum Account (AFVMA), Energy Data Request Memorandum 14
Account (EDRMA), Assembly Bill (AB) 802 Memorandum Account, and 15
Rate Reform Memorandum Account (RRMA). 16
Facilities capital costs for SDG&E are sponsored by witness Dale 17
Tattersall (Exhibit SDG&E-22). However, I will cover in my testimony 18
the business justification for proposed Energy Innovation Center capital 19
improvements. 20
B. Summary of Safety and Risk-Related Costs 21
Some of the costs supported in my testimony are driven by activities described in 22
Southern California Gas Company (SoCalGas) and SDG&E’s November 30, 2016 RAMP 23
Report.4 The RAMP Report presented an assessment of the key safety risks of SoCalGas and 24
SDG&E and proposed plans for mitigating those risks. As discussed in the Risk Management 25
testimony chapters of Diana Day and Jamie York (Exhibit SCG-02/SDG&E-02, Chapters 1 and 26
3, respectively), the costs of risk-mitigation projects and programs were translated from that 27
RAMP Report into the individual witness areas. 28
4 I.16-10-015/I.16-10-016 Risk Assessment and Mitigation Phase Report of San Diego Gas & Electric Company and Southern California Gas Company, November 30, 2016. Please also refer to Exhibit SCG-02/SDG&E-02, Chapter 1 (Diana Day) for more details regarding the utilities’ RAMP Report.

LCD-5
In the course of preparing my General Rate Case (GRC) forecasts, I continued to evaluate 1
the scope, schedule, resource requirements, and synergies of RAMP-related projects and 2
programs. Therefore, the final representation of RAMP costs may differ from the ranges shown 3
in the original RAMP Report. 4
Table LD-3 provides a summary of the RAMP-related costs supported by my testimony 5
by RAMP risk: 6
TABLE LD-3 7 Summary of RAMP Overlay 8
CS - INFORMATION & TECHNOLOGIES (In 2016 $)
RAMP Risk Chapter 2016 Embedded Base Costs
(000s)
TY 2019 Estimated
Incremental (000s)
Total (000s)
SDG&E-3 Employee, Contractor and Public Safety
693 241 934
Total O&M 693 241 934 9
C. Summary of Costs Related to Fueling our Future (FOF) 10
As described in the joint testimony of Hal Snyder and Randall Clark (Exhibit SCG-11
03/SDG&E-03), the utilities kicked off the FOF initiative in May 2016 to identify and implement 12
efficient operations improvements. Various workgroups in CSIN benefit from the FOF 13
initiative; the details of the FOF improvements and the savings to be realized as a result of 14
implementing them relate to both labor and non-labor costs, and are included in each of the 15
impacted workgroups in this testimony. FOF savings reflected in TY 2019 are approximately 16
$922,000 as shown in Table LD-4 below. 17
TABLE LD-4 18 Summary of FOF Costs 19
CS - INFORMATION & TECHNOLOGIES (In 2016 $)
FOF O&M Estimated 2017 (000s)
Estimated 2018 (000s)
Estimated 2019 (000s)
FOF-Ongoing/<Benefits> -443 -913 -922Total O&M -443 -913 -922
LCD-6
D. Organization of Testimony 1
My testimony is organized into five main categories: RAMP and Safety Culture (Section 2
II), Non-Shared Services Costs (Section III), Shared Services Costs (Section IV), IT Capital 3
Projects (Section V), and Energy Innovation Center (Section VI). 4
I will address the non-shared services for all the areas within CSIN such as Residential 5
Customer Services (RCS), Business Customer Services, Marketing, Research and Analytics, and 6
Customer Programs, Pricing and Other Office. In each of the non-shared sections, I will present 7
the primary activities of the workgroup, the reason for using the base year (BY) forecast 8
methodology, and support for the request for each of the cost drivers. I will then present shared 9
service areas of Business Strategy and Development as well as the Low Emission Vehicle 10
Program. Like the non-shared services section, I will present the primary activities of the 11
workgroup, the reason for using the base year forecast methodology, and support for the request 12
for each of the cost drivers. 13
Following that, I will provide the business justification for the IT capital costs for 14
technology that supports CSIN and are sponsored by SDG&E witness Mr. Olmsted (Exhibit 15
SDG&E-24) and for the proposed Energy Innovation Center capital improvements. 16
II. RISK ASSESSMENT MITIGATION PHASE AND SAFETY CULTURE 17 RAMP 18
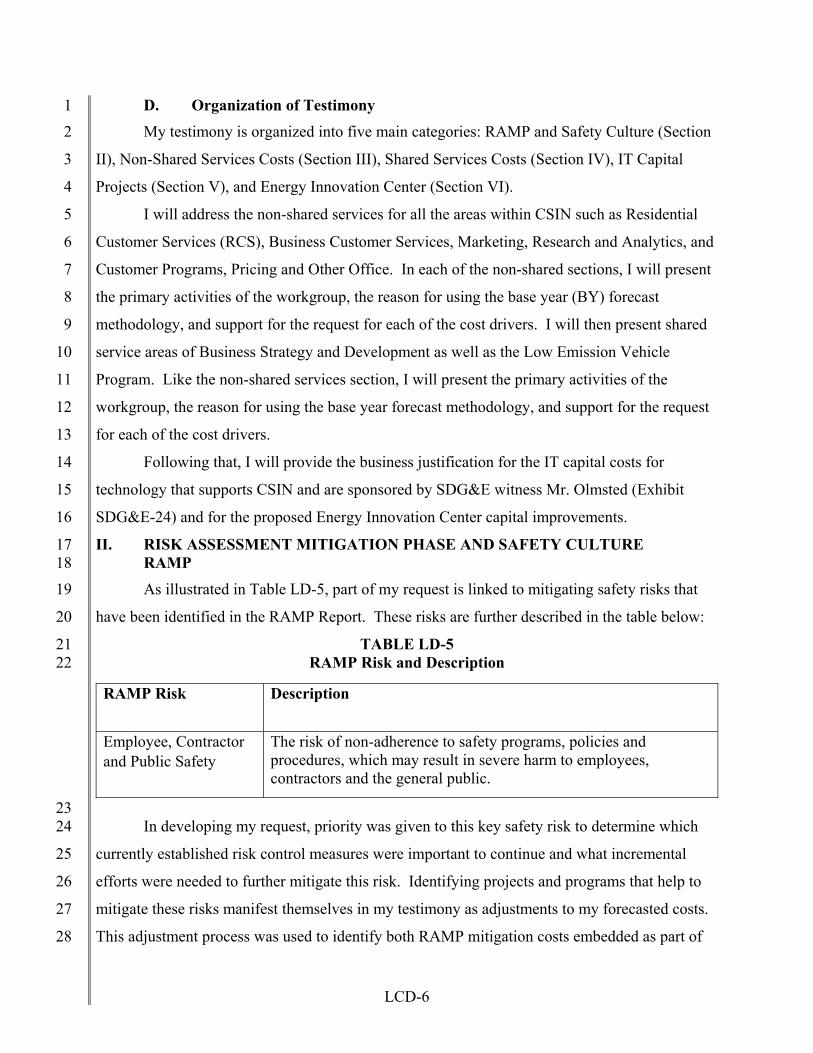
As illustrated in Table LD-5, part of my request is linked to mitigating safety risks that 19
have been identified in the RAMP Report. These risks are further described in the table below: 20
TABLE LD-5 21 RAMP Risk and Description 22
RAMP Risk Description
Employee, Contractor and Public Safety
The risk of non-adherence to safety programs, policies and procedures, which may result in severe harm to employees, contractors and the general public.
23 In developing my request, priority was given to this key safety risk to determine which 24
currently established risk control measures were important to continue and what incremental 25
efforts were needed to further mitigate this risk. Identifying projects and programs that help to 26
mitigate these risks manifest themselves in my testimony as adjustments to my forecasted costs. 27
This adjustment process was used to identify both RAMP mitigation costs embedded as part of 28

LCD-7
traditional and historic activities, as well as forecasted RAMP-incremental costs, that are also 1
associated with mitigation strategies and corresponding to historic or new activities. These can 2
be found in my workpapers as described below. The general treatment of RAMP forecasting is 3
described in the testimony of RAMP to GRC Integration witness Jamie York (Exhibit SCG-4
02/SDG&E-02, Chapter 3). 5
For this risk, an embedded BY 2016 cost-to-mitigate and any incremental costs expected 6
by the TY 2019 are shown in Table LD-6 below. The table also provides the location in my 7
workpapers where the specific adjustments representing those incremental costs can be found. 8
Furthermore, the details for the individual mitigation efforts are described in impacted testimony 9
areas below. 10
TABLE LD-6 11 RAMP Summary of Costs 12
CS - INFORMATION & TECHNOLOGIES (In 2016 $)
SDG&E-3 Employee, Contractor and Public Safety
2016 Embedded Base Costs
(000s)
TY 2019 Estimated
Incremental (000s)
Total (000s)
1IN001.000, Residential Customer Services
11 0 11
1IN002.000, Business Services 80 0 801IN003.000, Marketing, Research, & Analytics
455 100 555
1IN004.000, Customer Programs, Pricing, and Other Office
147 141 288
Total 693 241 934 13
As the table demonstrates, the RAMP risk mitigation efforts are associated with specific 14
programs or projects contained within several workgroups. For each of these mitigation efforts 15
an evaluation was made to determine the portion that was already being performed in our 16
historical activities. My incremental request includes risk mitigation efforts such as customer 17
communications and customer initiated orders relative to public safety. These efforts may 18
further reduce our employee, contractor, and public safety risk by expanding Summer and 19
Winter Preparedness Communication as well as NGAT, which is a safety measure included in 20
the RAMP filing to help mitigate exposure to carbon monoxide (CO). As described in section 21

LCD-8
III. D.3.d, NGAT is a CPUC mandated program and SDG&E has not separately explored any 1
alternative to that program. 2
Safety Culture 3
SDG&E is committed to providing safe and reliable service to its customers. Our safety-4
first culture focuses on our employees, customers, and public safety, and is embedded in every 5
aspect of our work. This effort includes developing a trained workforce, operating and 6
maintaining the electric infrastructure, and providing safe and reliable gas and electric service. 7
SDG&E’s strong safety culture and commitment to further developing processes and programs is 8
designed to manage safety risks and promote system reliability. CSIN at SDG&E promotes and 9
supports the company’s safety culture by providing customers with information on preparing for 10
emergencies, the safe use of gas and electricity, and fire prevention. Customer feedback is 11
gathered and used to continuously improve services and communication related to safety. 12
Departments in CSIN also communicate safety messages to employees and hold safety meetings 13
and stand-downs intended to reduce or eliminate safety incidents. 14
III. NON-SHARED COSTS 15
Non-Shared O&M costs represent the costs of labor and non-labor activities required to 16
deliver services exclusively benefitting SDG&E and its customers and do not need to be 17
allocated out to other business units. Table LD-7 below summarizes the total non-shared O&M 18
forecasts for the listed cost categories. 19
TABLE LD-7 20 Non-Shared O&M Summary of Costs 21
CS - INFORMATION & TECHNOLOGIES (In 2016 $)
A. Customer Service Information 2016 Adjusted-Recorded
(000s)
TY 2019 Estimated
(000s)
Change (000s)
1. Residential Customer Services 5,262 6,267 1,0052. Business Services 5,037 4,812 -2253. Marketing, Research, & Analytics 6,219 8,574 2,3554. Customer Programs, Pricing, and Other Office
5,226 6,405 1,179
Total 21,744 26,058 4,314 22 23 24

LCD-9
A. Residential Customer Services 1
Table LD-8 below summarizes SDG&E’s requested TY 2019 expenses for RCS. 2
TABLE LD-8 3 Forecast for Residential Customer Services 4
CS - INFORMATION & TECHNOLOGIES (In 2016 $)
A. Customer Service Information 2016 Adjusted-Recorded
(000s)
TY 2019 Estimated
(000s)
Change (000s)
1. Residential Customer Services 5,262 6,267 1,005Total 5,262 6,267 1,005
5 Description of Costs and Underlying Activities 6
The RCS department is responsible for services and activities focused on delivering and 7
enhancing the overall customer experience of 3.6 million consumers. The overall mission of 8
RCS is to provide consistent, timely, efficient, and responsive service to customers and anticipate 9
their needs to proactively and effectively assist them with energy decisions. The key subgroups 10
within the RCS department are Residential Outreach, Office of Customer Experience, Office of 11
Customer Privacy, Clean Transportation, CCC, and Branch Offices. The expenses for the CCC 12
and Branch Offices are included in the Customer Service Office Operations testimony of Jerry 13
Stewart (Exhibit SDG&E-18). Additional descriptions of each RCS sub-group are provided 14
below. 15
Residential Outreach 16
The Residential Outreach group is responsible for developing and executing the outreach 17
plans and strategies around promotion of residential programs and services. This group 18
essentially provides the “feet on the street” and communicates directly to customers and external 19
stakeholders, educating and informing them about SDG&E products, services, and solutions. 20
Furthermore, this group engages employees and trains them to be the company ambassadors for 21
SDG&E’s numerous products, services, and solution offerings. 22
Office of Customer Experience 23
The Office of Customer Experience is responsible for coordinating and leading cross-24
departmental activities and fostering a customer-centric culture to improve the overall customer 25
experience. Serving in an advisory capacity to various SDG&E departments, this group assists 26
in the development of customer journey maps, identification of customer “pain points,” root 27

LCD-10
cause analysis of customer complaints, recommendations on how to address and improve the 1
customer experience, and measure effectiveness of changes that are implemented. 2
Office of Customer Privacy (OCP) 3
The OCP is responsible for safeguarding and advocating for customer privacy while 4
ensuring SDG&E meets its mandatory privacy requirements. A primary objective of the OCP is 5
to streamline operations by focusing on the automation of key privacy tasks. To ensure SDG&E 6
complies with privacy laws and California Public Utilities Commission (CPUC) rules, the OCP 7
works across the Company with departments that process and manage customer information to 8
reinforce customer privacy goals and objectives and analyze and minimize customer privacy 9
risks. 10
The Office of Customer Privacy consists of a formal customer privacy program, which 11
includes: 12
A privacy framework and controls that meet the Company’s Federal and State 13 privacy obligations, as well as industry-accepted best practices via the Generally 14 Accepted Privacy Principles (GAPP), while simultaneously incorporating Privacy 15 by Design (PbD) principles. 16
A Privacy Impact Assessment process and tools to help employees describe the 17 risk their projects, programs, and processes have on customer privacy and provide 18 controls and options to help mitigate that risk. 19
Privacy GreenLight is SDG&E’s enterprise process for sharing customer data 20 with authorized third parties when customer consent will not be obtained. This 21 process includes: analysis of the request to determine the level of sensitivity of the 22 data and identification of opportunities to minimize the amount of data shared; 23 thorough review of the third party’s privacy and security practices to minimize 24 breaches or unintended disclosures of information; assessments to evaluate risk 25 when sharing the information with the third party; drafting of non-disclosure 26 agreements where applicable; and secure transmission of data to the third party 27 once all reviews and approvals are met. 28
The ongoing and periodic delivery of privacy training to all active employees and 29 contractors with access to customer information. 30
The analysis of draft legislative and regulatory controls that may impact customer 31 privacy or the business processes that support privacy. 32
Coordination with SDG&E’s Information Security department on the Company’s 33 response to privacy breaches. 34
Collaboration with external privacy regulators and key stakeholders to share best 35 practices and advocate for the importance of protecting our customer’s energy 36 privacy. 37

LCD-11
SDG&E is working to develop a reputation for being a strong privacy advocate to further 1
our relationship with customers and maintain their trust. One example is a proof-of-concept 2
Differential Privacy project SDG&E is doing with Microsoft. Differential Privacy is a set of 3
tools governed by a mathematical algorithm that performs statistical analysis on a data set in 4
such a way that one can query the data without revealing any one individual whose data is in the 5
data set. The project is expected to be completed in 2017. When completed, SDG&E will 6
evaluate the effectiveness of the technology to provide self-service access to aggregated 7
customer data versus its current practice through individual requests. 8
Clean Transportation 9
The Clean Transportation group is responsible for education and outreach to all 10
customers with electric transportation information on metering, rates, demand response 11
programs, charging equipment, installation, safety, reliability, and the benefits of off-peak 12
charging. This group is also responsible for the management and implementation of the ongoing 13
requirements of the Assigned Commissioner’s Ruling regarding the filing of the Transportation 14
Electrification Applications pursuant to Senate Bill 350 issued in Rulemaking (R.) 13-11-007. 15
This includes all aspects and activities of transportation electrification, such as determining its 16
value and potential, developing enabling policies, regulations and business processes around 17
transportation electrification, and supporting enabling technology development. 18
Forecast Method 19
I chose a base year forecast method for Residential Customer Services because the last 20
recorded year accurately reflects the expense level associated with current and forecasted 21
departmental activity. Both labor and non-labor have exhibited an overall upward trend during 22
the 2012 - 2016 time-period, primarily due to the increased focus on rate education and outreach, 23
customer privacy, the transition of ongoing Dynamic Pricing support staff to O&M in BY 2016 24
referenced in the SDG&E test year 2016 GRC Application A.14-11-003 Ex. 101 (SDG&E-14), 25
and the expansion of the Clean Transportation group. Therefore, the base year provides a 26
reasonable starting point for future expenditures. 27
Cost Drivers 28
The Table LD-9 below summarizes the changes in the RCS estimated expenses for TY 29
2019. 30
31

LCD-12
TABLE LD-9 1 Changes in Residential Customer Services TY 2019 Estimated Expenses 2
Residential Customer Services TY 2019 - 2016 Change (000s)
Labor Non-
Labor Total FTEs
a. Employee Retirement -103 -103 -0.9b. Capital Project Impacts: Customer
Authorization Project 179 179 c. Customer Information Advisor 102 3 105 1.0d. Privacy Training 33 33
e. Cool Zones 43 43
f. Expansion of Clean Transportation 498 498 4.7
g. Electric Vehicle Education & Outreach 250 250 Total TY 2019 Impact 497 508 1,005 4.8
3 Employee Retirement – Voluntary Retirement Enhancement 4
Program (VREP) 5
The Residential Customer Services TY 2019 forecast reflects a ($103,000) reduction in 6
labor for a Customer Experience Project Manager position that was vacated due to an employee 7
retirement. This position and the job duties will be absorbed within the organization. As 8
discussed in our RAMP filing on Workforce Planning and in the testimony of Tashonda Taylor 9
(Exhibit SDG&E-30), SDG&E has used programs, like our recent VREP, to achieve an orderly 10
transition of knowledge and skills between select retirement-eligible employees and those 11
employees ready to move into leadership or other senior positions. The VREP offered a 12
voluntary separation package to a select group of retirement eligible employees in areas believed 13
to have skill surpluses to enable SDG&E to achieve balance and appropriate staffing for 14
projected workforce requirements. SDG&E has periodically offered similar VREP programs in 15
the past. 16
Capital Project Impacts – Customer Authorization Project 17
I am requesting $179,000 in non-labor above the BY 2016 for the maintenance of the 18
new enterprise-wide Customer Authorization functionality as a result of Capital Project 19
#T16036.5 This functionality will automate SDG&E’s current manual processes for managing 20
Letters of Authorization (LOA), also known as the Customer Information Service Request 21
5 See Section V.2.b.

LCD-13
(CISR) form, that customers use to provide consent to SDG&E to share their information with 1
third parties. Known as “Consent to Share™” this new functionality will support customers’ and 2
third parties’ ability to create, manage and revoke LOAs electronically. It will support mandated 3
programs, including Electric Rule 32 (Rule 32 is the tariff that governs the utility’s role in 4
supporting direct participation of third parties in the California Independent System Operator’s 5
(CAISO) markets) and California AB 802 (AB802 – Commercial Benchmarking) as well as a 6
variety of other reasons customers share data with third parties. Consent to Share will provide a 7
new online way for customers to provide authorization and will make it easier for customers to 8
provide, and for third parties to receive, consent for the purposes of sharing energy usage data 9
and other customer data. 10
Customer Information Advisor 11
I am requesting $102,000 in labor and $3,000 in associated non-labor costs above the BY 12
2016 for a Customer Information Management (CIM) Advisor. Smart Grid Privacy Decision 13
(D.)11-07-056, attachment D, section 6, established privacy control requirements for access to 14
customer information. Increasing demand by third parties and regulators for access to customer 15
information necessitates this additional resource to assure responsiveness and compliance with 16
the regulatory directives. The Office of Customer Privacy will continue to centralize and 17
automate the business processes for sharing customer data including the management of 18
customer consent, planning for self-service, and automated delivery of data to authorized third 19
parties. The CIM Advisor is responsible for managing the enterprise technologies that are 20
developed for this purpose. These technologies support the intake and validation of new requests 21
for customer information, business review support, aggregation and validation of data per 22
mandated requirements, secure delivery of data to authorized third parties, and assurance of 23
secure disposal when the data is no longer required for its intended purpose. The CIM Advisor is 24
also responsible for ensuring that relevant regulatory requirements for new mandated programs 25
with customer data sharing components are integrated into the Consent to Share platform 26
described above. 27

LCD-14
Privacy Training 1
I am requesting $33,000 in non-labor for privacy training. This amount represents the 2
normalized cost (one third of the total) of this privacy training, which spans over three years.6 3
The training will enable SDG&E to more efficiently comply with Ordering Paragraph 1 and 4
Section 9(c) of Attachment D of CPUC D.11-07-056, which states “Covered entities shall 5
provide reasonable training to all employees and contractors who use, store or process covered 6
information.” Additionally, this training aligns SDG&E with other California utilities’ privacy 7
training practices. SDG&E will contract with a third party to build, deploy and manage privacy 8
training for employees and contractors who use, store, or process covered information7. 9
Cool Zones 10
I am requesting $43,000 in non-labor to support the operation of Cool Zones per D.16-11
11-022, Ordering Paragraph 116, that directs California electric Investor-Owned Utilities to 12
include cooling center costs in their General Rate Case proceedings going forward. Operational 13
since 2001, the Cool Zone program was created out of concern for seniors and disabled persons 14
with health problems that might escalate during periods of extreme heat. SDG&E has partnered 15
with the County of San Diego and its Aging and Independence Services Department (AIS) for 16
the past 15 years to support this initiative, which helps thousands of vulnerable senior, special 17
needs, and disabled constituents locate an air-conditioned place to spend time during hot summer 18
days. SDG&E customers who visit these Cool Zone locations have an added benefit to save on 19
their utility bills by running their home air conditioning less or not at all. AIS administers and 20
oversees the Cool Zone program with annual program support provided in part by SDG&E. 21
An interactive map as seen in Figure LD-1 below is available to customers on SDG&E’s 22
website, sdge.com/cool-zones, which shows locations of Cool Zone sites by zip code, and 23
provides the days and hours of operation for each location. This website has zoom functionality 24
for customers who are visually impaired, allowing them to increase the page view up to 400%. 25
26
6 If the four year GRC cycle is adopted, as proposed in the testimony of Kenneth Deremer (Exhibit SDG&E-43), then this calculation will need to be revised to reflect that.
7 Covered information is usage information obtained through the capabilities of Advanced Metering Infrastructure (interval usage data) when associated with any information that can reasonably be used to identify an individual, family, household, residence, or non-residential customer. D.11-07-056 at 150-151, Conclusions of Law 9 and Attachment D at 1.

LCD-15
FIGURE LD-1 1 Interactive Cool Zone Map at SDG&E’s Website 2
3 4 5 6 7 8 9 10 11 12 13 14 15 16 17 18 19 20 21 22 23 24 25 26 27 28 29 30 31 32 33 34
Expansion of Clean Transportation 35
I am requesting $498,000 in labor above the BY 2016 for the expansion of Clean 36
Transportation programs in support of state policy goals to reduce greenhouse gas emissions. 37
This increase is for the addition of 4.7 Full Time Equivalents (FTEs) who support the areas of 38
Business Development, Financial Analysis, and Customer Engagement. Three of these positions 39
consist of a Regulatory & Policy Manager, a Marketing, Research & Analytics Analyst, and a 40
Project Manager. The Regulatory & Policy Manager understands the regulatory structure of the 41
gas and electric industries and the business interests of SDG&E’s Clean Transportation efforts 42

LCD-16
and applies that knowledge to oversee the preparation of position papers, analytical studies, 1
direct testimony, rebuttal arguments, and discovery response review to be used in transportation 2
electrification regulatory proceedings. Also, this resource is a primary liaison with external 3
agencies including the CPUC, California Energy Commission (CEC), California Air Resources 4
Board (CARB), and other regulatory agencies for Clean Transportation business matters. The 5
Marketing, Research & Analytics Analyst develops, analyzes, and interprets a wide range of 6
technical and specialized data using economic or statistical methods for Clean Transportation 7
initiatives. The Project Manager is responsible for developing regulatory and legislative policy 8
positions, strategies and mechanisms that support Clean Transportation’s business plans and 9
objectives. Collectively, these positions will be responsible for managing and implementing 10
future regulatory filings, market analysis, and public policy as it pertains to future transportation 11
electrification filings pursuant to Senate Bill 350. 12
The remaining FTEs consist of a Business Analyst supporting the calculation of revenue 13
requirements, rate impact analysis and cost studies, and a Customer Outreach Manager 14
supporting future customer engagement, all pertaining to future transportation electrification 15
filings pursuant to Senate Bill 350. 16
Electric Vehicle Education & Outreach 17
I am requesting $250,000 in non-labor above the BY 2016 for targeted education and 18
outreach costs to support the growing number of customers in SDG&E’s service territory 19
expected to purchase electric vehicles (EVs). Based on D.11-07-029 at 68, the CPUC 20
established principles and requirements to guide utility education and outreach for EVs, and 21
ordered SDG&E to provide customers with information on the choices available for rates, 22
charging equipment and installation, and off-peak charging. It also required EV education and 23
outreach to utility customers about the environmental benefits of driving electric as related to the 24
reduction of greenhouse gas emissions (GHG) set forth by AB 32 – requiring reduction of the 25
state’s GHG emissions to 1990 levels by 2020. On January 1, 2017, Senate Bill 32 accelerated 26
these goals to reduce GHG emissions to 40% below the 1990 level by 2030. With the 27
transportation sector accounting for nearly 40% of the state’s GHG emissions,8 and 28
8 California California’s Greenhouse Gas Emission Inventory – 2017 Edition. The California Air Resources Board (CARB) is responsible for maintaining and updating the State’s GHG Inventory per Cal Health & Safety Code §39607.4.

LCD-17
approximately 50% of GHG emissions in SDG&E’s service territory,9 education and outreach 1
efforts on the benefits of transportation electrification must be significantly increased. 2
To meet Governor Jerry Brown’s goal to have 1.5 million electric cars on California 3
roads by 2025,10 the San Diego region will need to see a much stronger adoption rate of EVs 4
than it has seen to date. SDG&E will seek to increase EV adoption, while reducing GHG 5
emissions, by leveraging the work already being done in this region and increasing efforts where 6
additional education and outreach will receive its best return on investment. For example, 7
SDG&E successfully leveraged the education and outreach aspects of its new Electric Vehicle 8
Climate Credit program launch into the highest amount of EV TOU rate sign ups that it had seen 9
in any prior month. SDG&E’s program not only provided EV drivers with a bill credit for 10
driving electric, but they were also able to sign up for a rate that encourages EV charging at 11
times beneficial to the grid. 12
To further advance EV adoption/purchase, SDG&E’s Power Your Drive EV charging 13
station program is installing 3,500 charging stations at 350 apartments, condos and businesses. 14
While the program has its own education and outreach effort directed to properties to install the 15
charging stations and to teach EV drivers how to use them, this effort can be significantly 16
leveraged by hosting EV ride-and-drives at each of the workplace and multifamily locations to 17
grow EV adoption where drivers know they can find a charge. 18
The statewide EV education campaign, Veloz,11 will launch in 2017, with the goal to 19
advance the electric car movement. SDG&E can effectively leverage Veloz messaging and 20
campaign successes to help move EV adoption to the mainstream. Together with this year’s 21
launch of the Chevy Bolt and Tesla Model 3, potential EV drivers will see decreases in EV 22
prices while battery ranges increase. This means reduced EV purchase barriers for customers 23
living in disadvantaged or underserved communities, and education and outreach efforts can 24
keep the momentum going by providing information on how easy it is to sign up for a TOU rate 25
9 3 EPIC San Diego County Updated GHG Emissions Inventory (2013), p. 3, http://catcher.sandiego.edu/items/usdlaw/EPIC-GHG-2013.pdf.
10 Executive Order B-16-2012.
11 Veloz is a California-based nonprofit organization with the mission to advance the electric car movement.

LCD-18
to provide drivers with the lowest price for their fuel, and to install any necessary charging 1
facilities. 2
According to CARB’s April 12, 2017 report,12 one of the top four ways to overcome 3
barriers to access clean transportation is by expanding education and outreach and providing 4
permanent funding to do so in low-income and disadvantaged communities to increase 5
awareness. The report’s examples include: expanding educational curricula for kindergarten 6
through 12th grade students; increasing knowledge of ridesharing and demand response options 7
such as Lyft, many of which use electric vehicles; and developing a network of car dealerships 8
that low-income residents can rely on for the purchase or lease of clean technology used and new 9
vehicles. 10
SDG&E’s commercial customers are increasingly requesting information on the total cost 11
of ownership and best practices of transportation electrification for medium- and heavy-duty 12
fleet vehicles. Education and outreach to these groups in the form of workshops, webinars and 13
demonstrations is expected to increase and will help grow electric adoption for this segment. 14
Combining these additional efforts with our current efforts will create a robust education 15
and outreach campaign to help increase EV adoption in the San Diego region and support the 16
state’s GHG reduction goals. 17
Memorandum Accounts 18
Memorandum Account – AFVMA 19
The AFVMA was established pursuant to Ordering Paragraph 7 of D.13-11-002. The 20
costs recorded in the AFVMA are incurred for expenses related to implementation of the sub-21
metering pilots, that are above what could reasonably be recovered through the Electric Program 22
Investment Charge (EPIC).13 Costs recorded in this memorandum account cannot exceed $2 23
million per utility in the case of co-funding from EPIC and cannot exceed $5 million per utility 24
in the case that the EPIC program is not authorized. Since SDG&E did not have an electric 25
12 California Air Resources Board Draft Guidance Document, Low-Income Barriers Study, Part B: Overcoming Barriers to Clean Transportation Access for Low-Income Residents, p. 53, https://www.arb.ca.gov/msprog/transoptions/draft_sb350_clean_transportation_access_guidance_document.pdf.
13 EPIC is the customer funded research, development and deployment program authorized by the CPUC. Twenty percent of the funds are administrated by all three electric IOUs and 80% of the funds are administrated by the CEC.

LCD-19
vehicle EPIC project proposal at the time of this Decision, all sub-metering pilot costs were 1
charged to the AFVMA. Specifically, the function and activity costs included in the AFVMA 2
were for establishing subtractive billing capabilities for the pilot, including the receipt and 3
management of third party EV charging data, to support up to 500 eligible sub-metering 4
participant customers for 12 billing months for each pilot phase, dis-enrolling participants after 5
the end of each pilot phase, paying incentives to third party Electric Vehicle Service Providers 6
for their enrollment and meter data management and exchange services, and paying 1/3 of the 7
cost of a third party evaluator contracted by Pacific Gas and Electric (PG&E). The phase 1 pilot 8
ran between September 1, 2014 and August 31, 2016; the phase 2 pilot runs between January 16, 9
2017 through April 30, 2018. Based on D.13-11-002, Ordering Paragraph 7, SDG&E is to seek 10
cost recovery in an appropriate ratemaking proceeding, therefore SDG&E respectfully requests 11
AFVMA recovery in this GRC. Based on the foregoing, the costs recorded by SDG&E are in 12
compliance with D.13-11-002, are reasonable, and should be approved by the Commission. 13
Upon approval, this account will be closed. Additional information regarding regulatory 14
accounts is provided in the direct testimony of SDG&E Regulatory Account witness Norma 15
Jasso (Exhibit SDG&E-41). Table LD-10 below shows the activity in this memorandum 16
account. 17
TABLE LD-10 18 Alternative Fuel Vehicle Memo Account 19
Year Expenses InterestAccount Balance
2014 315,257 204 $ 315,461 2015 1,388 460 $ 317,309 2016 505,250 2,282 $ 824,841
Jan-Jun 2017 219,883 3,957 $ 1,048,681 20
Memorandum Account - EDRMA 21
The EDRMA was established pursuant to Ordering Paragraph 13 of D.14-05-016. The 22
costs associated with the EDRMA were incurred for developing processes and technologies and 23
providing labor to support functions and activities related to managing Energy Data Access 24
Rules. More specifically, the functions and activities include the development and production of 25
the Energy Data Access website and back-end workflow automation, tracking and metrics 26
required to support the requirements of the Energy Data Access Decision, including needed 27
software, licensing and labor to enable and manage the service, as well as labor to manage 28
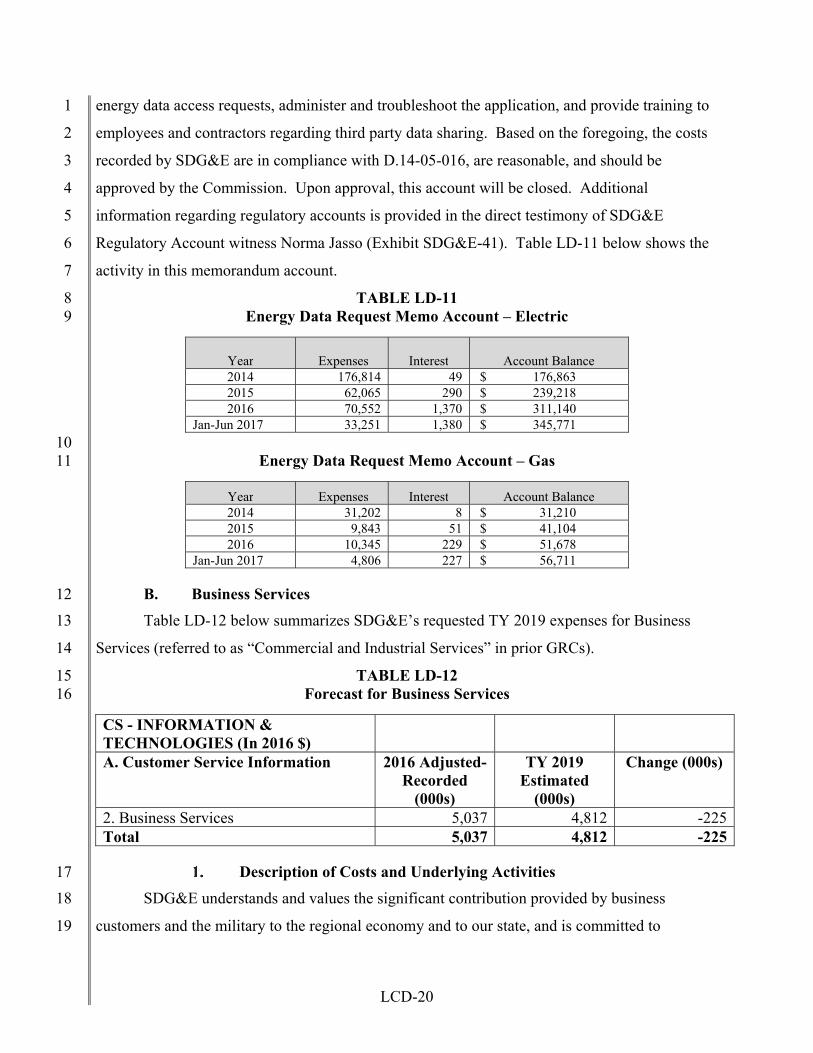
LCD-20
energy data access requests, administer and troubleshoot the application, and provide training to 1
employees and contractors regarding third party data sharing. Based on the foregoing, the costs 2
recorded by SDG&E are in compliance with D.14-05-016, are reasonable, and should be 3
approved by the Commission. Upon approval, this account will be closed. Additional 4
information regarding regulatory accounts is provided in the direct testimony of SDG&E 5
Regulatory Account witness Norma Jasso (Exhibit SDG&E-41). Table LD-11 below shows the 6
activity in this memorandum account. 7
TABLE LD-11 8 Energy Data Request Memo Account – Electric 9
Year Expenses Interest Account Balance 2014 176,814 49 $ 176,863 2015 62,065 290 $ 239,218 2016 70,552 1,370 $ 311,140
Jan-Jun 2017 33,251 1,380 $ 345,771 10
Energy Data Request Memo Account – Gas 11
Year Expenses Interest Account Balance 2014 31,202 8 $ 31,210 2015 9,843 51 $ 41,104 2016 10,345 229 $ 51,678
Jan-Jun 2017 4,806 227 $ 56,711
B. Business Services 12
Table LD-12 below summarizes SDG&E’s requested TY 2019 expenses for Business 13
Services (referred to as “Commercial and Industrial Services” in prior GRCs). 14
TABLE LD-12 15 Forecast for Business Services 16
CS - INFORMATION & TECHNOLOGIES (In 2016 $)
A. Customer Service Information 2016 Adjusted-Recorded
(000s)
TY 2019 Estimated
(000s)
Change (000s)
2. Business Services 5,037 4,812 -225Total 5,037 4,812 -225
Description of Costs and Underlying Activities 17
SDG&E understands and values the significant contribution provided by business 18
customers and the military to the regional economy and to our state, and is committed to 19
LCD-21
providing these customers with the level of customer service needed for them to thrive. 1
Providing relevant, timely, and responsive customer support requires strong and collaborative 2
relationships with business customers and an understanding of their energy needs. 3
Within SDG&E’s service territory in BY 2016, business customers represented 4
approximately 160,000 electric meters with sales totaling $1.9 billion or 58% of all SDG&E 5
electric sales and 33,000 gas meters, representing sales of $133 million or 30% of all SDG&E 6
gas sales. Business Services (BuS) provides customer-focused education, expertise and analysis 7
surrounding energy rates, tariff services, energy efficiency, demand response, safety, and 8
regulatory information through various channels. BuS uses research studies and a collaborative 9
process working with other SDG&E departments, customers and the business community to 10
identify and provide value to its customers and seeks to continuously improve the quality and 11
content of its support activities. To effectively meet the wide and growing array of business 12
customers’ complex energy needs, SDG&E delivers customer service through a team of highly 13
trained and specialized personnel. BuS activities are broken down into two functional areas: 14
Business Account Management and Customer Services Staff Support. 15
Business Account Management 16
This workgroup takes a customer-centric approach to serving all business customers, 17
large, medium, and small. 18
In BY 2016, large business customers represented energy usage totaling roughly 45% of 19
all energy sales for business customers and combined utility bills of over $795 million. Account 20
management services are provided to large commercial, industrial, and governmental customers 21
through an Account Executive (AE) team who are supported by management, staff and 22
administrative personnel. Each AE manages an average of 800 electric and natural gas accounts 23
(40-50 customers) and is assigned to a unique market segment to cultivate more in-depth market 24
knowledge and provide tailored customized service. The interactions between an AE and the 25
customer are critical to ensure that customers are well informed about rate and service options, 26
have someone that is familiar with their large and more complex service needs, and who can 27
resolve their unique service issues quickly, safely and reliably. 28
The AE provides the single point of contact with SDG&E for large business customers 29
and assists them with billing questions, rate analysis, credit issues, inquiries regarding service or 30
facility infrastructure changes, energy management questions, regulatory decisions, tariff 31

LCD-22
changes, other programs and services such as direct access or distributed generation, power 1
quality, or general energy industry information. 2
In BY 2016, small and medium business customers represented approximately 180,000 3
electric and gas meters. The small and medium business customers look to SDG&E to provide 4
them with information regarding energy issues that will directly impact their business, keep them 5
apprised of regulatory matters and rate changes, present solutions on how to save money on their 6
energy bill, and for safety-related messages. Unlike the large business customer who may 7
employ skilled engineering staff to help them manage their energy usage, the small and medium 8
business owners frequently fill multiple roles and may lack the expertise, background, or even 9
the time to understand complex energy messages and offers. Because of the limited time and 10
resources they can dedicate to energy issues, these customers rely on SDG&E to personalize the 11
myriad of energy rate options and solutions for ease of use and understanding. These business 12
owners may have language or cultural differences to overcome; therefore, communications must 13
be clear and relevant to a diverse group of customers. These unique characteristics make this 14
segment one of the most difficult to engage, such that targeted outreach campaigns and 15
customized tailored treatments are the best approach to serve this customer base. 16
Customer Services Staff Support 17
Customer Services Staff Support provides specialized assistance and expertise in many 18
different areas including infrastructure project coordination, billing assistance services, reliability 19
information, rate analysis, technical assistance on end use equipment, development of outreach 20
tools and materials, and employee and customer education materials and training. 21
Customer Energy Specialists directly help small business and residential customers with 22
more complex problems than the Customer Contact Center is able to resolve and that typically 23
require a site visit for resolution. They work with the customer over the phone to explain rate 24
options and billing issues and make site visits to further research and satisfy customer issues 25
(billing, meter service, high bills), provide tips on how to reduce bills, and address any safety 26
issues found. 27
The Planned Outage Coordination Team coordinates all planned outages for SDG&E. In 28
BY 2016, the Planned Outage Coordination Team processed a total of 7,119 planned outages, 29
impacting 25,465 commercial customers and 220,414 residential customers. Once a planned 30
outage date has been established, all customers are notified via telephone, email (if available), 31

LCD-23
and direct mail a minimum of six days in advance of the upcoming outage. In addition, the 1
Planned Outage Coordinator will contact directly, via phone, all life support and medical 2
baseline customers who will be impacted by a planned outage. If the Planned Outage 3
Coordinator is unable to reach a life support customer by phone or via message, they must 4
attempt to make physical contact with the customer. Depending on the customer types impacted 5
and nature of the planned outage, additional planning, coordination and communication beyond 6
the standard messaging may be required. 7
Account, Billing and Rate Management Services are provided to business customers who 8
have multiple or even hundreds of accounts. This function helps customers reconcile their bills 9
and understand their rate options, credit requirements and service change requests. 10
Infrastructure Coordination works with the customer and SDG&E’s Project Management 11
group on construction projects, relocations, customer-requested maintenance outages, service 12
upgrades, pulse meters to integrate meter data with customer energy management systems, and 13
meter change outs. They develop the project scope, represent the customer’s needs, explain 14
utility requirements, and help the customer complete necessary documentation required for 15
infrastructure projects. 16
Safety and Critical Event Support coordinates the safety education and outreach efforts to 17
support all business customers. As a result of the wildfires in 2007, the winter storms in 2010, 18
and regional earthquake activity, SDG&E identified a growing need to help its customers be 19
better informed and prepared to respond to emergency situations regarding their energy service. 20
Some of these activities are included in the RAMP 2016 embedded base costs shown in Table 21
LD-6. 22
Tariff Development and Review monitors and participates in proceedings that impact 23
large commercial and industrial and government customers, including but not limited to the 24
Triennial Cost Allocation Proceeding (TCAP), Rate Design Window (RDW), Demand Response 25
(DR) programs, and Net Energy Metering (NEM). The staff also prepares rate analyses for 26
customers and provides internal and external rate training. 27
Customer Choice team is responsible for implementing and managing SDG&E’s 28
Customer Choice Programs, which include Electric Direct Access (DA), Community Choice 29
Aggregation (CCA), the Noncore Gas Transportation Program for large customers, and the Core 30
Aggregation Transportation (CAT) Program. This group performs a wide variety of functions to 31

LCD-24
support and educate customers seeking these alternate energy services. The Customer Support 1
staff interfaces with Electric and Gas Energy Service Providers (ESP) daily, providing internal 2
and external education, and proactive communication regarding the applicability and operations 3
of the programs. In addition, this staff is responsible for customer and ESP contract management 4
administration, compliance with Sarbanes Oxley (SOX), and conducting a biennial gas pipeline 5
capacity open season. 6
Gas Transportation Administration provides gas aggregation and transportation services 7
for SDG&E’s core and noncore self-procurement customers. This activity involves working 8
with customers and their third-party providers and managing the pipeline capacity open season. 9
Every contract goes through a rigorous SOX compliance review and is approved by SDG&E 10
management. SDG&E staff provides monthly balancing reports to customers and their gas 11
providers and a monthly core storage report that highlights firm withdrawal rights or injections. 12
Special Contracts and Services supports development of special contracts to meet the 13
needs of customer projects that don’t conform to existing rules and yet provide value to, and do 14
not harm, our customers. These special contracts require analysis to ensure that these customers’ 15
interests are not being cross-subsidized. Each year there are unique proposals that SDG&E 16
needs to assess and, if needed, file with the CPUC. 17
Business Services Outreach disseminates energy education materials, including 18
regulatory proceedings and mandated communications, emergency event and safety 19
communications, quarterly customer newsletters, rate updates, and other information important 20
to customers. In addition, as more energy-related legislation and regulation is enacted, 21
customers look to SDG&E to help them understand new requirements, steps they must take to be 22
compliant, and how this will impact their day-to-day business operations, energy consumption 23
and costs. SDG&E is continually developing new educational materials, seminars and 24
workshops to address the growing demand for information that will support business customers 25
in their efforts to become more sustainable, and to understand the impact of changes to 26
regulations and legislation. 27
Forecast Method 28
I chose a base year forecast method for TY 2019 GRC because the business has changed 29
significantly due to Small and Medium Business (SMB) TOU Default. Starting in 2015, a 30
special task force was created to assist SMB Customers with making decisions in regards to their 31

LCD-25
pricing plan. Additional self-service tools were added to aid in customer understanding of their 1
pricing options while reducing reliance on support staff. Furthermore, BY 2016 labor and non-2
labor costs are more reflective of the costs needed to support increasing customer interactions. 3
Therefore, the base year provides a reasonable starting point for future expenditures. 4
Cost Drivers 5
Table LD-13 below summarizes the changes in Business Services estimated expenses for 6
TY 2019. 7
TABLE LD-13 8 Changes in Business Services TY 2019 Estimated Expenses 9
Business Services TY 2019 - 2016 Change (000s)
Labor Non-
Labor Total FTEs
AB802 (Commercial Benchmarking) 100 80 180 1.0
Business Optimization (FOF) -405 -405 -5.0Total TY 2019 Impact -305 80 -225 -4.0
10 AB802 – Commercial Benchmarking Support 11
I am requesting $100,000 in labor for a Benchmarking Administrator and $80,000 in non-12
labor above the BY 2016 to support the ongoing expenses related to California AB802. This 13
Administrator will work with building owners, their agents and customers to process AB802 14
requests in compliance with AB802 and CEC Benchmarking Regulations. AB802 was signed 15
into law in October 2015 to provide building owners with the ability to request and obtain energy 16
usage data so they can benchmark their buildings.14 To comply with the provisions of the statute 17
and with the subsequent Benchmarking Regulations being developed and promulgated by the 18
CEC, SDG&E is building new systems to automate and process the requests from building 19
owners. The $80,000 in non-labor will cover license fees, monthly maintenance and hosting 20
costs, and necessary enhancements to the systems. 21
Business Optimization - FOF 22
The BuS TY 2019 forecast reflects a ($405,000) reduction in labor for the various 23
process improvements across this business unit. In BY 2016 BuS identified processes within the 24
14 Benchmarking is the process of measuring a building’s energy consumption and comparing it against past performance and to other similar buildings. The Environmental Protection Agency (EPA) uses ENERGY STAR® Portfolio Manager to benchmark and rank a building’s energy performance on a scale of 1 to 100 (a score of 75 means a building performs better than 75% of similar buildings nationwide).

LCD-26
organization that needed detailed analysis and redefinition. Once implemented, these process 1
improvements are anticipated to result in organizational efficiencies and labor savings. 2
Memorandum Account – AB802 Commercial Benchmarking 3
The AB802 Commercial Benchmarking memorandum account was established through 4
Advice Letter 2870-E/2463-G to comply with the AB802 Statute discussed above and the 5
subsequent benchmarking regulations being developed by the CEC. Section 5 of AB802 adds 6
Cal. Pub Res Code §25402.10(g), which states, “The reasonable costs of an electrical or gas 7
corporation in delivering electrical or gas usage data pursuant to this section or other information 8
as required under state or federal law or by an order of the commission shall be recoverable in 9
rates evaluated and approved by the Public Utilities Commission.” The Memorandum Account 10
covers the costs associated with the AB802 project work, IT system costs, and business change 11
management activities. IT system costs include the design, development, implementation and 12
testing of a new application to process AB802 benchmarking requests, integration with EPA 13
Portfolio Manager, and modifications and integrations to SDG&E internal systems. Business 14
change management activities include, but are not limited to, the development and 15
implementation of new business processes, changes to the SDG&E website, development of 16
communication and training materials, and the delivery of training. Based on the foregoing, the 17
costs recorded by SDG&E are in compliance with AB802, are reasonable, and should be 18
approved by the Commission. Upon approval, this account will be closed. Additional 19
information regarding regulatory accounts is provided in the direct testimony of SDG&E 20
Regulatory Account witness Norma Jasso (Exhibit SDG&E-41). The Table LD-14 below shows 21
the activity in this memorandum account. 22
TABLE LD-14 23 AB 802 Memo Account – Electric 24
Year Expenses Interest Account Balance 2016 89,871 120 $ 89,991
Jan-Jun 2017 56,518 504 $ 147,013
AB 802 Memo Account – Gas 25
Year Expenses Interest Account Balance 2016 42,293 57 $ 42,350
Jan-Jun 2017 26,596 238 $ 69,184
LCD-27
C. Marketing, Research & Analytics 1
Table LD-15 below summarizes SDG&E’s requested TY 2019 expenses for Marketing, 2
Research & Analytics (MRA). 3
TABLE LD-15 4 Forecast for Marketing, Research and Analytics 5
CS - INFORMATION & TECHNOLOGIES (In 2016 $)
A. Customer Service Information 2016 Adjusted-Recorded
(000s)
TY 2019 Estimated
(000s)
Change (000s)
3. Marketing, Research, & Analytics 6,219 8,574 2,355Total 6,219 8,574 2,355
6 Description of Costs and Underlying Activities 7
The MRA department is responsible for a wide variety of activities, which include 8
developing strategic marketing plans, execution of communication tactics across various 9
channels (such as mass, direct, social and digital), oversight and management of SDG&E’s 10
websites, conducting qualitative and quantitative customer research and analytics, supporting 11
statewide collaboration regarding various marketing initiatives, and providing key services 12
through mobile application development and management. 13
The primary functional areas managed by the MRA department include: 14
Mass Communication 15
SDG&E proactively communicates to customers and stakeholders via mass and targeted 16
channels to increase customers’ awareness, understanding, and engagement with SDG&E 17
services and solutions. This includes marketing of rates and numerous programs, as well as 18
communication and education about safety and emergency preparedness. For example, SDG&E 19
communicates annually via targeted messaging to customers in the high fire risk areas of San 20
Diego to promote safety and outage preparedness. In addition, an annual campaign is launched 21
to inform customers about seasonal energy use issues, such as the impact of air conditioner use 22
and changes to baseline allowances, as well as energy safety. Some of these activities are 23
included in the RAMP 2016 embedded base costs shown in Table LD-6. 24
Digital 25
MRA provides oversight and management of sdge.com, the company’s mobile app, and 26
the customer facing aspects (graphics and content) for the My Account website, including 27
LCD-28
addressing accessibility standards for customers with disabilities. Examples of website 1
management activities include: 2
daily updates of information on customer service changes and refinements; 3
development and posting of new information; 4
daily section content updates; and 5
development of new sections as informational needs arise. 6
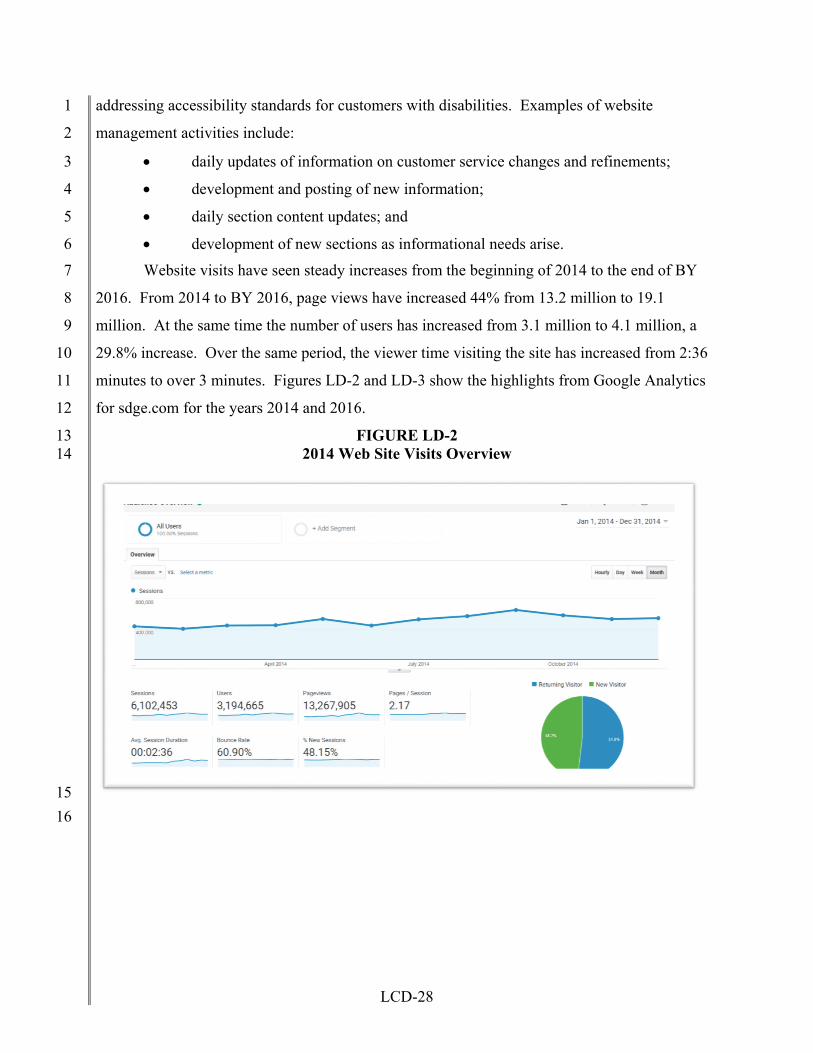
Website visits have seen steady increases from the beginning of 2014 to the end of BY 7
2016. From 2014 to BY 2016, page views have increased 44% from 13.2 million to 19.1 8
million. At the same time the number of users has increased from 3.1 million to 4.1 million, a 9
29.8% increase. Over the same period, the viewer time visiting the site has increased from 2:36 10
minutes to over 3 minutes. Figures LD-2 and LD-3 show the highlights from Google Analytics 11
for sdge.com for the years 2014 and 2016. 12
FIGURE LD-2 13 2014 Web Site Visits Overview 14
15
16

LCD-29
FIGURE LD-3 1 2016 Web Site Visits Overview 2
3
Mobile Applications (APP) 4
MRA is responsible for the App development and management across iOS and Android 5
platforms, which provides key services for customers. Functionality includes Bill Pay, My 6
Energy, Outage Map, Energy Cost Calculator, and Report an Outage. 7
Additional support of the growth of digital engagement can be seen by the level of 8
activity on the SDG&E App. The figure LD-4 below shows activity data (views) for three of the 9
most popular functions available in the App: 10
Bill Pay: this functionality displays the account balance and due date as well as 11 various options to make a payment. 12
Outage Map: enables users to view outage activity in the sdge.com service 13 territory via the mobile app and filter outages by “Unplanned, Planned Active and 14 Planned Future.” 15
Energy use charts (My Energy): this online tool provides customers with a 16 customized overview of how much and when their home uses energy and lists 17 additional resources, such as personalized energy-saving recommendations, 18 pricing plan options and alerts and subscriptions. 19
20

LCD-30
FIGURE LD-4 1 Mobile App Activity Comparisons 2
3
An additional piece of information related to digital engagement shows the upward trend 4
of people registered for SDG&E’s My Account tool and the number of mobile app downloads 5
since 2013, as shown in Figures LD-5 and LD-6 below. 6
7
0
10,000
20,000
30,000
40,000
50,000
60,000
70,000
80,000
90,000Dec '13
Feb '14
Apr '14
Jun '14
Aug '14
Oct '14
Dec '14
Feb '15
Apr '15
Jun '15
Aug '15
Oct '15
Dec '15
Feb '16
Apr '16
Jun '16
Aug '16
Oct '16
Views
Months
Mobile App Activity (views)
My Energy
Outage Map
Bill Pay

LCD-31
FIGURE LD-5 FIGURE LD-6 1
2
January 2014 2015 2016 2017
My Account Registered Users 730,131 795,152 858,315 913,113
Mobile App Downloads 55,026 109.859 163,619 240,008 3
As shown by these figures, there is a steady increase in the customer interactions on 4
SDG&E’s digital channels and this trend is expected to continue. SDG&E’s objective is to 5
provide an excellent digital customer experience and ensure that it is easy for customers to 6
transact with us. 7
Collateral Design and Production 8
MRA leads and manages the creation of printed and electronic outreach materials 9
(developed internally or by an external agency) that meet marketing and communication 10
objectives and align with the overall SDG&E brand identity. These materials can be printed, 11
delivered digitally through SDG&E’s website or via email, or both. 12
Research & Analytics 13
MRA is responsible for analyzing customer insights stemming from primary customer 14
research, secondary sources, and analytics to assist decision-making throughout the organization 15
in support of SDG&E’s business strategies and goals. This includes both qualitative and 16
quantitative research to measure and evaluate customer perceptions, preferences, feedback on 17
quality of service delivered, anticipation of future needs and preferences, as well as conducting 18
analysis utilizing internal customer data and third-party data. Research and analytics enrich our 19
understanding of customer expectations, needs and behaviors, and enable not only service 20

LCD-32
improvement but also the execution of targeted marketing, education and outreach efforts with 1
tailored messages for a wide variety of audiences. 2
Social Media Engagement 3
MRA engages customers through social media channels, such as Facebook and Twitter, 4
to communicate service offerings, outage updates, emergency and safety messages. Social 5
media is a growing consideration in all our communications efforts, with planning and strategies 6
included in the initial development stages of marketing plans. 7
In addition to a significant increase of visits to the website, sdge.com, figure LD-7 below 8
shows the steady growth in engagement with our social media channels. Data for the first six 9
months of 2017 (January through June) is compared to the same time frame in 2016 to illustrate 10
this growth trend. Figure LD-8 and LD-9 shows SDG&E’s Twitter and Facebook homepages 11
respectively. 12
FIGURE LD-7 13 Social Media Follower Growth from 2016 to 2017 14
15
16
17 18
‐
5,000
10,000
15,000
20,000
25,000
30,000
35,000
40,000
Jan Feb Mar Apr May Jun
Social Media Follower Growth 2016 ‐ 2017
Facebook 2016 Facebook 2017 Twitter 2016 Twitter 2017
Jan Feb Mar Apr May Jun Jul Aug Sep Oct Nov DecFacebook 2016 3,413 3,492 3,517 3,616 3,665 3,710 3,795 3,845 4,068 4,105 4,161 4,350 Facebook 2017 4,683 4,799 4,935 5,019 5,153 5,297
Twitter 2016 28,891 29,444 29,678 29,842 30,055 30,526 30,785 31,193 31,442 31,767 32,039 32,285 Twitter 2017 32,571 33,013 33,196 33,373 33,605 33,778

LCD-33
FIGURE LD-8 1 SDG&E’s Twitter Homepage 2
3
FIGURE LD-9 4 SDG&E’s Facebook Homepage 5
6
Forecast Method 7
I chose a base year forecast method for TY 2019 because the last recorded year 8
accurately reflects the expense level associated with current and forecasted departmental activity. 9

LCD-34
Non-labor has exhibited an overall downward trend during the 2012 – 2016 time-period, 1
although the communication related to rates and energy pricing will continue to increase as 2
residential rate reform progresses. Therefore, the base year provides a reasonable starting point 3
for future expenditures. 4
Cost Drivers 5
Table LD-16 summarizes the changes in the MRA estimated expenses for TY 2019. 6
TABLE LD-16 7 Changes in Marketing, Research, and Analytics TY 2019 Estimated Expenses 8
Marketing, Research, and Analytics TY 2019 - 2016 Change (000s)
Labor Non-
Labor Total FTEs
Rate Education & Outreach 1,700 1,700
Marketing Automation 70 70
Outage Communication 72 72 Customer Insight - Surveys 185 185 Multicultural Campaign 450 450 Contact Information Campaign 250 250 RAMP–Summer and Winter Prep Communication 100 100 Business Optimization: FOF -472 -472 Total TY 2019 Impact 2,355 2,355
9 Rate Education and Outreach 10
I am requesting $1,700,000 in non-labor above the BY 2016 to educate customers about 11
the changing landscape of energy pricing and new rate options. In SDG&E’s TY 2016 GRC, 12
2015-2018 was described as a time of tremendous change for customers as rate reform is being 13
implemented. Rate reform will bring new pricing options to customers and require them to have 14
an increased level of involvement with the management of their energy use. To assist customers 15
with this process, SDG&E proposed to increase communications using a wide range of available 16
channels to offer information to help inform and educate them about the changes occurring and 17
options available. Funding to support new rate options and programs was approved in the TY 18
2016 GRC case D.16-06-054. However, due to various reasons, rate reform has progressed at a 19
slower pace than anticipated and not all of the outlined planned activities were implemented in 20
BY 2016 due to the change in timing. 21
It is now expected that most marketing, education and outreach for the implementation of 22
a new High Usage Charge (HUC) and transition to default TOU pricing plans will occur from 23

LCD-35
2017 to 2020. Building awareness and preparing customers for new rates and rate changes is as 1
critical now as before. The above request will enable us to educate SDG&E’s customers on 2
upcoming changes related to activities such as the HUC, the concept of “When You Use Energy 3
Matters,” TOU period changes, and the distribution of bill comparisons. This funding request 4
also includes research studies to measure the effectiveness of the deployed communications 5
activities. In addition, SDG&E will apply marketing automation techniques that enable 6
streamlining of digital processes and faster reporting on results. 7
The communication channels to be used may consist of mass media (e.g., television, 8
print, radio), targeted tactics (e.g., direct mail, email, bill inserts, and collateral), as well as 9
outreach activities such as events and workshops. 10
Customer research will be used to measure effectiveness and refine messaging specific to 11
the rate reform communications and education efforts. Based on the complexity and evolving 12
nature of the messaging that will be needed to create a positive experience for customers, and 13
behavior changes that may be needed for them to understand that it matters what time of the day 14
they use energy to be successful on a TOU rate, I believe the amount of base GRC funding 15
requested is necessary and appropriate. 16
Messages during this time will evolve and progress from preparing people for the coming 17
changes and explaining the details of these changes, to explaining the reasons and benefits to 18
customers of time variant rates, and ultimately when to expect the changes to affect their bills. 19
The audience for these messages includes all residential customers, which covers a broad 20
spectrum of demographics and segments of customers. This includes multicultural, non-English 21
speaking, low income, high energy users, as well as hard to reach customers. 22
The strategy is to build on previous communications efforts SDG&E undertook in the 23
2015 and BY 2016 timeframe and to leverage the Rate Reform Marketing, Education and 24
Outreach (ME&O) plan that was filed November 1, 2016 in Advice Letter (AL) 2992-E. This 25
plan is designed to achieve goals to increase customers’ awareness, understanding, and 26
engagement with rate options, and energy management tools and behaviors that help manage 27
energy use, and increase adoption and retention of customers on TOU. Rate Reform ME&O 28
LCD-36
expenses in excess of the amount of TY 2019 GRC funding requested here will be recorded to 1
the RRMA.15 2
Marketing Automation 3
I am requesting $70,000 in non-labor above the BY 2016 for marketing automation 4
software and licensing costs. The marketing automation software/licensing costs pertain to the 5
use of online customer behavior tracking tools for gathering information related to digital 6
activity specific to the website, digital ads, and emails. This tracking allows for customizing a 7
user’s digital experience to offer up the most relevant content based on behavior, therefore 8
increasing efficiency and effectiveness of communications via the digital platform. 9
Outage Communication 10
I am requesting $72,000 in non-labor above the BY 2016 for an online map enterprise 11
license used extensively for outage reporting and monitoring. The online map uses Google 12
Maps, which requires an enterprise license to host SDG&E’s Outage Map due to the volume of 13
daily traffic to the site exceeding the threshold for free page views per day. The growth in 14
overall traffic to the Outage Map is shown in the trend graph below. The Outage Map enables 15
customers to get information about planned and unplanned power outages. 16
17
15 This memorandum account was established pursuant to Ordering Paragraph 12 of D.15-07-001.

LCD-37
FIGURE LD-10 1 SDG&E Outage Maps Page Views 2
3
4 Customer Insight - Surveys 5
I am requesting $185,000 in non-labor above the BY 2016 for customer research 6
activities. To meet changing customer needs and expectations, it has become even more 7
important to identify specific needs and challenges for various subgroups of customers who may 8
be underserved, hard-to-reach, residing in disadvantaged communities, or vulnerable in some 9
way. This research would allow us to better understand their needs and apply those learnings to 10
better serve them by providing more tailored communications and solutions that resonate with 11
their unique differences and circumstances. To that end, SDG&E is requesting funding to 12
conduct a Multicultural and Language Survey for $115,000 and a Disability Needs Assessment 13
for $70,000. See below for details and timing for those studies: 14
Multicultural and Language Survey 15
SDG&E is planning to gather insights from segments of customers who have not 16
traditionally been spotlighted in SDG&E consumer research, to support increased understanding 17

LCD-38
of customers, their perceptions, behaviors, and channel preferences in order to effectively 1
provide relevant information and solutions to them. The data collected will help inform a new 2
multicultural campaign scheduled to launch in 2019, with the study conducted prior to the 3
campaign launch. Several target audiences are of interest, such as Chinese, Filipino, Vietnamese 4
and African Americans, as well as residents of disadvantaged communities. 5
Disability Needs Assessment Survey 6
SDG&E seeks to enhance our understanding of the communication and engagement 7
needs and preferences of hearing and vision challenged customers. This is an area that has 8
traditionally not been a focus of past customer research. With our diverse population, and ever 9
changing needs of customers with vision and hearing challenges, it is critical that SDG&E has a 10
mechanism in place to assess, understand, and address their needs, preferences and any potential 11
communication gaps with this audience. 12
Multicultural Campaign 13
I am requesting $450,000 in non-labor above the BY 2016 for a multicultural campaign. 14
This campaign leverages the Multicultural and Language Survey as described in the previous 15
section. Various communication channels such as newspaper ads, emails and digital ads will be 16
used to promote available customer services such as bill payment assistance, appliance safety 17
checks, and Level Pay, among others, to create awareness of these services for hard-to-reach 18
customers. Costs are based on historical figures for prior use of these channels and an 19
anticipated campaign to last between nine to ten months per year, plus creation of materials. 20
This effort would target the leading Asian languages in the area (Vietnamese, Chinese, Tagalog) 21
plus residents of disadvantaged and low-income communities. 22
Contact Information Campaign 23
I am requesting $250,000 in non-labor above the BY 2016 for a contact information 24
campaign. This effort would use various offers to encourage customers to provide updated 25
contact information to allow for more effective, fast and efficient communications, via email, 26
mobile phone, and text, on critical topics such as outage information, safety messaging (e.g., 27
appliance checks), and offering relevant and timely solutions. Updated contact information will 28
ensure that important communications reach the right customers at the right time. 29

LCD-39
RAMP – Summer and Winter Prep Communication 1
I am requesting $100,000 in non-labor above the BY 2016 for an expansion of existing 2
summer and winter season messaging described in Chapter 316 of the RAMP Report (Employee, 3
Contractor and Public Safety), pertaining to the importance of safe energy use and changes that 4
occur during the seasons. Mediums include bill inserts, print ads, radio spots, the web, and 5
social media. Messaging examples include CO safety, fumigation information, and safe furnace 6
use. These additional funds will provide for a greater level of radio media exposure and 7
additional emails being sent to selected target audiences. 8
Business Optimization - FOF 9
The MRA TY 2019 forecast reflects a ($472,000) reduction in costs related to mass 10
media purchases as well as procurement strategy optimization. Based on the business 11
optimization efforts, the purchasing of mass media with a negotiated rate would be done at the 12
beginning of the year for planned advertisement placements. Rates would be negotiated for the 13
entire year for this spending rather than on a project by project basis and will have a benefit of 14
($25,000). Furthermore, as discussed in the testimony of Witness Denita Willoughby (Exhibit 15
SDG&E-20), Supply Management focuses on optimizing procurement strategies for business 16
units across the companies. Supply Management benefits for the Customer Service Information 17
and Technology areas are ($447,000). 18
Memorandum Account - RRMA 19
I am providing the business justification for the costs incurred for rate reform activities 20
from January 1, 2016 through June 30, 2017, that have been posted to the RRMA.17 This 21
memorandum account was established pursuant to Ordering Paragraph 12 of D.15-07-001. The 22
RRMA is used to track verifiable incremental costs in the following categories: (i) TOU pilots, 23
(ii) TOU studies, including hiring of a consultant or consultants to assist in developing study 24
parameters, (iii) ME&O costs associated with the rate changes approved in that Decision, and 25
16 I.16-10-015/I.16-10-016 Risk Assessment and Mitigation Phase Report of San Diego Gas & Electric Company and Southern California Gas Company (Nov. 30, 2016).
17 SDG&E filed a Tier 1 Advice Letter 2769-E on July 31, 2015, to establish the Rate Reform Memorandum Account (RRMA), which was approved September 22, 2015 by letter from the Director of Energy Division and effective July 31, 2015.

LCD-40
(iv) other reasonable expenditures as required to implement that Decision. The Table LD-17 1
below shows the activity in this memorandum account. 2
TABLE LD-17 3 Rate Reform Memo Account 4
Year Expenses InterestAccount Balance
2016 3,739,910 8,838 $3,748,748 Jan-Jun 2017 2,089,506 19,985 $5,858,239
5 Additionally, in a Ruling18
issued on March 14, 2016, the Administrative Law Judge 6
(ALJ) directed the Investor Owned Utilities (IOUs) to provide additional information on costs 7
incurred to implement Residential Rate Reform (RRR) changes. 8
Specifically, the Ruling states “The utilities must provide the information necessary for 9
the Commission and parties to understand the marketing and other expenditures made to date to 10
implement the rate changes. As stated above, the [Progress of Residential Rate Reform] (PRRR) 11
report must reference any marketing or other expenditures that the utility has indicated to the 12
Commission will not be included in the RRMA. In order to make review of cost recovery 13
applications more transparent, this list of excluded amounts should also be footnoted in any 14
future cost recovery application. Furthermore, any such expenditures excluded from the RRMA 15
must be itemized and labeled consistently in the PRRR report and may not be included, 16
embedded, or recovered in any other memorandum or balancing account in any future cost 17
recovery proceeding.”19 SDG&E’s PRRR reports can be found on the CPUC’s website at 18
http://www.cpuc.ca.gov/General.aspx?id=12154.20 19
TOU pilot expenses are for activities pertaining to the Opt-in and Default pilots, and 20
include pilot planning and design (including expenses for consultants to develop studies), 21
ME&O, pilot measurement and evaluation, customer insights and support, and technology 22
treatments and customer recruitment for the Opt-in TOU Pilot. These estimated budgets were 23
vetted and approved via AL–2835-E-A and Resolution E-4769 (Opt-in TOU Pilot) and SDG&E 24
18 E-Mail Ruling Setting Forth Requirements for Future Advice Letter Filings and Notifying Parties of Next Progress on Residential Rate Reform Workshop and Other Procedural Matters.
19 Id. at 6.
20 Rate Reform costs excluded from the RRMA from August 1, 2015 through June 30, 2017 total $5.081 million, per page 18 of SDG&E’s Eighth Quarterly PRRR Report submitted August 1, 2017.

LCD-41
AL 3020-E, 3020-E-A and 3020-E-B and Resolution E-4848 (Default TOU Pilot). The TOU 1
pilots had extensive support and input from the TOU working group, and were conceived after 2
SDG&E’s TY 2016 GRC was filed, and as such these expenses are incremental and reasonable. 3
SDG&E enrolled approximately 16,000 customers onto its Opt-in TOU pilots, which 4
began in June 2016. Customers were enrolled onto one of three TOU rates (treatment customers) 5
or remained on the tiered rate (control customers). These pilots compared the load and bills 6
between treatment and control customers, as well as their responses to an extensive survey. 7
Figure LD-11 below shows the pilot participation across all three Opt-in TOU Pilot rates. 8
FIGURE LD-11 9
10
SDG&E plans to transition 100,000 to 125,000 customers to default TOU pricing in 11
March 2018 based on their billing cycle. To account for customers who opt out, close their 12
account, or transfer service, SDG&E will send out default notifications to approximately 125,000 13
to 150,000 randomly selected, eligible residential customers. An initial awareness 14
communication will be distributed in October 2017, six months in advance of the customer 15
defaulting. The primary default notification including rate comparisons and other information 16
will occur in January 2018, 60 days prior to transitioning customers in March 2018. A reminder 17
communication will be sent 15 to 30 days prior to the customer transitioning. Default pilot 18

LCD-42
customers will receive ongoing communications, including summer and winter pricing 1
information and end of bill protection notification. SDG&E will test two default tariffs, which 2
are structurally the same as the E1 and E2 TOU rates tested in SDG&E’s Opt-in TOU Pilot. 3
SDG&E’s default pilot plan will help to ensure SDG&E’s business processes and operational 4
systems are functional and its ME&O efforts are fine-tuned in preparation for the full roll-out of 5
TOU default pricing to eligible residential customers in 2019. 6
As previously stated, SDG&E filed its Rate Reform ME&O plan in November 2016 in 7
AL 2992-E. The plan is designed to achieve goals to increase customers’ awareness, 8
understanding, and engagement with rate options and energy management tools and behaviors 9
that help manage energy use, and increase adoption and retention of customers on TOU. In that 10
plan, SDG&E states that ME&O activities contained in the plan and related incremental costs 11
that exceed the [TY 2016] GRC Phase 1 authorized marketing budget will be tracked and 12
recorded in the RRMA. 13
ME&O expenses recorded in the RRMA to date are for activities such as outreach efforts 14
to vulnerable customer segments and the SDG&E partner network, which was specifically 15
directed in the Rate Reform Decision, Greenberg Inc. consultant fees, which was directed by an 16
Assigned Commissioner and ALJ Ruling issued in December 2015,21 and marketing automation 17
for a website pixel tracking tool. Figure LD-12 below shows examples of SDG&E’s Partner 18
Network delivering Rate Reform messaging via social media. 19
21 December 17, 2015 Assigned Commissioner and ALJ’s Ruling Requiring Utilities to Prepare Comprehensive Marketing, Education and Outreach, Metrics, Goals and Strategies for RRR.

LCD-43
FIGURE LD-12 1 SDG&E’s Rate Reform Messaging via Partner Network 2
3
Based on the foregoing, the costs recorded by SDG&E are in compliance with D.15-07-4
001, are reasonable, and should be approved by the Commission. Additional information 5

LCD-44
regarding regulatory accounts is provided in the direct testimony of SDG&E Regulatory Account 1
witness Norma Jasso (Exhibit SDG&E-41). 2
D. Customer Programs, Pricing, and Other Office (CP&P) 3
Table LD-18 below summarizes SDG&E’s requested TY 2019 expenses for CP&P. 4
TABLE LD-18 5 Forecast for Customer Programs, Pricing, and Other Office 6
CS - INFORMATION & TECHNOLOGIES (In 2016 $)
A. Customer Service Information 2016 Adjusted-Recorded
(000s)
TY 2019 Estimated
(000s)
Change (000s)
4. Customer Programs, Pricing, and Other Office
5,226 6,405 1,179
Total 5,226 6,405 1,179 7
Description of Costs and Underlying Activities 8
CP&P consists of the Vice President of Customer Services and three key groups: 9
Customer Assistance Programs (CAP), Customer Solutions and Customer Pricing. These groups 10
are collectively responsible for analytical, technical and policy support for development of value-11
added customer solutions as well as rate design, strategy, electric load analysis, and demand 12
forecasting. 13
The primary activities and functions covered under CP&P are provided below. 14
Customer Assistance 15
SDG&E’s Customer Assistance group delivers programs and services to income qualified 16
and special needs customers. The State mandated California Alternate Rate for Energy (CARE) 17
and Energy Savings Assistance (ESA) programs are managed by Customer Assistance, but these 18
program costs are funded through the Public Purpose Surcharge and not through base rates. 19
Specific non-refundable Customer Assistance activities are described below. 20
NGAT or CO testing, is a safety-related program for Customer Assistance’s ESA 21
Program participants. As described in Chapter 322 of the RAMP filing (Employee, Contractor 22
and Public Safety), SDG&E conducts CO testing on homes weatherized through the ESA 23
Program in accordance with the Statewide Energy Savings Assistance Program Installation 24
22 I.16-10-015/I.16-10-016 Risk Assessment and Mitigation Phase Report of San Diego Gas & Electric Company and Southern California Gas Company (Nov. 30, 2016).
LCD-45
Standards and the Statewide Energy Savings Assistance Program Policy and Procedures Manual. 1
CPUC directives order SDG&E to charge the costs for the NGAT program to base rates rather 2
than to the Public Purpose program funds.23 3
Medical Baseline Program provides additional baseline allowance to customers that have 4
certain medical conditions that require life support equipment or have increased heating or air 5
conditioning needs due to their medical condition. Costs for managing this program include 6
program administration, collateral materials, applicant enrollment, and education and outreach 7
efforts. 8
Neighbor to Neighbor Program provides bill payment assistance of up to $200 per year to 9
customers experiencing financial hardship. This program is not income based, and is open to 10
customers who are experiencing a temporary financial hardship and do not qualify for state or 11
federal assistance. O&M expenses are related to program management, including outreach and 12
the cost of collateral materials. 13
Low Income Home Energy Assistance Program (LIHEAP) is a federally funded 14
assistance program administered by the state that provides bill payment assistance and home 15
weatherization services to income qualified customers. SDG&E works with contracted LIHEAP 16
agencies to ensure that payments are received and applied correctly to customers’ bills. 17
Although the LIHEAP program is funded externally, SDG&E’s costs support customer outreach 18
and administration of this program. 19
Customer Solutions 20
The Customer Solutions group is responsible for investigation, selection and 21
development of value-added customer solutions within the Customer Programs department. This 22
includes identifying customer needs, creating plans to bring customer solutions to market, and 23
working with internal and external organizations to define and implement identified solutions. 24
The Customer Solutions group develops and manages services that help customers save time and 25
money through both energy and non-energy-related services that complement SDG&E’s core 26
business. 27
28
23 D.08-11-031 Ordering Paragraph 65; D.05-04-052 Finding of Fact 10; D.00-07-020 Finding of Fact 44.

LCD-46
Customer Pricing 1
Customer Pricing transferred to the Customer Services division from Regulatory Affairs 2
in 2014, and includes the following groups and functions. 3
Electric Rates, which develops the electric rates to ensure accurate recovery of authorized 4
revenue requirements. 5
Rate Design and Strategy, which develops cost-of-service studies, revenue allocation and 6
electric rate design, analyzes ratemaking policies and options, and supports these issues in 7
various regulatory filings. 8
Electric Load Analysis, which analyzes and studies customer data and load information. 9
Electric Demand Forecasting, which provides near-term and long-term forecasts of 10
energy usage at the system and class level. 11
Vice President of Customer Services 12
The Vice President of Customer Services is responsible for oversight of the entire 13
Customer Services organization that is being represented in the TY 2019 GRC by three different 14
witnesses: Customer Services Field is being represented by Gwen Marelli (Exhibit SDG&E-17), 15
Customer Services Office Operations is being represented by Jerry Stewart (Exhibit SDG&E-16
18), as well as the areas represented in this exhibit. 17
Forecasting Methodology 18
I chose a base year forecast method for TY 2019 for CP&P because the last recorded year 19
accurately reflects the expense level associated with current and forecasted departmental activity. 20
The Customer pricing group continues to expand to meet the demands created by numerous rate 21
related activities resulting from increasing legislative and regulatory requirements, rate analysis, 22
and development of rate options. Therefore, the base year provides a reasonable starting point 23
for future expenditures. 24
Cost Drivers 25
Table LD-19 summarizes the changes in the Customer Programs, Pricing, and other 26
Offices estimated expenses for TY 2019. 27

LCD-47
TABLE LD-19 1 Changes in Customer Programs, Pricing, and Other Office TY 2019 Estimated Expenses 2
Customer Programs, Pricing, and Other Office TY 2019 - 2016 Change (000s)
Labor Non-
Labor Total FTEs
Customer Pricing – full year labor & non-labor impact 156 469 625 2.0
Customer Pricing Regulatory Compliance 332 9 341 3.0Medical Baseline (MBL) System Upgrades 97 97 Neighbor to Neighbor (NTN) System
Enhancements 20 20 RAMP – Natural Gas Appliance Testing (NGAT) 141 141 Business Optimization (FOF) -45 -45 -0.5Total TY 2019 Impact 443 736 1,179 4.5
3 Customer Pricing – Full Year Labor and Non-Labor Impact 4
I am requesting $156,000 in labor above the BY 2016 to create a full year impact for 5
Customer Pricing Rate Support staff who were hired during 2016. Additionally, I am requesting 6
$469,000 in non-labor incremental to the 2016 base year for the Dynamic Pricing load impact 7
studies. D.08-04-050 requires that SDG&E perform annual studies of all DR activities using the 8
adopted load impact protocols. That Decision also requires SDG&E to file reports consistent 9
with the protocols annually on April 1 of each year. The Decision defined the phrase “DR 10
Activities” to include event based pricing rates, TOU rates and real-time pricing rates. In 11
addition, section 7.3, page 19 of D.12-12-004, which adopts critical peak pricing and TOU rates 12
for residential and small non-commercial customers, requires SDG&E to separately report the 13
load reduction achieved through these rates annually for TOU, commercial critical peak pricing 14
and residential critical peak pricing rates. Ordering Paragraph 15 on page 73 of D.12-12-004 15
states that SDG&E can request cost recovery in a future GRC for ongoing costs related to 16
dynamic pricing. 17
The TOU load impact studies follow the demand response summer event season that 18
concluded on October 31, 2016. The consultants typically issue their data requests to begin the 19
load impact evaluations shortly thereafter. Hence, the invoice costs for the months of October 20
and November are lower than the subsequent months as the evaluation activities ramp up, and 21
the December invoices are typically received in the middle of January. Therefore, most of the 22
costs associated with load impact studies for the DR program year 2016 are captured in the first 23

LCD-48
four months of 2017. Based on the Decision summarized above, these load studies reports are 1
due on April 1 annually, with workshops and other databases provided after that date. The full 2
amount will be spent annually going forward, so an adjustment is needed to create a normalized 3
year of costs for load impact studies. 4
Customer Pricing Regulatory Compliance 5
I am requesting $332,000 in labor and $9,000 in associated non-labor above the BY 2016 6
for Customer Pricing. This increase is the result of increasing legislative and regulatory 7
requirements regarding the analysis and development of rate options, which include growing 8
requirements for data provided, such as population of bill impacts and segmentation. In addition, 9
changes in customer energy usage and the utility grid result in the need for more analysis to 10
better understand customer needs and the impacts to utility cost of service as well as continued 11
granularity in forecasting methodologies. 12
Medical Baseline (MBL) Recertification Process and Related 13 System Enhancements 14
I am requesting $97,000 in non-labor above the BY 2016 to support the MBL program’s 15
growth in customer enrollments, letter recertification process, and related system enhancements. 16
The recertification letter process for MBL is moving to a new fulfillment house. The new 17
fulfillment house employs more stringent protection for customer privacy through greater quality 18
control protocols, which results in associated higher cost for services (printing, stamping, 19
postage) and mailing of letters. 20
Furthermore, the MBL system will require system enhancements and program website 21
updates. The current MBL recertification website hosted by a third-party vendor is utilizing 22
obsolete technology and needs enhancements to keep pace with technology standards and 23
customer expectations. For example, the current MBL recertification website does not have 24
mobile versioning capabilities, which is important because many customers depend solely on 25
their mobile phones for access to the internet. Furthermore, the MBL website needs to be 26
enhanced to allow for the uploading of applications and documents directly into the system for 27
customer convenience and faster processing. 28
RAMP – CO Testing/NGAT 29
I am requesting $141,000 in non-labor above the BY 2016 to support an expected 30
increase in NGAT, CO testing. NGAT, or CO testing, is a safety-related program for Customer 31
Assistance’s ESA Program participants as outlined in the RAMP Filing for Employee, 32
LCD-49
Contractor and Public Safety (Chapter SDG&E-3).24 The purpose of this program is to test in-1
home appliances for CO hazards for homes that are weatherized through the ESA Program. 2
SDG&E expects the percentage of NGAT treated homes to increase due to program rule changes 3
adopted in D.16-11-022 to reduce barriers to participation, including offering measures that 4
attract landlord agreement to participate and elimination of the ten-year go-back rule. CPUC 5
directives require SDG&E to charge the costs for the NGAT program to base rates rather than to 6
the public purpose funds.25 7
System Enhancements for Neighbor to Neighbor Data Base 8 Move to Energy Efficiency Collaboration Platform (EECP) 9
I am requesting $20,00026 in non-labor above the BY 2016 to support a system 10
enhancement related to the Neighbor to Neighbor Program (NTN). NTN information is 11
manually tracked in spreadsheets making analysis and reporting of this data inefficient and 12
cumbersome. To automate the NTN program process and eliminate the use of spreadsheets, a 13
system enhancement to SDG&E’s existing EECP is required. Once this program is automated, 14
analyzing and responding to information requests will become more efficient and data integrity 15
will improve. 16
Business Optimization - FOF 17
The CP&P TY 2019 forecast reflects a ($45,000) reduction in labor for business 18
optimization efforts around reporting. In 2016, internal reporting within CP&P was reviewed 19
and various automation processes were identified that will reduce overall reporting workload 20
when implemented. 21
IV. SHARED COSTS 22
This section presents SDG&E’s estimated TY 2019 expenses for shared services that are 23
required for both SoCalGas and SDG&E. I am sponsoring the forecasts on a total incurred basis, 24
as well as the shared services allocation percentages related to those labor and non-labor costs. 25
Those percentages are presented in the shared services section of my workpapers (Ex. SDG&E-26
19-WP), along with a description explaining the activities being allocated. The dollar amounts 27
24 November 30, 2016 RAMP Report, Chapter 3.
25 D.08-11-031 Ordering Paragraph 65; D.05-04-052 Finding of Fact 10; D.00-07-020 Finding of Fact 44.
26 If the four year GRC cycle is adopted, as proposed in the testimony of Mr. Deremer (Exhibit SDG&E-43), then this calculation will need to be revised to reflect that.

LCD-50
allocated to affiliates are presented in our Shared Services Policy and Procedures testimony 1
sponsored by James Vanderhye (Exhibit SDG&E-32). 2
A. Customer Service Technologies 3
Table LD-20 below summarizes SDG&E’s requested TY 2019 expenses for Customer 4
Service Technologies. 5
TABLE LD-20 6 Shared O&M Summary of Costs 7
CS - INFORMATION & TECHNOLOGIES (In 2016 $)
(In 2016 $) Incurred Costs (100% Level)
A. Customer Service Technologies 2016 Adjusted-Recorded
(000s)
TY 2019 Estimated
(000s)
Change (000s)
1. Business Strategy and Development 239 239 02. Low Emissions Vehicle Program 104 104 0Incurred Costs Total 343 343 0
8 B. Business Strategy & Development 9
Table LD-21 below summarizes SDG&E’s requested TY 2019 expenses for the Business 10
Strategy and Development shared service group. 11
TABLE LD-21 12 Forecast for Business Strategy and Development 13
CS - INFORMATION & TECHNOLOGIES (In 2016 $)
(In 2016 $) Incurred Costs (100% Level)
A. Customer Service Technologies 2016 Adjusted-Recorded
(000s)
TY 2019 Estimated
(000s)
Change (000s)
1. Business Strategy and Development 239 239 0Incurred Costs Total 239 239 0
14 Description of Costs and Underlying Activities 15
The Business Strategy and Development shared service cost center is comprised of 16
various external information services used across the company. These subscription services are 17
utilized to conduct research on market and industry trends, and business model and technology 18
innovations in the power and utility sectors, peer benchmarking, analysts’ reports, forecasts of 19

LCD-51
energy supply, demand, and pricing, among other items. Data gathered from the external 1
information services are utilized to support the company’s business strategies and initiatives. 2
Forecast Method 3
I chose a base year forecast method because 2016 represents the current activity level that 4
is not expected to change. Therefore, the base year provides a reasonable starting point for 5
future expenditures. 6
Cost Drivers 7
I am not requesting any additional dollars above the BY 2016 for Business Strategy and 8
Development. 9
C. Low Emission Vehicle Program 10
Table LD-22 below summarizes SDG&E’s requested TY 2019 expenses for the Low 11
Emissions Vehicle Program. 12
TABLE LD-22 13 Forecast for Low Emission Vehicle Program 14
CS - INFORMATION & TECHNOLOGIES (In 2016 $)
(In 2016 $) Incurred Costs (100% Level)
A. Customer Service Technologies 2016 Adjusted-Recorded
(000s)
TY 2019 Estimated
(000s)
Change (000s)
2. Low Emissions Vehicle Program 104 104 0Incurred Costs Total 104 104 0
15 Description of Costs and Underlying Activities 16
The Low Emissions Vehicle Program shared service cost center supports the SDG&E and 17
SoCalGas Low Emissions Vehicle Programs; providing Natural Gas Vehicle (NGV) utility 18
account management, customer information, education, and training services to the general 19
public, operators of NGVs, operators of NGV refueling stations, government agencies, and 20
others throughout the service territories of both SoCalGas and SDG&E. 21
Forecast Method 22
I chose a base year forecast method because 2016 represents the current activity level and 23
is not expected to change. Furthermore, this workgroup has one FTE whose work is not cyclical 24
in nature and should remain constant for 2017 through TY 2019. Therefore, the base year 25
provides a reasonable starting point for future expenditures. 26

LCD-52
Cost Drivers 1
I am not requesting any additional dollars above the BY 2016 for the Low Emissions 2
Vehicle Program. 3
V. CAPITAL 4
I am sponsoring the business rationale for each of the following IT capital projects. The 5
estimated capital expense requests are included in the testimony of Mr. Olmsted (Exhibit 6
SDG&E-24). Table LD-23 summarizes the total capital forecasts for 2017, 2018, and TY 2019. 7
TABLE LD-23 8 Capital Expenditures Summary of Costs 9
INFO TECH/TELECOM CAPITAL Shown in Thousands of 2016 Dollars CS – Information & Technologies Estimated
2017 Estimated
2018 Estimated TY 2019
A. Business Optimization 517 612 643B. Improving Customer Experience 1,826 1,387 310C. Mandated 18,240 19,110 865
Total 20,583 21,109 1,818 10
The detailed capital projects by category are summarized in Table LD-24 below. 11
12

LCD-53
TABLE LD-24 1 Capital Expenditures Summarized by Category 2
GRID WP #
Capital Project
#
Capital Project Name 2017 Total ($000)
2018 Total ($000)
TY 2019 Total ($000)
831H T15831 Demand Response Management System Phase 1 (DRMS 1) 517 0 0
831A T19003 Demand Response Management System Phase 3 (DRMS 3) 0 612 643
Sub-Total Business Optimization 517 612 643
811I T16027 My Account Reliability and System Investigation Request (SIR) Bundled Work 626 171 0
811L T16036 Customer Authorization Project 1,200 0 0831B T19004 Gas Customer Choice Automation (GCCA) 0 1,216 310
Sub-Total Improving Customer Experience 1,826 1387 310811B T19006 Residential TOU Default Pilot Program 8,482 15,548 865811J T15076 Residential Rate Reform (RROIR/RDW) 832 0 0
811M T16037 Residential Rate Reform TOU 661 0 0811D T19007 GRC Phase II 5,833 3,562 0811N T16038 AB802 Benchmarking Project 919 0 0
811H T16033 Enterprise Hourly Time of Use Metering/Billing 1,513 0 0
Sub-Total Mandated 18,240 19,110 865 20,583 21,109 1,818
3 Business Optimization 4
Table LD-25 below shows a summary of the requested capital expenditures related to 5
business optimization. 6
TABLE LD-25 7 Business Optimization Capital Summary 8
GRID WP #
Capital Project
#
Capital Project Name 2017 Total ($000)
2018 Total ($000)
TY 2019 Total ($000)
831H T15831 Demand Response Management System Phase 1 (DRMS 1) 517 0 0
831A T19003 Demand Response Management System Phase 3 (DRMS 3) 0 612 643
Sub-Total Business Optimization 517 612 643

LCD-54
Demand Response Management System Phase 1 (DRMS) 1 (Project # T15831) and DRMS Phase 3 (Project # T19003) 2
The DRMS Projects will enable the management of SDG&E’s demand response portfolio 3
with the following integrated capabilities: program management, enrollment, eligibility, device 4
management, event management, forecasting, settlement, analytics/reporting and workflow. 5
This first phase implemented functionality necessary to support SDG&E’s Capacity Bidding 6
Program and also provided customers with the ability to connect home area network devices to 7
their meters and receive price information on their devices. Phase 3 will provide additional 8
functionality to deliver additional DR programs in a single integrated architecture. The forecast 9
for the DRMS projects for 2017, 2018, and 2019 are $517,000, $612,000, and $643,000. 10
Improving Customer Experience 11
Table LD-26 below shows a summary of the requested capital expenditures related to 12
improving customer experience. 13
TABLE LD-26 14 Improving Customer Experience Capital Summary 15
GRID WP #
Capital Project
#
Capital Project Name 2017 Total ($000)
2018 Total ($000)
TY 2019 Total ($000)
811I T16027 My Account Reliability and SIR Bundled Work 626 171 0
811L T16036 Customer Authorization Project 1,200 0 0831B T19004 Gas Customer Choice Automation (GCCA) 0 1,216 310
Sub-Total Improving Customer Experience 1,826 1387 310 16
My Account Reliability & System Investigation Request (SIR) 17 Bundled Work (Project # T16027) 18
The purpose of the My Account Reliability & SIR Bundled Work project is to minimize 19
My Account site outages and maximize the ability to monitor and communicate system 20
operations. Additionally, there are a number of enhancements that will improve the customer’s 21
online experience such as strengthening the authentication process, enhancing customer self-22
service capabilities, and adhering to online regulatory compliance rules. As shown in Figure 23
LD-5, there are over 900,000 My Account registered users, so these improvements will benefit a 24
significant number of customers. The forecast for the My Account Reliability & SIR project for 25
2017, 2018, and 2019 are $626,000, $171,000, and $0. 26

LCD-55
CAP (Project # T16036) 1
The CAP project seeks to streamline the existing disparate process for handling LOAs 2
and associated requests for customer data. LOAs are paper and electronic documents used by a 3
customer of record to authorize SDG&E to share their data with a third party. These letters are 4
currently received by several departments around the company from third parties requesting 5
customer data. Hence, there is no central location for storing, tracking, and validating LOAs. 6
Furthermore, LOAs are only available in paper form, which makes submission and tracking very 7
difficult for customers. This project would improve efficiency within SDG&E while enhancing 8
the customer experience. The forecast for the CAP project for 2017, 2018, and 2019 are 9
$1,200,000, $0, and $0. 10
Gas Customer Choice Automation (GCCA) (Project # T19004) 11
The GCCA project would automate the Gas Imbalance reporting and curtailment 12
processes to reduce compliance and process risk and deliver efficiencies. The scope includes 13
creating a central repository and reporting for GCCA capabilities, and managing gas core and 14
non-core imbalance reporting, customer communications, and contract maintenance. 15
Additionally, it will improve efficient execution of gas curtailment processes including analysis 16
of available load, event monitoring, and violations reporting. The forecast for the GCCA project 17
for 2017, 2018, and 2019 are $0, $1,216,000, and $310,000. 18
Mandated 19
Table LD-27 below shows a summary of the requested capital expenditures related to 20
mandated projects. 21
22

LCD-56
TABLE LD-27 1 Mandated Capital Project Summary 2
GRID WP #
Capital Project
#
Capital Project Name 2017 Total ($000)
2018 Total ($000)
TY 2019 Total ($000)
811B T19006 Residential TOU Default Pilot Program 8,482 15,548 865811J T15076 Residential Rate Reform (RROIR/RDW) 832 0 0
811M T16037 Residential Rate Reform TOU 661 0 0811D T19007 GRC Phase II 5,833 3,562 0811N T16038 AB802 Benchmarking Project 919 0 0
811H T16033 Enterprise Hourly Time of Use Metering/Billing 1,513 0 0
Sub-Total Mandated 18,240 19,110 865 3
Residential TOU Default Pilot Program (Project # T19006) 4
The residential TOU Default Pilot project is to support CPUC D.15-07-001, which directs 5
SDG&E to conduct certain “pilot” programs and studies of residential TOU electric rate designs. 6
The purpose of this project is to study aspects of TOU, fine-tune customer education, and test 7
system operability prior to the full rollout of default TOU in TY 2019. The solution will support 8
the two default tariffs and the transition of over 100,000 customers to TOU pricing in March 9
2018 based on the customer’s bill cycle. The solution will enable personalized communication 10
efforts to these customers. This includes pre-awareness notices, the default notices, and on-11
going post-default communications. This will also allow for the implementation of tools and 12
applications that will track and monitor transactions, system defects, and impacts on day-to-day 13
business processes. The forecast for the Residential TOU default pilot project for 2017, 2018, 14
and 2019 are $8,482,000, $15,548,000, and $865,000. 15
Residential Rate Reform RROIR/RDW (Project # T15076) and 16 Residential Rate Reform TOU (Project # T16037) 17
SDG&E’s Residential Rates Order Instituting Rulemaking (RROIR)/RDW project is to 18
support continued implementation of rate reform pursuant to D.15-07-001. System changes are 19
needed to support residential rate tier collapse, CARE line item discounts, Family Electric Rate 20
Assistance (FERA) line item discounts, baseline allowance updates, and other changes. 21
Particularly in 2017, the project was highly focused on implementing the new HUC, also known 22
as the Super User Surcharge. The Rate Reform decision mandated that we implement a new 23
charge when customers’ consumption exceeds 400% of their allocated baseline, resulting in a 24
new consumption charge for the customer. Additionally, the Decision also requires SDG&E to 25

LCD-57
proactively alert customers at the time that they have exceeded this threshold to create awareness 1
of the increased consumption levels via different communication channels. The project requires 2
making changes to multiple SDG&E systems. The forecast for the RROIR/RDW projects for 3
2017, 2018, and 2019 are $1,493,000, $0, and $0. 4
GRC Phase 2 (Project # T19007) 5
The GRC Phase 2 rate design project is being implemented in compliance with General 6
Rate Case application A.15-04-012. The project includes making changes to SDG&E’s 7
Customer Information System to enable billing of the proposed electric rates, including changes 8
to SDG&E’s current TOU periods to align with grid needs. Changes also need to be made to 9
SDG&E’s online Energy Management Tool, which provides customers with bill-to-date, bill 10
history, and other electric energy pricing information. The rate changes become effective for 11
customers in 2018. The forecast for the GRC Phase 2 project for 2017, 2018, and 2019 are 12
$5,833,000, $3,562,000, and $0. 13
AB802 Benchmarking Project (Project # T16038) 14
AB802 requires utilities to maintain records of the energy usage data of all buildings to 15
which they provide service for at least the most recent 12 complete months. Furthermore, this 16
legislation requires that by January 1, 2017, each utility, upon the request and the written 17
authorization or secure electronic authorization of the owner, owner’s agent, or operator of a 18
covered building, deliver or provide aggregated energy usage data for a covered building to the 19
owner, owner’s agent, operator, or to the owner’s account in the ENERGY STAR Portfolio 20
Manager. AL 2870-E/2463-G provided for establishment of a memo account to track costs, the 21
business explanation for which can be found in Section III.B in this testimony. The forecast for 22
the AB802 Benchmarking project for 2017, 2018, and 2019 are $919,000, $0, and $0. 23
Enterprise Hourly TOU Metering/Billing (Project # T16033) 24
The Enterprise Hourly TOU Metering/Billing project includes IT system changes to 25
develop functionality that will enable SDG&E to support third party meter read accuracy and 26
hourly TOU pricing and bill calculations. This functionality will be leveraged for the Power 27
Your Drive pilot approved in D.16-01-045. This pilot oversees multiple charging stations 28
constructed for driver convenience at Multi-Unit Dwellings and work places. The forecast for 29
the Enterprise Hourly TOU Metering/Billing project for 2017, 2018, and 2019 are $1,513,000, 30
$0, and $0. 31

LCD-58
VI. ENERGY INNOVATION CENTER 1
I am sponsoring the business rationale for GRC-related future capital improvement costs 2
associated with the Energy Innovation Center (EIC). If approved, SDG&E proposes to fund 3
these improvements from blanket facilities capital budgets included in the testimony of Witness 4
Dale Tattersall (Exhibit SDG&E-22). SDG&E is requesting funding of $1,850,000 for costs 5
associated with the EIC in 2017-2019. The costs are related to building and equipment upkeep, 6
upgrades and improvements, including HVAC, refrigeration equipment, furniture (classroom 7
tables, chairs), audio/visual equipment, and security improvements. 8
SDG&E’s EIC opened its doors in January 2012, offering the San Diego community a 9
place to learn about energy efficiency, sustainability and innovation in building performance. 10
While the primary offering of the center is education and training for San Diego’s workforce, it 11
also provides visitors the opportunity to learn about advances in energy efficiency, clean 12
transportation, and renewable energy production so that they can make informed choices about 13
energy use and technology. The EIC has become a resource for the local community. SDG&E 14
customers use the center as a venue for hundreds of meetings and events per year. Since 2012, 15
over 139,000 people have visited the EIC. The funding requested will allow SDG&E to perform 16
necessary improvements and upkeep for the EIC to remain a community asset. 17
VII. CONCLUSION 18
My SDG&E Customer Services Information & Technologies O&M and Capital project 19
justifications were carefully developed and reviewed, and represent a projection of the level of 20
funding necessary to support SDG&E’s organizational focus for the GRC term. SDG&E is 21
focused on partnering with our customers as a trusted energy advisor by ensuring customers have 22
choice, convenience, and control of how they interact with us and manage their pricing plans and 23
energy use, and on maintaining safe, efficient, effective, and reliable customer service. 24
This concludes my prepared direct testimony. 25
26

LCD-59
VIII. WITNESS QUALIFICATIONS 1
My name is Lisa Davidson. I am employed by SDG&E as the Director of Customer 2
Programs. My business address is 8335 Century Park Court, San Diego, California, 92123. My 3
current responsibilities include overseeing SDG&E’s energy efficiency, customer assistance and 4
demand response programs, customer solutions and outreach teams. I assumed my current 5
position in May 2014. I have been employed by SDG&E and Sempra Energy since 2001, and 6
have held positions of increasing responsibility in the Regulatory Affairs, Finance, External 7
Affairs and Customer Services departments. I received a Bachelor of Arts degree in Economics 8
from Northwestern University. I have previously testified before this Commission. 9
LCD – A-1
GLOSSARY OF TERMS
AB: Assembly Bill AE: Account ExecutiveAFVMA: Alternative Fuel Vehicle Memorandum AccountAIS: Aging and Independence Services DepartmentAL: Advice Letter ALJ: Administrative Law JudgeApp: Mobile ApplicationBuS: Business ServicesBY: Base Year CAISO: California Independent System OperatorCAP: Customer Authorization ProjectCARB: California Air Resources Board CARE: California Alternate Rates for EnergyCAT: Core Aggregation TransportationCCA: Community Choice AggregationCCC: Customer Contact CenterCEC: California Energy CommissionCIM: Customer Information ManagementCISR: Customer Information Service RequestCO: Carbon MonoxideCP&P: Customer Programs, Pricing, and other OfficeCPUC: California Public Utilities CommissionCSIN: Customer Service Information and TechnologyD: Decision DA: Direct Access DR: Demand ResponseDRMS: Demand Response Management SystemEECP: Energy Efficiency Collaboration PlatformEDRMA: Energy Data Request Memorandum AccountEIC: Energy Innovation CenterEPA: Environmental Protection AgencyEPIC: Electric Program Investment ChargeESA: Energy Savings AssistanceESP: Energy Service ProviderEV: Electric VehicleFERA: Family Electric Rate AssistanceFOF: Fueling our FutureFTE: Full-Time EquivalentGAPP: Generally Accepted Privacy PrinciplesGCCA: Gas Customer Choice AutomationGHG: Greenhouse Gas EmissionsGRC: General Rate CaseHUC: High Usage ChargeHVAC Heating, Ventilation and Air Conditioning IOU: Investor Owned Utilities

LCD-A-2
IT: Information TechnologyIVR: Interactive Voice ResponseLOA: Letters of AuthorizationLIHEAP: Low Income Home Energy Assistance ProgramMBL: Medical BaselineME&O: Marketing, Education, and OutreachMRA: Marketing, Research, and AnalyticsNGAT: Natural Gas Appliance TestingNEM: Net Energy MeteringNGV: Natural Gas VehicleNTN: Neighbor to Neighbor ProgramO&M: Operations and MaintenanceOCP: Office of Customer PrivacyPG&E Pacific Gas and ElectricPbD: Privacy by DesignPRRR: Progress of Residential Rate ReformR.: Rulemaking RAMP: Risk Assessment Mitigation PhaseRCS: Residential Customer ServicesRDW: Rate Design WindowRROIR: Residential Rates Order Instituting RulemakingRRMA: Rate Reform Memorandum AccountRRR: Residential Rate ReformSDG&E: San Diego Gas & Electric CompanySIR Software Inspection ReportSMB: Small and Medium BusinessSOCALGAS: Southern California Gas CompanySOX: Sarbanes OxleyTCAP: Triennial Cost Allocation ProceedingTOU: Time of Use TY: Test Year VREP: Voluntary Retirement Enhancement Program