Embed Size (px)
Citation preview
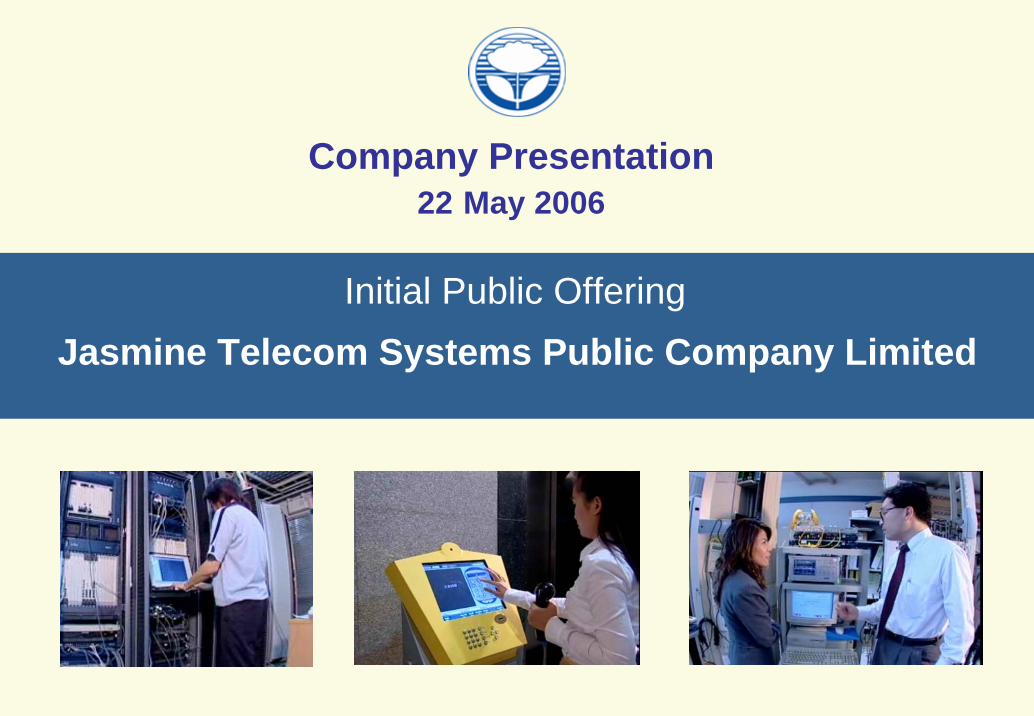
Company Presentation 22 May 2006
Initial Public OfferingJasmine Telecom Systems Public Company Limited
2
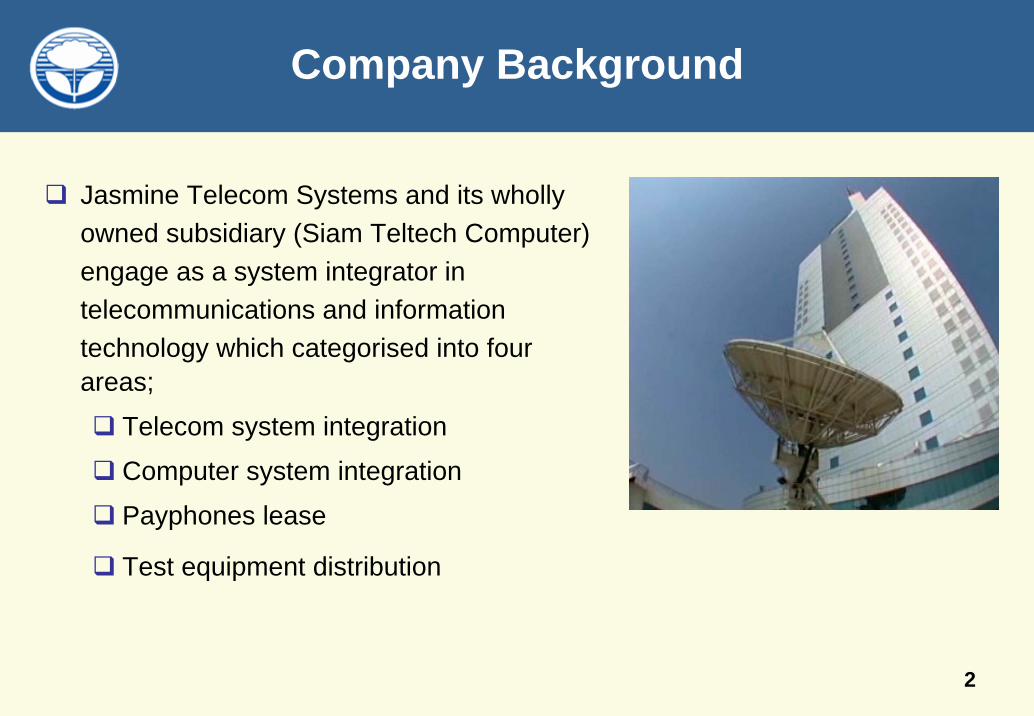
Company Background
Jasmine Telecom Systems and its wholly owned subsidiary (Siam Teltech Computer) engage as a system integrator in telecommunications and information technology which categorised into four areas;
Telecom system integration
Computer system integration
Payphones lease
Test equipment distribution
3
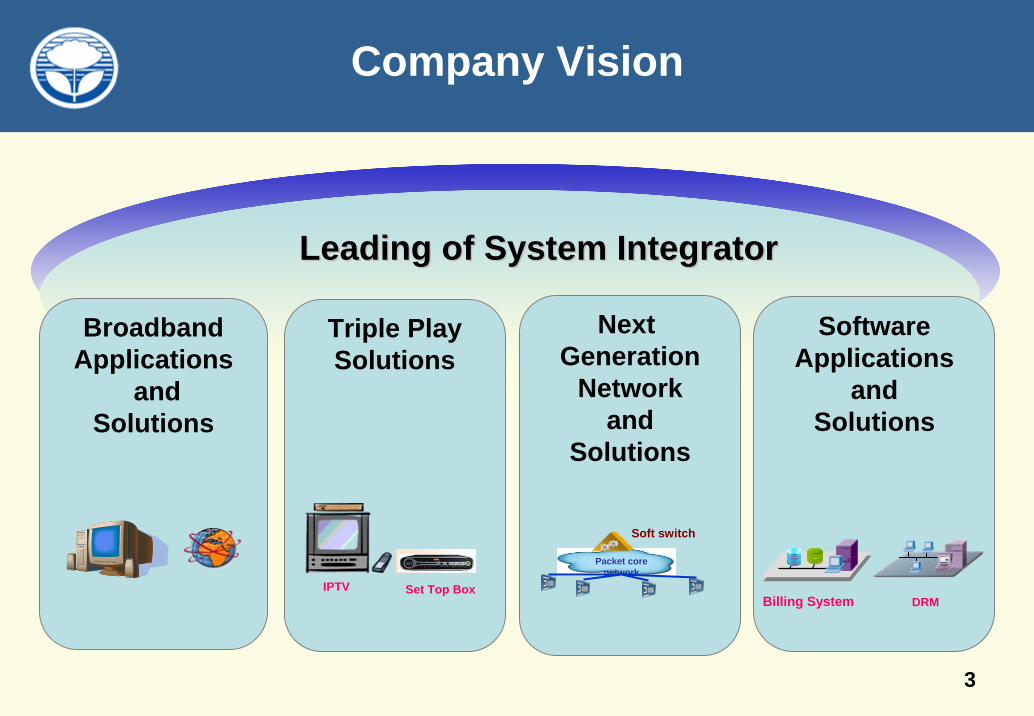
Company Vision
Leading of System IntegratorLeading of System Integrator
Triple PlaySolutions
Next Generation
Networkand
Solutions
BroadbandApplications
andSolutions
SoftwareApplications
andSolutions
Packet core network
Soft switch
IPTV Set Top BoxBilling System DRM
4
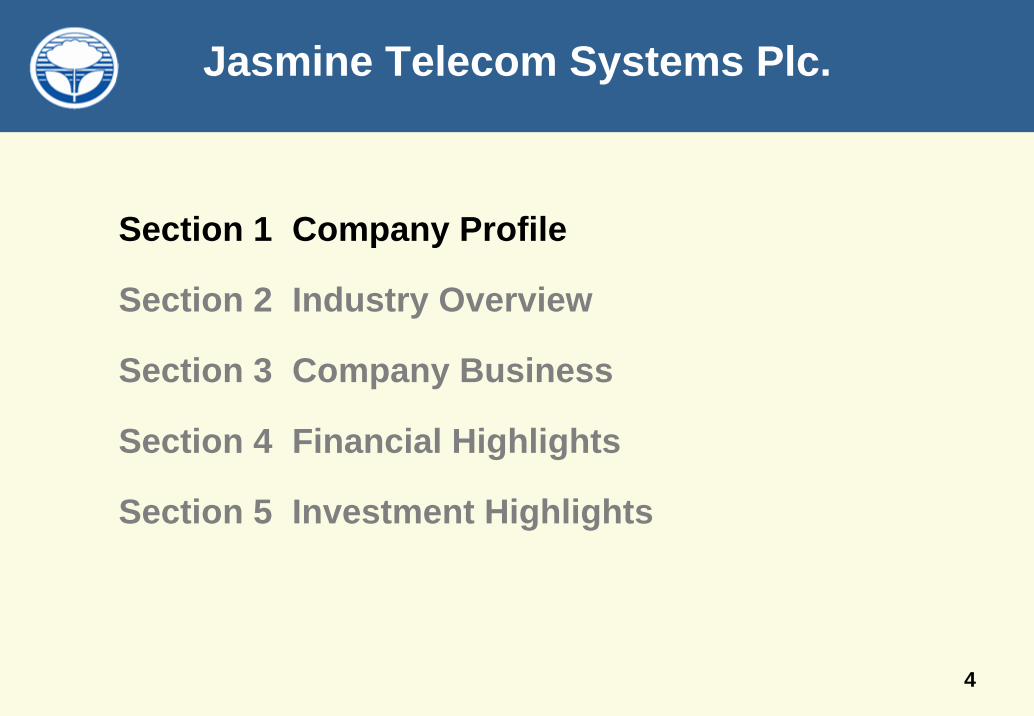
Jasmine Telecom Systems Plc.
Section 1 Company Profile
Section 2 Industry Overview
Section 3 Company Business
Section 4 Financial Highlights
Section 5 Investment Highlights
5
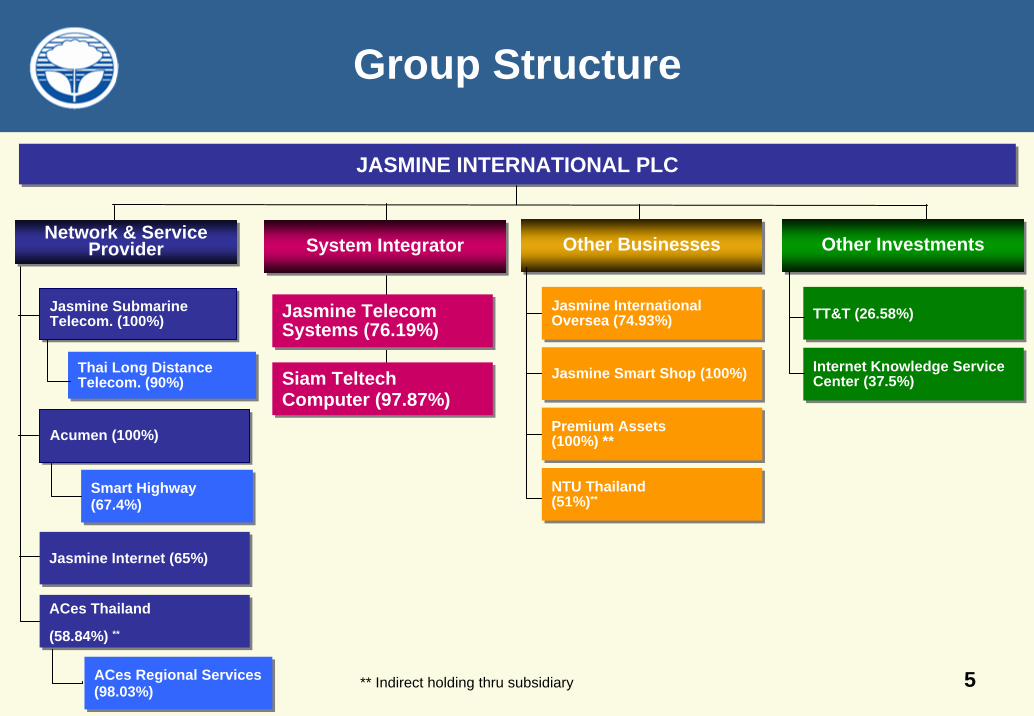
Group Structure
JASMINE INTERNATIONAL PLCJASMINE INTERNATIONAL PLC
Jasmine Submarine Telecom. (100%)Jasmine Submarine Telecom. (100%)
Thai Long Distance Telecom. (90%)Thai Long Distance Telecom. (90%)
Smart Highway (67.4%)Smart Highway (67.4%)
ACes Thailand
(58.84%) **
ACes Thailand
(58.84%) **
Jasmine Internet (65%)Jasmine Internet (65%)
Acumen (100%)Acumen (100%)
Jasmine Telecom Systems (76.19%)Jasmine Telecom Systems (76.19%)
Siam Teltech Computer (97.87%)Siam Teltech Computer (97.87%)
System IntegratorSystem IntegratorNetwork & Service Provider
Network & Service Provider Other BusinessesOther Businesses
Jasmine International Oversea (74.93%)Jasmine International Oversea (74.93%)
Jasmine Smart Shop (100%)Jasmine Smart Shop (100%)
Premium Assets(100%) **Premium Assets(100%) **
Other InvestmentsOther Investments
TT&T (26.58%)TT&T (26.58%)
Internet Knowledge Service Center (37.5%)Internet Knowledge Service Center (37.5%)
NTU Thailand(51%)**NTU Thailand(51%)**
ACes Regional Services (98.03%)ACes Regional Services (98.03%) ** Indirect holding thru subsidiary
6
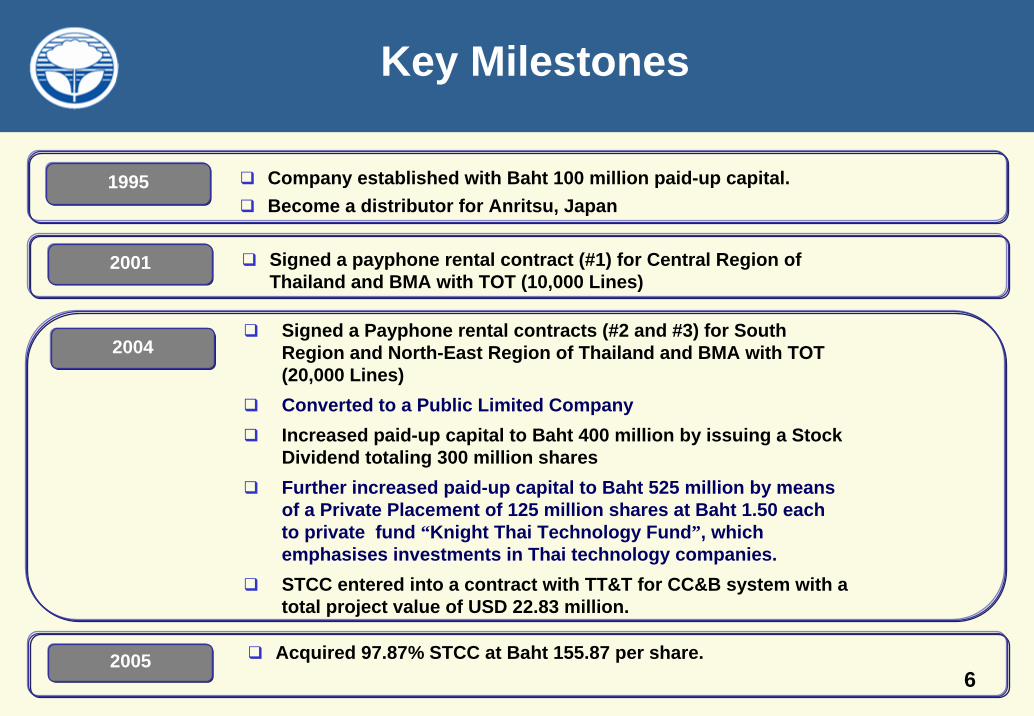
Key Milestones
Company established with Baht 100 million paid-up capital.Become a distributor for Anritsu, Japan
1995
Signed a payphone rental contract (#1) for Central Region of Thailand and BMA with TOT (10,000 Lines)
2001
Acquired 97.87% STCC at Baht 155.87 per share.2005
Signed a Payphone rental contracts (#2 and #3) for South Region and North-East Region of Thailand and BMA with TOT(20,000 Lines)Converted to a Public Limited CompanyIncreased paid-up capital to Baht 400 million by issuing a Stock Dividend totaling 300 million sharesFurther increased paid-up capital to Baht 525 million by meansof a Private Placement of 125 million shares at Baht 1.50 eachto private fund “Knight Thai Technology Fund”, which emphasises investments in Thai technology companies.STCC entered into a contract with TT&T for CC&B system with a total project value of USD 22.83 million.
2004
7
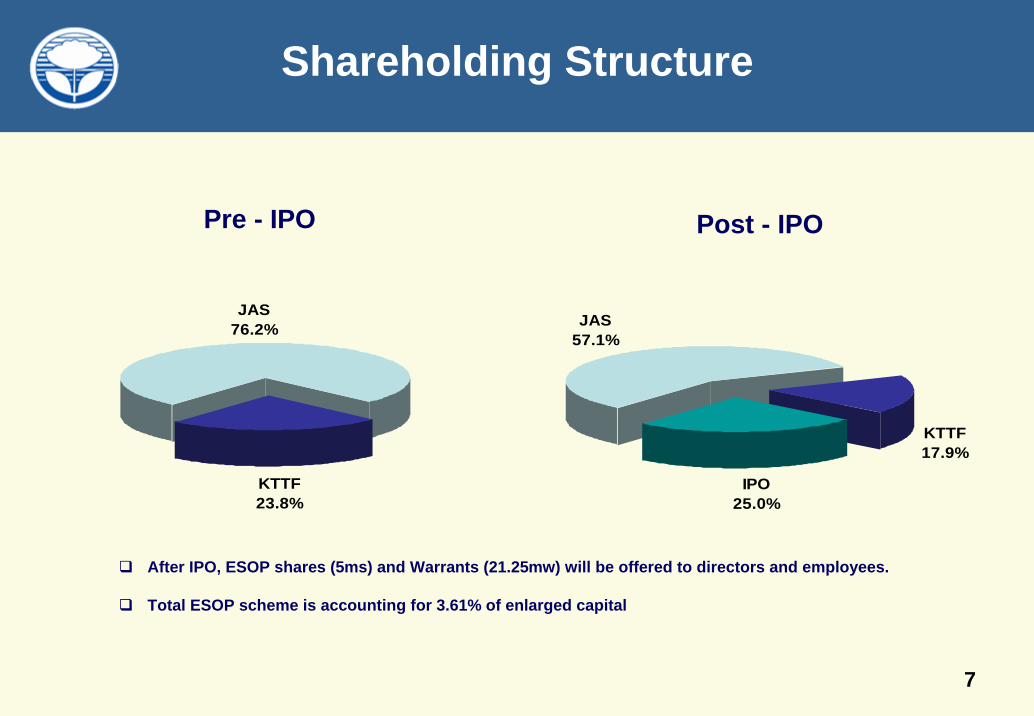
Shareholding Structure
JAS76.2%
KTTF23.8%
JAS57.1%
IPO25.0%
KTTF17.9%
After IPO, ESOP shares (5ms) and Warrants (21.25mw) will be offered to directors and employees.
Total ESOP scheme is accounting for 3.61% of enlarged capital
Pre - IPO Post - IPO
8
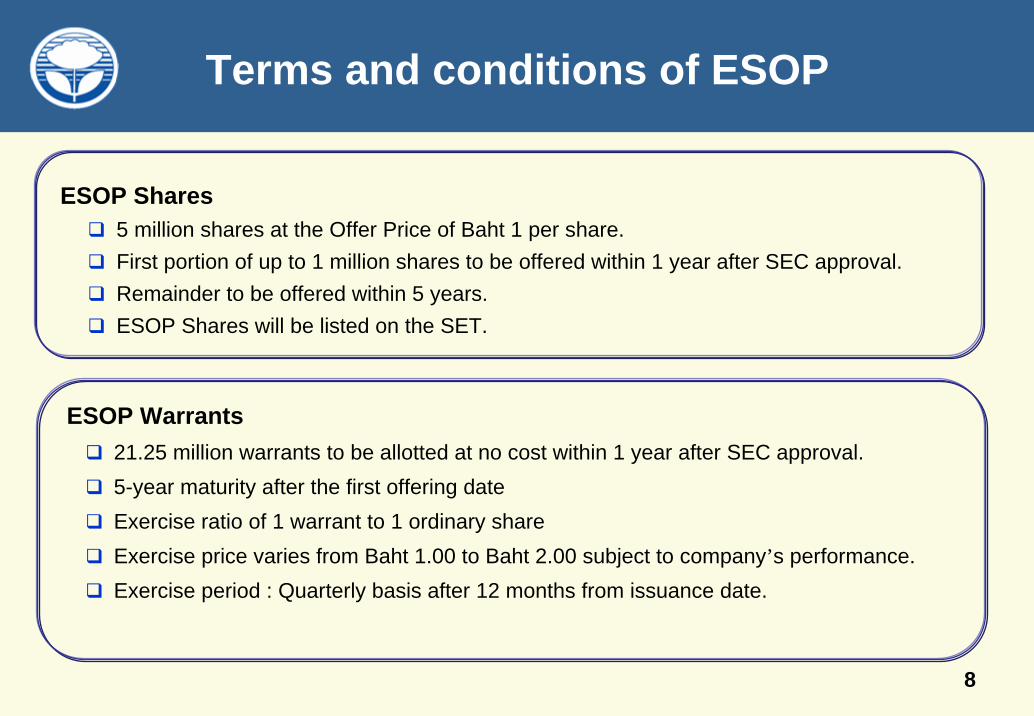
Terms and conditions of ESOP
ESOP Shares5 million shares at the Offer Price of Baht 1 per share.First portion of up to 1 million shares to be offered within 1 year after SEC approval.Remainder to be offered within 5 years.ESOP Shares will be listed on the SET.
ESOP Warrants21.25 million warrants to be allotted at no cost within 1 year after SEC approval.5-year maturity after the first offering dateExercise ratio of 1 warrant to 1 ordinary share Exercise price varies from Baht 1.00 to Baht 2.00 subject to company’s performance. Exercise period : Quarterly basis after 12 months from issuance date.
9
Jasmine Telecom Systems Plc.
Section 1 Company Profile
Section 2 Industry Overview
Section 3 Company Business
Section 4 Financial Highlights
Section 5 Investment Highlights
10
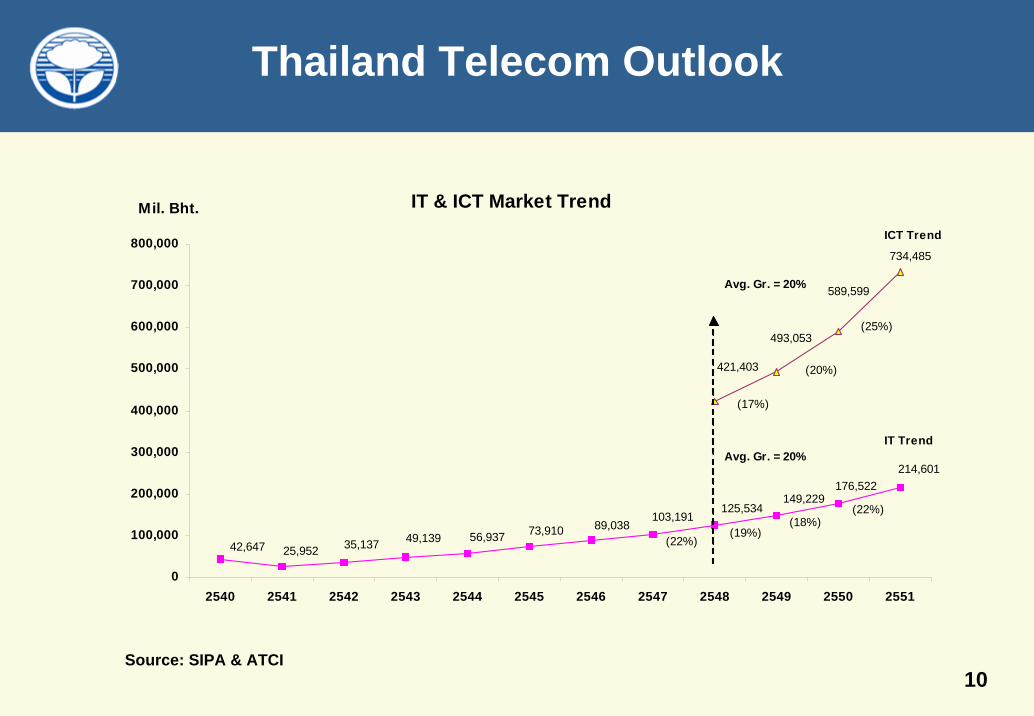
Thailand Telecom Outlook
Source: SIPA & ATCI
IT & ICT Market Trend
214,601176,522
149,229125,534
103,19189,03873,91056,93749,13935,13725,95242,647
734,485
589,599
493,053
421,403
0
100,000
200,000
300,000
400,000
500,000
600,000
700,000
800,000
2540 2541 2542 2543 2544 2545 2546 2547 2548 2549 2550 2551
Mil. Bht.
(22%)(19%)
(18%)(22%)
(17%)
(20%)
(25%)
ICT Trend
IT Trend
Avg. Gr. = 20%
Avg. Gr. = 20%
11
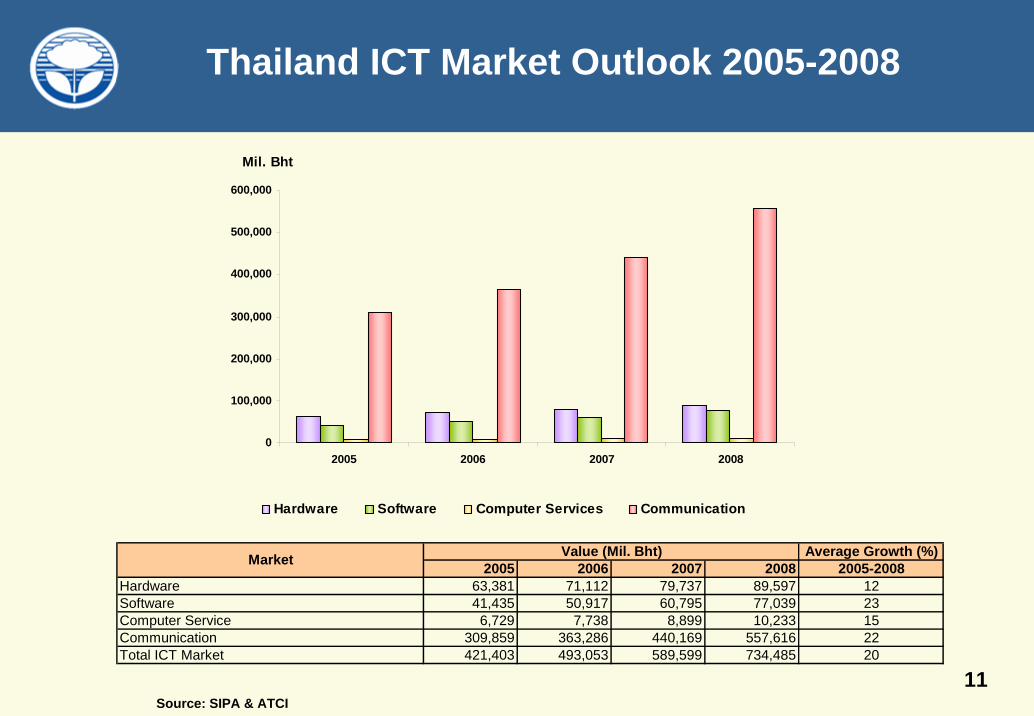
Thailand ICT Market Outlook 2005-2008
Source: SIPA & ATCI
0
100,000
200,000
300,000
400,000
500,000
600,000
2005 2006 2007 2008
Mil. Bht
Hardware Software Computer Services Communication
2005 2006 2007 2008Hardware 63,381 71,112 79,737 89,597Software 41,435 50,917 60,795 77,039Computer Service 6,729 7,738 8,899 10,233Communication 309,859 363,286 440,169 557,616Total ICT Market 421,403 493,053 589,599 734,485 20
12231522
Value (Mil. Bht)Market Average Growth (%)2005-2008
12
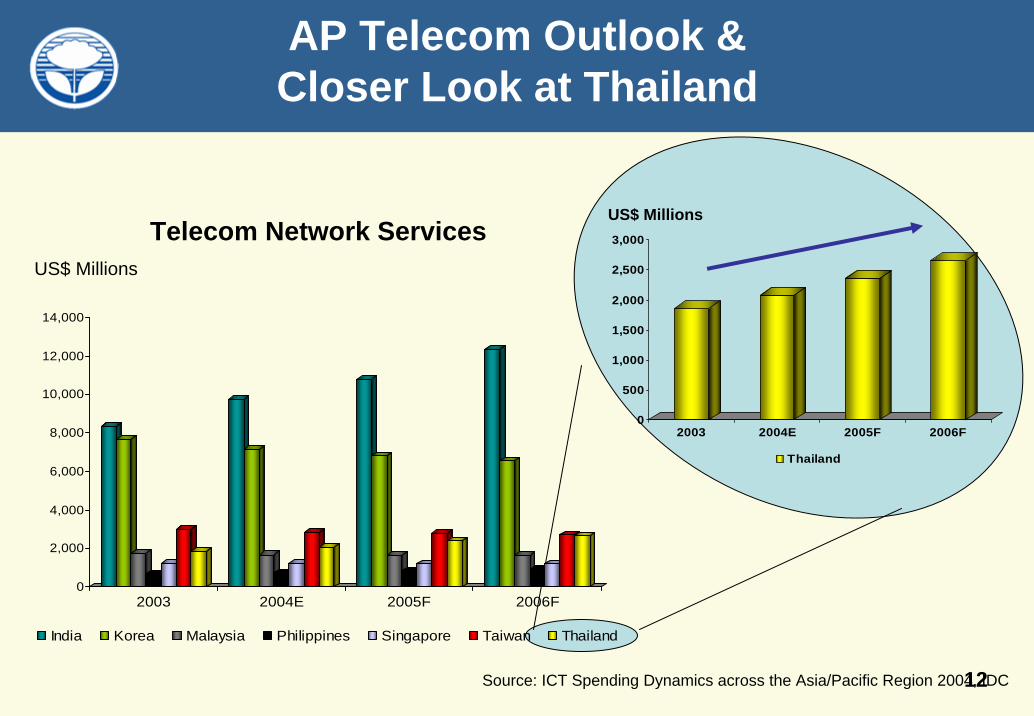
0
500
1,000
1,500
2,000
2,500
3,000
2003 2004E 2005F 2006F
Thailand
US$ Millions
Source: ICT Spending Dynamics across the Asia/Pacific Region 2004, IDC
AP Telecom Outlook & Closer Look at Thailand
0
2,000
4,000
6,000
8,000
10,000
12,000
14,000
2003 2004E 2005F 2006F
India Korea Malaysia Philippines Singapore Taiwan Thailand
Telecom Network ServicesUS$ Millions
13
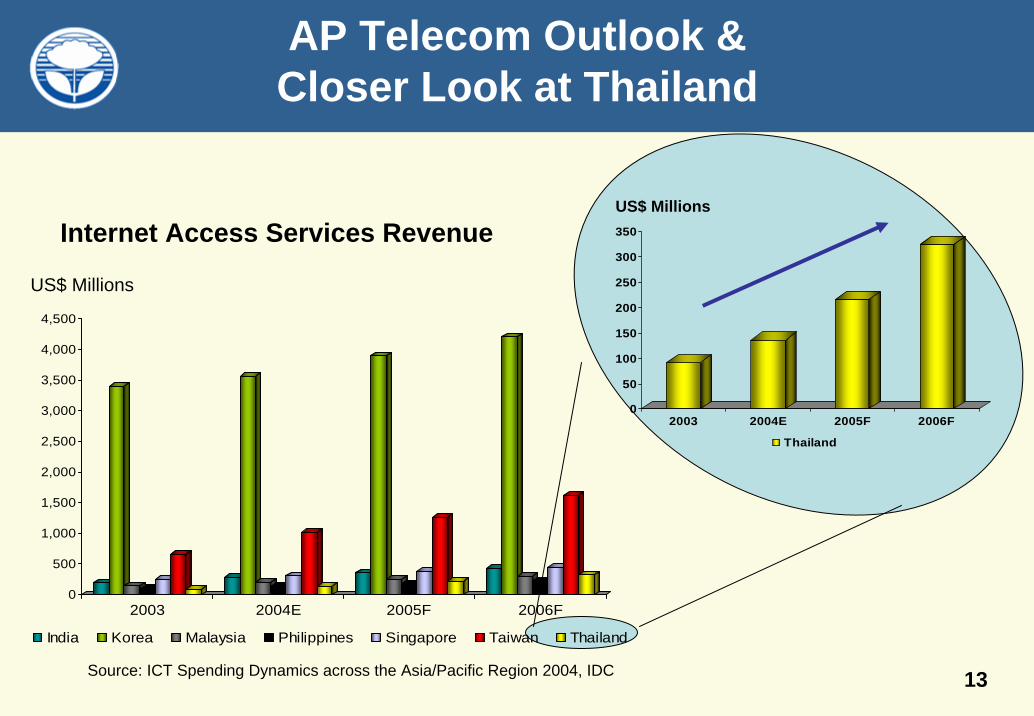
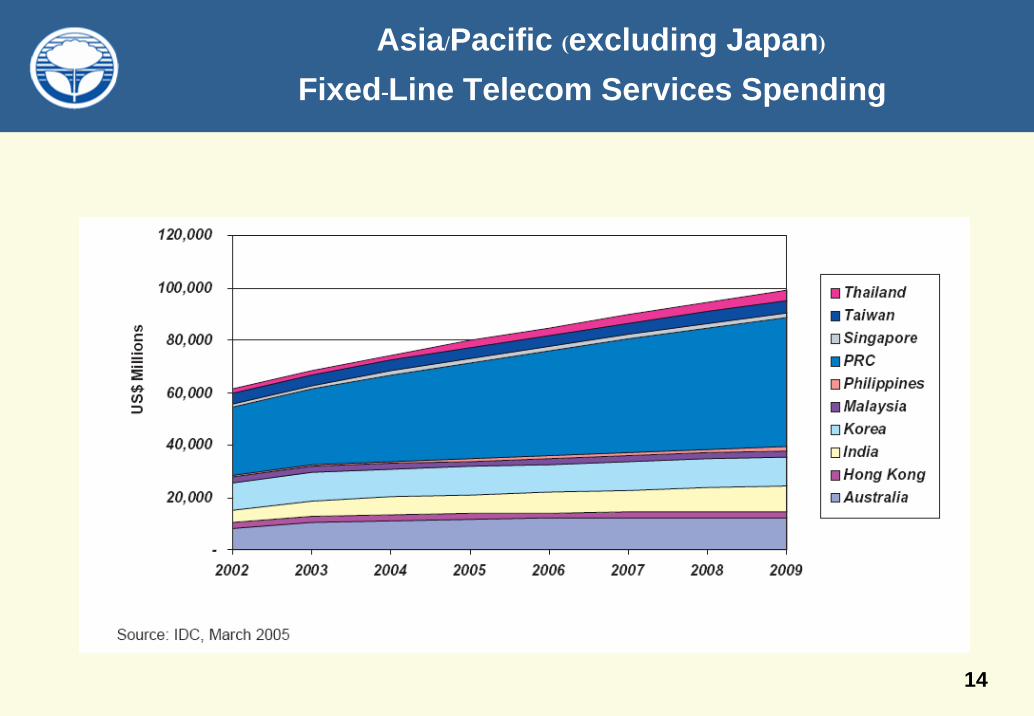
US$ Millions
0
50
100
150
200
250
300
350
2003 2004E 2005F 2006F
Thailand
Source: ICT Spending Dynamics across the Asia/Pacific Region 2004, IDC
Internet Access Services Revenue
US$ Millions
AP Telecom Outlook & Closer Look at Thailand
0
500
1,000
1,500
2,000
2,500
3,000
3,500
4,000
4,500
2003 2004E 2005F 2006F
India Korea Malaysia Philippines Singapore Taiwan Thailand
14
Asia/Pacific (excluding Japan)Fixed-Line Telecom Services Spending
15
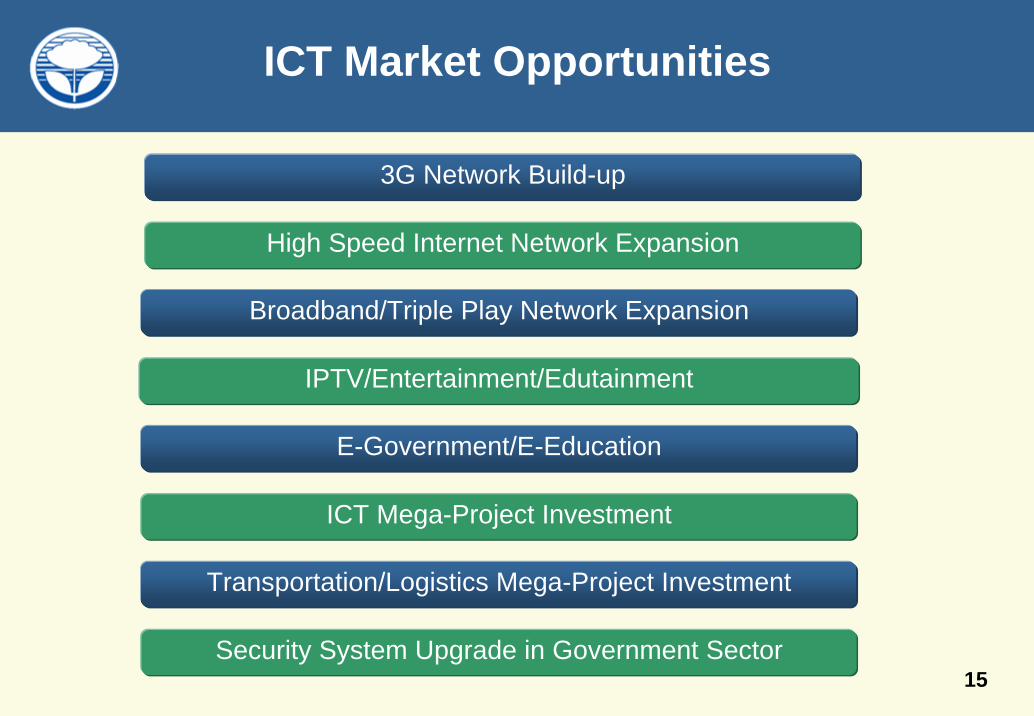
ICT Market Opportunities
3G Network Build-up
High Speed Internet Network Expansion
Broadband/Triple Play Network Expansion
IPTV/Entertainment/Edutainment
E-Government/E-Education
ICT Mega-Project Investment
Transportation/Logistics Mega-Project Investment
Security System Upgrade in Government Sector
16
Jasmine Telecom Systems Plc.
Section 1 Company Profile
Section 2 Industry Overview
Section 3 Company Business
Section 4 Financial Highlights
Section 5 Investment Highlights
17
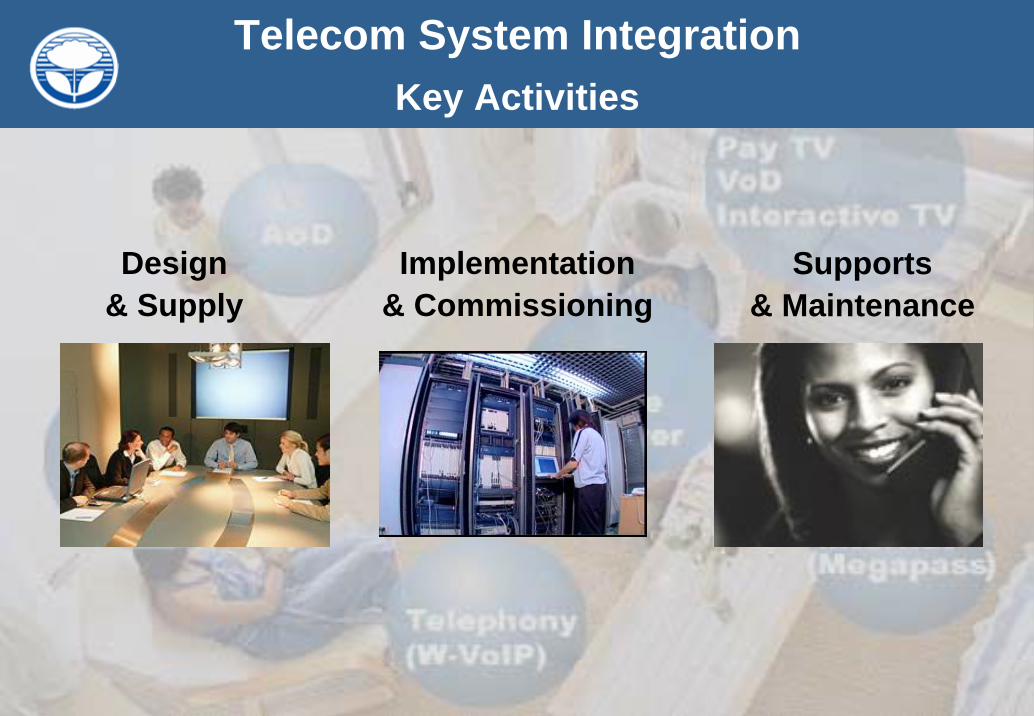
Telecom System IntegrationKey Activities
Design& Supply
Implementation& Commissioning
Supports& Maintenance
18
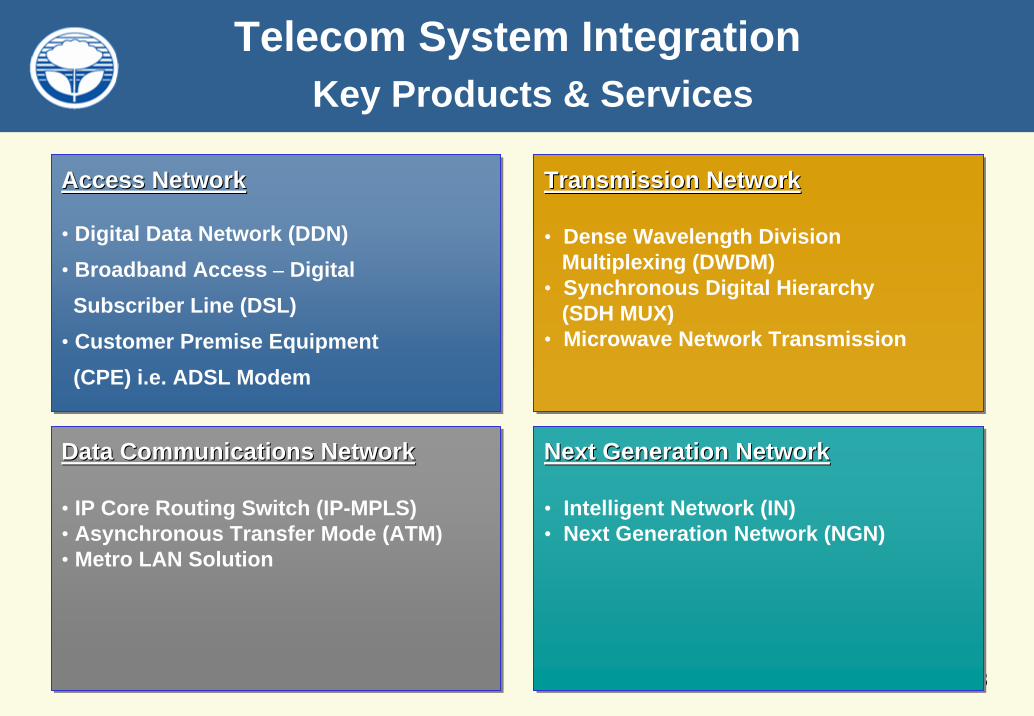
Next Generation Network
• Intelligent Network (IN)• Next Generation Network (NGN)
Next Generation NetworkNext Generation Network
• Intelligent Network (IN)• Next Generation Network (NGN)
Transmission Network
• Dense Wavelength Division Multiplexing (DWDM)
• Synchronous Digital Hierarchy (SDH MUX)
• Microwave Network Transmission
Transmission NetworkTransmission Network
• Dense Wavelength Division Multiplexing (DWDM)
• Synchronous Digital Hierarchy (SDH MUX)
• Microwave Network Transmission
Access Network
• Digital Data Network (DDN)• Broadband Access – Digital
Subscriber Line (DSL)• Customer Premise Equipment
(CPE) i.e. ADSL Modem
Access NetworkAccess Network
• Digital Data Network (DDN)• Broadband Access – Digital
Subscriber Line (DSL)• Customer Premise Equipment
(CPE) i.e. ADSL Modem
Data Communications Network
• IP Core Routing Switch (IP-MPLS)• Asynchronous Transfer Mode (ATM)• Metro LAN Solution
Data Communications NetworkData Communications Network
• IP Core Routing Switch (IP-MPLS)• Asynchronous Transfer Mode (ATM)• Metro LAN Solution
Telecom System Integration Key Products & Services
19
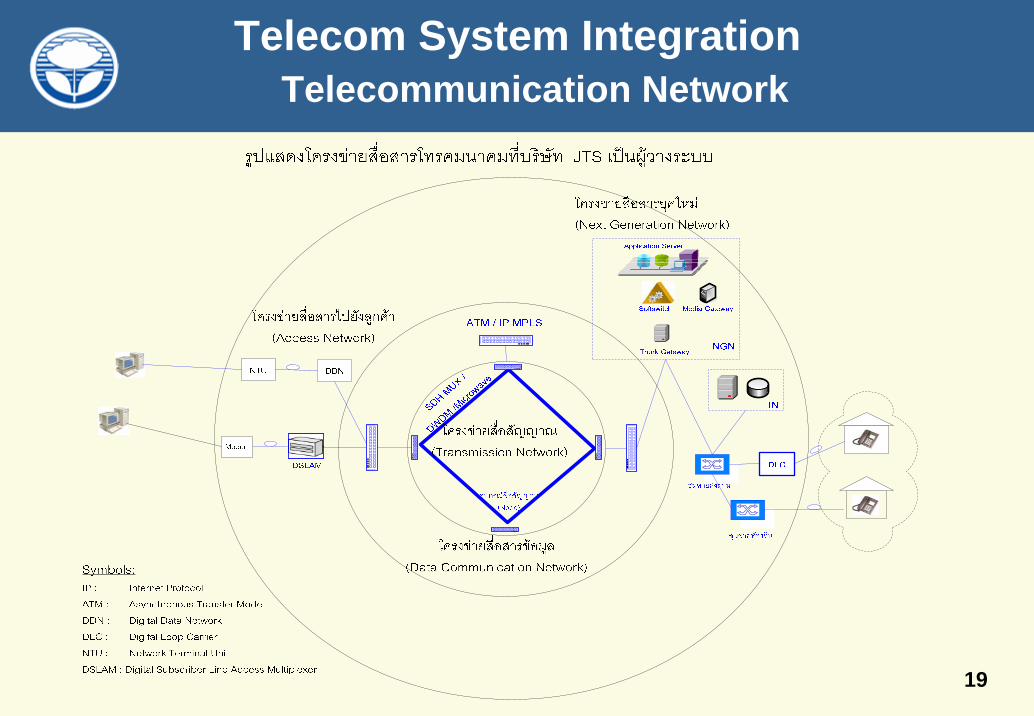
Telecom System Integration Telecommunication Network
21
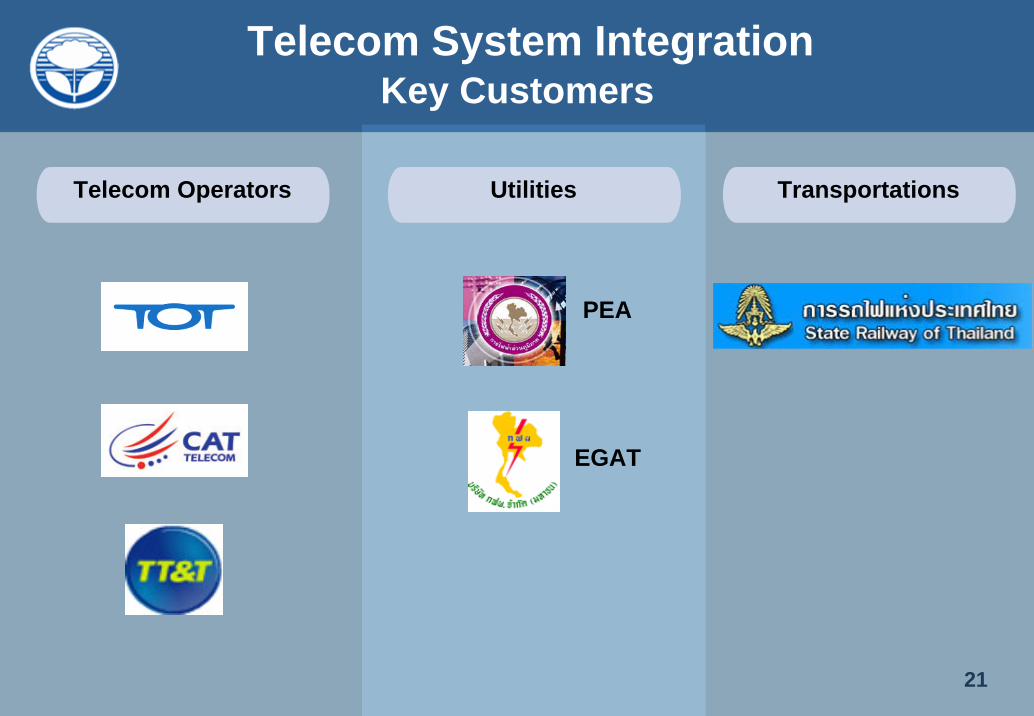
Telecom System IntegrationKey Customers
Telecom Operators Utilities Transportations
PEA
EGAT
22
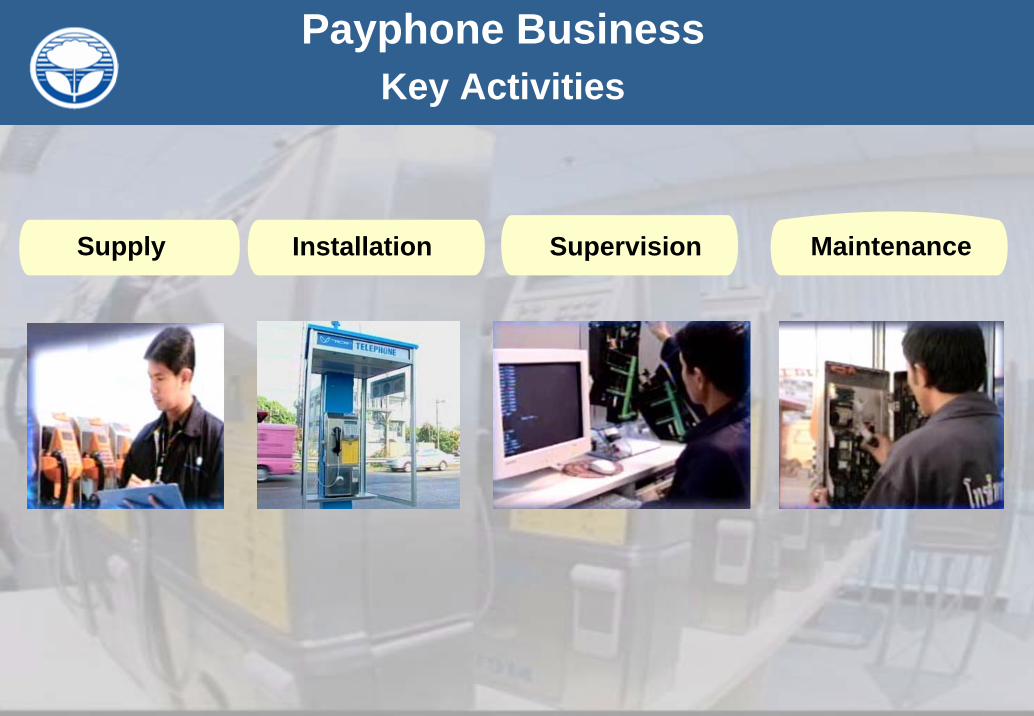
Payphone BusinessKey Activities
Supply Installation Supervision Maintenance
23
Payphone BusinessKey Partners
Pragai Siam Lump Sum
Suppliers
Subcontractors
24
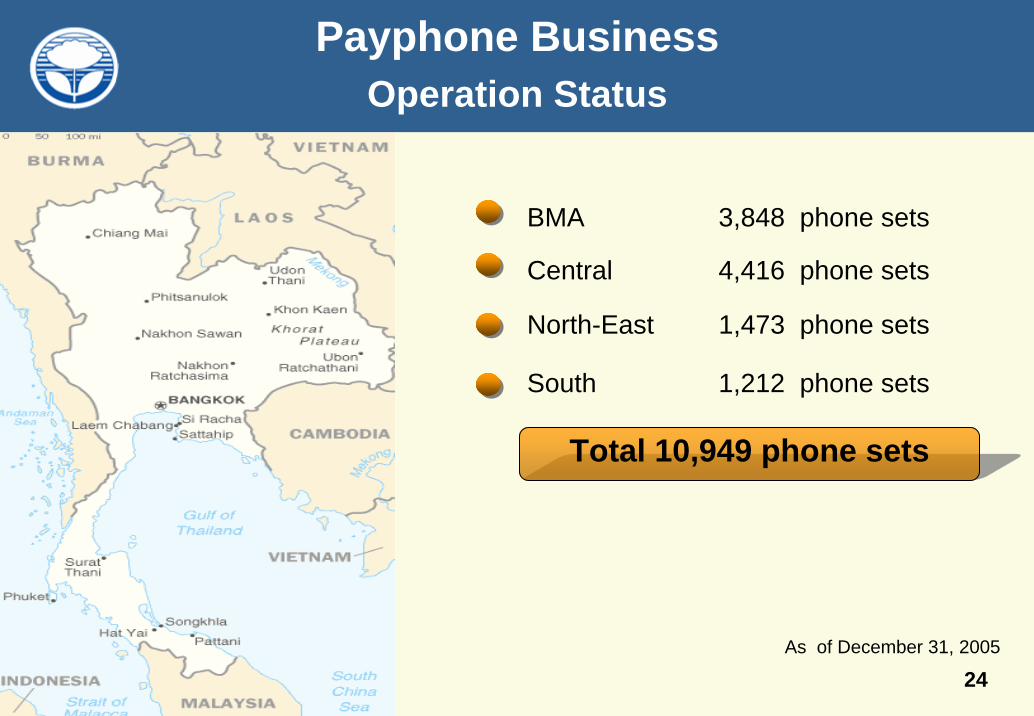
Payphone BusinessOperation Status
As of December 31, 2005
Total 10,949 phone sets
Central 4,416 phone sets
BMA 3,848 phone sets
North-East 1,473 phone sets
South 1,212 phone sets

25
Test Equipment BusinessKey Activities
Marketing & Sales Customer Service Training & Education
26
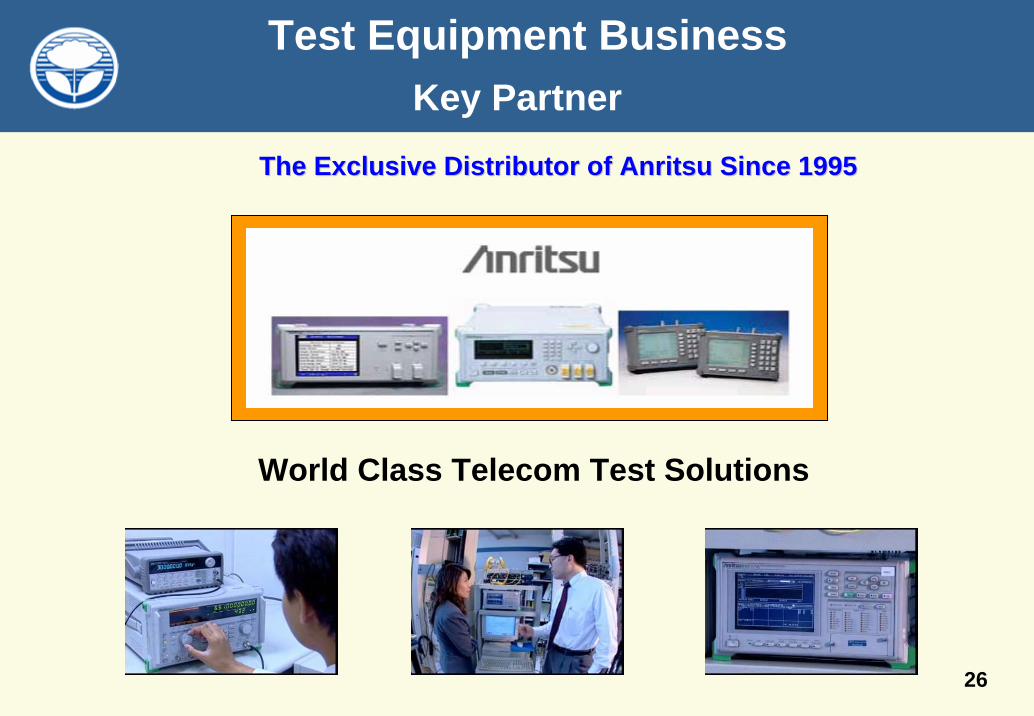
Test Equipment BusinessKey Partner
The Exclusive Distributor of Anritsu Since 1995The Exclusive Distributor of Anritsu Since 1995
World Class Telecom Test Solutions
27
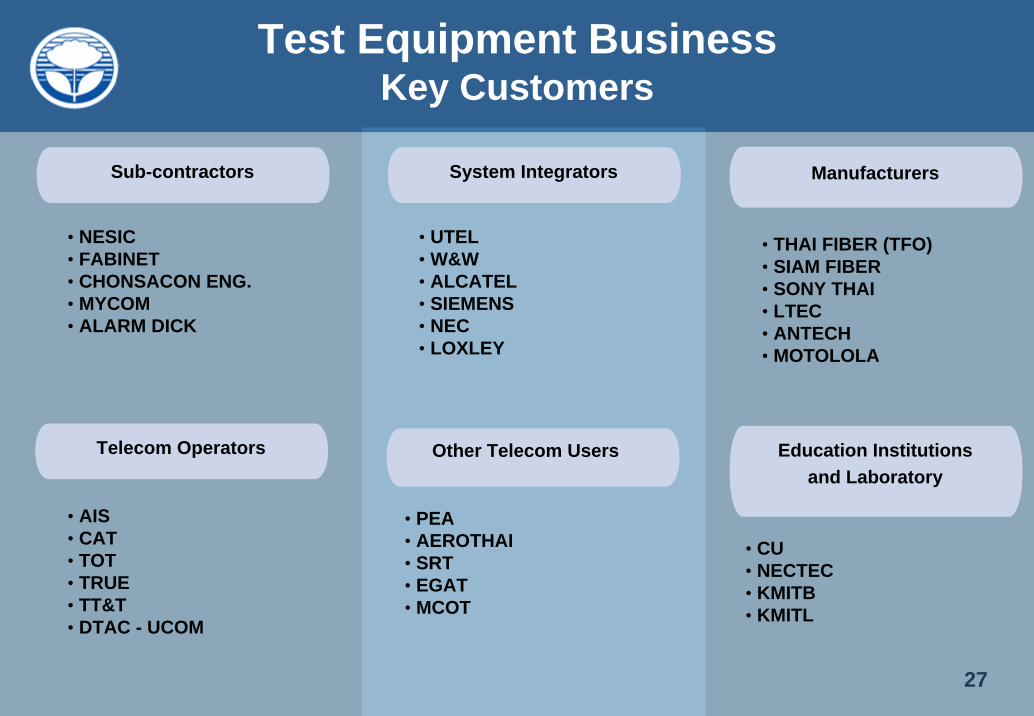
Test Equipment BusinessKey Customers
Sub-contractors
Telecom Operators
• NESIC• FABINET• CHONSACON ENG.• MYCOM• ALARM DICK
• AIS• CAT• TOT• TRUE• TT&T• DTAC - UCOM
Education Institutionsand Laboratory
Other Telecom Users
System Integrators
• UTEL• W&W• ALCATEL• SIEMENS• NEC• LOXLEY
Manufacturers
• THAI FIBER (TFO)• SIAM FIBER• SONY THAI• LTEC• ANTECH• MOTOLOLA
• PEA• AEROTHAI• SRT• EGAT• MCOT
• CU• NECTEC• KMITB• KMITL
28
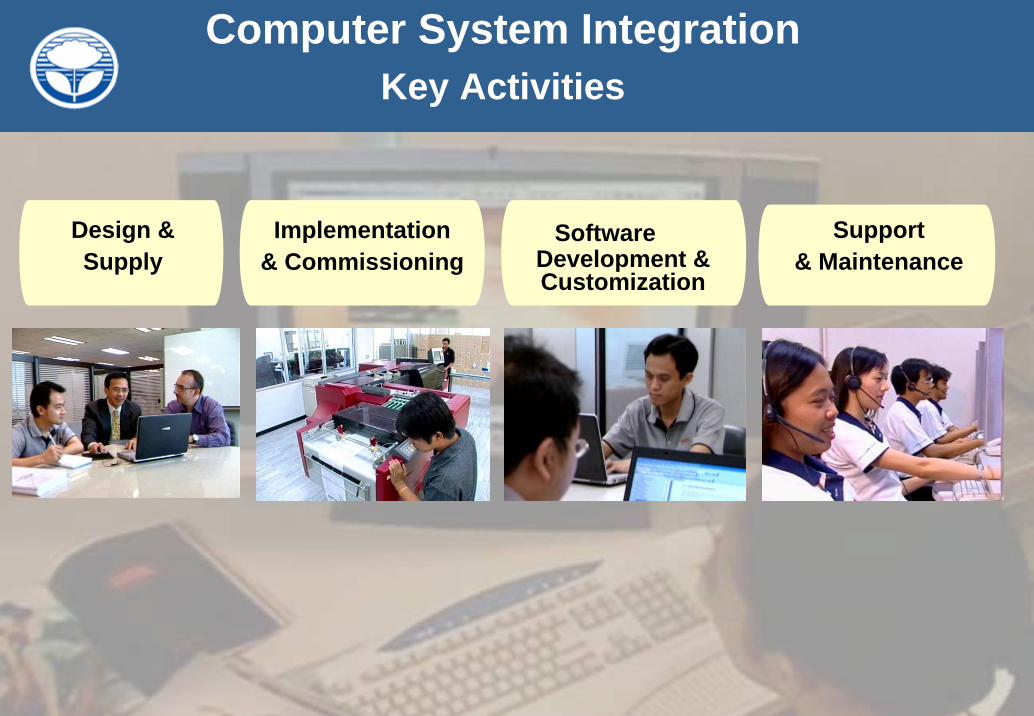
Computer System IntegrationKey Activities
Design &Supply
Software Development & Customization
Support & Maintenance
Implementation& Commissioning
29
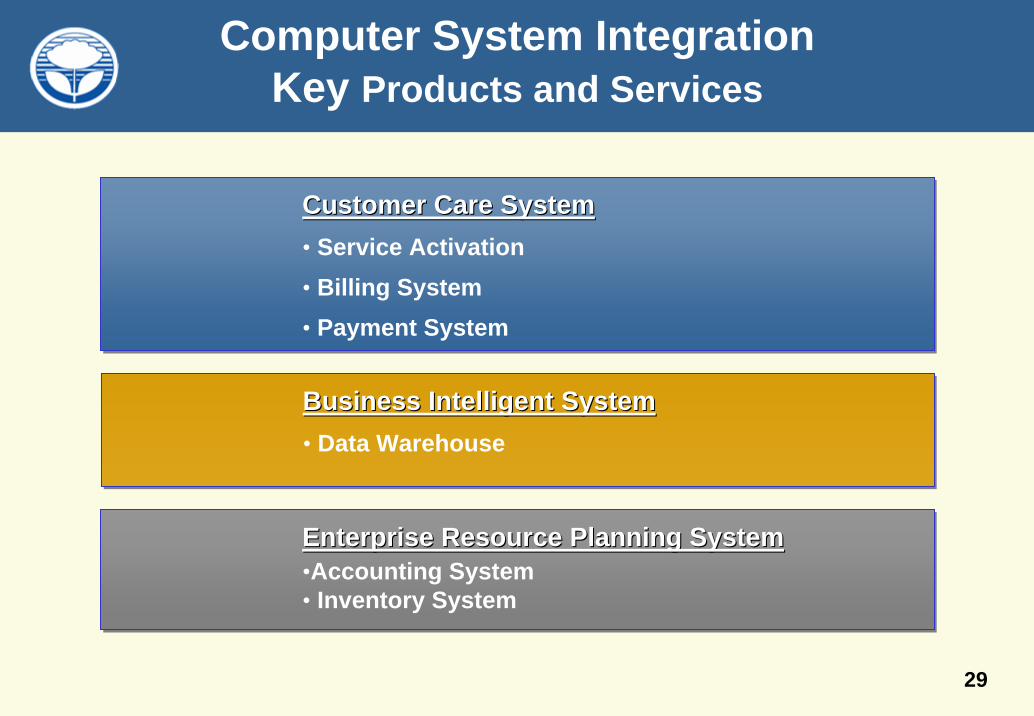
Computer System IntegrationKey Products and Services
Business Intelligent System• Data Warehouse
Business Intelligent SystemBusiness Intelligent System• Data Warehouse
Customer Care System• Service Activation• Billing System• Payment System
Customer Care SystemCustomer Care System• Service Activation• Billing System• Payment System
Enterprise Resource Planning System•Accounting System• Inventory System
Enterprise Resource Planning SystemEnterprise Resource Planning System•Accounting System• Inventory System
30
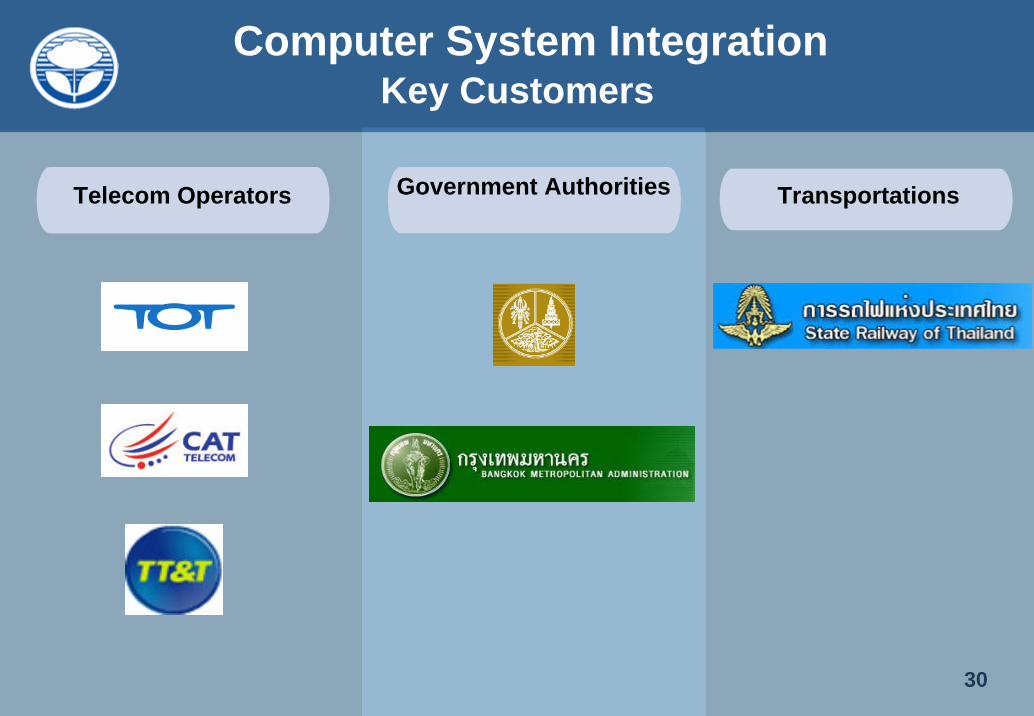
Computer System IntegrationKey Customers
Telecom Operators Government Authorities Transportations
31
Jasmine Telecom Systems Plc.
Section 1 Company Profile
Section 2 Industry Overview
Section 3 Company Business
Section 4 Financial Highlights
Section 5 Investment Highlights
32
Financial Summary
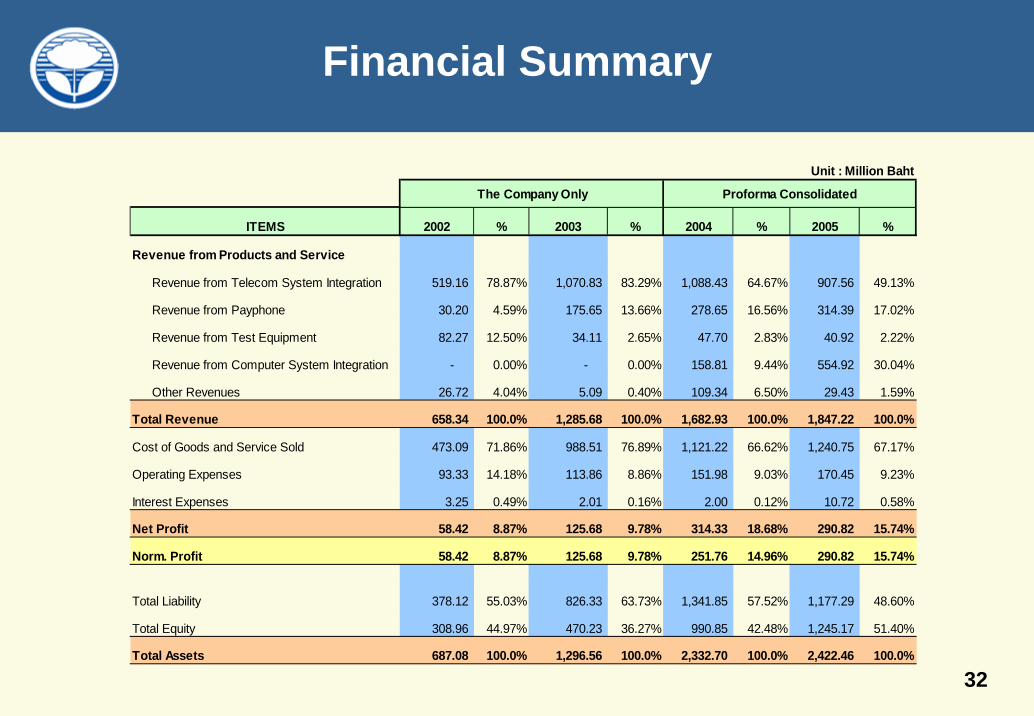
Unit : Million Baht
The Company Only Proforma Consolidated
ITEMS 2002 % 2003 % 2004 % 2005 %
Revenue from Products and Service
Revenue from Telecom System Integration 519.16 78.87% 1,070.83 83.29% 1,088.43 64.67% 907.56 49.13%
Revenue from Payphone 30.20 4.59% 175.65 13.66% 278.65 16.56% 314.39 17.02%
Revenue from Test Equipment 82.27 12.50% 34.11 2.65% 47.70 2.83% 40.92 2.22%
Revenue from Computer System Integration - 0.00% - 0.00% 158.81 9.44% 554.92 30.04%
Other Revenues 26.72 4.04% 5.09 0.40% 109.34 6.50% 29.43 1.59%
Total Revenue 658.34 100.0% 1,285.68 100.0% 1,682.93 100.0% 1,847.22 100.0%
Cost of Goods and Service Sold 473.09 71.86% 988.51 76.89% 1,121.22 66.62% 1,240.75 67.17%
Operating Expenses 93.33 14.18% 113.86 8.86% 151.98 9.03% 170.45 9.23%
Interest Expenses 3.25 0.49% 2.01 0.16% 2.00 0.12% 10.72 0.58%
Net Profit 58.42 8.87% 125.68 9.78% 314.33 18.68% 290.82 15.74%
Norm. Profit 58.42 8.87% 125.68 9.78% 251.76 14.96% 290.82 15.74%
Total Liability 378.12 55.03% 826.33 63.73% 1,341.85 57.52% 1,177.29 48.60%
Total Equity 308.96 44.97% 470.23 36.27% 990.85 42.48% 1,245.17 51.40%
Total Assets 687.08 100.0% 1,296.56 100.0% 2,332.70 100.0% 2,422.46 100.0%
33
Revenue Structure Growth
1,275.88
1,430.931,285.68
658.34
2002 2003 2004 2005
Total Revenue
Company Only Pro Forma Consolidated
1,847.22
1,682.93
2004 2005
Or 1,593.53 MB, excluding revenue from reversal of liabilities
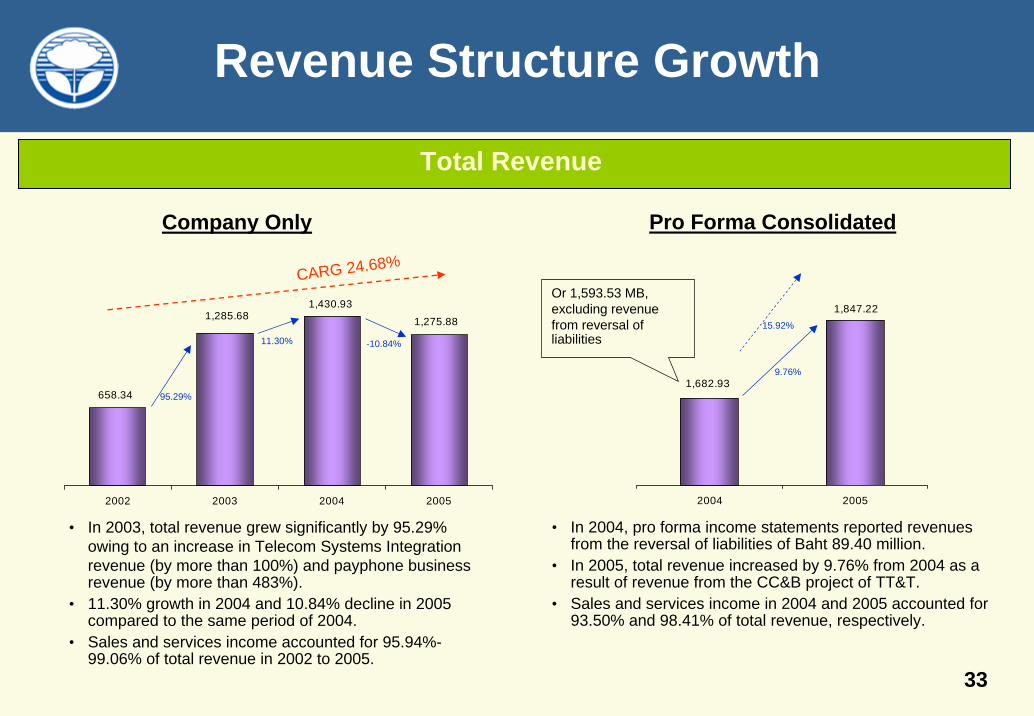
• In 2004, pro forma income statements reported revenues from the reversal of liabilities of Baht 89.40 million.
• In 2005, total revenue increased by 9.76% from 2004 as a result of revenue from the CC&B project of TT&T.
• Sales and services income in 2004 and 2005 accounted for 93.50% and 98.41% of total revenue, respectively.
• In 2003, total revenue grew significantly by 95.29% owing to an increase in Telecom Systems Integration revenue (by more than 100%) and payphone business revenue (by more than 483%).
• 11.30% growth in 2004 and 10.84% decline in 2005 compared to the same period of 2004.
• Sales and services income accounted for 95.94%-99.06% of total revenue in 2002 to 2005.
CARG 24.68%
95.29%
11.30% -10.84%
9.76%
15.92%
34
Revenue Structure Growth
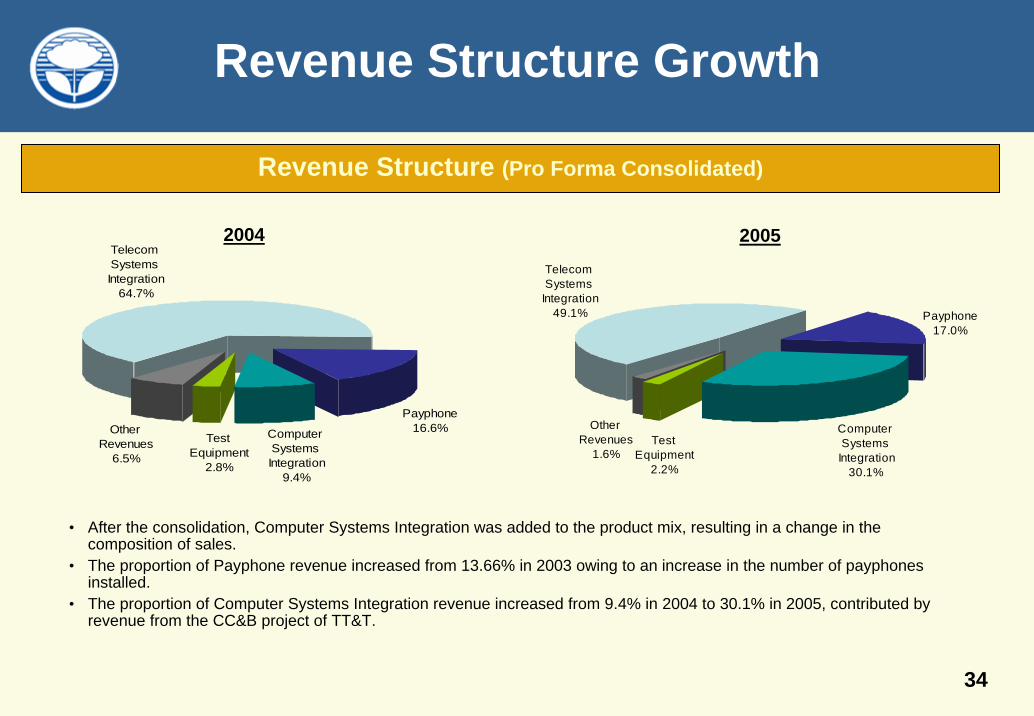
Telecom Systems Integration
64.7%
Computer Systems Integration
9.4%
Other Revenues
6.5%
Test Equipment
2.8%
Payphone16.6%
Revenue Structure (Pro Forma Consolidated)
• After the consolidation, Computer Systems Integration was added to the product mix, resulting in a change in the composition of sales.
• The proportion of Payphone revenue increased from 13.66% in 2003 owing to an increase in the number of payphones installed.
• The proportion of Computer Systems Integration revenue increased from 9.4% in 2004 to 30.1% in 2005, contributed by revenue from the CC&B project of TT&T.
Telecom Systems Integration
49.1%
Computer Systems Integration
30.1%
Other Revenues
1.6%Test
Equipment2.2%
Payphone17.0%
2004 2005
35
Cost & Expense Structure
Cost Structure
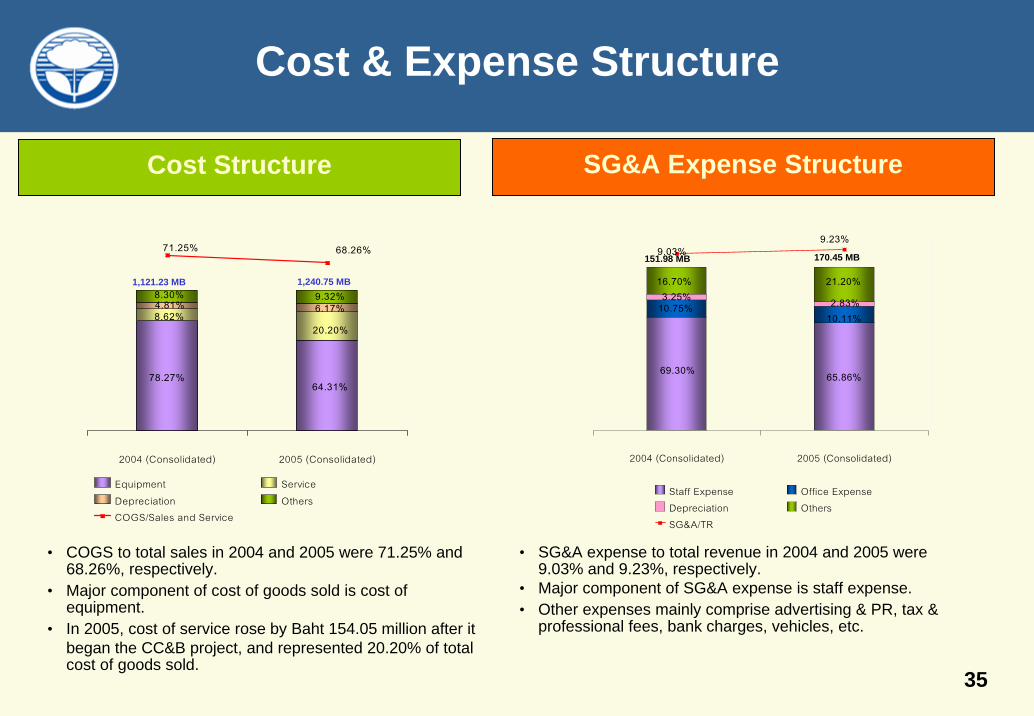
78.27%64.31%
20.20%8.62%
6.17%4.81%8.30% 9.32%
68.26%71.25%
2004 (Consolidated) 2005 (Consolidated)
Equipment ServiceDepreciation OthersCOGS/Sales and Service
1,121.23 MB 1,240.75 MB
• COGS to total sales in 2004 and 2005 were 71.25% and 68.26%, respectively.
• Major component of cost of goods sold is cost of equipment.
• In 2005, cost of service rose by Baht 154.05 million after it began the CC&B project, and represented 20.20% of total cost of goods sold.
SG&A Expense Structure
65.86%69.30%
10.75%10.11%
3.25% 2.83%
21.20%16.70%
9.23%9.03%
2004 (Consolidated) 2005 (Consolidated)
Staff Expense Office ExpenseDepreciation OthersSG&A/TR
151.98 MB 170.45 MB
• SG&A expense to total revenue in 2004 and 2005 were 9.03% and 9.23%, respectively.
• Major component of SG&A expense is staff expense. • Other expenses mainly comprise advertising & PR, tax &
professional fees, bank charges, vehicles, etc.
36
Profitability
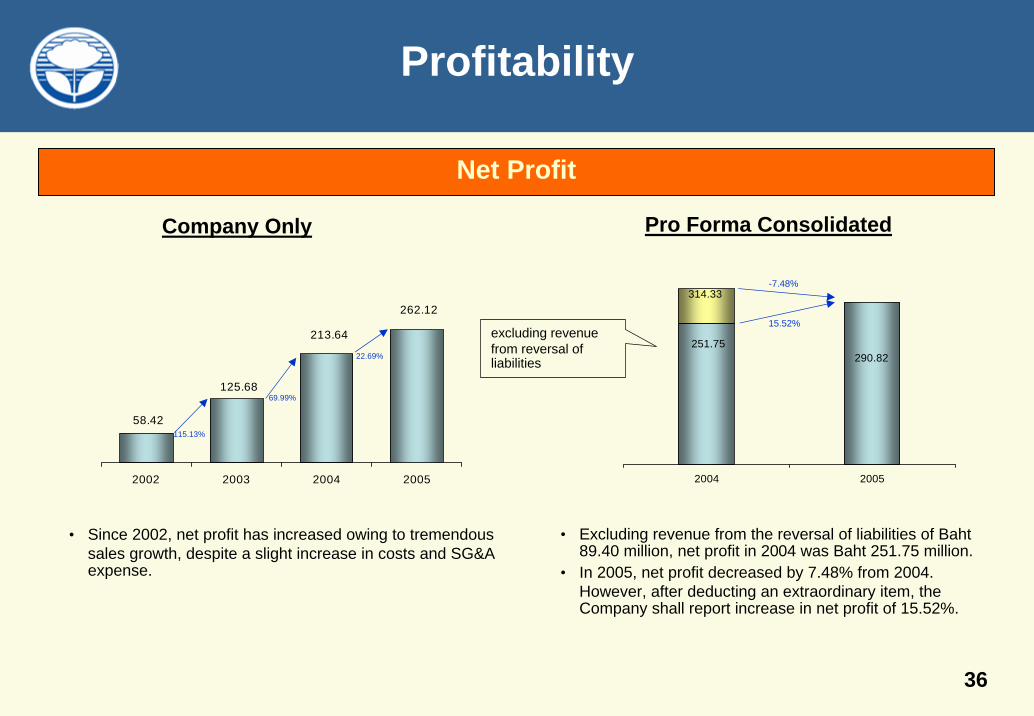
251.75290.82
314.33
2004 2005
Net Profit
Company Only Pro Forma Consolidated
• Since 2002, net profit has increased owing to tremendous sales growth, despite a slight increase in costs and SG&A expense.
excluding revenue from reversal of liabilities
• Excluding revenue from the reversal of liabilities of Baht 89.40 million, net profit in 2004 was Baht 251.75 million.
• In 2005, net profit decreased by 7.48% from 2004. However, after deducting an extraordinary item, the Company shall report increase in net profit of 15.52%.
262.12
213.64
58.42
125.68
2002 2003 2004 2005
15.52%
-7.48%
115.13%
69.99%
22.69%
37
Operating Performance
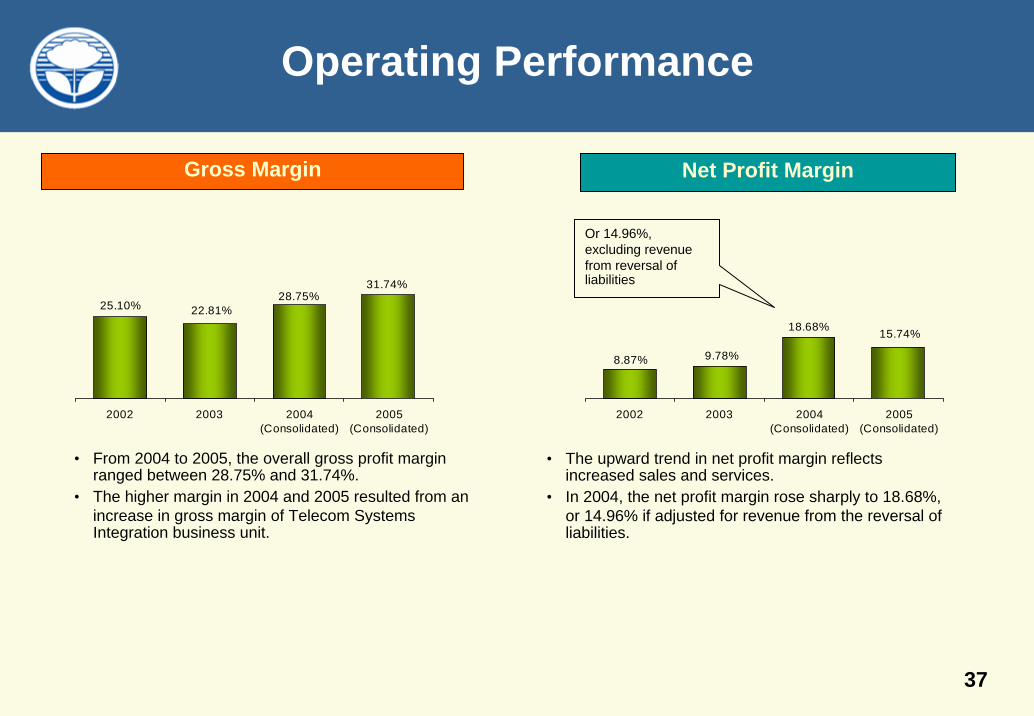
15.74%18.68%
8.87% 9.78%
2002 2003 2004(Consolidated)
2005(Consolidated)
Net Profit MarginGross Margin
• The upward trend in net profit margin reflects increased sales and services.
• In 2004, the net profit margin rose sharply to 18.68%, or 14.96% if adjusted for revenue from the reversal of liabilities.
Or 14.96%, excluding revenue from reversal of liabilities
• From 2004 to 2005, the overall gross profit margin ranged between 28.75% and 31.74%.
• The higher margin in 2004 and 2005 resulted from an increase in gross margin of Telecom Systems Integration business unit.
31.74%28.75%
25.10% 22.81%
2002 2003 2004(Consolidated)
2005(Consolidated)
38
Returns
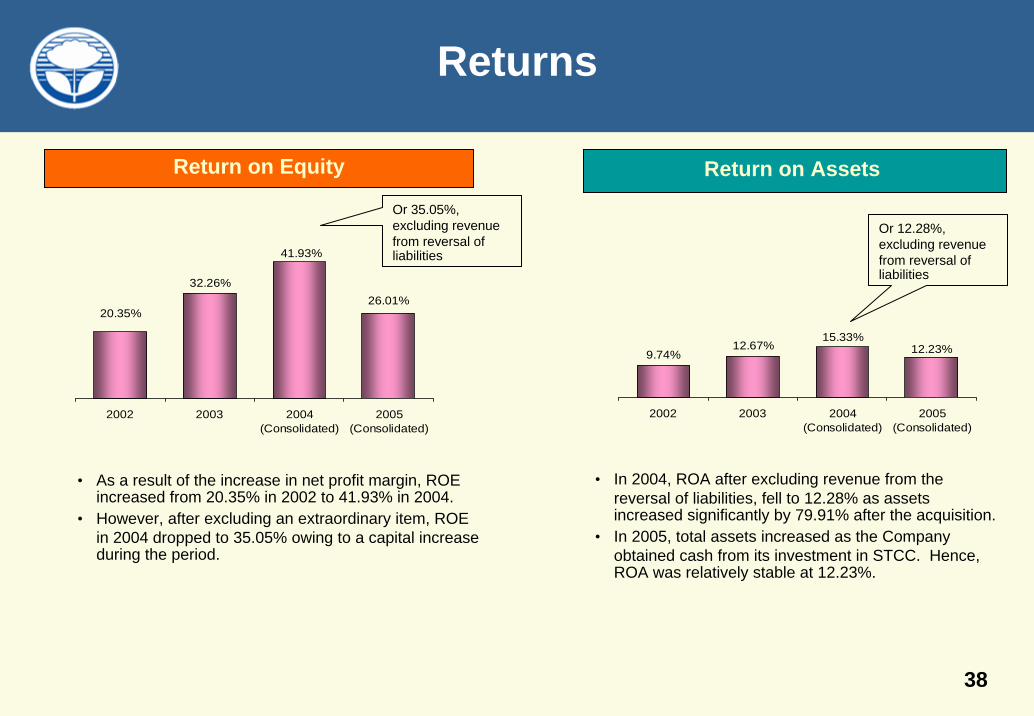
26.01%
41.93%
20.35%
32.26%
2002 2003 2004(Consolidated)
2005(Consolidated)
Return on AssetsReturn on Equity
• As a result of the increase in net profit margin, ROE increased from 20.35% in 2002 to 41.93% in 2004.
• However, after excluding an extraordinary item, ROE in 2004 dropped to 35.05% owing to a capital increase during the period.
Or 35.05%, excluding revenue from reversal of liabilities
Or 12.28%, excluding revenue from reversal of liabilities
• In 2004, ROA after excluding revenue from the reversal of liabilities, fell to 12.28% as assets increased significantly by 79.91% after the acquisition.
• In 2005, total assets increased as the Company obtained cash from its investment in STCC. Hence, ROA was relatively stable at 12.23%.
12.23%15.33%
9.74%12.67%
2002 2003 2004(Consolidated)
2005(Consolidated)
39
Financial Status
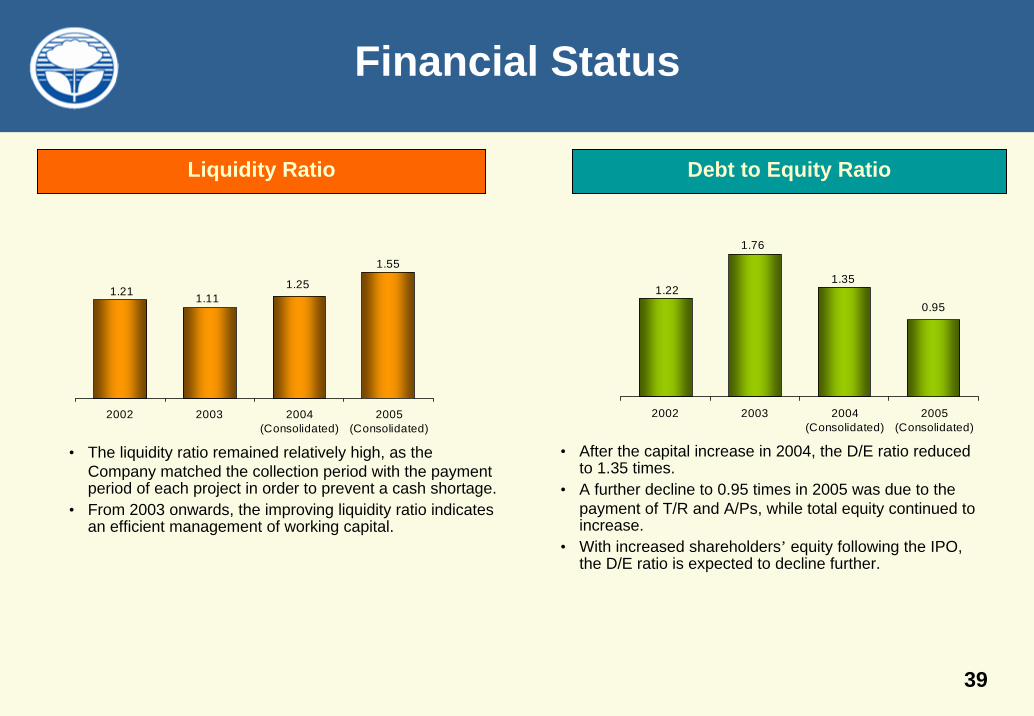
1.55
1.251.21 1.11
2002 2003 2004(Consolidated)
2005(Consolidated)
Debt to Equity RatioLiquidity Ratio
• The liquidity ratio remained relatively high, as the Company matched the collection period with the payment period of each project in order to prevent a cash shortage.
• From 2003 onwards, the improving liquidity ratio indicates an efficient management of working capital.
• After the capital increase in 2004, the D/E ratio reduced to 1.35 times.
• A further decline to 0.95 times in 2005 was due to the payment of T/R and A/Ps, while total equity continued to increase.
• With increased shareholders’ equity following the IPO, the D/E ratio is expected to decline further.
0.95
1.351.22
1.76
2002 2003 2004(Consolidated)
2005(Consolidated)
40
Jasmine Telecom Systems Plc.
Section 1 Company Profile
Section 2 Industry Overview
Section 3 Company Business
Section 4 Financial Highlights
Section 5 Investment Highlights
41
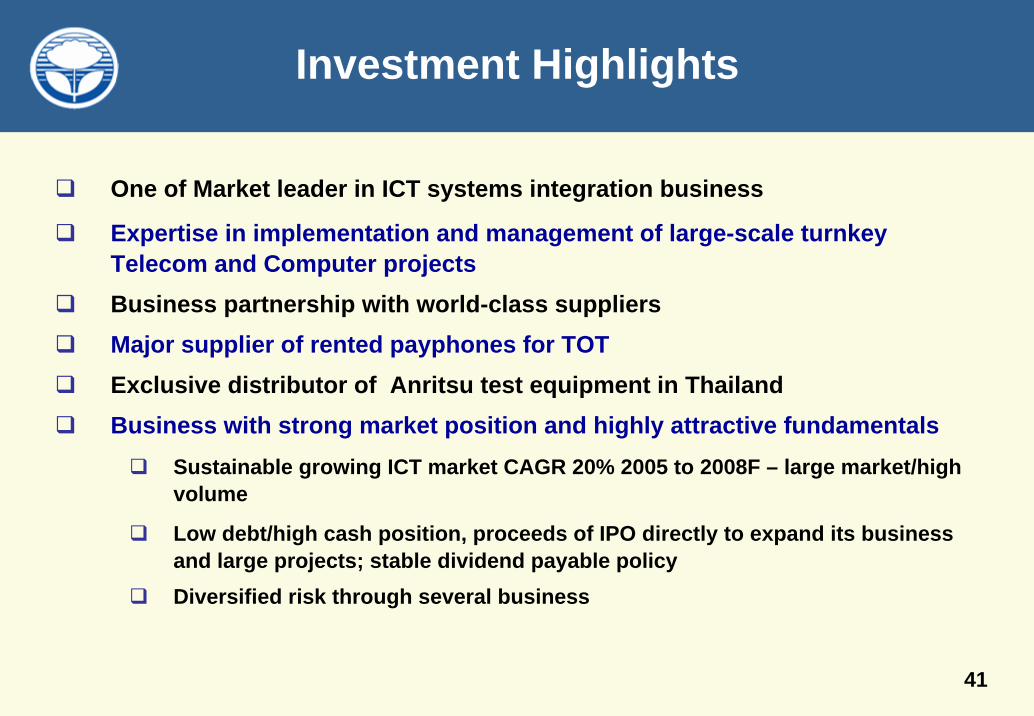
Investment Highlights
One of Market leader in ICT systems integration business
Expertise in implementation and management of large-scale turnkey Telecom and Computer projectsBusiness partnership with world-class suppliersMajor supplier of rented payphones for TOTExclusive distributor of Anritsu test equipment in ThailandBusiness with strong market position and highly attractive fundamentals
Sustainable growing ICT market CAGR 20% 2005 to 2008F – large market/high volume
Low debt/high cash position, proceeds of IPO directly to expand its business and large projects; stable dividend payable policyDiversified risk through several business
42
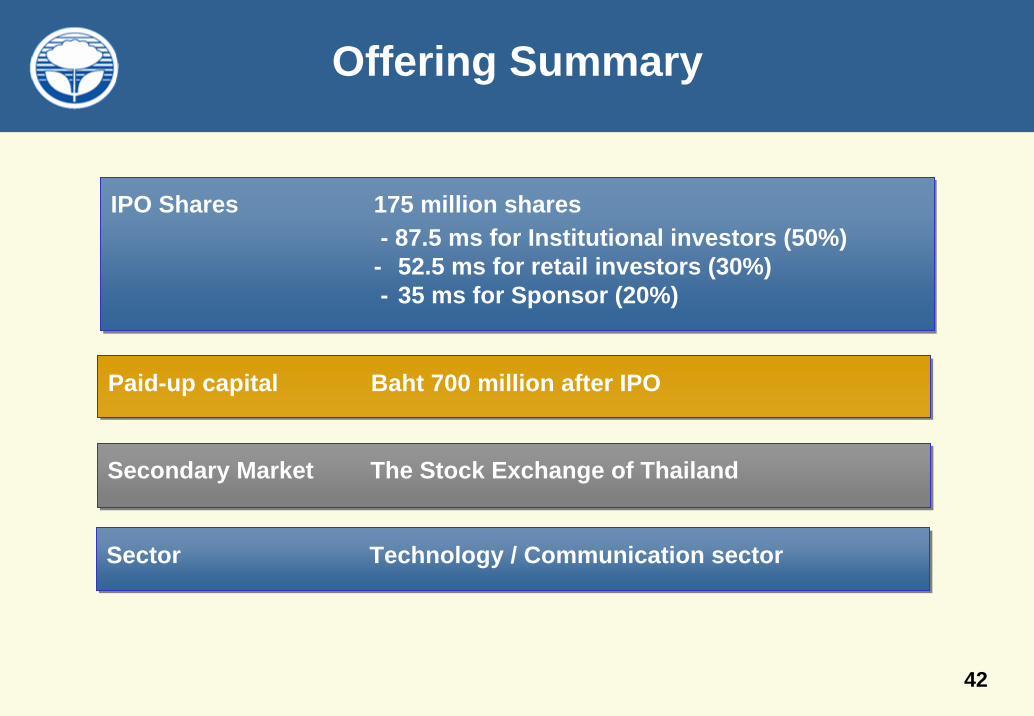
Offering Summary
Paid-up capital Baht 700 million after IPOPaid-up capital Baht 700 million after IPO
IPO Shares 175 million shares - 87.5 ms for Institutional investors (50%)- 52.5 ms for retail investors (30%)- 35 ms for Sponsor (20%)
IPO Shares 175 million shares - 87.5 ms for Institutional investors (50%)- 52.5 ms for retail investors (30%)- 35 ms for Sponsor (20%)
Secondary Market The Stock Exchange of ThailandSecondary Market The Stock Exchange of Thailand
Sector Technology / Communication sectorSector Technology / Communication sector
43
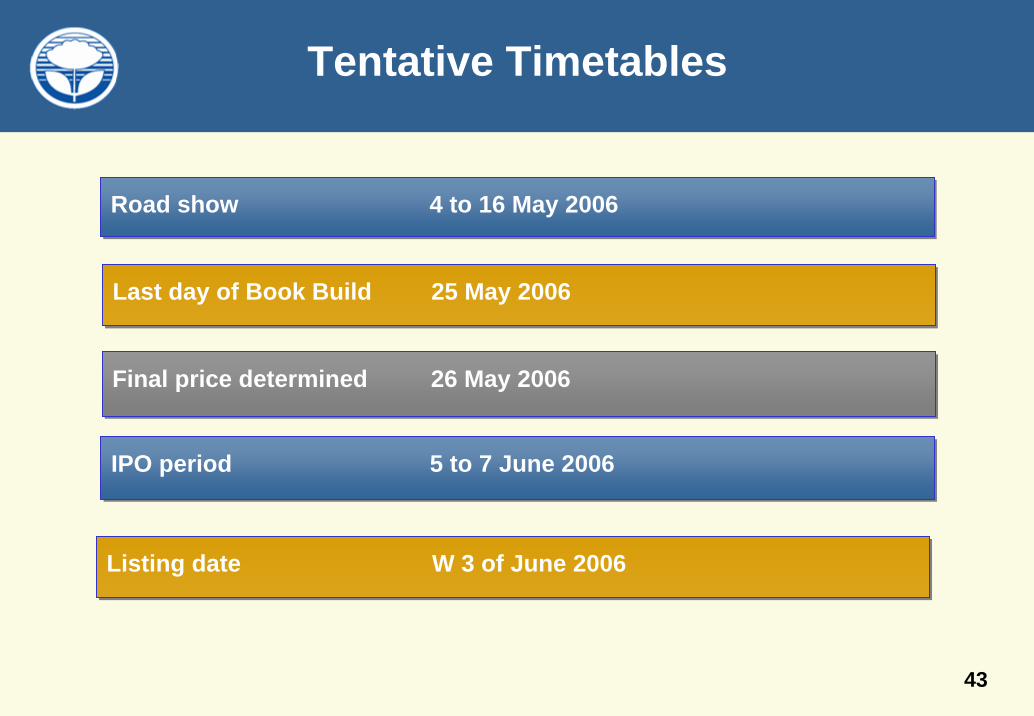
Tentative Timetables
Last day of Book Build 25 May 2006Last day of Book Build 25 May 2006
Road show 4 to 16 May 2006 Road show 4 to 16 May 2006
Final price determined 26 May 2006Final price determined 26 May 2006
IPO period 5 to 7 June 2006IPO period 5 to 7 June 2006
Listing date W 3 of June 2006Listing date W 3 of June 2006
Thank you Jasmine Telecom Systems Plc.