Embed Size (px)
Citation preview
Company presentation
Q2 2015 Figures
2 2
TAG Immobilien AG | Q2 2015
CO
NT
EN
T
Content
I. TAG highlights Q2 2015
II. TAG financials Q2 2015
III. TAG portfolio and platform
IV. TAG acquisitions and disposals
V. TAG outlook
VI. Appendix
Strategy
Capex and maintenance
Valuation
Capital markets heads-up
Bonds and convertibles
Management Board and management structure
3
5
11
14
18
20

TAG highlights Q2 2015
3
4 4
TAG Immobilien AG | Q2 2015
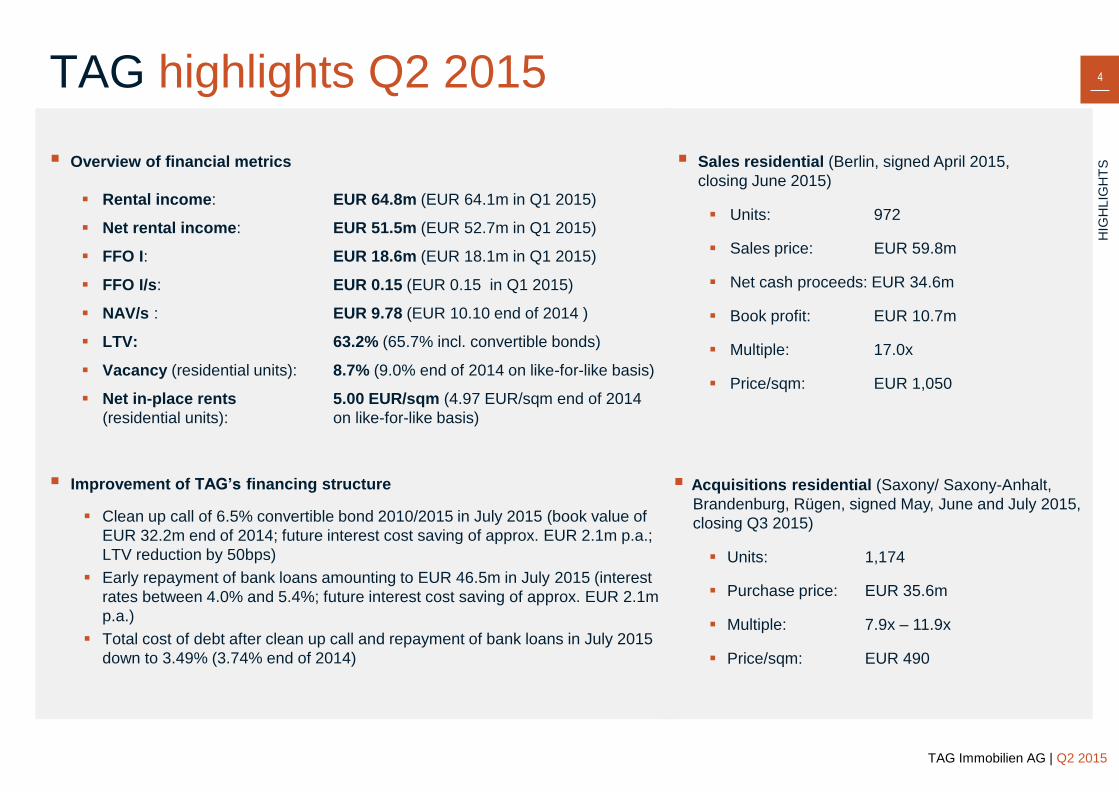
Overview of financial metrics
Rental income: EUR 64.8m (EUR 64.1m in Q1 2015)
Net rental income: EUR 51.5m (EUR 52.7m in Q1 2015)
FFO I: EUR 18.6m (EUR 18.1m in Q1 2015)
FFO I/s: EUR 0.15 (EUR 0.15 in Q1 2015)
NAV/s : EUR 9.78 (EUR 10.10 end of 2014 )
LTV: 63.2% (65.7% incl. convertible bonds)
Vacancy (residential units): 8.7% (9.0% end of 2014 on like-for-like basis)
Net in-place rents 5.00 EUR/sqm (4.97 EUR/sqm end of 2014
(residential units): on like-for-like basis)
Improvement of TAG’s financing structure
Clean up call of 6.5% convertible bond 2010/2015 in July 2015 (book value of
EUR 32.2m end of 2014; future interest cost saving of approx. EUR 2.1m p.a.;
LTV reduction by 50bps)
Early repayment of bank loans amounting to EUR 46.5m in July 2015 (interest
rates between 4.0% and 5.4%; future interest cost saving of approx. EUR 2.1m
p.a.)
Total cost of debt after clean up call and repayment of bank loans in July 2015
down to 3.49% (3.74% end of 2014)
HIG
HLIG
HT
S
TAG highlights Q2 2015
Sales residential (Berlin, signed April 2015,
closing June 2015)
Units: 972
Sales price: EUR 59.8m
Net cash proceeds: EUR 34.6m
Book profit: EUR 10.7m
Multiple: 17.0x
Price/sqm: EUR 1,050
Acquisitions residential (Saxony/ Saxony-Anhalt,
Brandenburg, Rügen, signed May, June and July 2015,
closing Q3 2015)
Units: 1,174
Purchase price: EUR 35.6m
Multiple: 7.9x – 11.9x
Price/sqm: EUR 490

TAG financials Q2 2015
5
6 6
TAG Immobilien AG | Q2 2015
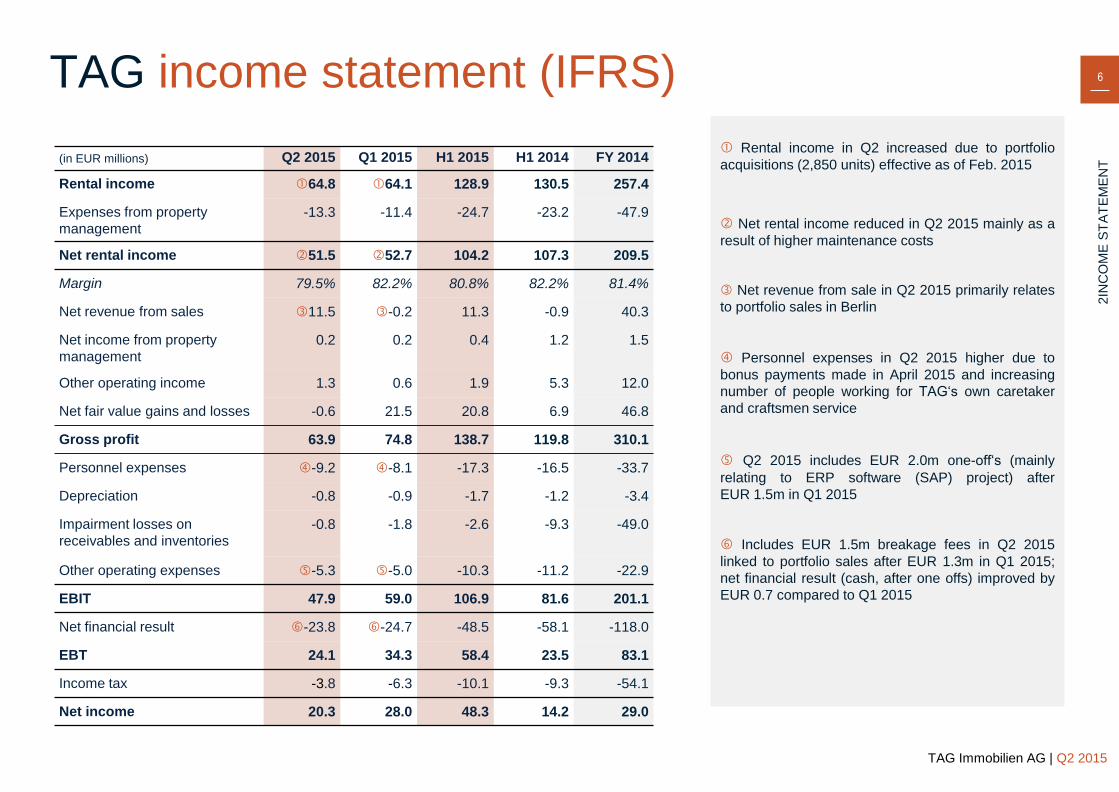
Rental income in Q2 increased due to portfolio
acquisitions (2,850 units) effective as of Feb. 2015
Net rental income reduced in Q2 2015 mainly as a
result of higher maintenance costs
Net revenue from sale in Q2 2015 primarily relates
to portfolio sales in Berlin
Personnel expenses in Q2 2015 higher due to
bonus payments made in April 2015 and increasing
number of people working for TAG‘s own caretaker
and craftsmen service
Q2 2015 includes EUR 2.0m one-off‘s (mainly
relating to ERP software (SAP) project) after
EUR 1.5m in Q1 2015
Includes EUR 1.5m breakage fees in Q2 2015
linked to portfolio sales after EUR 1.3m in Q1 2015;
net financial result (cash, after one offs) improved by
EUR 0.7 compared to Q1 2015
2IN
CO
ME
ST
AT
EM
EN
T
TAG income statement (IFRS)
(in EUR millions) Q2 2015 Q1 2015 H1 2015 H1 2014 FY 2014
Rental income 64.8 64.1 128.9 130.5 257.4
Expenses from property
management
-13.3 -11.4 -24.7 -23.2 -47.9
Net rental income 51.5 52.7 104.2 107.3 209.5
Margin 79.5% 82.2% 80.8% 82.2% 81.4%
Net revenue from sales 11.5 -0.2 11.3 -0.9 40.3
Net income from property
management
0.2 0.2 0.4 1.2 1.5
Other operating income 1.3 0.6 1.9 5.3 12.0
Net fair value gains and losses -0.6 21.5 20.8 6.9 46.8
Gross profit 63.9 74.8 138.7 119.8 310.1
Personnel expenses -9.2 -8.1 -17.3 -16.5 -33.7
Depreciation -0.8 -0.9 -1.7 -1.2 -3.4
Impairment losses on
receivables and inventories
-0.8 -1.8 -2.6 -9.3 -49.0
Other operating expenses -5.3 -5.0 -10.3 -11.2 -22.9
EBIT 47.9 59.0 106.9 81.6 201.1
Net financial result -23.8 -24.7 -48.5 -58.1 -118.0
EBT 24.1 34.3 58.4 23.5 83.1
Income tax -3.8 -6.3 -10.1 -9.3 -54.1
Net income 20.3 28.0 48.3 14.2 29.0
7 7
TAG Immobilien AG | Q2 2015
FF
O
TAG FFO calculation
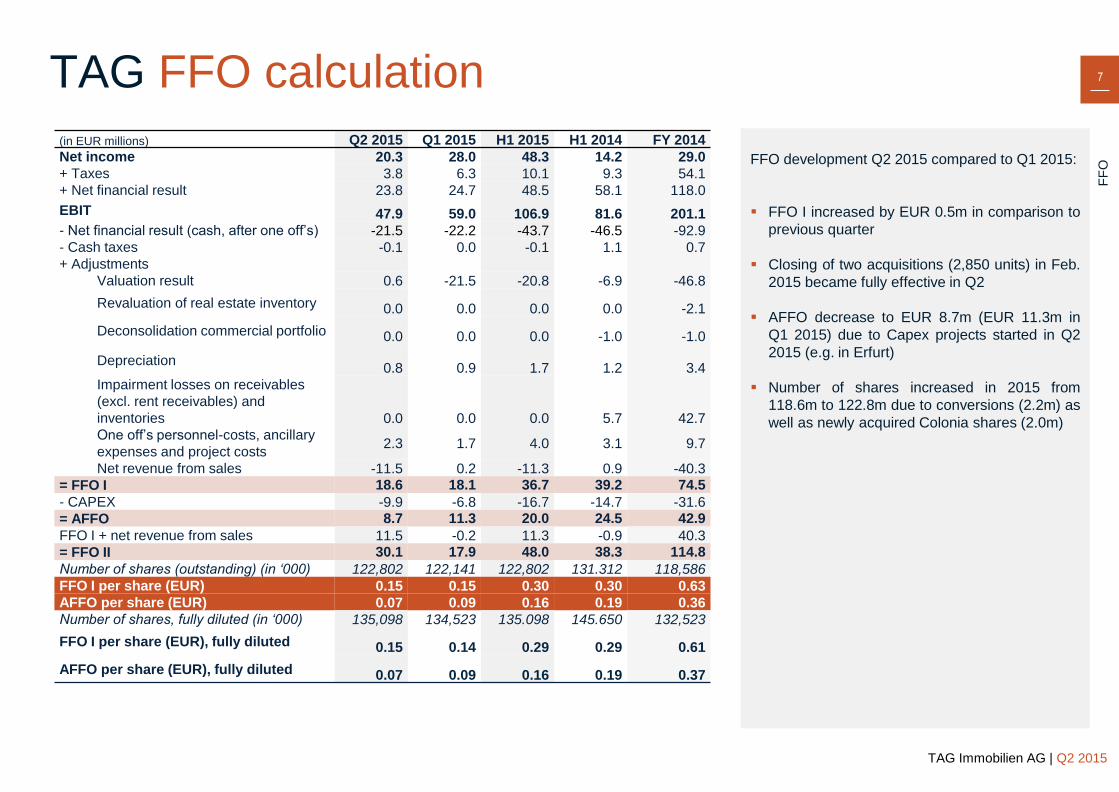
(in EUR millions) Q2 2015 Q1 2015 H1 2015 H1 2014 FY 2014
Net income 20.3 28.0 48.3 14.2 29.0
+ Taxes 3.8 6.3 10.1 9.3 54.1
+ Net financial result 23.8 24.7 48.5 58.1 118.0
EBIT 47.9 59.0 106.9 81.6 201.1
- Net financial result (cash, after one off’s) -21.5 -22.2 -43.7 -46.5 -92.9
- Cash taxes -0.1 0.0 -0.1 1.1 0.7
+ Adjustments
Valuation result 0.6 -21.5 -20.8 -6.9 -46.8
Revaluation of real estate inventory 0.0 0.0 0.0 0.0 -2.1
Deconsolidation commercial portfolio 0.0 0.0 0.0 -1.0 -1.0
Depreciation 0.8 0.9 1.7 1.2 3.4
Impairment losses on receivables
(excl. rent receivables) and
inventories 0.0 0.0 0.0 5.7 42.7
One off’s personnel-costs, ancillary
expenses and project costs 2.3 1.7 4.0 3.1 9.7
Net revenue from sales -11.5 0.2 -11.3 0.9 -40.3
= FFO I 18.6 18.1 36.7 39.2 74.5
- CAPEX -9.9 -6.8 -16.7 -14.7 -31.6
= AFFO 8.7 11.3 20.0 24.5 42.9
FFO I + net revenue from sales 11.5 -0.2 11.3 -0.9 40.3
= FFO II 30.1 17.9 48.0 38.3 114.8
Number of shares (outstanding) (in ‘000) 122,802 122,141 122,802 131.312 118,586
FFO I per share (EUR) 0.15 0.15 0.30 0.30 0.63
AFFO per share (EUR) 0.07 0.09 0.16 0.19 0.36
Number of shares, fully diluted (in ‘000) 135,098 134,523 135.098 145.650 132,523
FFO I per share (EUR), fully diluted 0.15 0.14 0.29 0.29 0.61
AFFO per share (EUR), fully diluted 0.07 0.09 0.16 0.19 0.37
FFO development Q2 2015 compared to Q1 2015:
FFO I increased by EUR 0.5m in comparison to
previous quarter
Closing of two acquisitions (2,850 units) in Feb.
2015 became fully effective in Q2
AFFO decrease to EUR 8.7m (EUR 11.3m in
Q1 2015) due to Capex projects started in Q2
2015 (e.g. in Erfurt)
Number of shares increased in 2015 from
118.6m to 122.8m due to conversions (2.2m) as
well as newly acquired Colonia shares (2.0m)
8 8
TAG Immobilien AG | Q2 2015
BA
LA
NC
E S
HE
ET
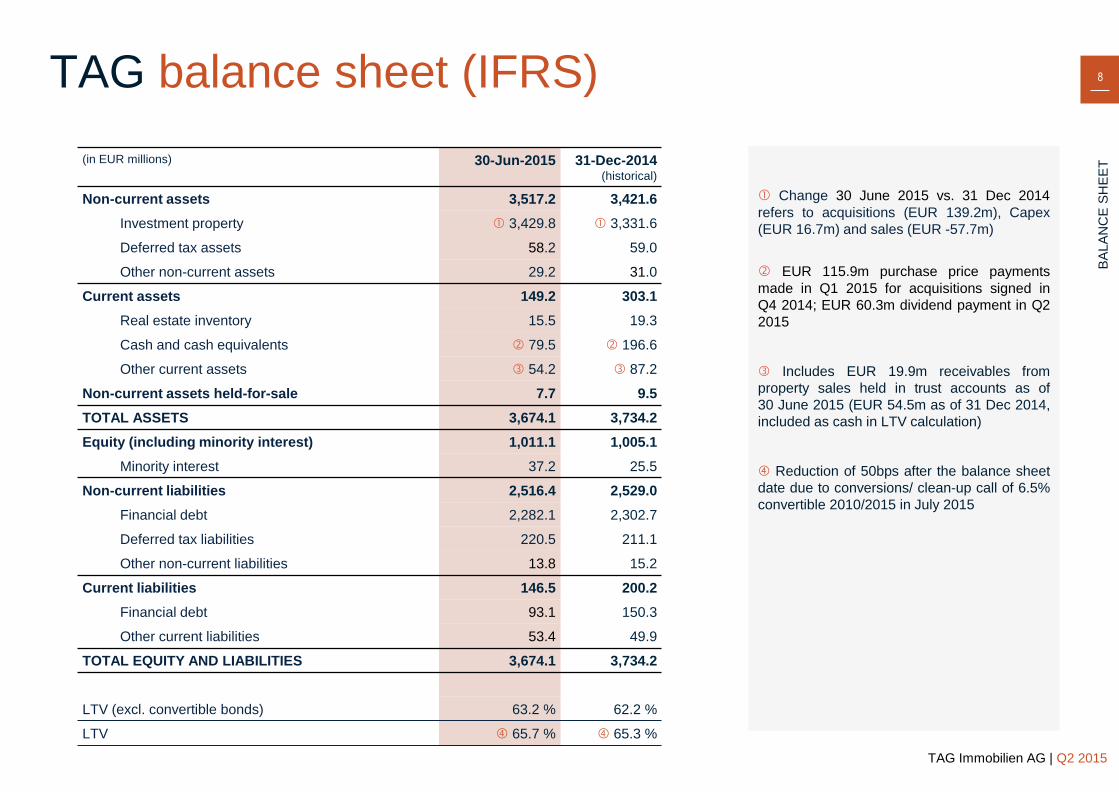
TAG balance sheet (IFRS)
(in EUR millions) 30-Jun-2015 31-Dec-2014 (historical)
Non-current assets 3,517.2 3,421.6
Investment property 3,429.8 3,331.6
Deferred tax assets 58.2 59.0
Other non-current assets 29.2 31.0
Current assets 149.2 303.1
Real estate inventory 15.5 19.3
Cash and cash equivalents 79.5 196.6
Other current assets 54.2 87.2
Non-current assets held-for-sale 7.7 9.5
TOTAL ASSETS 3,674.1 3,734.2
Equity (including minority interest) 1,011.1 1,005.1
Minority interest 37.2 25.5
Non-current liabilities 2,516.4 2,529.0
Financial debt 2,282.1 2,302.7
Deferred tax liabilities 220.5 211.1
Other non-current liabilities 13.8 15.2
Current liabilities 146.5 200.2
Financial debt 93.1 150.3
Other current liabilities 53.4 49.9
TOTAL EQUITY AND LIABILITIES 3,674.1 3,734.2
LTV (excl. convertible bonds) 63.2 % 62.2 %
LTV 65.7 % 65.3 %
Change 30 June 2015 vs. 31 Dec 2014
refers to acquisitions (EUR 139.2m), Capex
(EUR 16.7m) and sales (EUR -57.7m)
EUR 115.9m purchase price payments
made in Q1 2015 for acquisitions signed in
Q4 2014; EUR 60.3m dividend payment in Q2
2015
Includes EUR 19.9m receivables from
property sales held in trust accounts as of
30 June 2015 (EUR 54.5m as of 31 Dec 2014,
included as cash in LTV calculation)
Reduction of 50bps after the balance sheet
date due to conversions/ clean-up call of 6.5%
convertible 2010/2015 in July 2015
9 9
TAG Immobilien AG | Q2 2015
NA
V
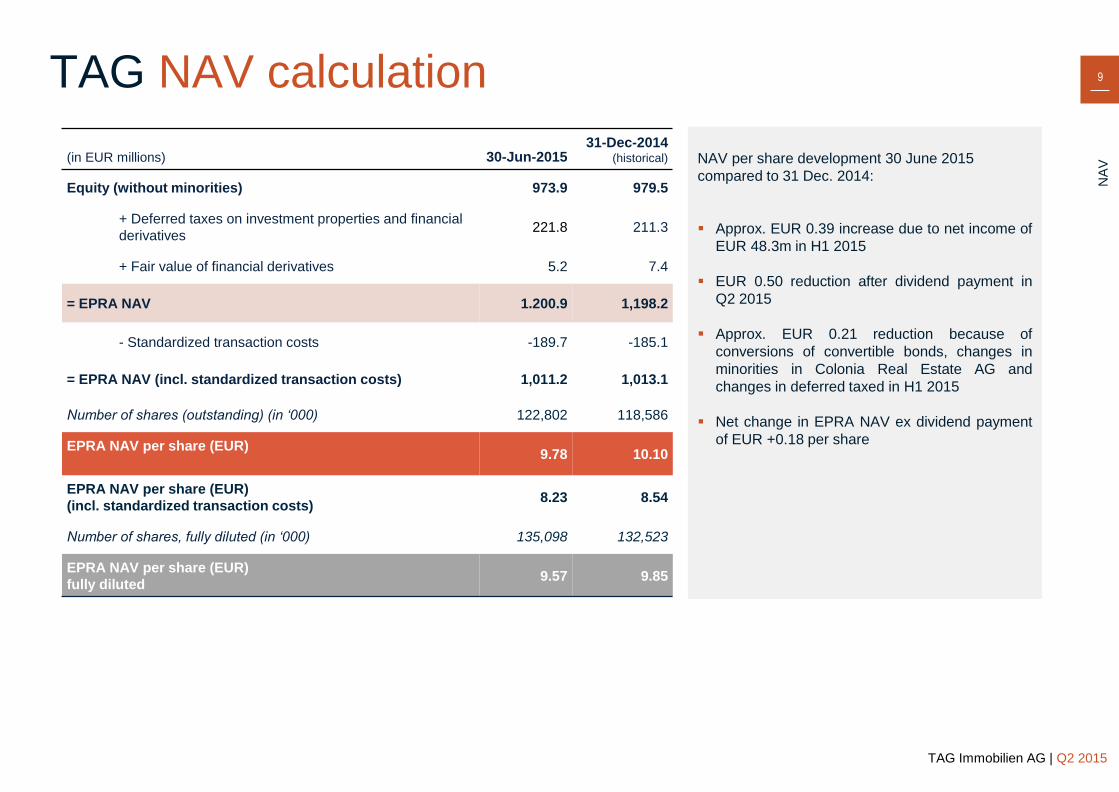
TAG NAV calculation
(in EUR millions) 30-Jun-2015 31-Dec-2014
(historical)
Equity (without minorities) 973.9 979.5
+ Deferred taxes on investment properties and financial
derivatives 221.8 211.3
+ Fair value of financial derivatives 5.2 7.4
= EPRA NAV 1.200.9 1,198.2
- Standardized transaction costs -189.7 -185.1
= EPRA NAV (incl. standardized transaction costs) 1,011.2 1,013.1
Number of shares (outstanding) (in ‘000) 122,802 118,586
EPRA NAV per share (EUR)
9.78 10.10
EPRA NAV per share (EUR)
(incl. standardized transaction costs) 8.23 8.54
Number of shares, fully diluted (in ‘000) 135,098 132,523
EPRA NAV per share (EUR)
fully diluted 9.57 9.85
NAV per share development 30 June 2015
compared to 31 Dec. 2014:
Approx. EUR 0.39 increase due to net income of
EUR 48.3m in H1 2015
EUR 0.50 reduction after dividend payment in
Q2 2015
Approx. EUR 0.21 reduction because of
conversions of convertible bonds, changes in
minorities in Colonia Real Estate AG and
changes in deferred taxed in H1 2015
Net change in EPRA NAV ex dividend payment
of EUR +0.18 per share
10 10
TAG Immobilien AG | Q2 2015
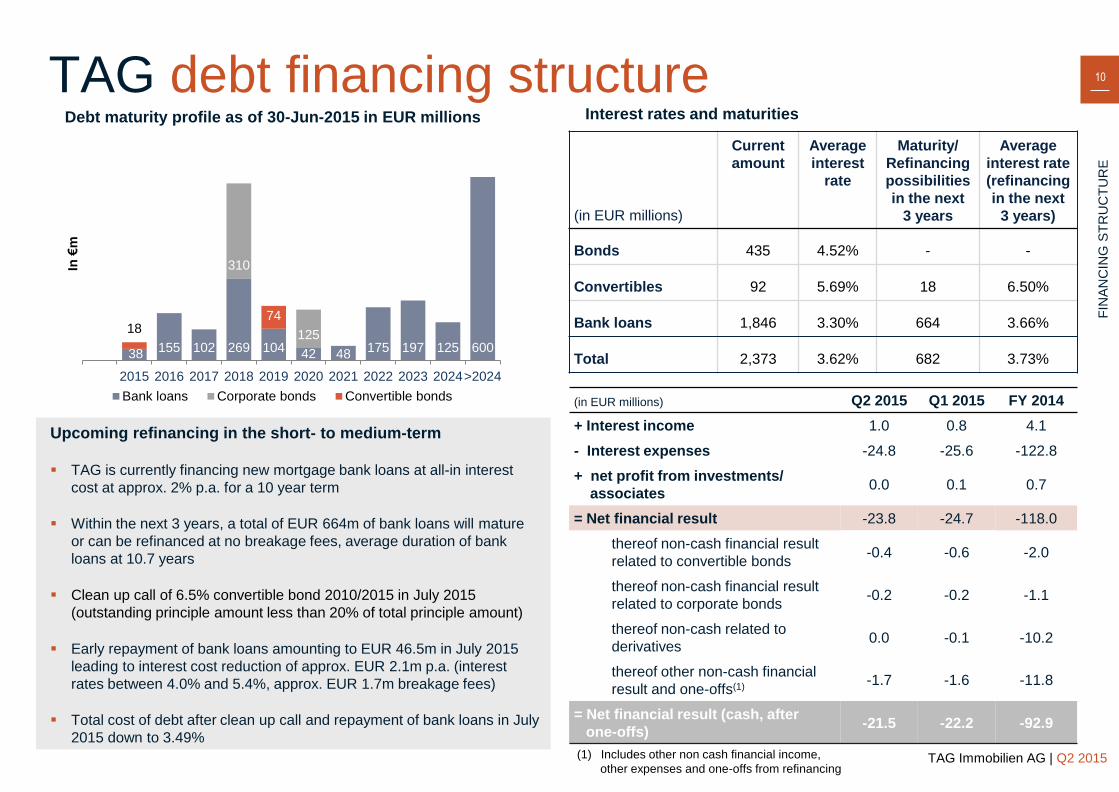
(in EUR millions)
Current
amount
Average
interest
rate
Maturity/
Refinancing
possibilities
in the next
3 years
Average
interest rate
(refinancing
in the next
3 years)
Bonds 435 4.52% - -
Convertibles 92 5.69% 18 6.50%
Bank loans 1,846 3.30% 664 3.66%
Total 2,373 3.62% 682 3.73%
(1) Includes other non cash financial income,
other expenses and one-offs from refinancing
Upcoming refinancing in the short- to medium-term
TAG is currently financing new mortgage bank loans at all-in interest
cost at approx. 2% p.a. for a 10 year term
Within the next 3 years, a total of EUR 664m of bank loans will mature
or can be refinanced at no breakage fees, average duration of bank
loans at 10.7 years
Clean up call of 6.5% convertible bond 2010/2015 in July 2015
(outstanding principle amount less than 20% of total principle amount)
Early repayment of bank loans amounting to EUR 46.5m in July 2015
leading to interest cost reduction of approx. EUR 2.1m p.a. (interest
rates between 4.0% and 5.4%, approx. EUR 1.7m breakage fees)
Total cost of debt after clean up call and repayment of bank loans in July
2015 down to 3.49%
Debt maturity profile as of 30-Jun-2015 in EUR millions
(in EUR millions) Q2 2015 Q1 2015 FY 2014
+ Interest income 1.0 0.8 4.1
- Interest expenses -24.8 -25.6 -122.8
+ net profit from investments/
associates 0.0 0.1 0.7
= Net financial result -23.8 -24.7 -118.0
thereof non-cash financial result
related to convertible bonds -0.4 -0.6 -2.0
thereof non-cash financial result
related to corporate bonds -0.2 -0.2 -1.1
thereof non-cash related to
derivatives 0.0 -0.1 -10.2
thereof other non-cash financial
result and one-offs(1) -1.7 -1.6 -11.8
= Net financial result (cash, after
one-offs) -21.5 -22.2 -92.9
Interest rates and maturities
TAG debt financing structure
FIN
AN
CIN
G S
TR
UC
TU
RE
38 155 102 269 104
42 48 175 197 125 600
310
125 18
74
2015 2016 2017 2018 2019 2020 2021 2022 2023 2024>2024
In €
m
Bank loans Corporate bonds Convertible bonds
TAG portfolio and platform
11
12 12
TAG Immobilien AG | Q2 2015
PO
RT
FO
LIO
/ P
LA
TF
OR
M
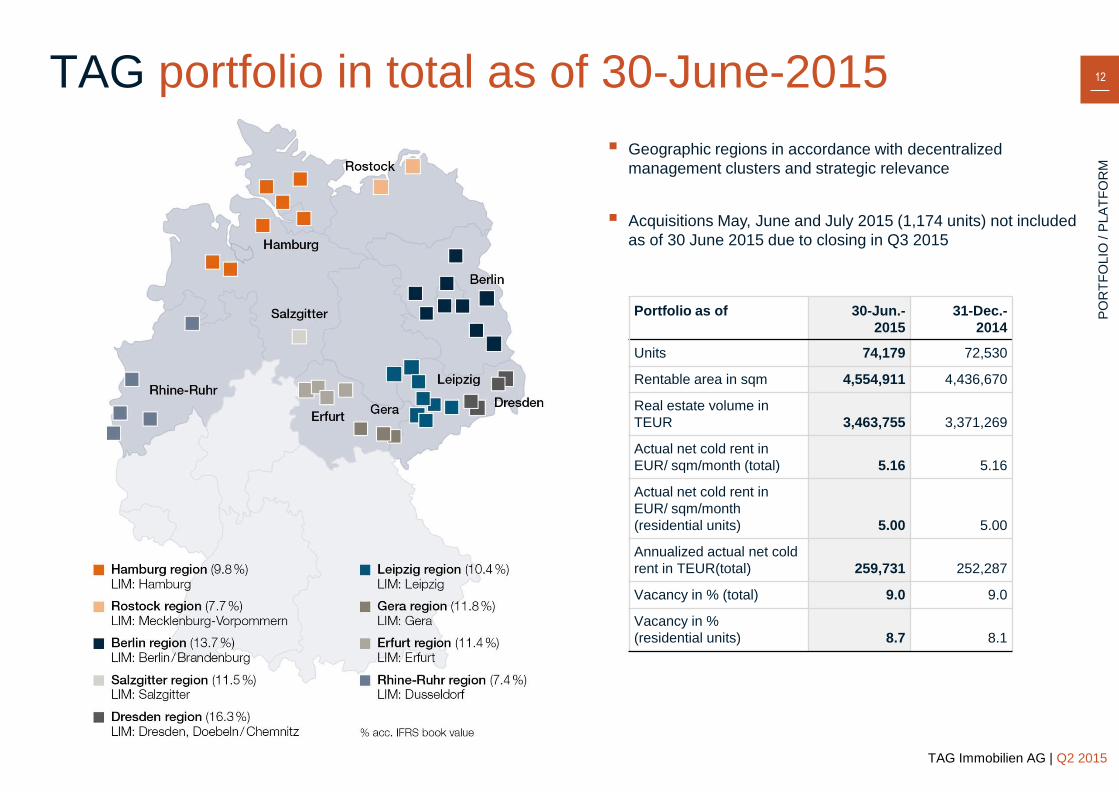
TAG portfolio in total as of 30-June-2015
Geographic regions in accordance with decentralized
management clusters and strategic relevance
Acquisitions May, June and July 2015 (1,174 units) not included
as of 30 June 2015 due to closing in Q3 2015
Portfolio as of 30-Jun.-
2015
31-Dec.-
2014
Units 74,179 72,530
Rentable area in sqm 4,554,911 4,436,670
Real estate volume in
TEUR 3,463,755 3,371,269
Actual net cold rent in
EUR/ sqm/month (total) 5.16 5.16
Actual net cold rent in
EUR/ sqm/month
(residential units) 5.00 5.00
Annualized actual net cold
rent in TEUR(total) 259,731 252,287
Vacancy in % (total) 9.0 9.0
Vacancy in %
(residential units) 8.7 8.1
13 13
TAG Immobilien AG | Q2 2015
Region Units
#
Rentable
area
in sqm
IFRS BV
TEUR
In-place
yield
%
Vacancy
Q2 2015
%
Vacancy
2014
%
Actual
net cold
rent
EUR/
sqm
Re-
letting
rent
EUR /
sqm
L-f-l rental
growth
y-o-y
%
L-f-l rental
growth
y-o-y incl.
vacancy
reduction
%
Mainte-
nance
EUR /
sqm
Capex
EUR /
sqm
Comments
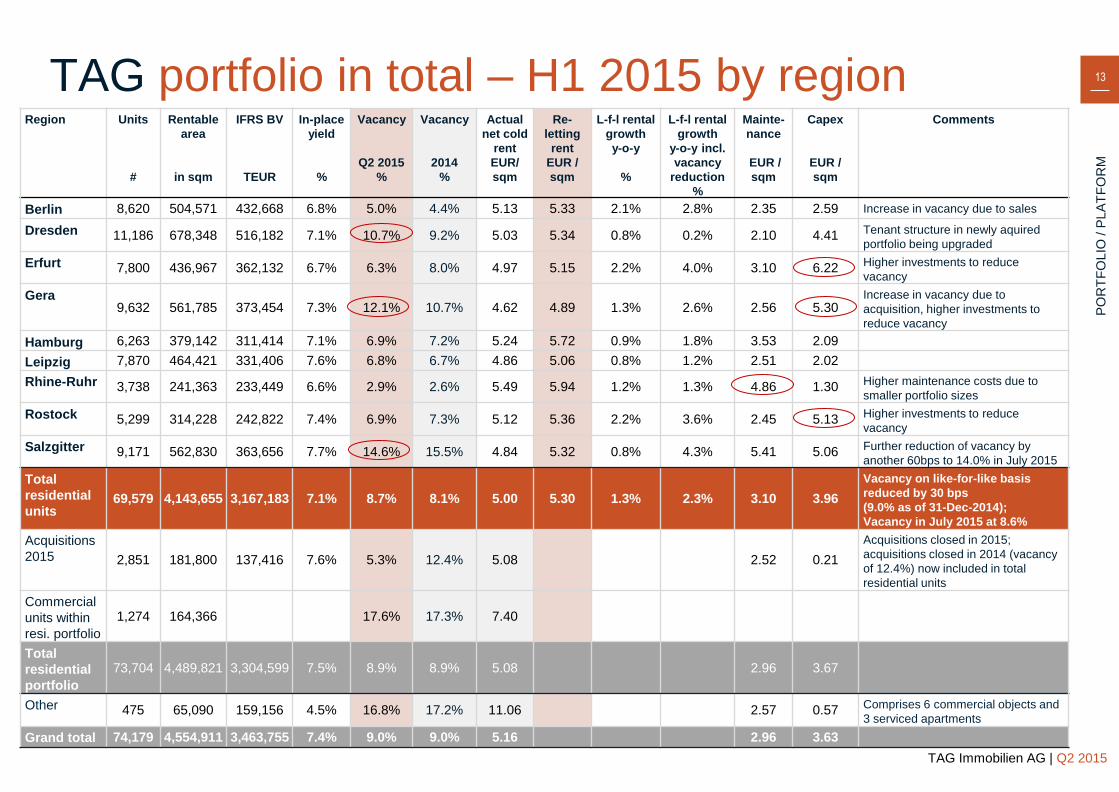
Berlin 8,620 504,571 432,668 6.8% 5.0% 4.4% 5.13 5.33 2.1% 2.8% 2.35 2.59 Increase in vacancy due to sales
Dresden 11,186 678,348 516,182 7.1% 10.7% 9.2% 5.03 5.34 0.8% 0.2% 2.10 4.41 Tenant structure in newly aquired
portfolio being upgraded
Erfurt 7,800 436,967 362,132 6.7% 6.3% 8.0% 4.97 5.15 2.2% 4.0% 3.10 6.22 Higher investments to reduce
vacancy
Gera 9,632 561,785 373,454 7.3% 12.1% 10.7% 4.62 4.89 1.3% 2.6% 2.56 5.30
Increase in vacancy due to
acquisition, higher investments to
reduce vacancy
Hamburg 6,263 379,142 311,414 7.1% 6.9% 7.2% 5.24 5.72 0.9% 1.8% 3.53 2.09
Leipzig 7,870 464,421 331,406 7.6% 6.8% 6.7% 4.86 5.06 0.8% 1.2% 2.51 2.02
Rhine-Ruhr 3,738 241,363 233,449 6.6% 2.9% 2.6% 5.49 5.94 1.2% 1.3% 4.86 1.30 Higher maintenance costs due to
smaller portfolio sizes
Rostock 5,299 314,228 242,822 7.4% 6.9% 7.3% 5.12 5.36 2.2% 3.6% 2.45 5.13 Higher investments to reduce
vacancy
Salzgitter 9,171 562,830 363,656 7.7% 14.6% 15.5% 4.84 5.32 0.8% 4.3% 5.41 5.06 Further reduction of vacancy by
another 60bps to 14.0% in July 2015
Total
residential
units 69,579 4,143,655 3,167,183 7.1% 8.7% 8.1% 5.00 5.30 1.3% 2.3% 3.10 3.96
Vacancy on like-for-like basis
reduced by 30 bps
(9.0% as of 31-Dec-2014);
Vacancy in July 2015 at 8.6%
Acquisitions
2015 2,851 181,800 137,416 7.6% 5.3% 12.4% 5.08 2.52 0.21
Acquisitions closed in 2015;
acquisitions closed in 2014 (vacancy
of 12.4%) now included in total
residential units
Commercial
units within
resi. portfolio
1,274 164,366 17.6% 17.3% 7.40
Total
residential
portfolio
73,704 4,489,821 3,304,599 7.5% 8.9% 8.9% 5.08 2.96 3.67
Other 475 65,090 159,156 4.5% 16.8% 17.2% 11.06 2.57 0.57 Comprises 6 commercial objects and
3 serviced apartments
Grand total 74,179 4,554,911 3,463,755 7.4% 9.0% 9.0% 5.16 2.96 3.63
TAG portfolio in total – H1 2015 by region
PO
RT
FO
LIO
/ P
LA
TF
OR
M
TAG acquisitions and disposals
14
15 15
TAG Immobilien AG | Q2 2015
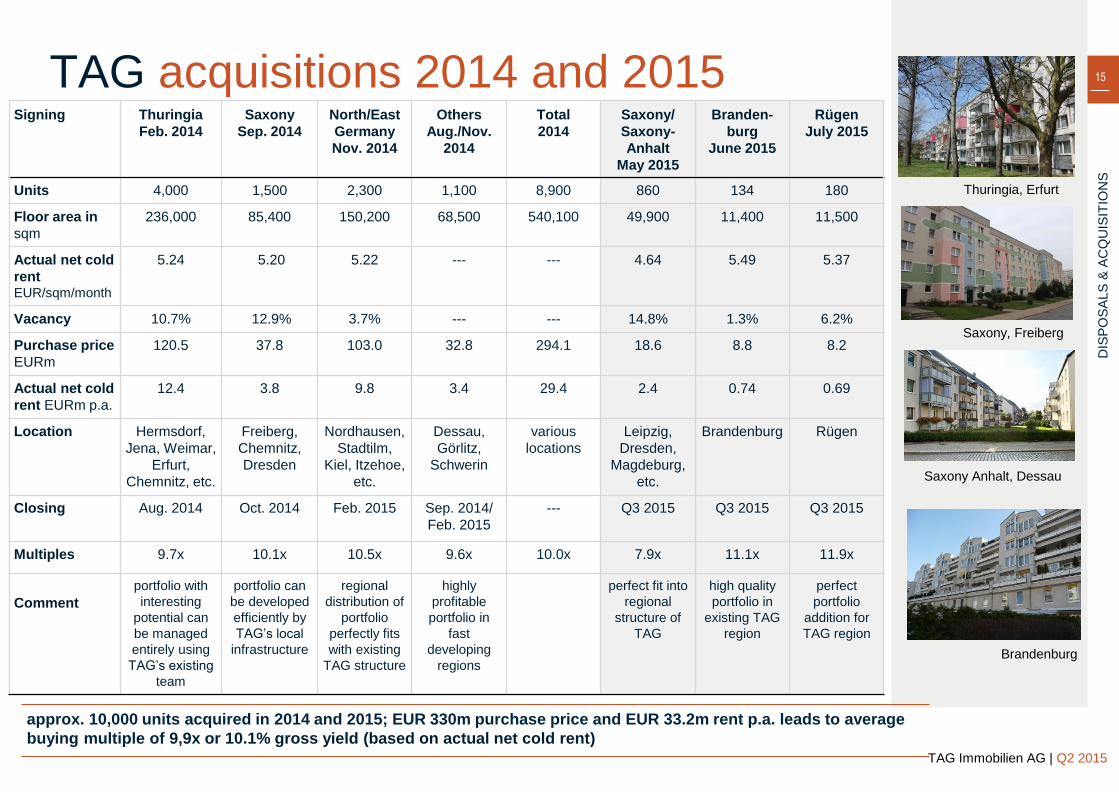
TAG acquisitions 2014 and 2015 Signing Thuringia
Feb. 2014
Saxony
Sep. 2014
North/East
Germany
Nov. 2014
Others
Aug./Nov.
2014
Total
2014
Saxony/
Saxony-
Anhalt
May 2015
Branden-
burg
June 2015
Rügen
July 2015
Units 4,000 1,500 2,300 1,100 8,900 860 134 180
Floor area in
sqm
236,000 85,400 150,200 68,500 540,100 49,900 11,400 11,500
Actual net cold
rent EUR/sqm/month
5.24 5.20 5.22 --- ---
4.64 5.49 5.37
Vacancy 10.7% 12.9% 3.7% --- --- 14.8% 1.3% 6.2%
Purchase price
EURm
120.5 37.8 103.0 32.8 294.1 18.6 8.8 8.2
Actual net cold
rent EURm p.a.
12.4 3.8 9.8 3.4 29.4 2.4 0.74 0.69
Location Hermsdorf,
Jena, Weimar,
Erfurt,
Chemnitz, etc.
Freiberg,
Chemnitz,
Dresden
Nordhausen,
Stadtilm,
Kiel, Itzehoe,
etc.
Dessau,
Görlitz,
Schwerin
various
locations
Leipzig,
Dresden,
Magdeburg,
etc.
Brandenburg Rügen
Closing Aug. 2014 Oct. 2014 Feb. 2015 Sep. 2014/
Feb. 2015
---
Q3 2015 Q3 2015 Q3 2015
Multiples 9.7x 10.1x 10.5x 9.6x 10.0x 7.9x 11.1x 11.9x
Comment
portfolio with
interesting
potential can
be managed
entirely using
TAG’s existing
team
portfolio can
be developed
efficiently by
TAG’s local
infrastructure
regional
distribution of
portfolio
perfectly fits
with existing
TAG structure
highly
profitable
portfolio in
fast
developing
regions
perfect fit into
regional
structure of
TAG
high quality
portfolio in
existing TAG
region
perfect
portfolio
addition for
TAG region
Thuringia, Erfurt
Saxony Anhalt, Dessau
Saxony, Freiberg
approx. 10,000 units acquired in 2014 and 2015; EUR 330m purchase price and EUR 33.2m rent p.a. leads to average
buying multiple of 9,9x or 10.1% gross yield (based on actual net cold rent)
DIS
PO
SA
LS
& A
CQ
UIS
ITIO
NS
Brandenburg
16 16
TAG Immobilien AG | Q2 2015
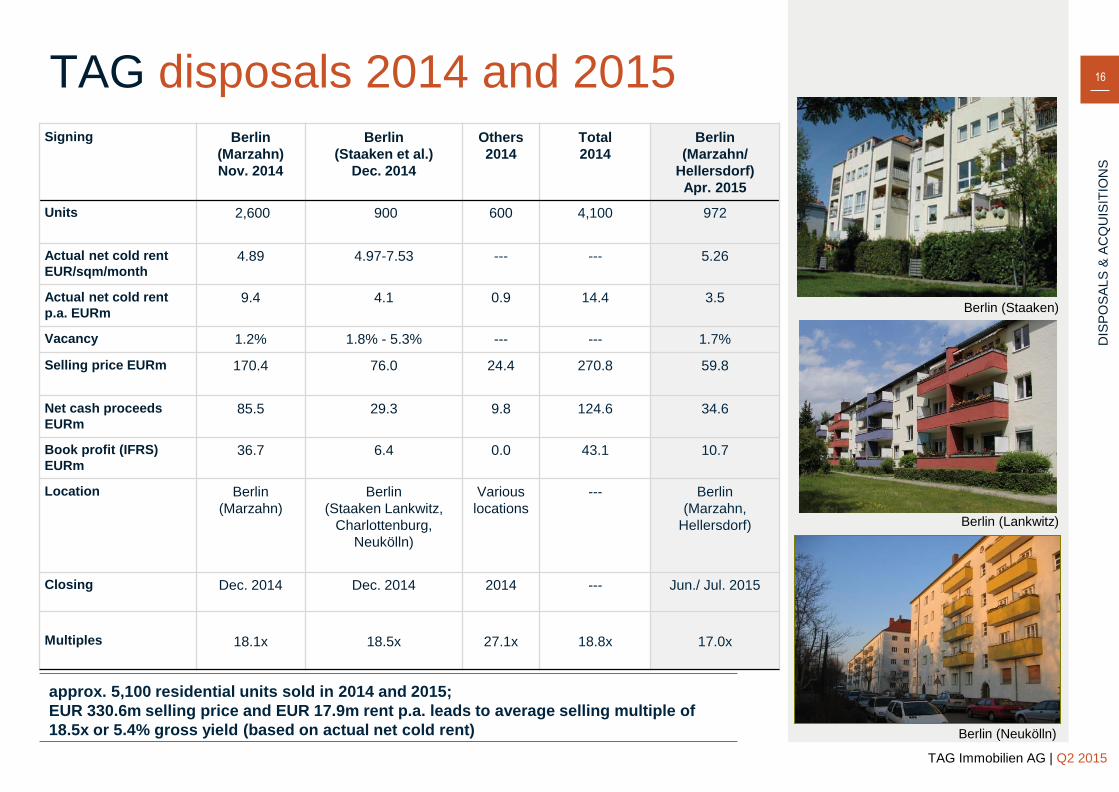
TAG disposals 2014 and 2015 Signing
Berlin
(Marzahn)
Nov. 2014
Berlin
(Staaken et al.)
Dec. 2014
Others
2014
Total
2014
Berlin
(Marzahn/
Hellersdorf)
Apr. 2015
Units 2,600
900 600 4,100 972
Actual net cold rent
EUR/sqm/month 4.89 4.97-7.53 --- --- 5.26
Actual net cold rent
p.a. EURm 9.4 4.1 0.9 14.4 3.5
Vacancy 1.2% 1.8% - 5.3% --- --- 1.7%
Selling price EURm 170.4 76.0
24.4 270.8 59.8
Net cash proceeds
EURm 85.5 29.3 9.8 124.6 34.6
Book profit (IFRS)
EURm 36.7 6.4 0.0 43.1 10.7
Location Berlin
(Marzahn)
Berlin
(Staaken Lankwitz,
Charlottenburg,
Neukölln)
Various
locations
--- Berlin
(Marzahn,
Hellersdorf)
Closing Dec. 2014 Dec. 2014 2014 --- Jun./ Jul. 2015
Multiples
18.1x
18.5x
27.1x
18.8x
17.0x
Berlin (Staaken)
Berlin (Neukölln)
Berlin (Lankwitz)
DIS
PO
SA
LS
& A
CQ
UIS
ITIO
NS
approx. 5,100 residential units sold in 2014 and 2015;
EUR 330.6m selling price and EUR 17.9m rent p.a. leads to average selling multiple of
18.5x or 5.4% gross yield (based on actual net cold rent)
17 17
TAG Immobilien AG | Q2 2015
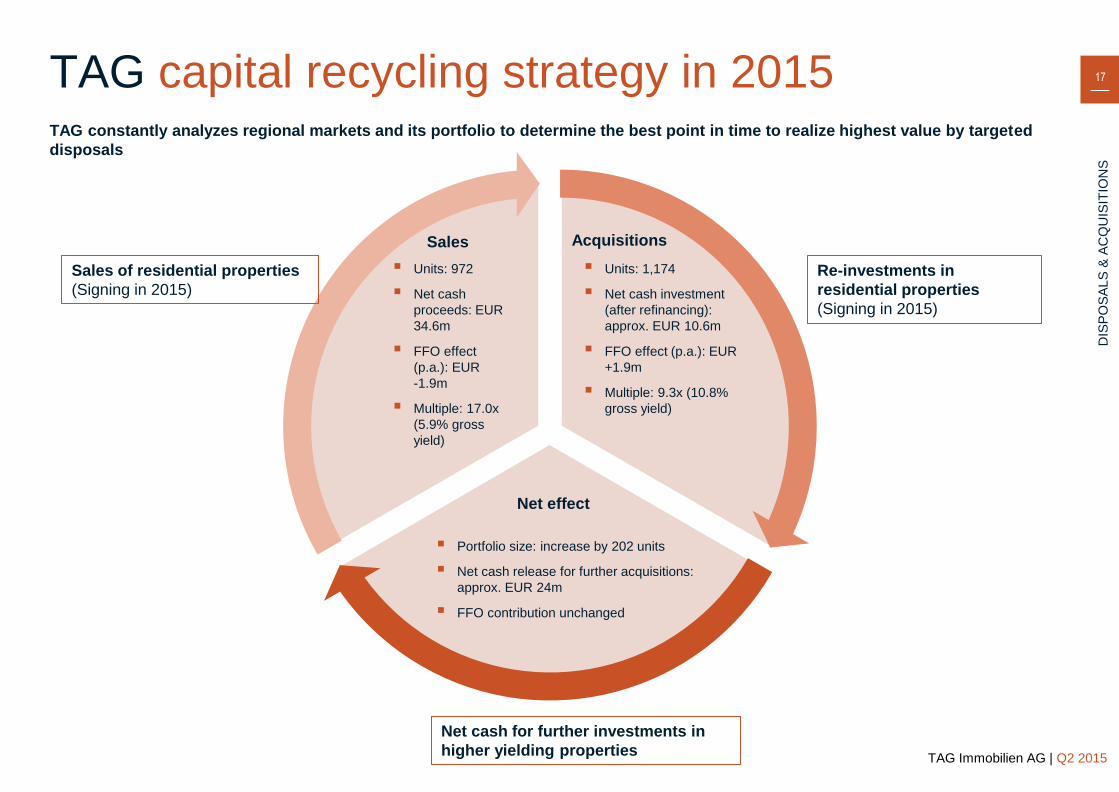
TAG capital recycling strategy in 2015 TAG constantly analyzes regional markets and its portfolio to determine the best point in time to realize highest value by targeted
disposals
Re-investments in
residential properties
(Signing in 2015)
Net effect
Sales of residential properties
(Signing in 2015)
Units: 972
Net cash
proceeds: EUR
34.6m
FFO effect
(p.a.): EUR
-1.9m
Multiple: 17.0x
(5.9% gross
yield)
Units: 1,174
Net cash investment
(after refinancing):
approx. EUR 10.6m
FFO effect (p.a.): EUR
+1.9m
Multiple: 9.3x (10.8%
gross yield)
Portfolio size: increase by 202 units
Net cash release for further acquisitions:
approx. EUR 24m
FFO contribution unchanged
Net cash for further investments in
higher yielding properties
Sales Acquisitions
DIS
PO
SA
LS
& A
CQ
UIS
ITIO
NS
TAG outlook
18
19 19
TAG Immobilien AG | Q2 2015
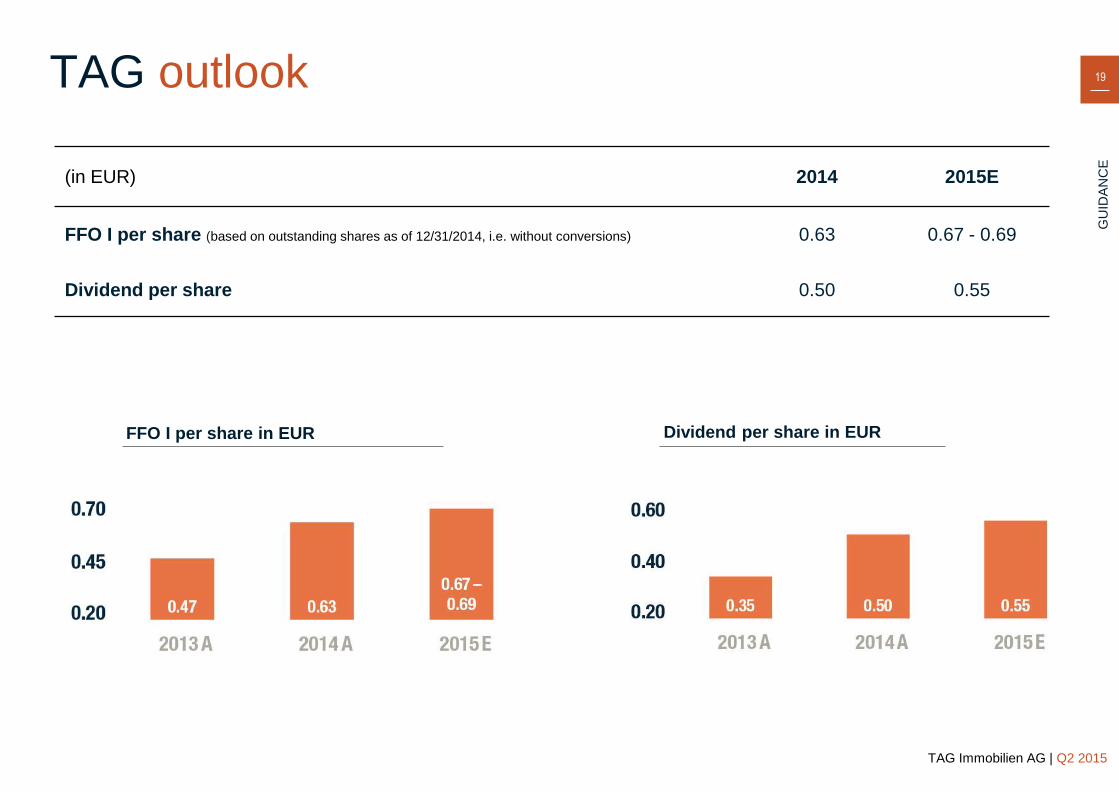
(in EUR) 2014 2015E
FFO I per share (based on outstanding shares as of 12/31/2014, i.e. without conversions) 0.63 0.67 - 0.69
Dividend per share 0.50 0.55
TAG outlook
GU
IDA
NC
E
FFO I per share in EUR Dividend per share in EUR
APPENDIX
20
21 21 21
AP
PE
ND
IX
TAG Immobilien AG | Q2 2015
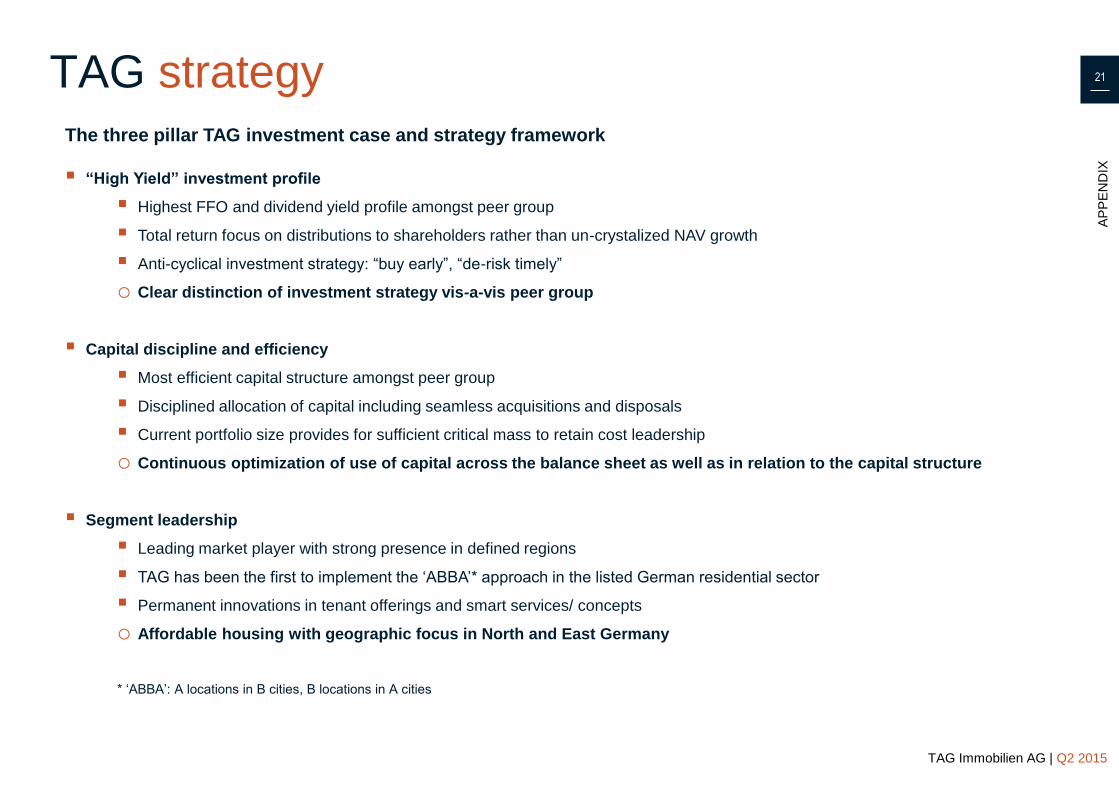
The three pillar TAG investment case and strategy framework
“High Yield” investment profile
Highest FFO and dividend yield profile amongst peer group
Total return focus on distributions to shareholders rather than un-crystalized NAV growth
Anti-cyclical investment strategy: “buy early”, “de-risk timely”
o Clear distinction of investment strategy vis-a-vis peer group
Capital discipline and efficiency
Most efficient capital structure amongst peer group
Disciplined allocation of capital including seamless acquisitions and disposals
Current portfolio size provides for sufficient critical mass to retain cost leadership
o Continuous optimization of use of capital across the balance sheet as well as in relation to the capital structure
Segment leadership
Leading market player with strong presence in defined regions
TAG has been the first to implement the ‘ABBA’* approach in the listed German residential sector
Permanent innovations in tenant offerings and smart services/ concepts
o Affordable housing with geographic focus in North and East Germany
* ‘ABBA’: A locations in B cities, B locations in A cities
TAG strategy
22 22
AP
PE
ND
IX
TAG Immobilien AG | Q2 2015
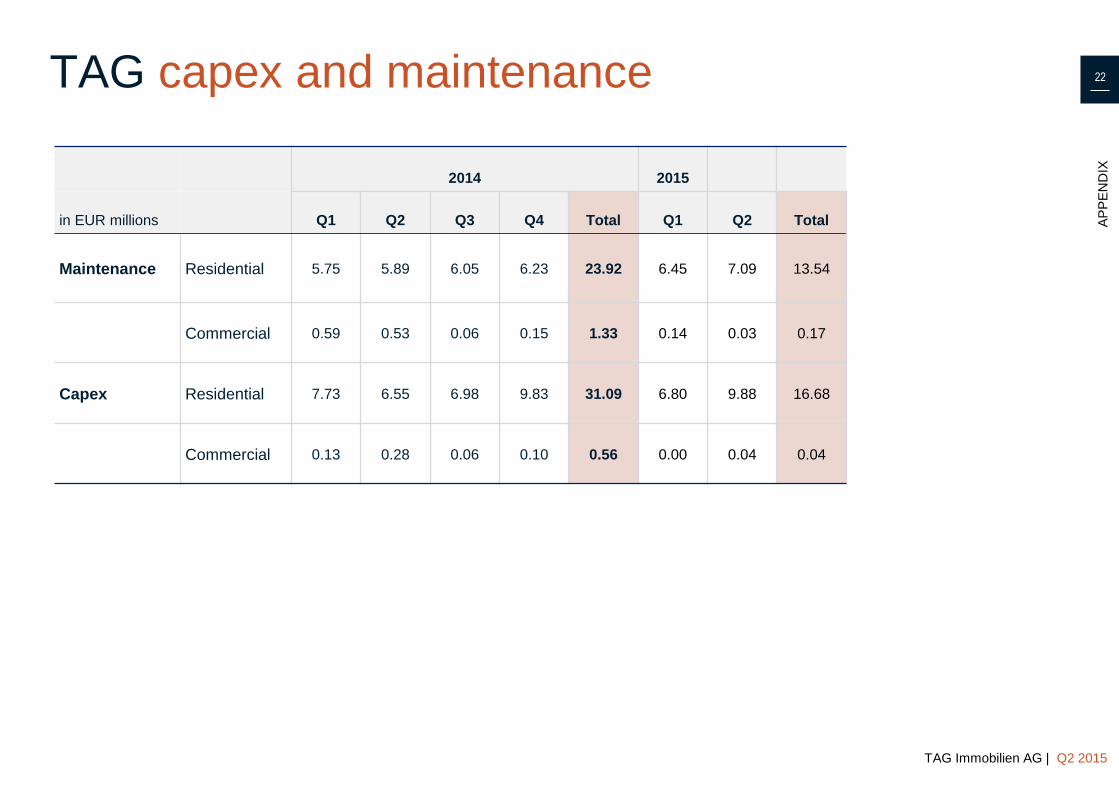
TAG capex and maintenance
2014 2015
in EUR millions Q1 Q2 Q3 Q4 Total Q1 Q2 Total
Maintenance Residential 5.75 5.89 6.05 6.23 23.92 6.45 7.09 13.54
Commercial 0.59 0.53 0.06 0.15 1.33 0.14 0.03 0.17
Capex Residential 7.73 6.55 6.98 9.83 31.09 6.80 9.88 16.68
Commercial 0.13 0.28 0.06 0.10 0.56 0.00 0.04 0.04
23 23 23
AP
PE
ND
IX
TAG Immobilien AG | Q2 2015
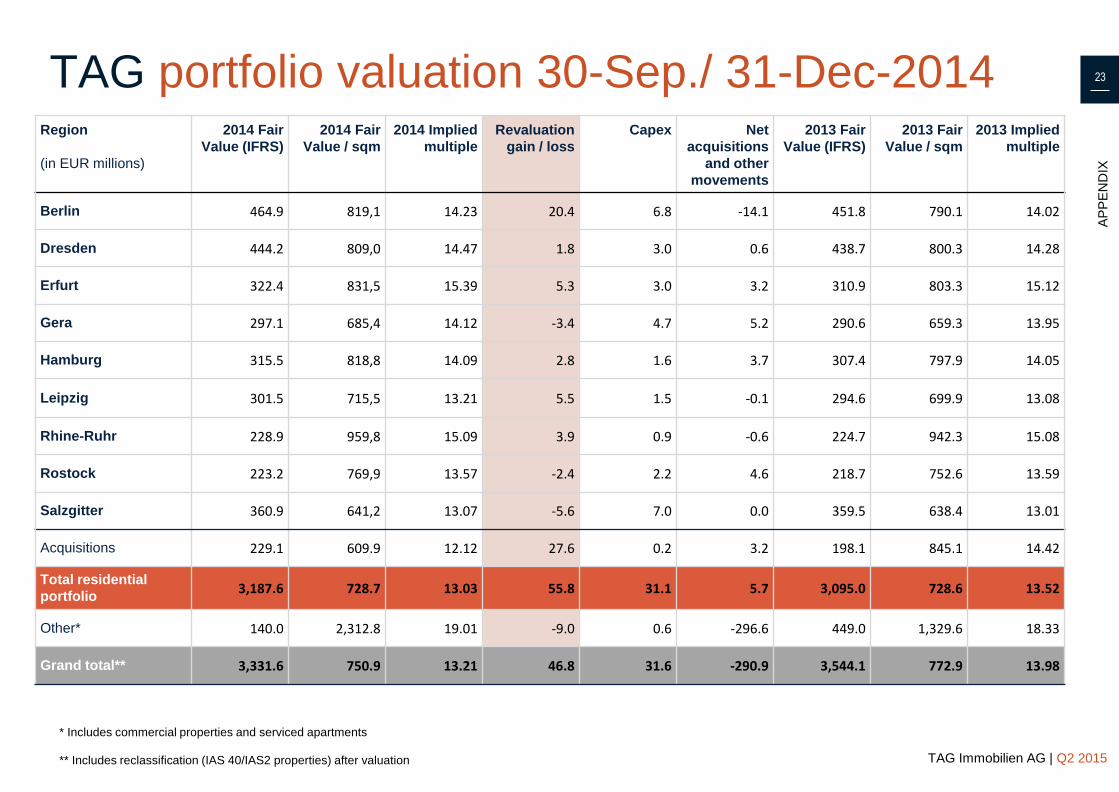
Region
(in EUR millions)
2014 Fair
Value (IFRS)
2014 Fair
Value / sqm
2014 Implied
multiple
Revaluation
gain / loss
Capex Net
acquisitions
and other
movements
2013 Fair
Value (IFRS)
2013 Fair
Value / sqm
2013 Implied
multiple
Berlin 464.9 819,1 14.23 20.4 6.8 -14.1 451.8 790.1 14.02
Dresden 444.2 809,0 14.47 1.8 3.0 0.6 438.7 800.3 14.28
Erfurt 322.4 831,5 15.39 5.3 3.0 3.2 310.9 803.3 15.12
Gera 297.1 685,4 14.12 -3.4 4.7 5.2 290.6 659.3 13.95
Hamburg 315.5 818,8 14.09 2.8 1.6 3.7 307.4 797.9 14.05
Leipzig 301.5 715,5 13.21 5.5 1.5 -0.1 294.6 699.9 13.08
Rhine-Ruhr 228.9 959,8 15.09 3.9 0.9 -0.6 224.7 942.3 15.08
Rostock 223.2 769,9 13.57 -2.4 2.2 4.6 218.7 752.6 13.59
Salzgitter 360.9 641,2 13.07 -5.6 7.0 0.0 359.5 638.4 13.01
Acquisitions 229.1 609.9 12.12 27.6 0.2 3.2 198.1 845.1 14.42
Total residential
portfolio 3,187.6 728.7 13.03 55.8 31.1 5.7 3,095.0 728.6 13.52
Other* 140.0 2,312.8 19.01 -9.0 0.6 -296.6 449.0 1,329.6 18.33
Grand total** 3,331.6 750.9 13.21 46.8 31.6 -290.9 3,544.1 772.9 13.98
TAG portfolio valuation 30-Sep./ 31-Dec-2014
* Includes commercial properties and serviced apartments
** Includes reclassification (IAS 40/IAS2 properties) after valuation
24 24
AP
PE
ND
IX
TAG Immobilien AG | Q2 2015
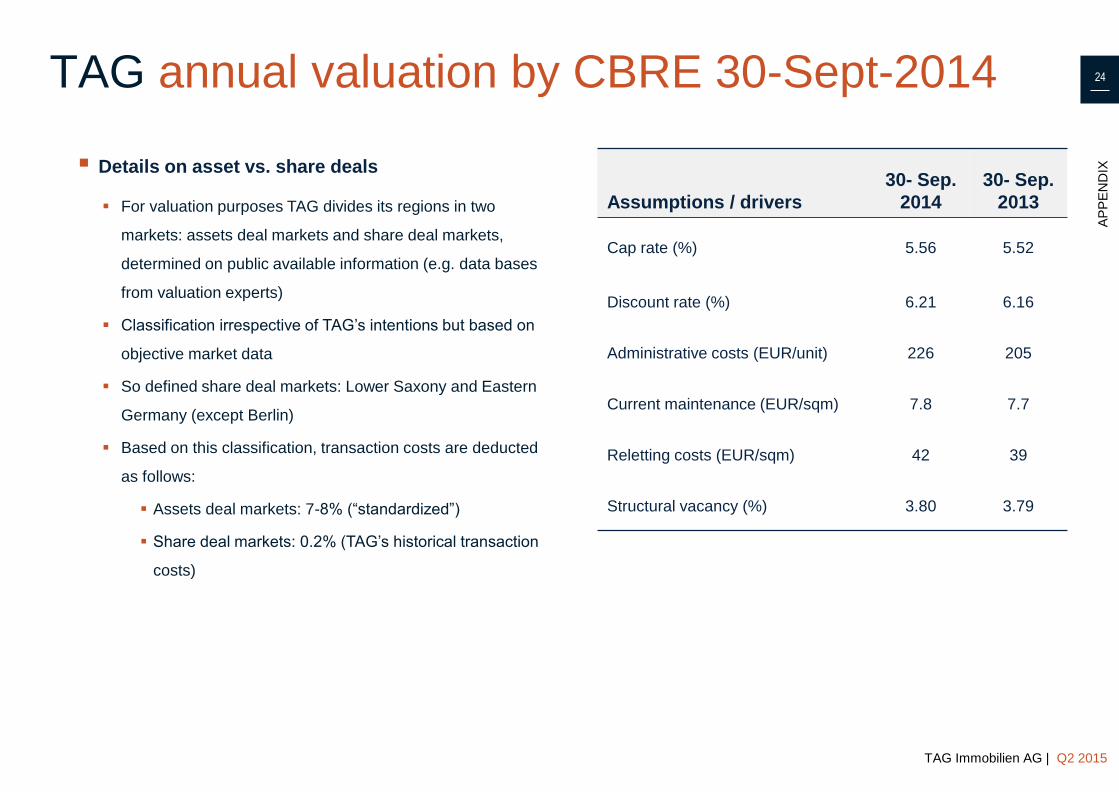
TAG annual valuation by CBRE 30-Sept-2014
Assumptions / drivers
30- Sep.
2014
30- Sep.
2013
Cap rate (%) 5.56 5.52
Discount rate (%) 6.21 6.16
Administrative costs (EUR/unit) 226 205
Current maintenance (EUR/sqm) 7.8 7.7
Reletting costs (EUR/sqm) 42 39
Structural vacancy (%) 3.80 3.79
Details on asset vs. share deals
For valuation purposes TAG divides its regions in two
markets: assets deal markets and share deal markets,
determined on public available information (e.g. data bases
from valuation experts)
Classification irrespective of TAG’s intentions but based on
objective market data
So defined share deal markets: Lower Saxony and Eastern
Germany (except Berlin)
Based on this classification, transaction costs are deducted
as follows:
Assets deal markets: 7-8% (“standardized”)
Share deal markets: 0.2% (TAG’s historical transaction
costs)
25 25 25
AP
PE
ND
IX
TAG Immobilien AG | Q2 2015
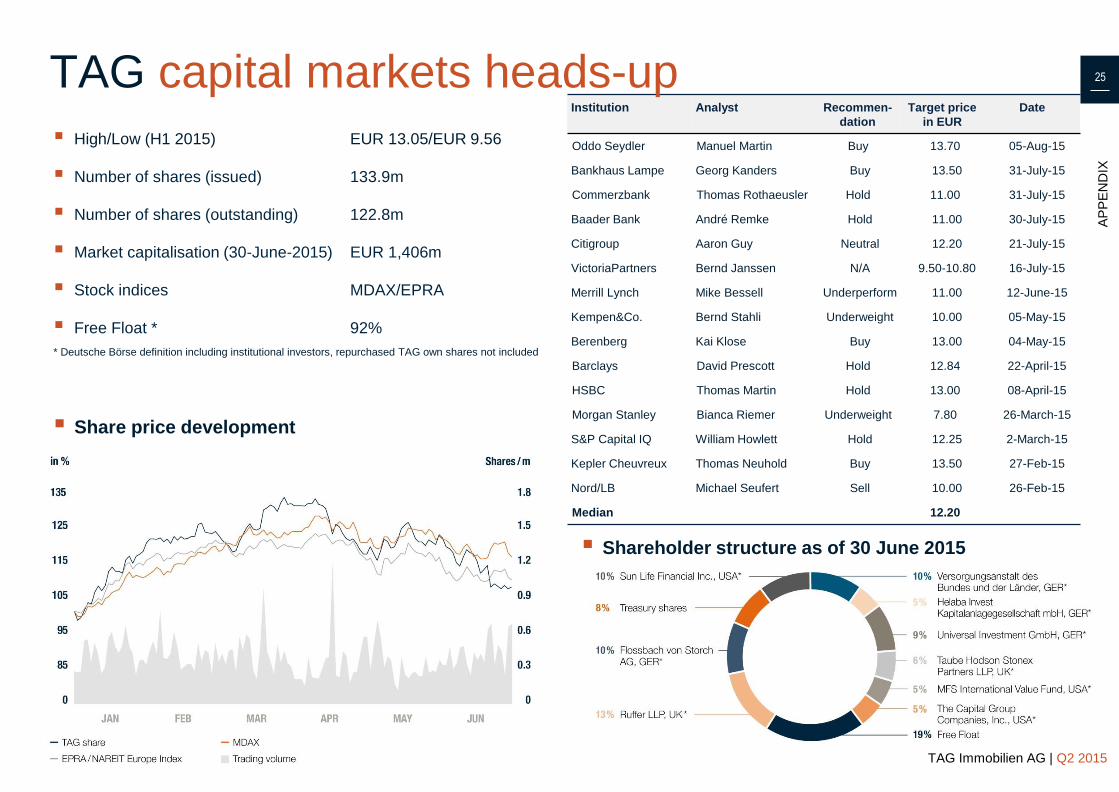
Institution Analyst Recommen-
dation
Target price
in EUR
Date
Oddo Seydler Manuel Martin Buy 13.70 05-Aug-15
Bankhaus Lampe Georg Kanders Buy 13.50 31-July-15
Commerzbank Thomas Rothaeusler Hold 11.00 31-July-15
Baader Bank André Remke Hold 11.00 30-July-15
Citigroup Aaron Guy Neutral 12.20 21-July-15
VictoriaPartners Bernd Janssen N/A 9.50-10.80 16-July-15
Merrill Lynch Mike Bessell Underperform 11.00 12-June-15
Kempen&Co. Bernd Stahli Underweight 10.00 05-May-15
Berenberg Kai Klose Buy 13.00 04-May-15
Barclays David Prescott Hold 12.84 22-April-15
HSBC Thomas Martin Hold 13.00 08-April-15
Morgan Stanley Bianca Riemer Underweight 7.80 26-March-15
S&P Capital IQ William Howlett Hold 12.25 2-March-15
Kepler Cheuvreux Thomas Neuhold Buy 13.50 27-Feb-15
Nord/LB Michael Seufert Sell 10.00 26-Feb-15
Median 12.20
TAG capital markets heads-up
High/Low (H1 2015) EUR 13.05/EUR 9.56
Number of shares (issued) 133.9m
Number of shares (outstanding) 122.8m
Market capitalisation (30-June-2015) EUR 1,406m
Stock indices MDAX/EPRA
Free Float * 92%
* Deutsche Börse definition including institutional investors, repurchased TAG own shares not included
Share price development
Shareholder structure as of 30 June 2015
26 26
AP
PE
ND
IX
TAG Immobilien AG | Q2 2015
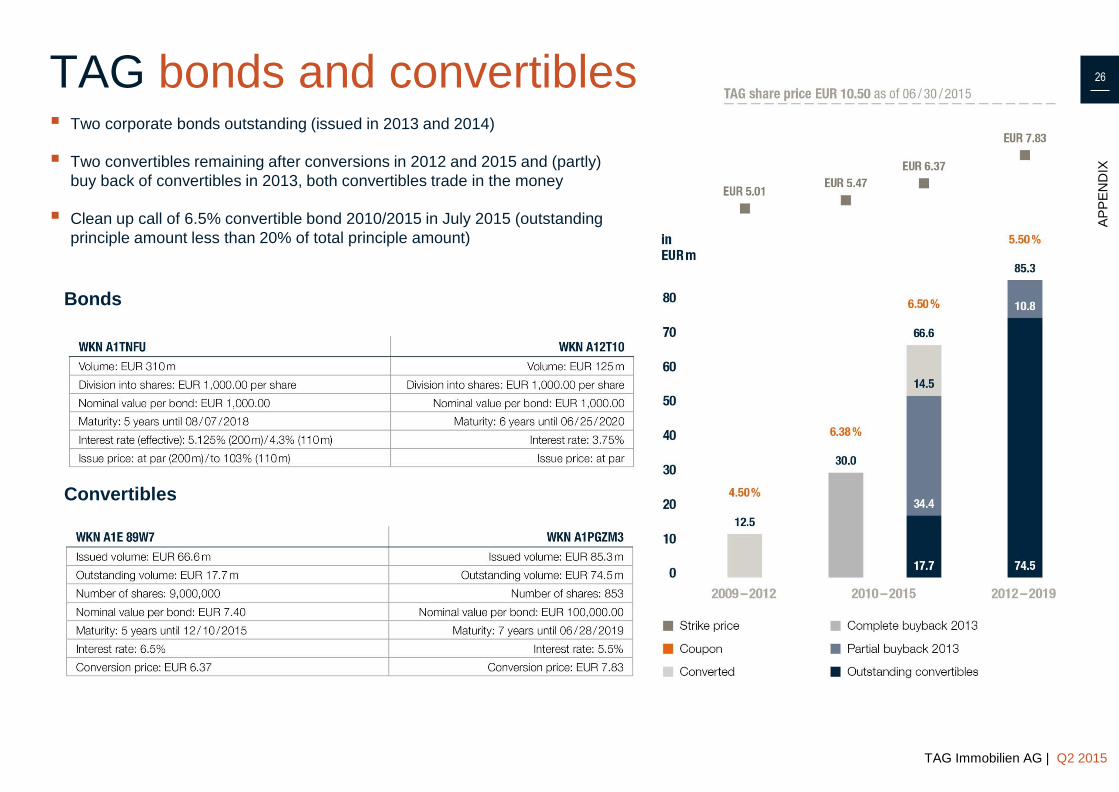
TAG bonds and convertibles Two corporate bonds outstanding (issued in 2013 and 2014)
Two convertibles remaining after conversions in 2012 and 2015 and (partly)
buy back of convertibles in 2013, both convertibles trade in the money
Clean up call of 6.5% convertible bond 2010/2015 in July 2015 (outstanding
principle amount less than 20% of total principle amount)
Convertibles
Bonds
27 27 27
AP
PE
ND
IX
TAG Immobilien AG | Q2 2015
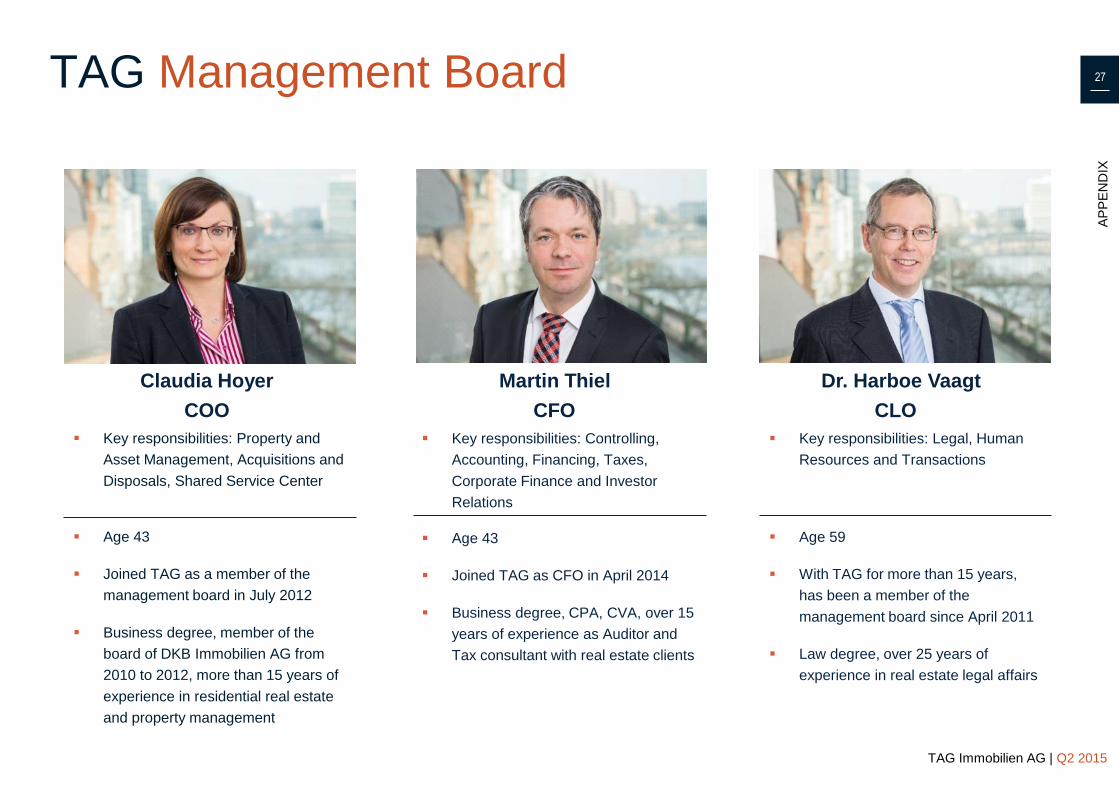
TAG Management Board
COO CFO CLO
Key responsibilities: Property and
Asset Management, Acquisitions and
Disposals, Shared Service Center
Age 43
Joined TAG as a member of the
management board in July 2012
Business degree, member of the
board of DKB Immobilien AG from
2010 to 2012, more than 15 years of
experience in residential real estate
and property management
Key responsibilities: Controlling,
Accounting, Financing, Taxes,
Corporate Finance and Investor
Relations
Age 43
Joined TAG as CFO in April 2014
Business degree, CPA, CVA, over 15
years of experience as Auditor and
Tax consultant with real estate clients
Key responsibilities: Legal, Human
Resources and Transactions
Age 59
With TAG for more than 15 years,
has been a member of the
management board since April 2011
Law degree, over 25 years of
experience in real estate legal affairs
Claudia Hoyer Martin Thiel Dr. Harboe Vaagt
28 28 28
AP
PE
ND
IX
TAG Immobilien AG | Q2 2015
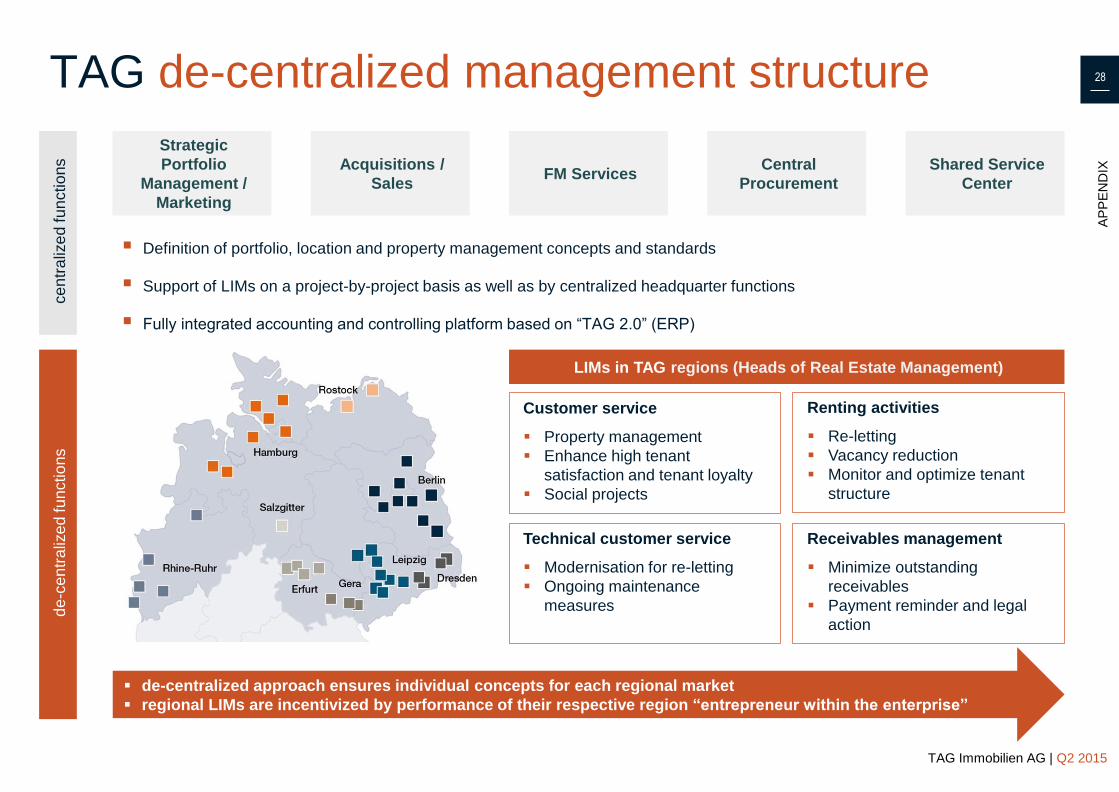
Definition of portfolio, location and property management concepts and standards
Support of LIMs on a project-by-project basis as well as by centralized headquarter functions
Fully integrated accounting and controlling platform based on “TAG 2.0” (ERP)
TAG de-centralized management structure ce
ntr
aliz
ed
fu
nctio
ns
de
-ce
ntr
aliz
ed fu
nctio
ns
Strategic
Portfolio
Management /
Marketing
Acquisitions /
Sales FM Services
Central
Procurement
Shared Service
Center
Renting activities
Re-letting
Vacancy reduction
Monitor and optimize tenant
structure
Technical customer service
Modernisation for re-letting
Ongoing maintenance
measures
Receivables management
Minimize outstanding
receivables
Payment reminder and legal
action
Customer service
Property management
Enhance high tenant
satisfaction and tenant loyalty
Social projects
de-centralized approach ensures individual concepts for each regional market
regional LIMs are incentivized by performance of their respective region “entrepreneur within the enterprise”
LIMs in TAG regions (Heads of Real Estate Management)
29 29
TAG Immobilien AG | Q2 2015
TAG Contacts
TAG Immobilien AG
Steckelhörn 5
20457 Hamburg
Fon: +49 40 380 32-0
Fax: +49 40 380 32-388
www.tag-ag.com
Martin Thiel
CFO
Fon: +49 40 380 32-222
Fax: +49 40 380 32-388
Dominique Mann
Head of Investor & Public Relations
Fon: +49 40 380 32-305
Fax: +49 40 380 32-388