Embed Size (px)
Citation preview
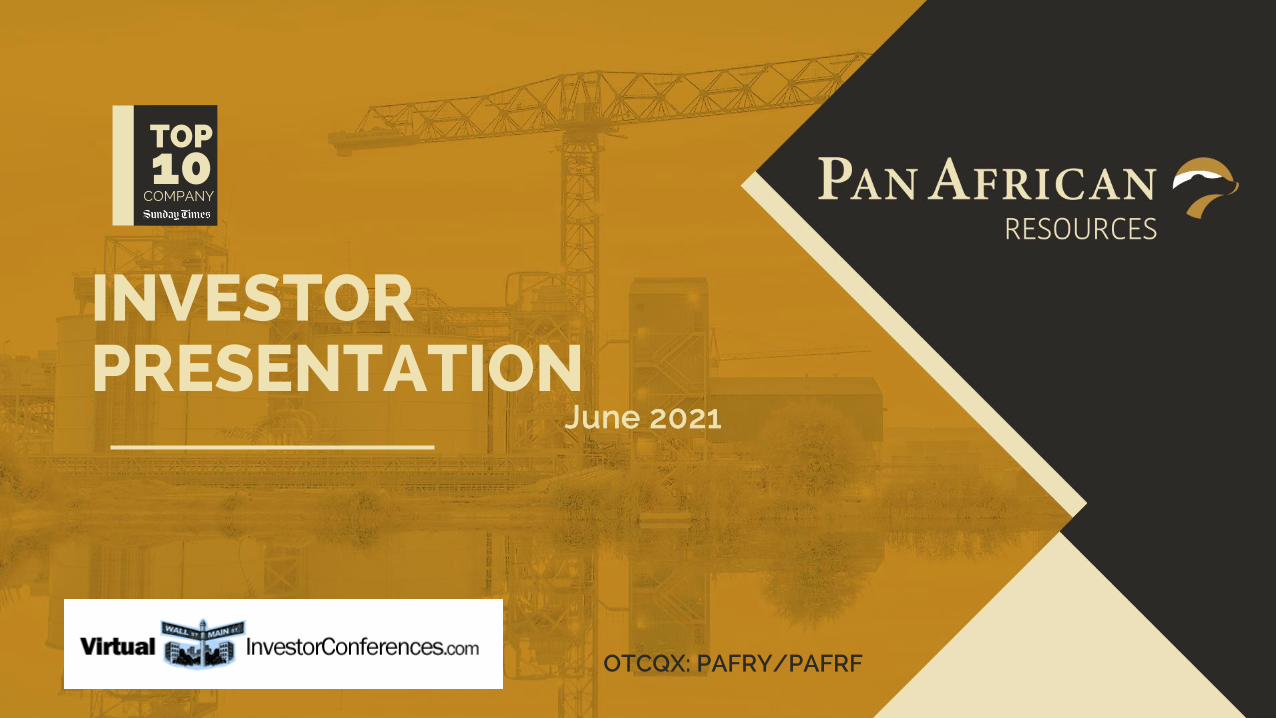
TOP10COMPANY
INVESTOR PRESENTATION
June 2021
OTCQX: PAFRY/PAFRF
2
DISCLAIMER
The name 'Presenter' refers to Pan African Resources PLC and its advisors, subsidiaries or affiliated companies.
This presentation has not been filed, lodged, registered or approved in any jurisdiction and recipients of this document should keep themselves informed of and comply with and observe allapplicable legal and regulatory requirements.
Statements or assumptions in this presentation as to future matters may prove to be incorrect. The Presenter makes no representation or warranty as to the accuracy of such statements orassumptions. Circumstances may change and the contents of this presentation may become outdated as a result, and the Presenter has no obligation to update the presentation or correct anyinaccuracies or omissions in this presentation.
This presentation may not be reproduced in whole or in part, nor may any of its contents be divulged to any third party without the prior consent in writing of the Presenter.
The recipient acknowledges that neither it nor the Presenter intends that the Presenter act or be responsible as a fiduciary to the recipient, its management, stockholders, creditors or any otherperson. Each of the recipient and the Presenter, by accepting and providing this presentation respectively, expressly disclaims any fiduciary relationship and agrees that the recipient isresponsible for making its own independent judgments with respect to any transaction and any other matters regarding this presentation.
Furthermore, the information contained in this presentation may also qualify as “inside information” as defined in the Financial Markets Act (Act No. 19 of 2012) (‘FMA’). In terms of the FMA it is acriminal offence for a person who knows that he or she has inside information to:
• deal directly or indirectly or through an agent for his or her own account, or for the account of another person, in listed securities to which the inside information relates;
• disclose the inside information to another other than in the proper course of a person’s employment, profession or duties; and
• encourage or cause another person to deal or discourage or stop another person from dealing in the listed securities to which the inside information relates.
The Presenter shall not have any liability for any loss suffered due to reliance being placed on this presentation the information contained herein or the oral presentations referred to. Thispresentation is for informational purposes only and is not intended to provide legal, tax, financial, investment or other advice. You must make your own examination of the tax, legal, financial andother consequences of this proposal and you should not treat the contents of this presentation as advice in relation to any such matters. If you are in any doubt as to what action you should take,you are recommended to seek your own advice from your stockbroker, bank manager, solicitor, accountant, fund manager or other appropriate independent financial adviser duly authorisedunder the Financial Services and Markets Act 2000 and who is qualified and experienced to advise on such matters if you are in the UK, or from another appropriately authorised independentfinancial adviser if you are in a territory outside the UK.
Furthermore, the information contained in this presentation may also qualify as “inside information” as defined in the Market Abuse Regulation (“MAR”). It is a breach of MAR where a personpossesses inside information and:
• uses that information by acquiring or disposing of, for its own account or for the account of a third party, directly or indirectly, financial instruments to which that information relates; or
• discloses that information to any other person, except where the disclosure is made in the normal exercise of an employment, a profession or duties.
This presentation is for information purposes only and does not constitute an offer or invitation to subscribe for or purchase any securities, and neither this presentation nor anything containedtherein nor the fact of its distribution shall form the basis or be relied on in connection with or act as any inducement to enter into any contract or commitment whatsoever.
Some or all of the information contained in these slides and this presentation (and any other information which may be provided) may be inside information relating to the securities of thePresenter within the meaning of the Criminal Justice Act 1993 and the Market Abuse Regulation (EU/596/2014) (“MAR”). Recipients of this information shall not disclose any of this information toanother person or use this information or any other information to deal, or to recommend or induce another person to deal in the securities of the Presenter (or attempt to do so). Recipients of thisinformation shall ensure that they comply or any person to whom they disclose any of this information complies with this paragraph and also with MAR. The term “deal” is to be construed inaccordance with the Criminal Justice Act 1993 and with MAR. Recipients of these slides and the presentation should not therefore deal in any way in ordinary shares in the capital of the Presenter(“Ordinary Shares”) until the date of a formal announcement by the Presenter in connection with the preliminary results of the Presenter for the six months ended 31 December 2020. Dealing inOrdinary Shares in advance of this date may result in civil and/or criminal liability.
3
FORWARD LOOKING STATEMENTS
Statements in this presentation that address exploration activities, mining potential and future plans and objectives of Pan African Resources are forward-looking statements and forward-lookinginformation that involve various risks, assumptions and uncertainties and are not statements of fact.
The directors and management of Pan African Resources believe that the expectations expressed in such forward-looking statements or forward-looking information are based on reasonableassumptions, expectations, estimates and projections. However, these statements should not be construed as being guarantees or warranties (whether expressed or implied) of futureperformance.
There can be no assurance that such statements will prove to be accurate and actual values, results and future events could differ materially from those anticipated in these statements.Important factors that could cause actual results to differ materially from statements expressed in this presentation include among others, the actual results of exploration activities, technicalanalysis, the lack of availability to Pan African Resources of necessary capital on acceptable terms, general economic, business and financial market conditions, political risks, industry trends,competition, changes in government regulations, delays in obtaining governmental approvals, interest rate fluctuations, currency fluctuations, changes in business strategy or development plansand other risks.
Although Pan African Resources has attempted to identify important factors that could cause actual results to differ materially, there may be other factors that cause results not to be asanticipated, estimated or intended. Pan African Resources is not obliged to publicly update any forward-looking statements included in this presentation, or revise any changes in events,conditions or circumstances on which any such statements are based, occurring after the publication date of this presentation, other than as required by regulation.
4
OVERVIEW OF PRESENTATION
Overview of our operations
Highlights
Operational performance by asset
H1 FY2021 financials
Evander 8 Shaft 24 Level project
Mintails transaction
Evander Solar PV plant
FY2021 – Delivery on track
Appendix
OVERVIEW OF OUR OPERATIONS
6
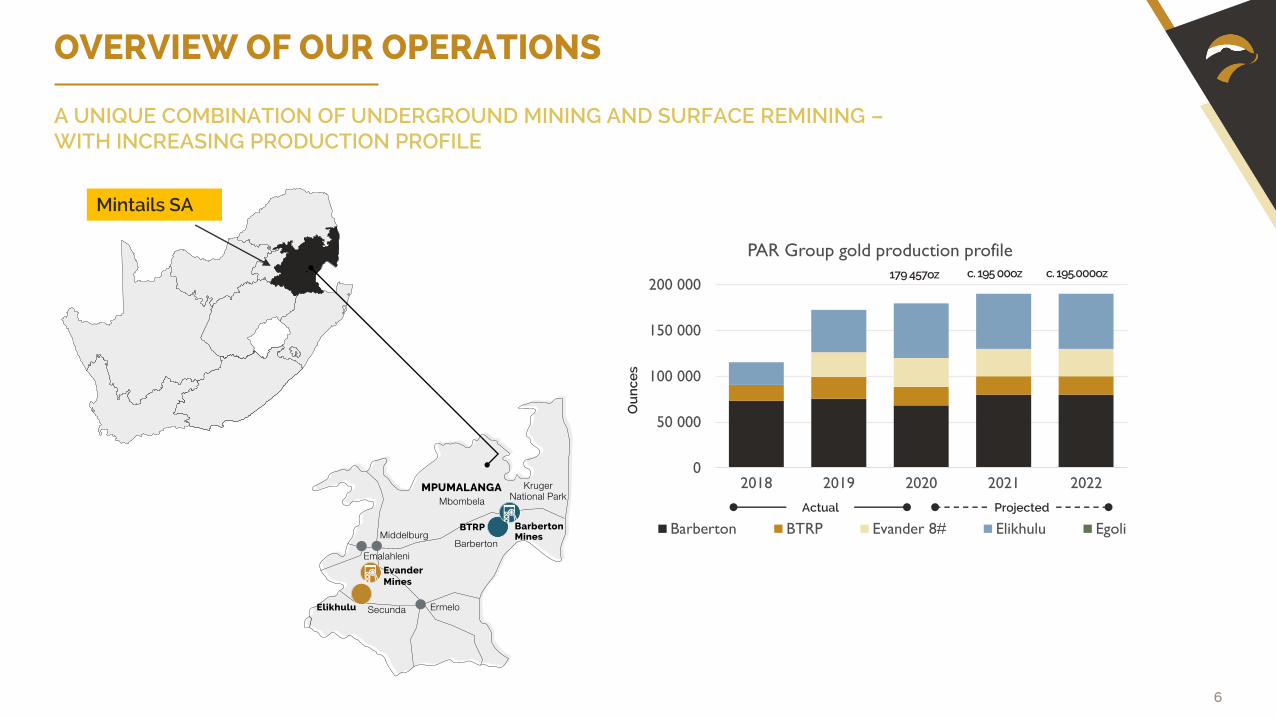
OVERVIEW OF OUR OPERATIONS
A UNIQUE COMBINATION OF UNDERGROUND MINING AND SURFACE REMINING –WITH INCREASING PRODUCTION PROFILE
0
50 000
100 000
150 000
200 000
2018 2019 2020 2021 2022
PAR Group gold production profile
Barberton BTRP Evander 8# Elikhulu Egoli
Actual Projected
179 457oz c. 195 00oz
Ou
nce
s
c. 195.000oz
Mintails SA
7
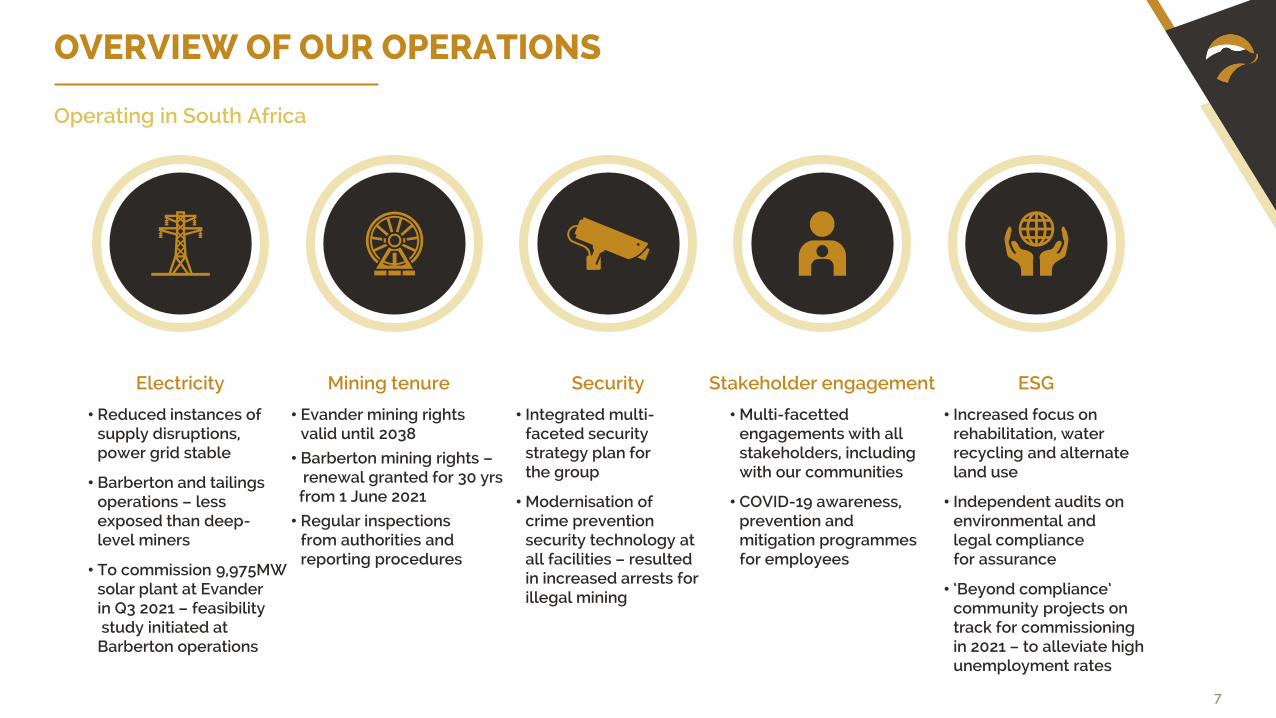
OVERVIEW OF OUR OPERATIONS
Operating in South Africa
Electricity
• Reduced instances of supply disruptions, power grid stable
• Barberton and tailings operations – less exposed than deep-level miners
• To commission 9,975MW solar plant at Evander in Q3 2021 – feasibilitystudy initiated at
Barberton operations
Mining tenure
• Evander mining rights valid until 2038
• Barberton mining rights –renewal granted for 30 yrs
from 1 June 2021
• Regular inspections from authorities and reporting procedures
Security
• Integrated multi-faceted security strategy plan for the group
• Modernisation of crime prevention security technology at all facilities – resulted in increased arrests for illegal mining
Stakeholder engagement
• Multi-facetted engagements with all stakeholders, including with our communities
• COVID-19 awareness, prevention and mitigation programmes for employees
ESG
• Increased focus on rehabilitation, water recycling and alternate land use
• Independent audits on environmental and legal compliance for assurance
• ‘Beyond compliance’ community projects on track for commissioning in 2021 – to alleviate high unemployment rates
8
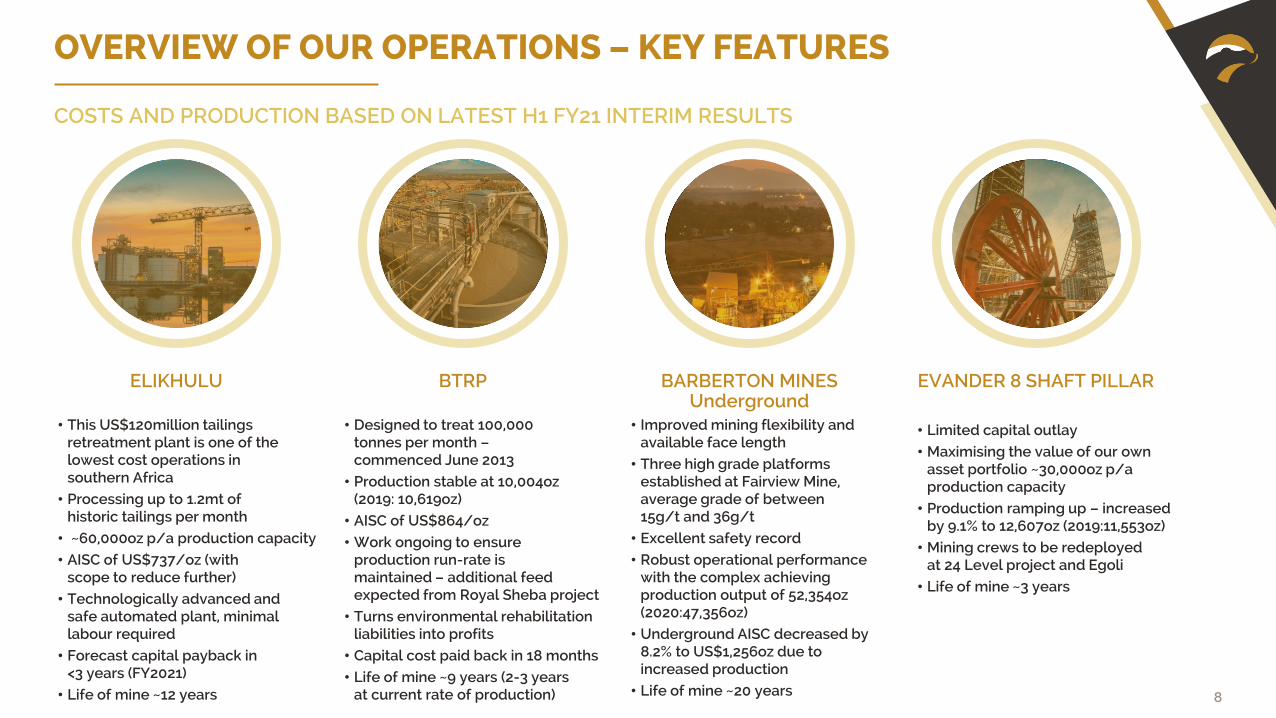
OVERVIEW OF OUR OPERATIONS – KEY FEATURES
COSTS AND PRODUCTION BASED ON LATEST H1 FY21 INTERIM RESULTS
ELIKHULU
• This US$120million tailings retreatment plant is one of the lowest cost operations in southern Africa
• Processing up to 1.2mt of historic tailings per month
• ~60,000oz p/a production capacity• AISC of US$737/oz (with
scope to reduce further)
• Technologically advanced and safe automated plant, minimal labour required
• Forecast capital payback in <3 years (FY2021)
• Life of mine ~12 years
BTRP
• Designed to treat 100,000 tonnes per month –commenced June 2013
• Production stable at 10,004oz (2019: 10,619oz)
• AISC of US$864/oz• Work ongoing to ensure
production run-rate is maintained – additional feed expected from Royal Sheba project
• Turns environmental rehabilitation liabilities into profits
• Capital cost paid back in 18 months• Life of mine ~9 years (2-3 years
at current rate of production)
BARBERTON MINESUnderground
• Improved mining flexibility and available face length
• Three high grade platforms established at Fairview Mine, average grade of between 15g/t and 36g/t
• Excellent safety record• Robust operational performance
with the complex achieving production output of 52,354oz (2020:47,356oz)
• Underground AISC decreased by 8.2% to US$1,256oz due to increased production
• Life of mine ~20 years
EVANDER 8 SHAFT PILLAR
• Limited capital outlay• Maximising the value of our own
asset portfolio ~30,000oz p/a production capacity
• Production ramping up – increased by 9.1% to 12,607oz (2019:11,553oz)
• Mining crews to be redeployed at 24 Level project and Egoli
• Life of mine ~3 years
HIGHLIGHTS
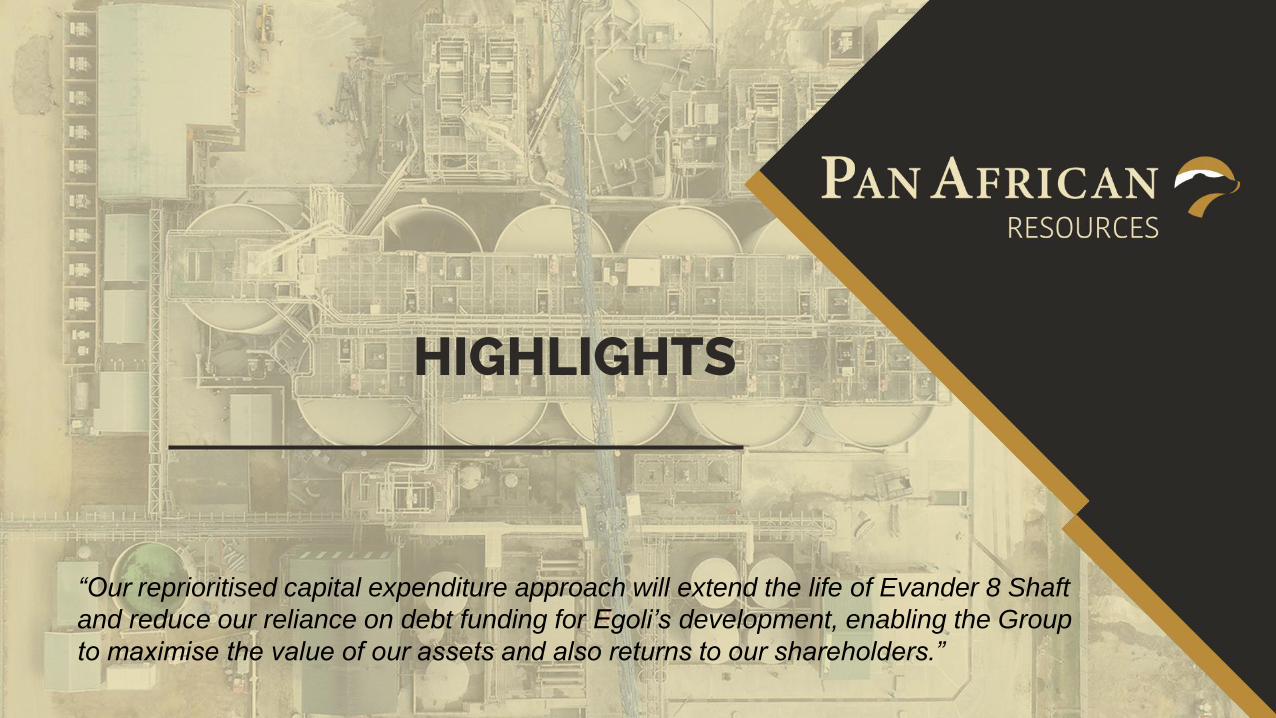
“Our reprioritised capital expenditure approach will extend the life of Evander 8 Shaft
and reduce our reliance on debt funding for Egoli’s development, enabling the Group
to maximise the value of our assets and also returns to our shareholders.”
10
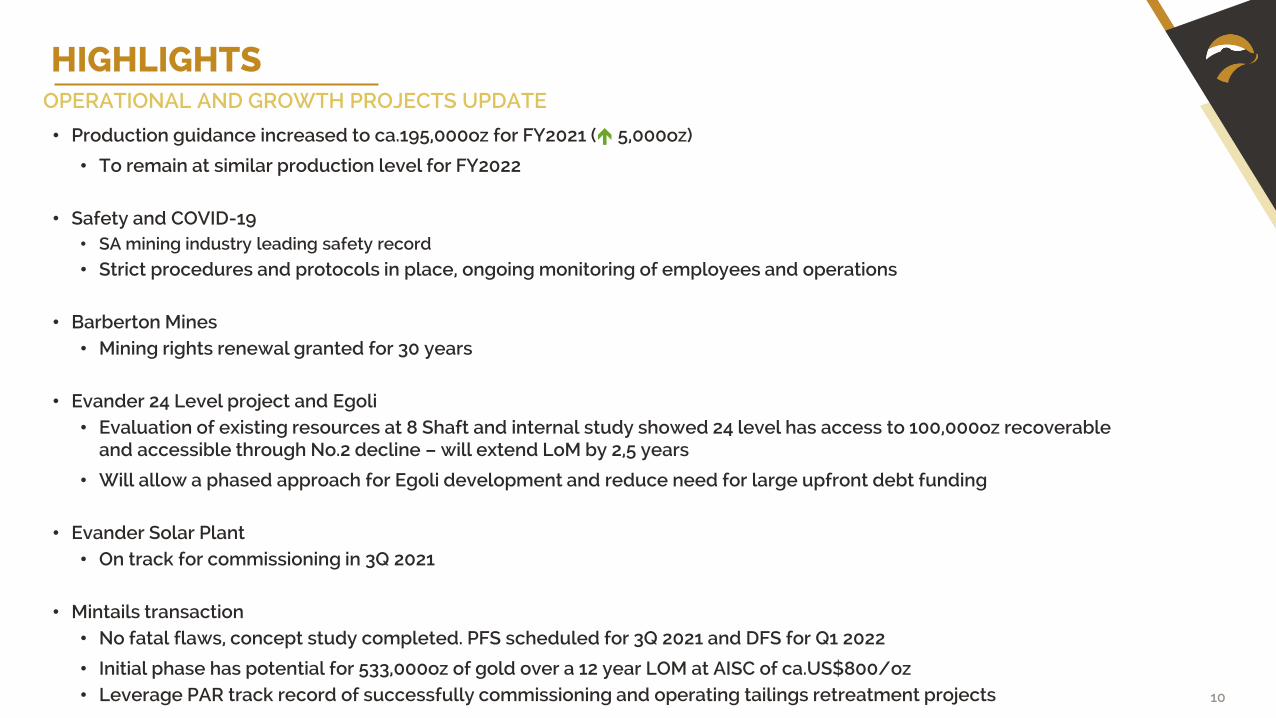
HIGHLIGHTS OPERATIONAL AND GROWTH PROJECTS UPDATE
• Production guidance increased to ca.195,000oz for FY2021 ( 5,000oz)
• To remain at similar production level for FY2022
• Safety and COVID-19 • SA mining industry leading safety record
• Strict procedures and protocols in place, ongoing monitoring of employees and operations
• Barberton Mines• Mining rights renewal granted for 30 years
• Evander 24 Level project and Egoli• Evaluation of existing resources at 8 Shaft and internal study showed 24 level has access to 100,000oz recoverable
and accessible through No.2 decline – will extend LoM by 2,5 years
• Will allow a phased approach for Egoli development and reduce need for large upfront debt funding
• Evander Solar Plant• On track for commissioning in 3Q 2021
• Mintails transaction • No fatal flaws, concept study completed. PFS scheduled for 3Q 2021 and DFS for Q1 2022
• Initial phase has potential for 533,000oz of gold over a 12 year LOM at AISC of ca.US$800/oz• Leverage PAR track record of successfully commissioning and operating tailings retreatment projects
OPERATIONAL PERFORMANCE BY ASSET
12
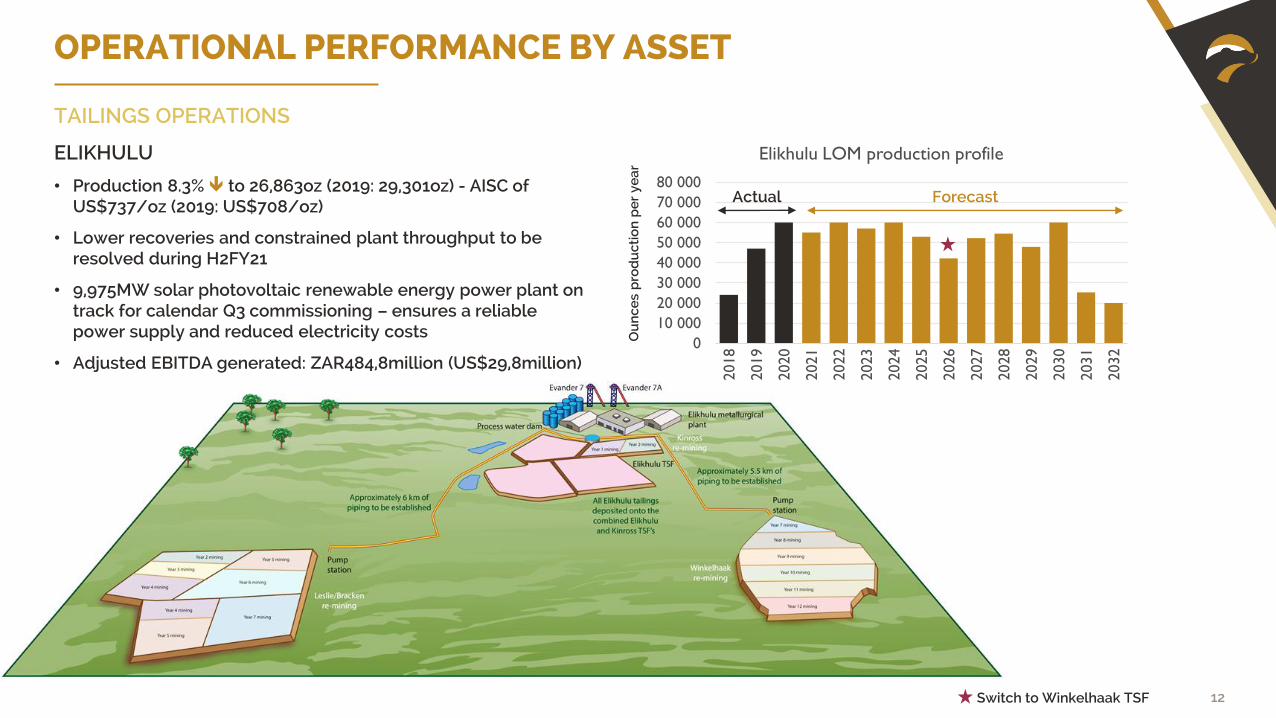
OPERATIONAL PERFORMANCE BY ASSET
TAILINGS OPERATIONS
ELIKHULU
• Production 8.3% to 26,863oz (2019: 29,301oz) - AISC of US$737/oz (2019: US$708/oz)
• Lower recoveries and constrained plant throughput to be resolved during H2FY21
• 9,975MW solar photovoltaic renewable energy power plant on track for calendar Q3 commissioning – ensures a reliable power supply and reduced electricity costs
• Adjusted EBITDA generated: ZAR484,8million (US$29,8million)0
10 000
20 000
30 000
40 000
50 000
60 000
70 000
80 000
2018
2019
2020
2021
2022
2023
2024
2025
2026
2027
2028
2029
2030
2031
2032
Elikhulu LOM production profile
Ou
nce
s p
rod
uct
ion
pe
r ye
ar
Switch to Winkelhaak TSF
Actual Forecast
13
OPERATIONAL PERFORMANCE BY ASSET
TAILINGS OPERATIONS
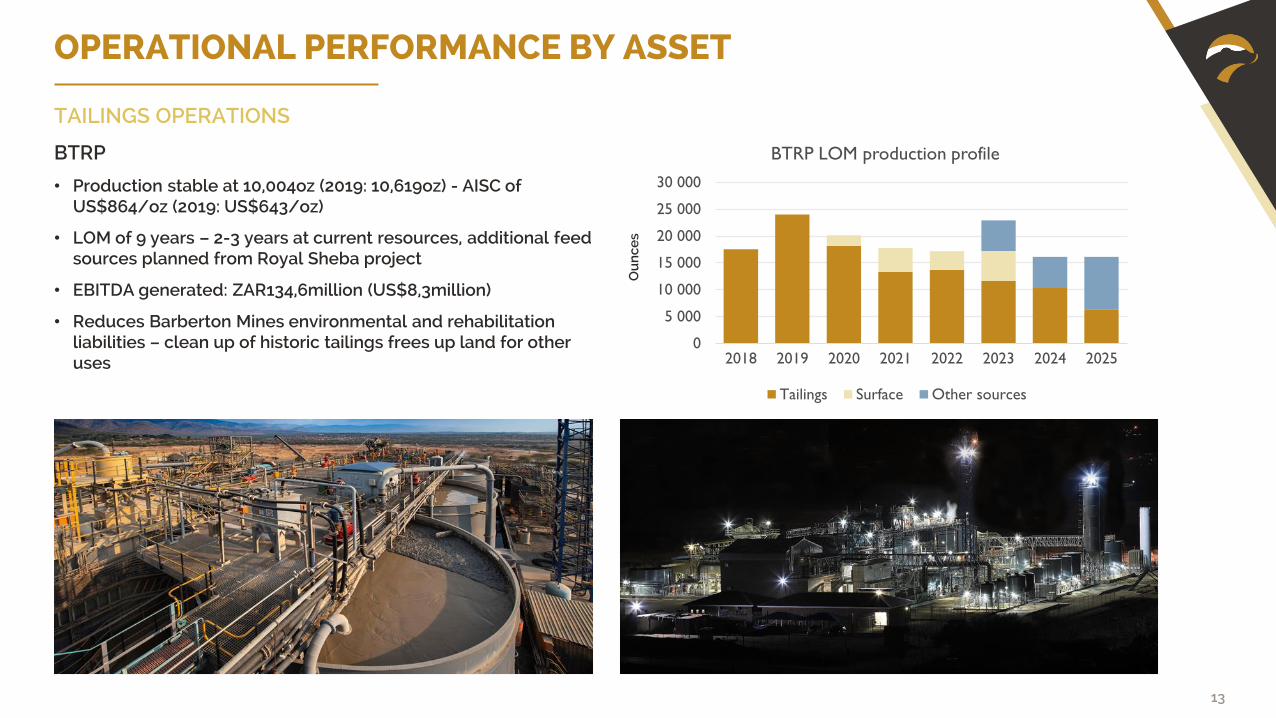
BTRP
• Production stable at 10,004oz (2019: 10,619oz) - AISC of US$864/oz (2019: US$643/oz)
• LOM of 9 years – 2-3 years at current resources, additional feed sources planned from Royal Sheba project
• EBITDA generated: ZAR134,6million (US$8,3million)
• Reduces Barberton Mines environmental and rehabilitation liabilities – clean up of historic tailings frees up land for other uses
Ou
nce
s
0
5 000
10 000
15 000
20 000
25 000
30 000
2018 2019 2020 2021 2022 2023 2024 2025
BTRP LOM production profile
Tailings Surface Other sources
14
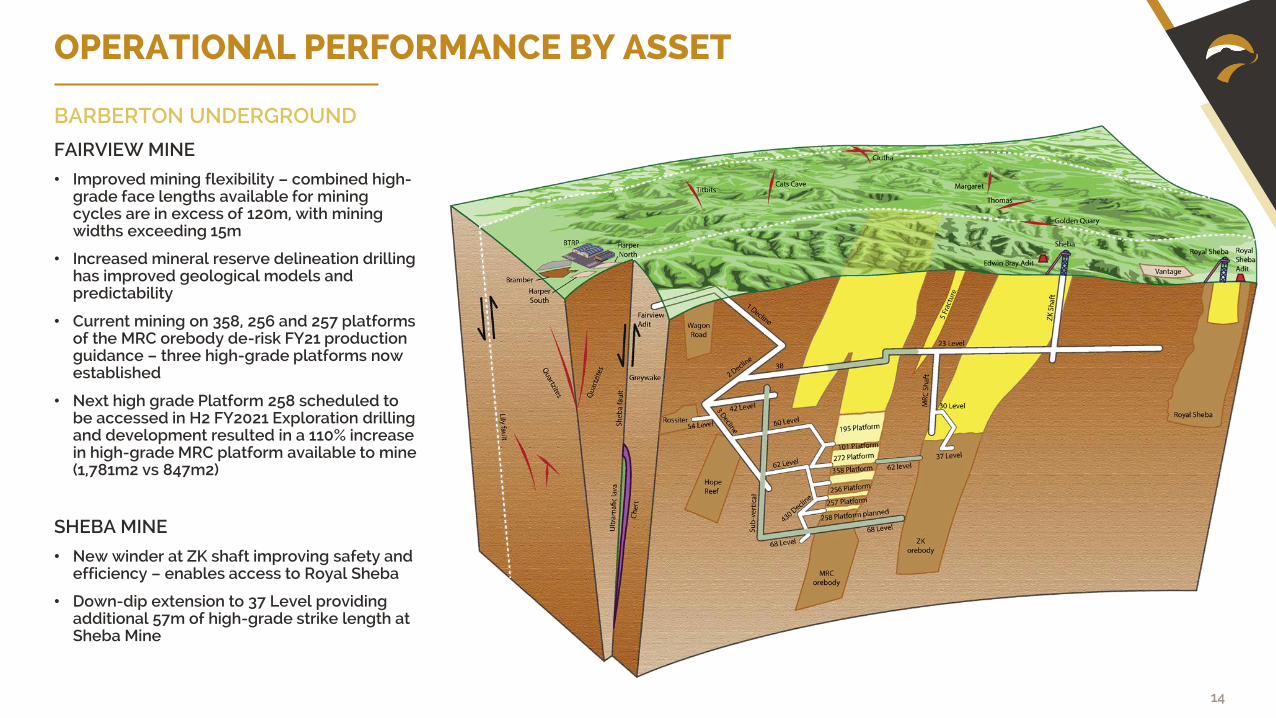
FAIRVIEW MINE
• Improved mining flexibility – combined high-grade face lengths available for mining cycles are in excess of 120m, with mining widths exceeding 15m
• Increased mineral reserve delineation drilling has improved geological models and predictability
• Current mining on 358, 256 and 257 platforms of the MRC orebody de-risk FY21 production guidance – three high-grade platforms now established
• Next high grade Platform 258 scheduled to be accessed in H2 FY2021 Exploration drilling and development resulted in a 110% increase in high-grade MRC platform available to mine (1,781m2 vs 847m2)
SHEBA MINE
• New winder at ZK shaft improving safety and efficiency – enables access to Royal Sheba
• Down-dip extension to 37 Level providing additional 57m of high-grade strike length at Sheba Mine
BARBERTON UNDERGROUND
OPERATIONAL PERFORMANCE BY ASSET
15
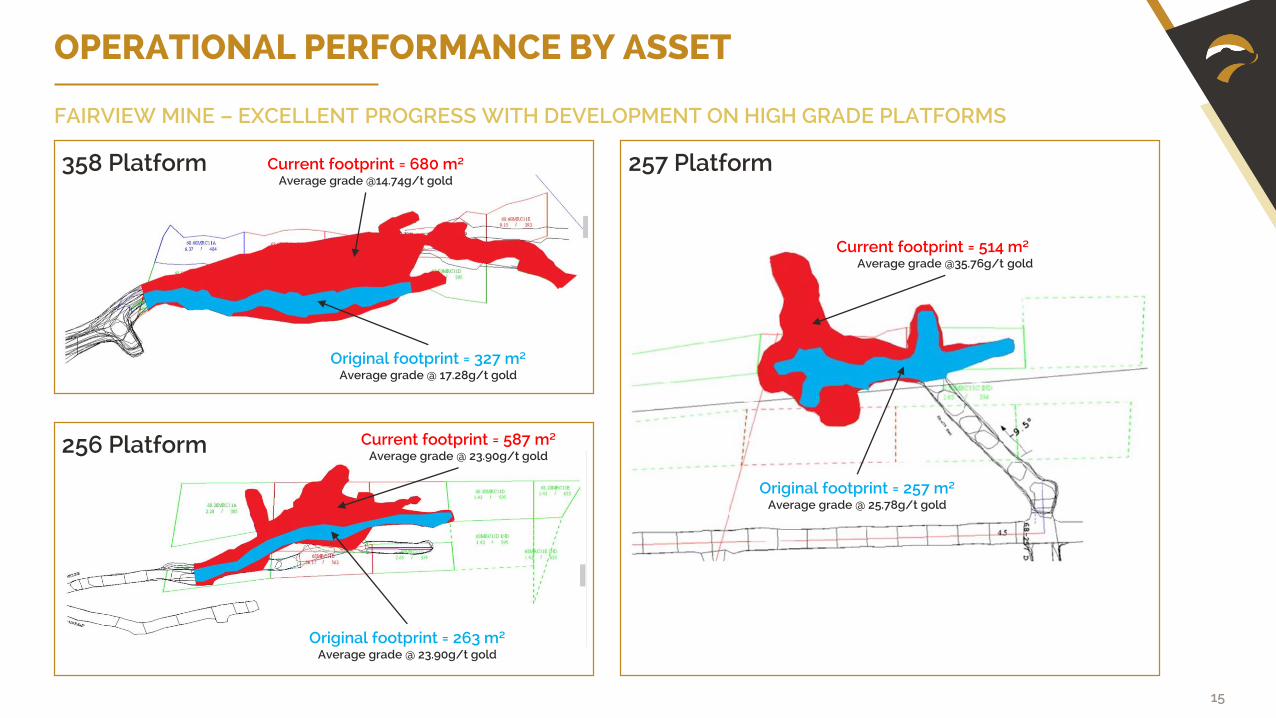
358 Platform
256 Platform
257 Platform
OPERATIONAL PERFORMANCE BY ASSET
FAIRVIEW MINE – EXCELLENT PROGRESS WITH DEVELOPMENT ON HIGH GRADE PLATFORMS
Current footprint = 680 m²Average grade @14.74g/t gold
Original footprint = 327 m²Average grade @ 17.28g/t gold
Current footprint = 587 m²Average grade @ 23.90g/t gold
Original footprint = 263 m²Average grade @ 23.90g/t gold
Current footprint = 514 m²Average grade @35.76g/t gold
Original footprint = 257 m²Average grade @ 25.78g/t gold
16
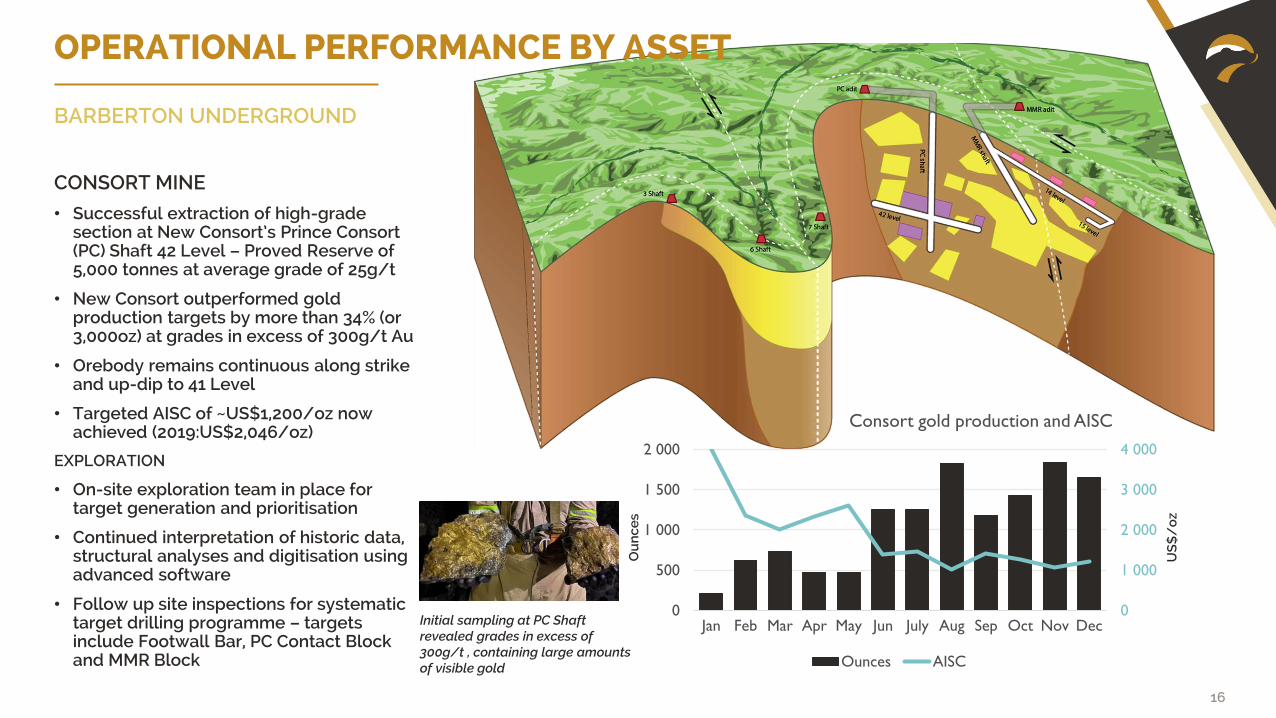
CONSORT MINE
• Successful extraction of high-grade section at New Consort’s Prince Consort (PC) Shaft 42 Level – Proved Reserve of 5,000 tonnes at average grade of 25g/t
• New Consort outperformed gold production targets by more than 34% (or 3,000oz) at grades in excess of 300g/t Au
• Orebody remains continuous along strike and up-dip to 41 Level
• Targeted AISC of ~US$1,200/oz now achieved (2019:US$2,046/oz)
EXPLORATION
• On-site exploration team in place for target generation and prioritisation
• Continued interpretation of historic data, structural analyses and digitisation using advanced software
• Follow up site inspections for systematic target drilling programme – targets include Footwall Bar, PC Contact Block and MMR Block
BARBERTON UNDERGROUND
0
1 000
2 000
3 000
4 000
0
500
1 000
1 500
2 000
Jan Feb Mar Apr May Jun July Aug Sep Oct Nov Dec
Consort gold production and AISC
Ounces AISC
OPERATIONAL PERFORMANCE BY ASSET
Initial sampling at PC Shaft revealed grades in excess of 300g/t , containing large amounts of visible gold
US
$/
oz
Ou
nce
s
17
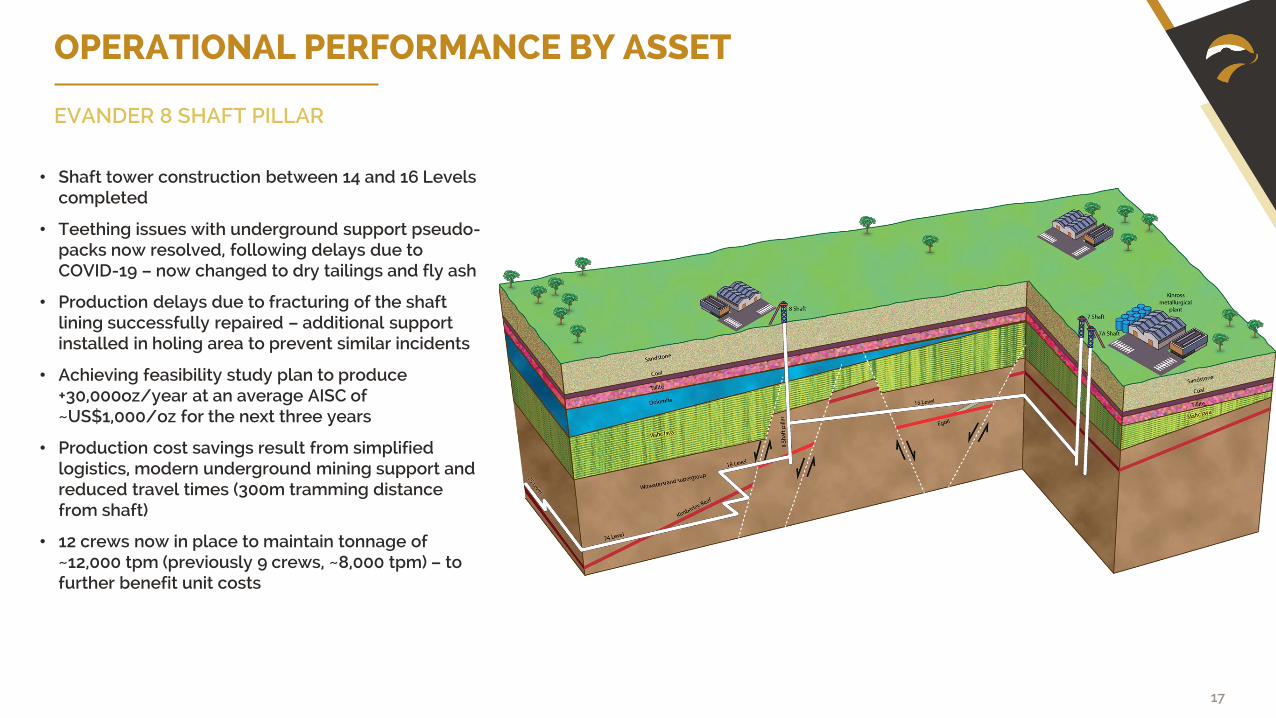
• Shaft tower construction between 14 and 16 Levels completed
• Teething issues with underground support pseudo-packs now resolved, following delays due to COVID-19 – now changed to dry tailings and fly ash
• Production delays due to fracturing of the shaft lining successfully repaired – additional support installed in holing area to prevent similar incidents
• Achieving feasibility study plan to produce +30,000oz/year at an average AISC of ~US$1,000/oz for the next three years
• Production cost savings result from simplified logistics, modern underground mining support and reduced travel times (300m tramming distance from shaft)
• 12 crews now in place to maintain tonnage of ~12,000 tpm (previously 9 crews, ~8,000 tpm) – to further benefit unit costs
EVANDER 8 SHAFT PILLAR
OPERATIONAL PERFORMANCE BY ASSET

18
EVANDER 8 SHAFT – PILLAR EXTRACTION
IMPROVEMENTS COMPLETED AT 8 SHAFT
To date, includes:
• Grout plant commissioned, together with the use of drytailings trucked from the slimes dam
• Main beam installed at 14 level
• Implemented RYHP hydraulic props
• Cutting and sealing of brattice wall
• Shaft tower installed
• Deployment of up to 12 stoping crews
• Implemented stoping width control
• Repaired and restored shaft steel work between 18level station and shaft bottom
• Installed and replaced damaged Bunton’s and Guides inthe shaft
• Installed additional submersible pump at shaft bottom
• A permanent contractor appointed at 7 Shaft to repairand maintain shaft steel work, and remove allredundant services – 8 Shaft production is hoisted from7 Shaft
0
2
4
6
8
10
12
14
16
18
0
500
1 000
1 500
2 000
2 500
3 000
3 500
4 000
4 500
Jul-
19
No
v-1
9
Mar
-20
Jul-
20
No
v-2
0
Mar
-21
Jul-
21
No
v-2
1
Mar
-22
Jul-
22
No
v-2
2
Mar
-23
Jul-
23
No
v-2
3
Mar
-24
Jul-
24
No
v-2
4
Mar
-25
Jul-
25
No
v-2
5
GR
AD
E (G
/T)
OZ
AU
Evander 8 Shaft Life of Mine Production
8 Shaft Pillar - Actuals 8 Shaft Pillar - Forecast 8 Shaft Grade (g/t)
CURRENT STATUS AND PRODUCTION PROFILE
• Remaining LoM life in excess of 2 years - expected production of ca. 80,000oz of gold – to 3Q 2023
• Production significantly improved in H2 FY2021 – start-up technical challenges successfully resolved as previously reported
• Average production maintained at ca. 3,400oz/m for the last three months - in line with Feasibility Study expectations
19
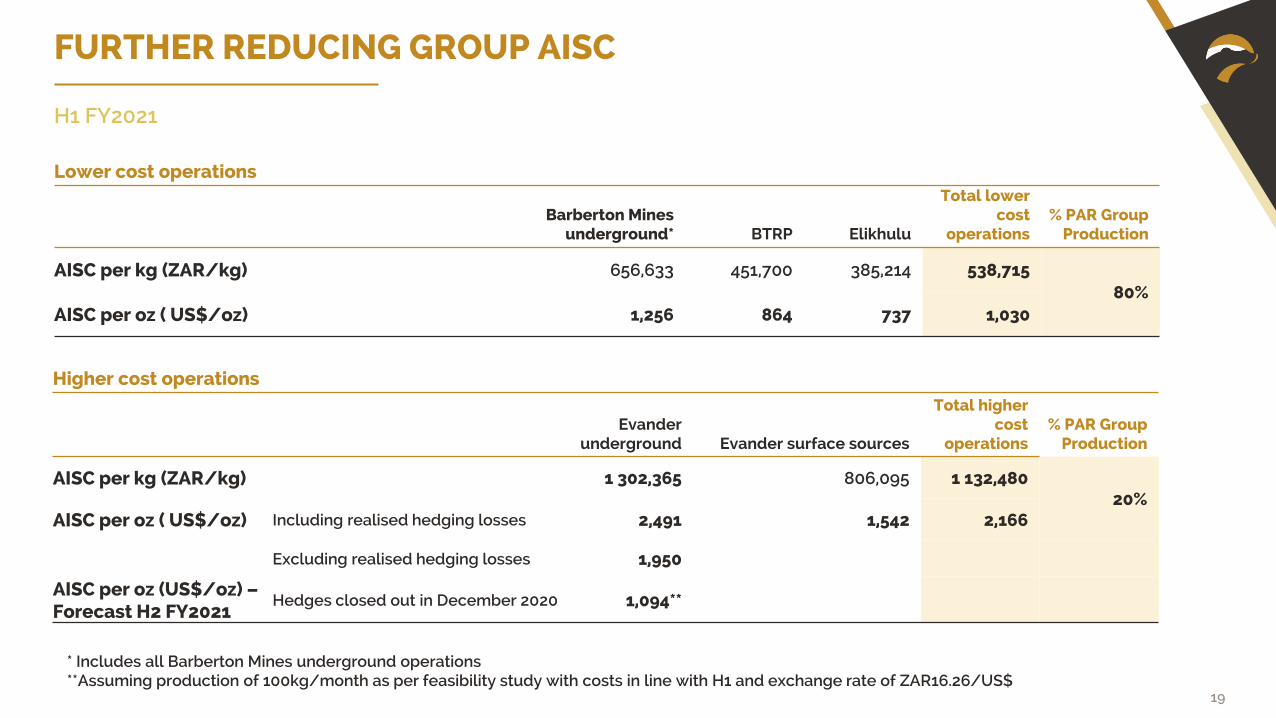
FURTHER REDUCING GROUP AISC
Lower cost operations
Barberton Mines underground* BTRP Elikhulu
Total lower cost
operations% PAR Group
Production
AISC per kg (ZAR/kg) 656,633 451,700 385,214 538,71580%
AISC per oz ( US$/oz) 1,256 864 737 1,030
Higher cost operations
Evander underground Evander surface sources
Total higher cost
operations% PAR Group
Production
AISC per kg (ZAR/kg) 1 302,365 806,095 1 132,48020%
AISC per oz ( US$/oz) Including realised hedging losses 2,491 1,542 2,166
Excluding realised hedging losses 1,950
AISC per oz (US$/oz) –Forecast H2 FY2021
Hedges closed out in December 2020 1,094**
* Includes all Barberton Mines underground operations**Assuming production of 100kg/month as per feasibility study with costs in line with H1 and exchange rate of ZAR16.26/US$
H1 FY2021
20
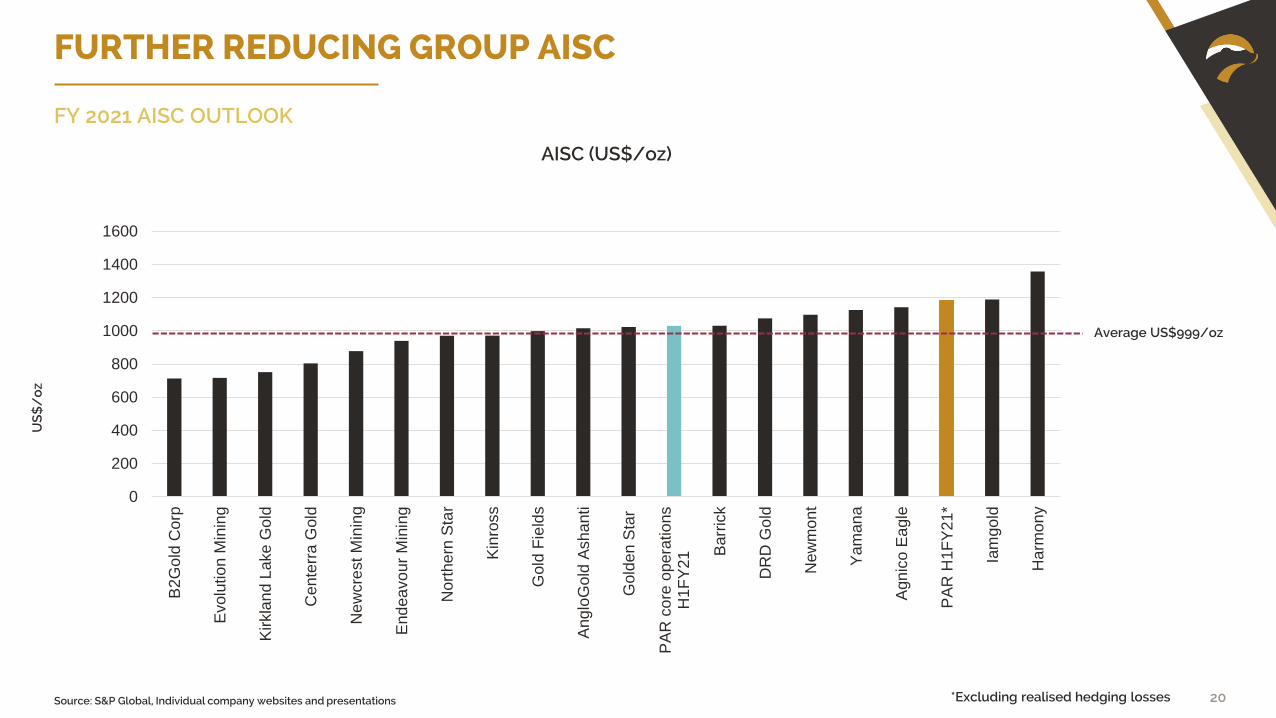
FURTHER REDUCING GROUP AISC
Source: S&P Global, Individual company websites and presentations
FY 2021 AISC OUTLOOK
0
200
400
600
800
1000
1200
1400
1600
B2G
old
Co
rp
Evolu
tio
n M
inin
g
Kirkla
nd L
ake
Go
ld
Cente
rra
Gold
Ne
wcre
st M
inin
g
End
ea
vo
ur
Min
ing
Nort
he
rn S
tar
Kin
ross
Gold
Fie
lds
Ang
loG
old
Ash
anti
Gold
en S
tar
PA
R c
ore
op
era
tio
ns
H1F
Y21 B
arr
ick
DR
D G
old
New
mo
nt
Yam
an
a
Agn
ico E
agle
PA
R H
1F
Y2
1*
Iam
go
ld
Harm
on
y
AISC (US$/oz)
US
$/
oz
Average US$999/oz
*Excluding realised hedging losses
21
GROUP CAPITAL EXPENDITURE (ZAR)
0
200
400
600
800
1 000
1 200
1 400
1 600
1 800
2 000
2017 2018 2019 2020 2021 FCEgoli 70Elikhulu 1 256,1 534,6 8,6 80Evander 262,0 342,4 38,1 328,3 90BML Expansion 77,9 99,4 89,3 110,3 200BML Sustaining 116,5 111,0 140,0 186,6 250
ZA
Rm
Includes 9A block exploration drilling, osmiridium recovery circuit in plant and critical spares not previously budgeted for
H1 FY2021 FINANCIALS
23
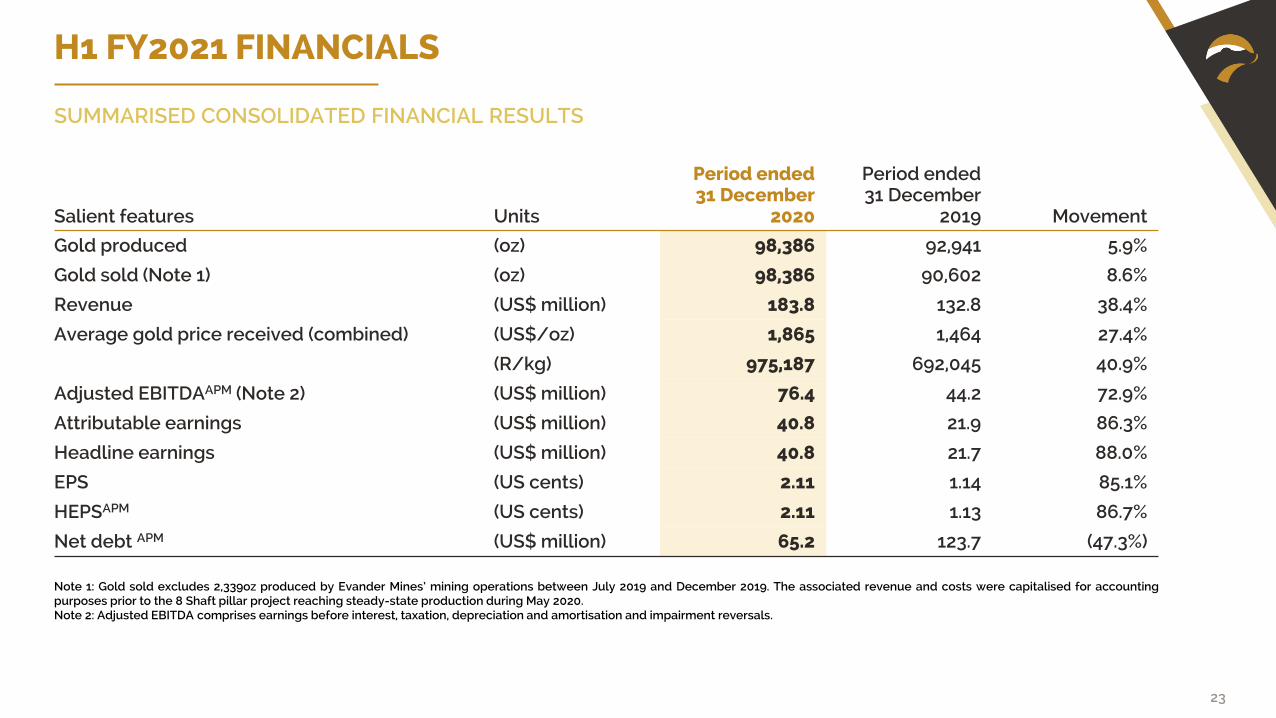
H1 FY2021 FINANCIALS
Salient features Units
Period ended 31 December
2020
Period ended 31 December
2019 Movement
Gold produced (oz) 98,386 92,941 5.9%
Gold sold (Note 1) (oz) 98,386 90,602 8.6%
Revenue (US$ million) 183.8 132.8 38.4%
Average gold price received (combined) (US$/oz) 1,865 1,464 27.4%
(R/kg) 975,187 692,045 40.9%
Adjusted EBITDAAPM (Note 2) (US$ million) 76.4 44.2 72.9%
Attributable earnings (US$ million) 40.8 21.9 86.3%
Headline earnings (US$ million) 40.8 21.7 88.0%
EPS (US cents) 2.11 1.14 85.1%
HEPSAPM (US cents) 2.11 1.13 86.7%
Net debt APM (US$ million) 65.2 123.7 (47.3%)
SUMMARISED CONSOLIDATED FINANCIAL RESULTS
Note 1: Gold sold excludes 2,339oz produced by Evander Mines’ mining operations between July 2019 and December 2019. The associated revenue and costs were capitalised for accountingpurposes prior to the 8 Shaft pillar project reaching steady-state production during May 2020.Note 2: Adjusted EBITDA comprises earnings before interest, taxation, depreciation and amortisation and impairment reversals.
24
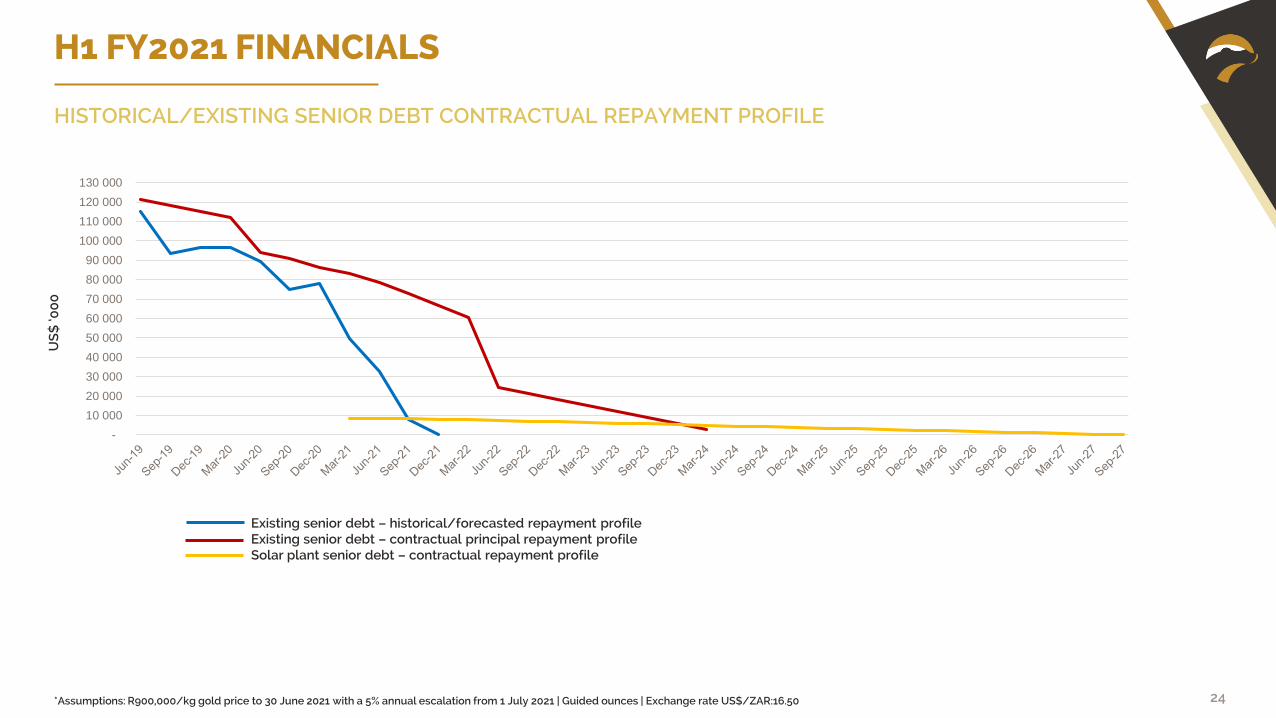
H1 FY2021 FINANCIALS
*Assumptions: R900,000/kg gold price to 30 June 2021 with a 5% annual escalation from 1 July 2021 | Guided ounces | Exchange rate US$/ZAR:16.50
HISTORICAL/EXISTING SENIOR DEBT CONTRACTUAL REPAYMENT PROFILE
US
$ ‘0
00
-
10 000
20 000
30 000
40 000
50 000
60 000
70 000
80 000
90 000
100 000
110 000
120 000
130 000
Actual / Forecasted Repayment Profile Senior Debt Principal repayment profile Solar Plant
Existing senior debt – historical/forecasted repayment profileExisting senior debt – contractual principal repayment profileSolar plant senior debt – contractual repayment profile
25
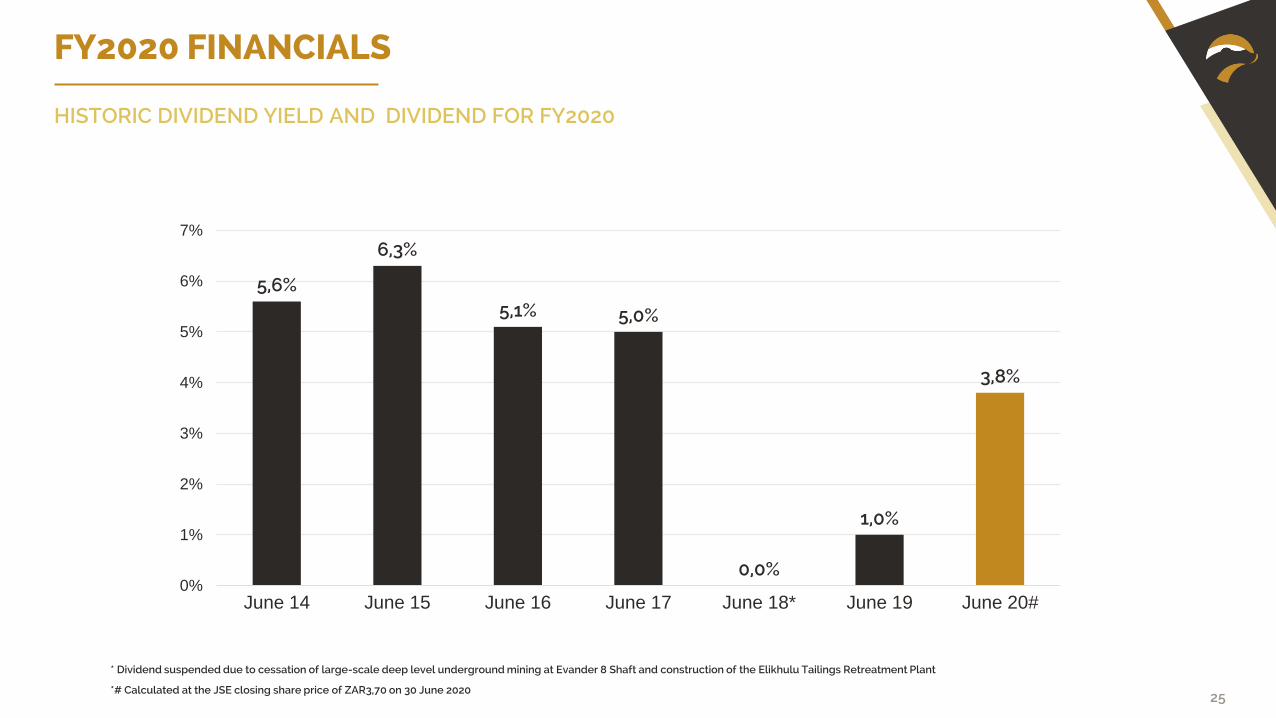
FY2020 FINANCIALS
* Dividend suspended due to cessation of large-scale deep level underground mining at Evander 8 Shaft and construction of the Elikhulu Tailings Retreatment Plant
HISTORIC DIVIDEND YIELD AND DIVIDEND FOR FY2020
5,6%
6,3%
5,1% 5,0%
0,0%
1,0%
3,8%
0%
1%
2%
3%
4%
5%
6%
7%
June 14 June 15 June 16 June 17 June 18* June 19 June 20#
*# Calculated at the JSE closing share price of ZAR3,70 on 30 June 2020
26
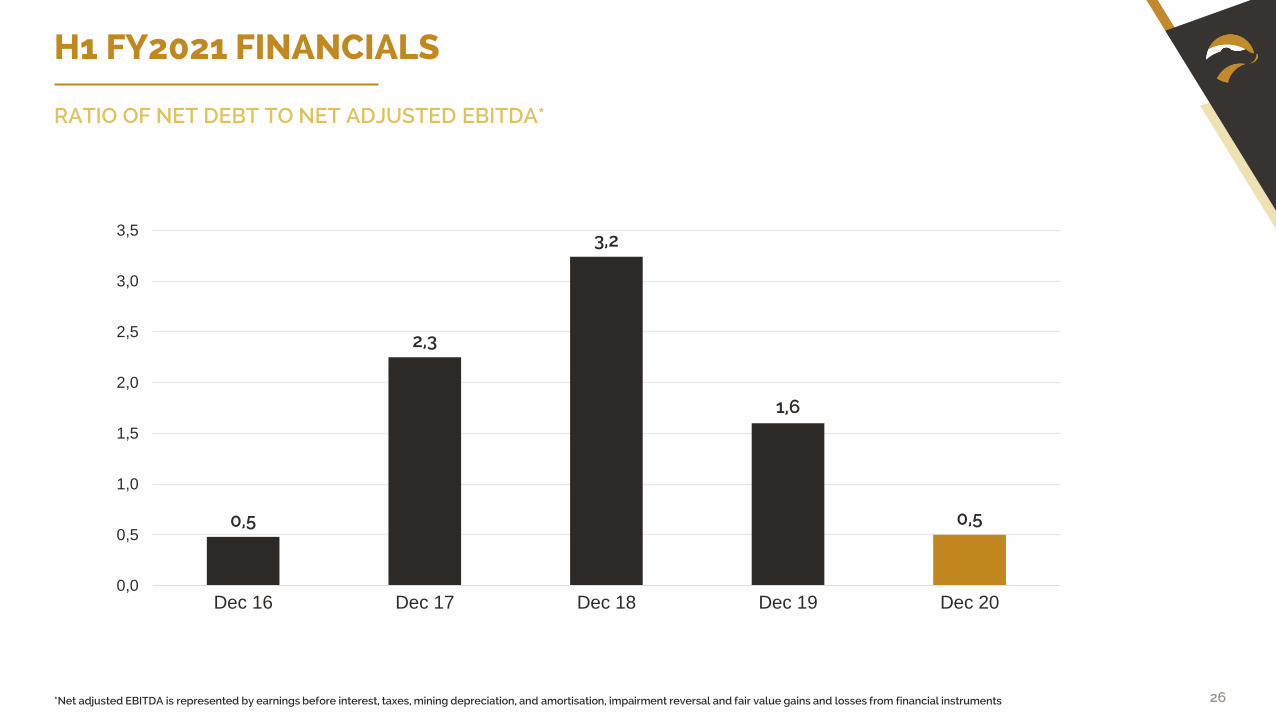
H1 FY2021 FINANCIALS
0,5
2,3
3,2
1,6
0,5
0,0
0,5
1,0
1,5
2,0
2,5
3,0
3,5
Dec 16 Dec 17 Dec 18 Dec 19 Dec 20
*Net adjusted EBITDA is represented by earnings before interest, taxes, mining depreciation, and amortisation, impairment reversal and fair value gains and losses from financial instruments
RATIO OF NET DEBT TO NET ADJUSTED EBITDA*
EVANDER 8 SHAFT – 24 LEVEL PROJECT
INVESTMENT CASEAND EGOLI PHASE-IN

28
EVANDER MINE 8 SHAFT PILLAR AND 24 LEVEL LIFE OF MINE
EVANDER 8 SHAFT - 24 LEVEL PROJECT INVESTMENT CASE
0
2
4
6
8
10
12
14
16
18
0
500
1 000
1 500
2 000
2 500
3 000
3 500
4 000
4 500
5 000
Jul-
19
No
v-1
9
Mar
-20
Jul-
20
No
v-2
0
Mar
-21
Jul-
21
No
v-2
1
Mar
-22
Jul-
22
No
v-2
2
Mar
-23
Jul-
23
No
v-2
3
Mar
-24
Jul-
24
No
v-2
4
Mar
-25
Jul-
25
No
v-2
5
GR
AD
E (G
/T)
OZ
AU
Evander 8 Shaft + 24 level Life of Mine Production
8 Shaft Pillar - Actuals 8 Shaft Pillar - Forecast 8 Shaft 24L - Forecast
8Shaft Pillar - Budget 8 Shaft Grade (g/t) 8 Shaft Grade (g/t Budget)
• Internal study into the extensive gold resources at the 24 Level at Evander’s Underground operations completed
• 101,523oz recoverable
• accessible through the 8 Shaft number 2 decline.
• Mining at 24 Level will
• extend Evander 8 Shaft production profile, post cessation of the 8 Shaft pillar mining
• Add 2,5 years LoM at an average production of approximately 31,000oz/yr
• Maintain Group production profile at >200,000oz/yrwhile Egoli comes on stream
29
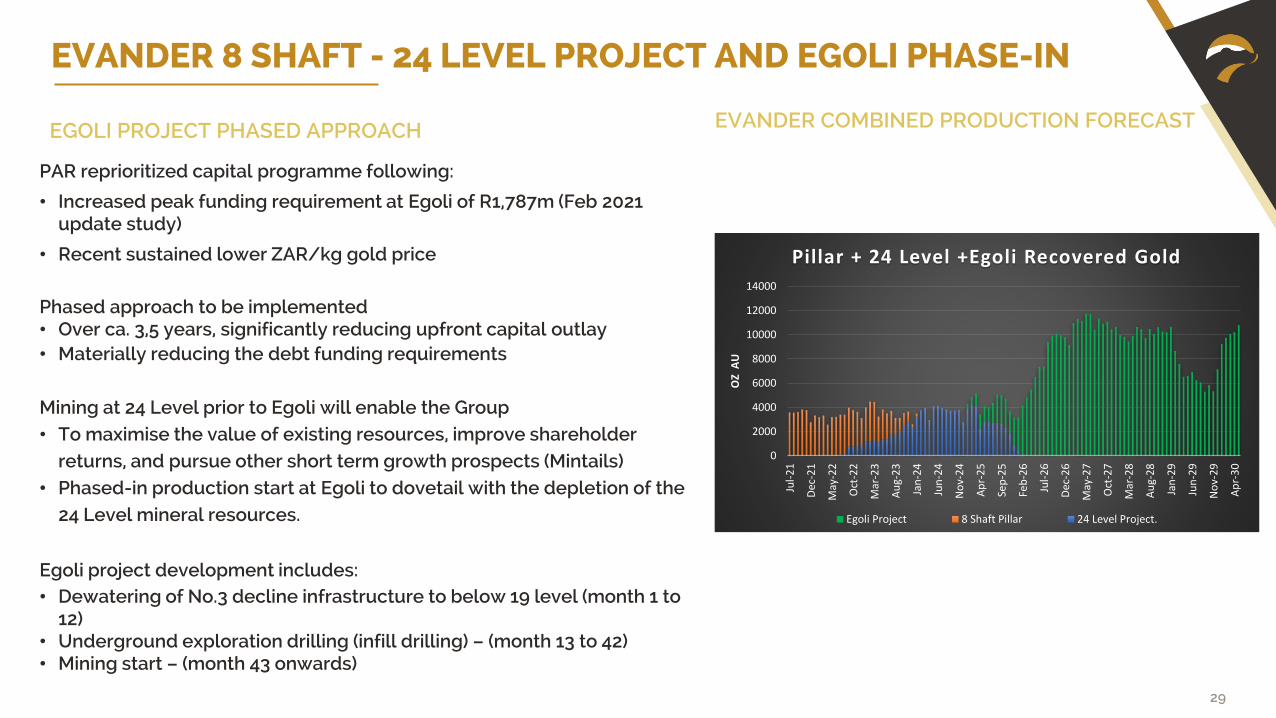
PAR reprioritized capital programme following:
• Increased peak funding requirement at Egoli of R1,787m (Feb 2021 update study)
• Recent sustained lower ZAR/kg gold price
Phased approach to be implemented • Over ca. 3,5 years, significantly reducing upfront capital outlay • Materially reducing the debt funding requirements
Mining at 24 Level prior to Egoli will enable the Group• To maximise the value of existing resources, improve shareholder
returns, and pursue other short term growth prospects (Mintails)• Phased-in production start at Egoli to dovetail with the depletion of the
24 Level mineral resources.
Egoli project development includes:• Dewatering of No.3 decline infrastructure to below 19 level (month 1 to
12)• Underground exploration drilling (infill drilling) – (month 13 to 42)• Mining start – (month 43 onwards)
EGOLI PROJECT PHASED APPROACH
EVANDER 8 SHAFT - 24 LEVEL PROJECT AND EGOLI PHASE-IN
0
2000
4000
6000
8000
10000
12000
14000
Jul-
21
Dec
-21
May
-22
Oct
-22
Mar
-23
Au
g-2
3
Jan
-24
Jun
-24
No
v-2
4
Ap
r-2
5
Sep
-25
Feb
-26
Jul-
26
Dec
-26
May
-27
Oct
-27
Mar
-28
Au
g-2
8
Jan
-29
Jun
-29
No
v-2
9
Ap
r-3
0
OZ
AU
Pillar + 24 Level +Egoli Recovered Gold
Egoli Project 8 Shaft Pillar 24 Level Project.
EVANDER COMBINED PRODUCTION FORECAST
MINTAILS TRANSACTION
31
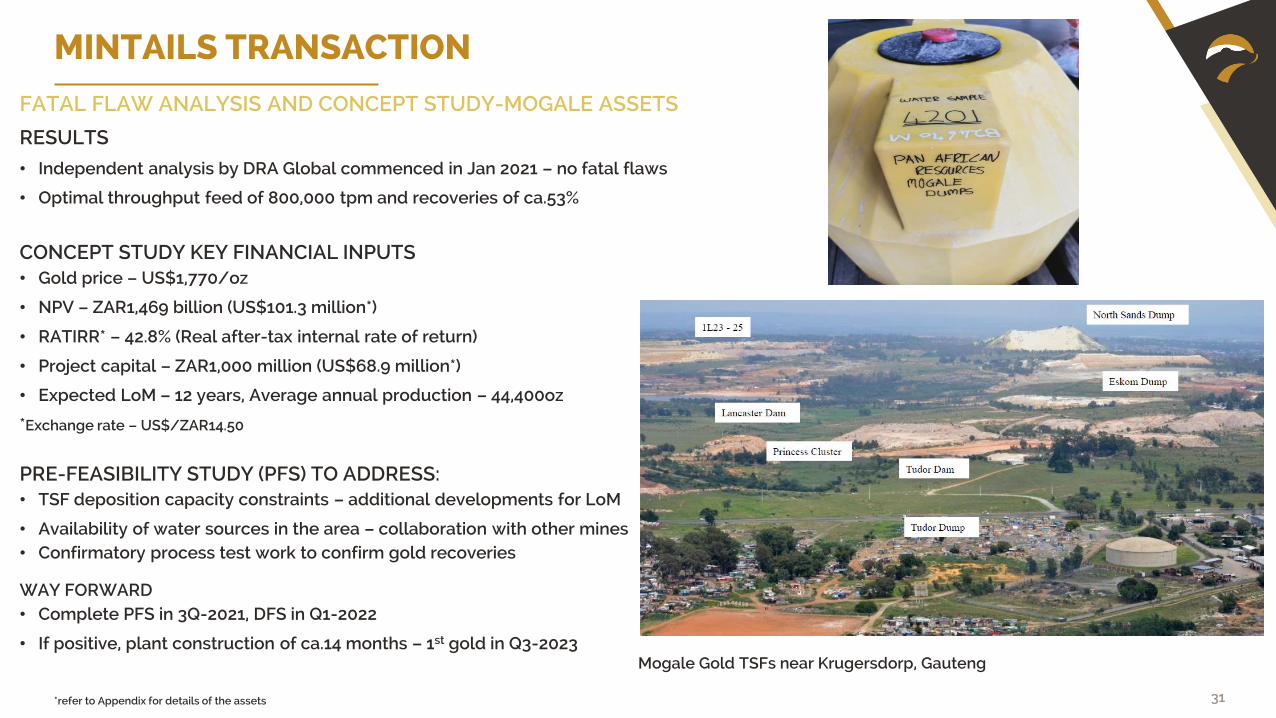
MINTAILS TRANSACTION
FATAL FLAW ANALYSIS AND CONCEPT STUDY-MOGALE ASSETS
RESULTS
• Independent analysis by DRA Global commenced in Jan 2021 – no fatal flaws
• Optimal throughput feed of 800,000 tpm and recoveries of ca.53%
CONCEPT STUDY KEY FINANCIAL INPUTS• Gold price – US$1,770/oz
• NPV – ZAR1,469 billion (US$101.3 million*)
• RATIRR* – 42.8% (Real after-tax internal rate of return)
• Project capital – ZAR1,000 million (US$68.9 million*)
• Expected LoM – 12 years, Average annual production – 44,400oz
*Exchange rate – US$/ZAR14.50
PRE-FEASIBILITY STUDY (PFS) TO ADDRESS:• TSF deposition capacity constraints – additional developments for LoM
• Availability of water sources in the area – collaboration with other mines• Confirmatory process test work to confirm gold recoveries
WAY FORWARD• Complete PFS in 3Q-2021, DFS in Q1-2022
• If positive, plant construction of ca.14 months – 1st gold in Q3-2023 Mogale Gold TSFs near Krugersdorp, Gauteng
*refer to Appendix for details of the assets
EVANDER SOLAR PVPLANT
33
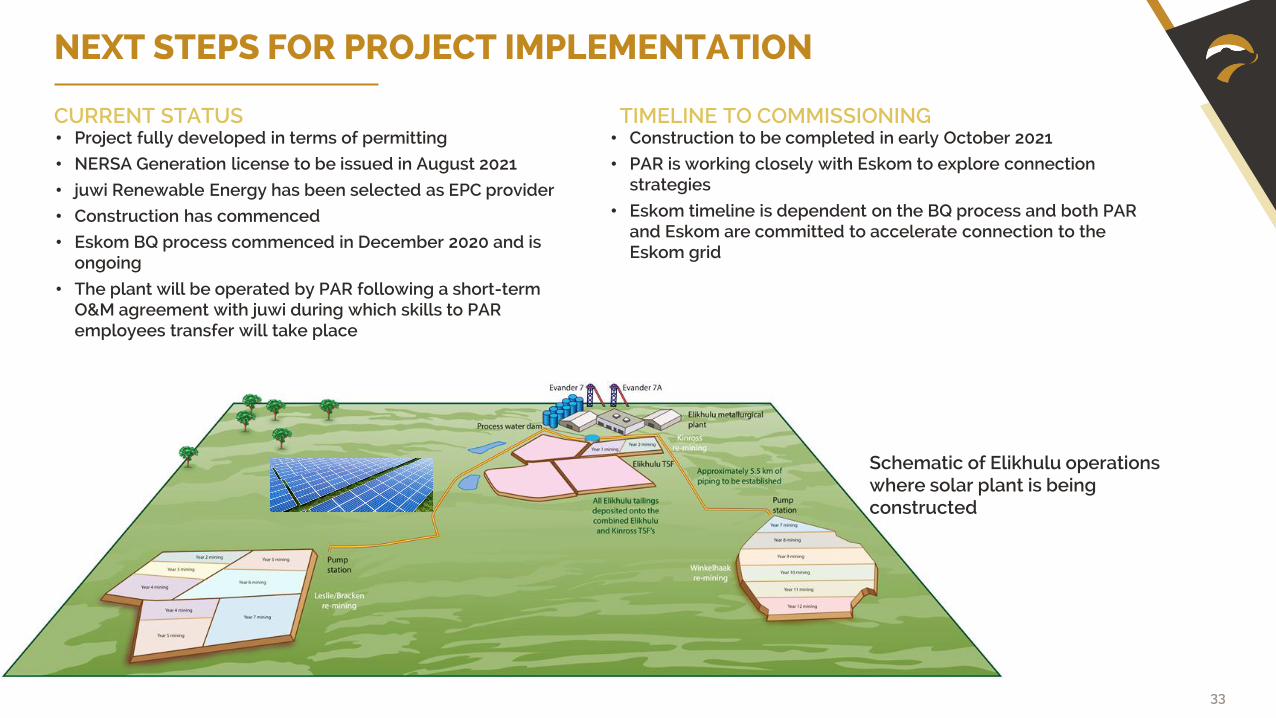
NEXT STEPS FOR PROJECT IMPLEMENTATION
CURRENT STATUS • Project fully developed in terms of permitting
• NERSA Generation license to be issued in August 2021
• juwi Renewable Energy has been selected as EPC provider
• Construction has commenced
• Eskom BQ process commenced in December 2020 and is ongoing
• The plant will be operated by PAR following a short-term O&M agreement with juwi during which skills to PAR employees transfer will take place
TIMELINE TO COMMISSIONING• Construction to be completed in early October 2021
• PAR is working closely with Eskom to explore connection strategies
• Eskom timeline is dependent on the BQ process and both PAR and Eskom are committed to accelerate connection to the Eskom grid
Schematic of Elikhulu operations where solar plant is being constructed
FY2021DELIVERY ON TRACK
35
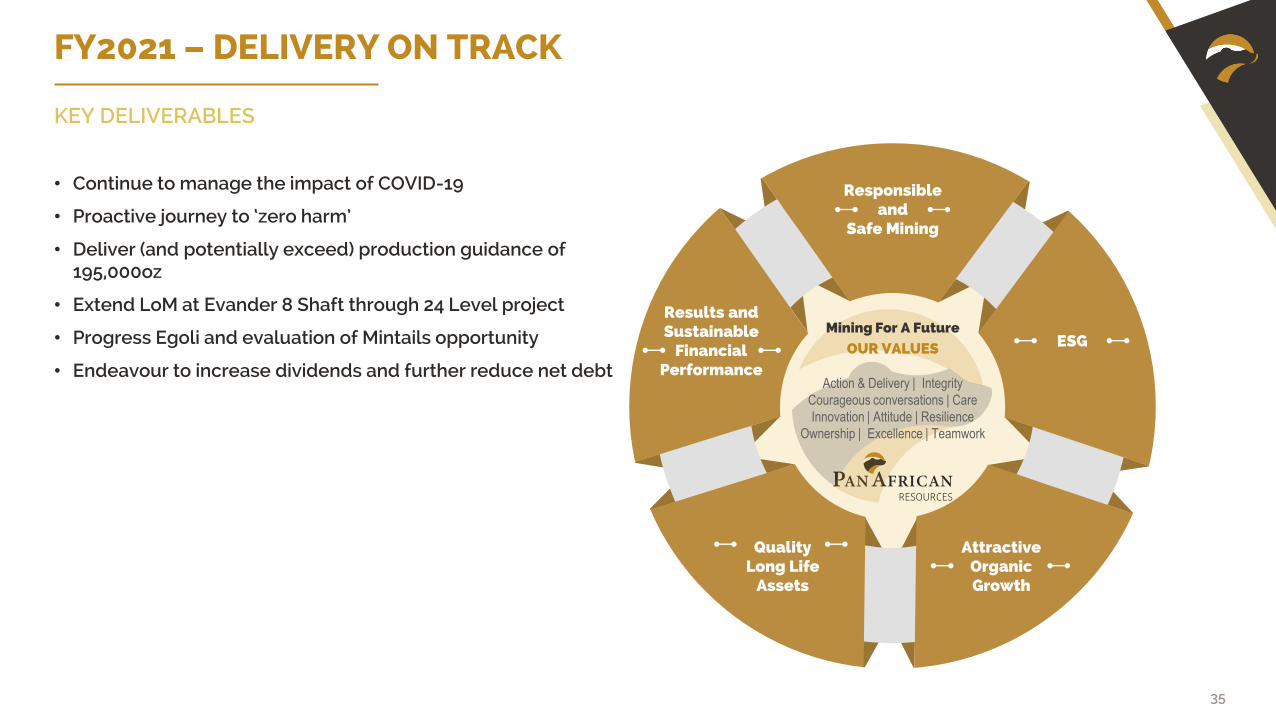
FY2021 – DELIVERY ON TRACK
KEY DELIVERABLES
• Continue to manage the impact of COVID-19
• Proactive journey to ‘zero harm’
• Deliver (and potentially exceed) production guidance of 195,000oz
• Extend LoM at Evander 8 Shaft through 24 Level project
• Progress Egoli and evaluation of Mintails opportunity
• Endeavour to increase dividends and further reduce net debt
Mining For A Future
OUR VALUES
Action & Delivery | Integrity
Courageous conversations | Care
Innovation | Attitude | Resilience
Ownership | Excellence | Teamwork
ESG
Responsibleand
Safe Mining
AttractiveOrganicGrowth
QualityLong Life
Assets
Results andSustainable
FinancialPerformance
THANK YOU
CONTACT USHethen HiraHead: Investor [email protected]+27 11 243 2900 WWW.PANAFRICANRESOURCES.COM
JSE:PANAIM:PAF
ADR:PAFRY
APPENDIX
38
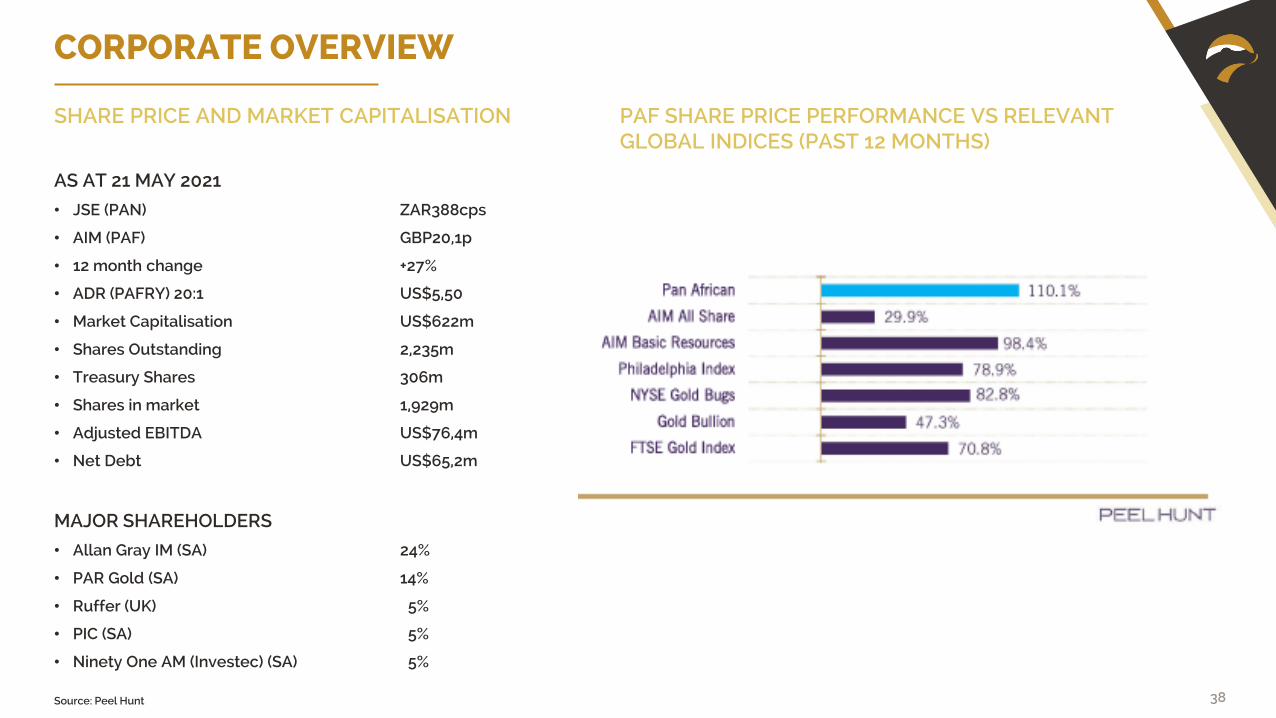
CORPORATE OVERVIEW
Source: Peel Hunt
SHARE PRICE AND MARKET CAPITALISATION
AS AT 21 MAY 2021
• JSE (PAN) ZAR388cps
• AIM (PAF) GBP20,1p
• 12 month change +27%
• ADR (PAFRY) 20:1 US$5,50
• Market Capitalisation US$622m
• Shares Outstanding 2,235m
• Treasury Shares 306m
• Shares in market 1,929m
• Adjusted EBITDA US$76,4m
• Net Debt US$65,2m
MAJOR SHAREHOLDERS
• Allan Gray IM (SA) 24%
• PAR Gold (SA) 14%
• Ruffer (UK) 5%
• PIC (SA) 5%
• Ninety One AM (Investec) (SA) 5%
PAF SHARE PRICE PERFORMANCE VS RELEVANT GLOBAL INDICES (PAST 12 MONTHS)
39
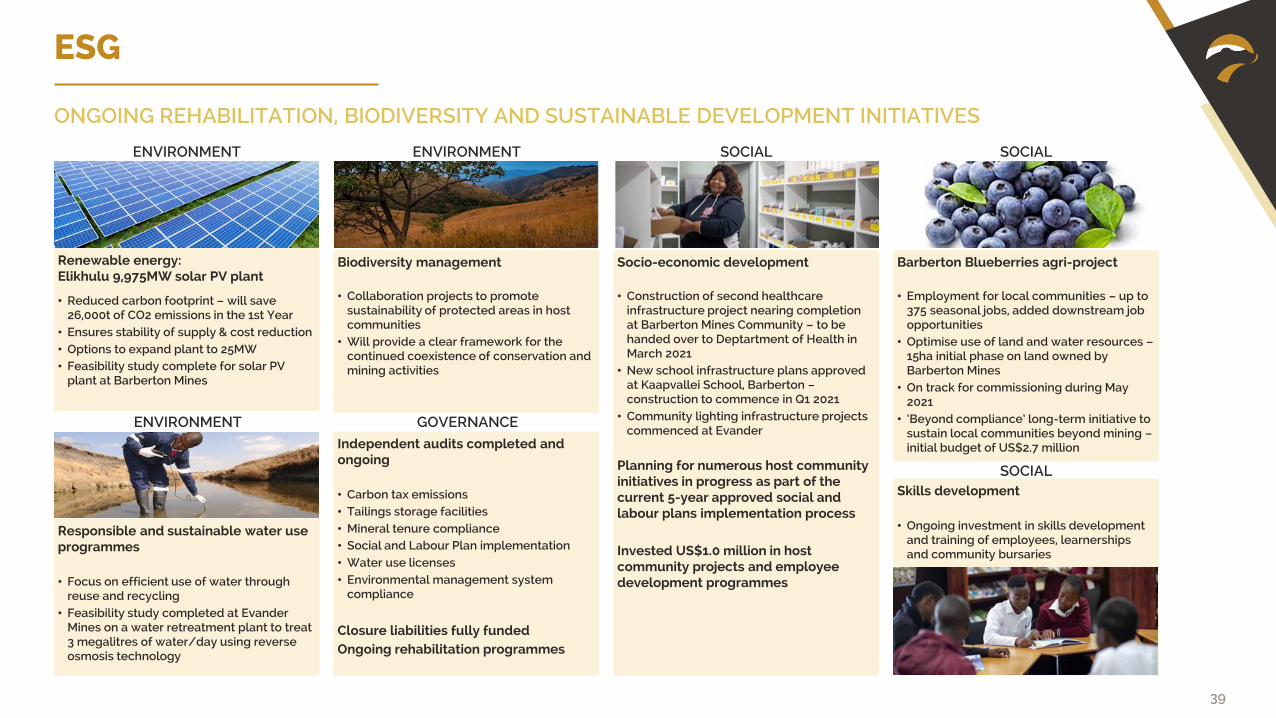
Skills development
• Ongoing investment in skills development and training of employees, learnerships and community bursaries
Independent audits completed and ongoing
• Carbon tax emissions• Tailings storage facilities• Mineral tenure compliance• Social and Labour Plan implementation• Water use licenses• Environmental management system
compliance
Closure liabilities fully funded Ongoing rehabilitation programmes
ESG
ONGOING REHABILITATION, BIODIVERSITY AND SUSTAINABLE DEVELOPMENT INITIATIVES
Renewable energy: Elikhulu 9,975MW solar PV plant
• Reduced carbon footprint – will save 26,000t of CO2 emissions in the 1st Year
• Ensures stability of supply & cost reduction• Options to expand plant to 25MW • Feasibility study complete for solar PV
plant at Barberton Mines
Biodiversity management
• Collaboration projects to promote sustainability of protected areas in host communities
• Will provide a clear framework for the continued coexistence of conservation and mining activities
Responsible and sustainable water use programmes
• Focus on efficient use of water through reuse and recycling
• Feasibility study completed at Evander Mines on a water retreatment plant to treat 3 megalitres of water/day using reverse osmosis technology
Socio-economic development
• Construction of second healthcare infrastructure project nearing completion at Barberton Mines Community – to be handed over to Deptartment of Health in March 2021
• New school infrastructure plans approved at Kaapvallei School, Barberton –construction to commence in Q1 2021
• Community lighting infrastructure projects commenced at Evander
Planning for numerous host community initiatives in progress as part of the current 5-year approved social and labour plans implementation process
Invested US$1.0 million in host community projects and employee development programmes
Barberton Blueberries agri-project
• Employment for local communities – up to 375 seasonal jobs, added downstream job opportunities
• Optimise use of land and water resources –15ha initial phase on land owned by Barberton Mines
• On track for commissioning during May 2021
• ‘Beyond compliance’ long-term initiative to sustain local communities beyond mining –initial budget of US$2.7 million
ENVIRONMENT ENVIRONMENT SOCIAL SOCIAL
ENVIRONMENT GOVERNANCE
SOCIAL

40
CORPORATE OVERVIEW
BOARD AND EXECUTIVES
ChairmanAppointed: 8 October 2007ExperienceTechnical and operationalRisk management Environmental and sustainabilityBusiness and strategyLeadership
Keith Spencer
Chief executive officerAppointed: 26 August 2009ExperienceTechnical and operationalFinance and accounting Business and strategy Leadership Technology Taxation
Cobus Loots
Financial directorAppointed: 1 March 2015ExperienceFinance and accounting Risk management Business and strategy Leadership Technology Taxation
Deon Louw
Non-executive directorAppointed: 12 April 2012ExperienceFinance and accountingRisk management Governance and regulationBusiness and strategyLeadershipTaxation
Hester Hickey
Non-executive directorAppointed: 9 December 2013ExperienceFinance and accountingGovernance and regulationBusiness and strategyLeadership
Thabo Mosololi
Non-executive directorAppointed: 17 July 2019ExperienceTechnical and operationalRisk management Governance and regulation Environmental and sustainability Business and strategy Leadership
Charles Needham
Non-executive directorAppointed: 17 July 2019ExperienceTechnical and operationalRisk management Governance and regulation Environmental and sustainability Business and strategy Leadership
Yvonne Themba
41
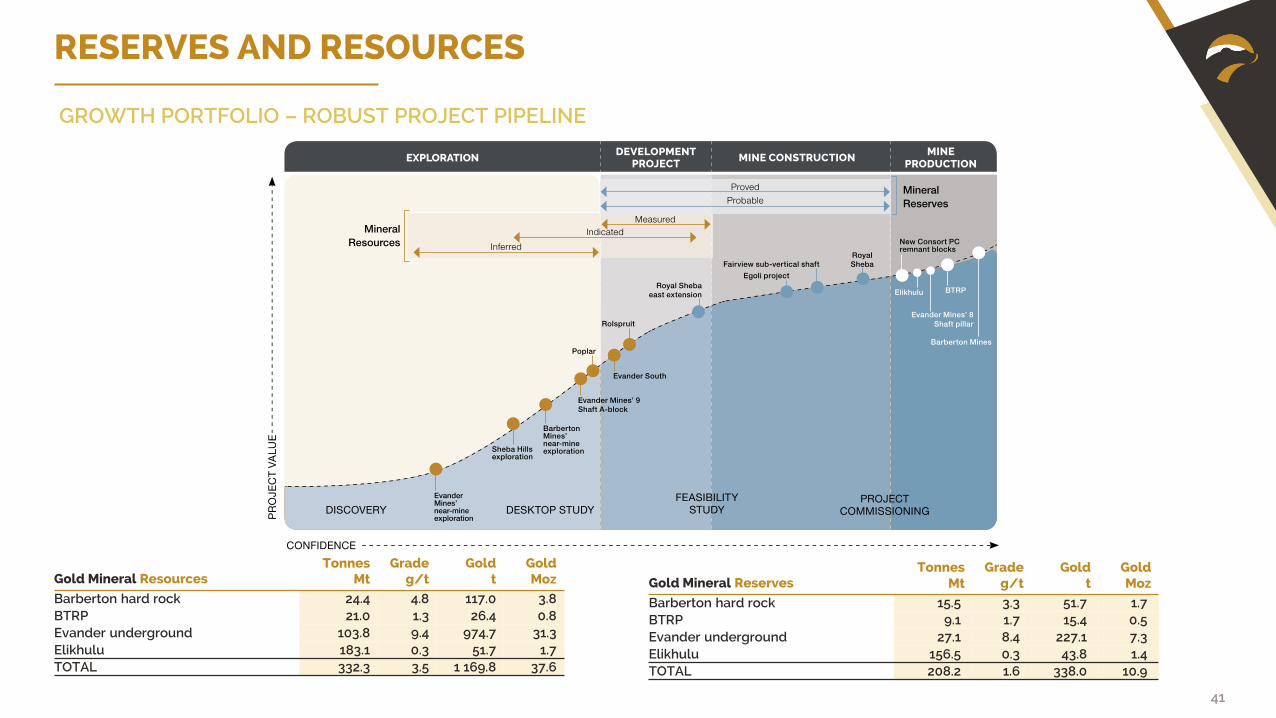
RESERVES AND RESOURCES
GROWTH PORTFOLIO – ROBUST PROJECT PIPELINE
Gold Mineral ResourcesTonnes
MtGrade
g/tGold
tGoldMoz
Barberton hard rock 24.4 4.8 117.0 3.8 BTRP 21.0 1.3 26.4 0.8 Evander underground 103.8 9.4 974.7 31.3 Elikhulu 183.1 0.3 51.7 1.7 TOTAL 332.3 3.5 1 169.8 37.6
Gold Mineral ReservesTonnes
MtGrade
g/tGold
tGoldMoz
Barberton hard rock 15.5 3.3 51.7 1.7 BTRP 9.1 1.7 15.4 0.5 Evander underground 27.1 8.4 227.1 7.3Elikhulu 156.5 0.3 43.8 1.4 TOTAL 208.2 1.6 338.0 10.9


![Investor Presentation - Revised [Company Update]](https://img.pdfslide.us/doc/110x75/577c84cd1a28abe054ba6996/investor-presentation-revised-company-update.jpg)
![Presentation for Investor Conference [Company Update]](https://img.pdfslide.us/doc/110x75/577c7c7b1a28abe0549ac786/presentation-for-investor-conference-company-update.jpg)
![Investor Presentation - October 2015 [Company Update]](https://img.pdfslide.us/doc/110x75/577cb10b1a28aba7118b79f0/investor-presentation-october-2015-company-update.jpg)

![Investor Presentation - February 2016 [Company Update]](https://img.pdfslide.us/doc/110x75/577c879f1a28abe054c4c05b/investor-presentation-february-2016-company-update.jpg)
![Investor Presentation & Results Press Release [Company Update]](https://img.pdfslide.us/doc/110x75/577ca7ad1a28abea748c82ed/investor-presentation-results-press-release-company-update.jpg)
![Analyst/ Institutional Investor Presentation [Company Update]](https://img.pdfslide.us/doc/110x75/577c7ba71a28abe0549824fd/analyst-institutional-investor-presentation-company-update.jpg)
![Results Press Release & Investor Presentation [Company Update]](https://img.pdfslide.us/doc/110x75/577ca5611a28abea748b80bd/results-press-release-investor-presentation-company-update.jpg)
![Investor presentation for Q2-2016 [Company Update]](https://img.pdfslide.us/doc/110x75/577ca7cd1a28abea748c90d1/investor-presentation-for-q2-2016-company-update.jpg)
![Investor Presentation / Intimation of investor conference [Company Update]](https://img.pdfslide.us/doc/110x75/577c7b771a28abe05497d5fd/investor-presentation-intimation-of-investor-conference-company-update.jpg)
![Analyst / Investor Meeting / Interaction - Presentation [Company Update]](https://img.pdfslide.us/doc/110x75/577c7a9d1a28abe05495a56e/analyst-investor-meeting-interaction-presentation-company-update.jpg)

![Investor Presentation [Company Update]](https://img.pdfslide.us/doc/110x75/577c844c1a28abe054b852c1/investor-presentation-company-update-578732b5a9c9e.jpg)
![Investor Presentation - February 2015 [Company Update]](https://img.pdfslide.us/doc/110x75/577c87a01a28abe054c4c28a/investor-presentation-february-2015-company-update.jpg)

![Investor Presentation - May 2016 [Company Update]](https://img.pdfslide.us/doc/110x75/577c7ac71a28abe054963a5e/investor-presentation-may-2016-company-update.jpg)
![Analyst / Investor Presentation [Company Update]](https://img.pdfslide.us/doc/110x75/577c7b161a28abe05497362a/analyst-investor-presentation-company-update.jpg)
![Investor Presentation - March 2015 [Company Update]](https://img.pdfslide.us/doc/110x75/577cb4871a28aba7118c7f75/investor-presentation-march-2015-company-update.jpg)
![Investor Update/ Presentation [Company Update]](https://img.pdfslide.us/doc/110x75/577ca57b1a28abea748b8d65/investor-update-presentation-company-update.jpg)
![Investor Presentation - January 2016 [Company Update]](https://img.pdfslide.us/doc/110x75/577ca5ff1a28abea748bb872/investor-presentation-january-2016-company-update-578a28a425aa8.jpg)

![Investor Conference - Presentation [Company Update]](https://img.pdfslide.us/doc/110x75/577c982e1a28ab163a8b47da/investor-conference-presentation-company-update.jpg)
![Investor/Analyst Presentation [Company Update]](https://img.pdfslide.us/doc/110x75/577ca56c1a28abea748b87af/investoranalyst-presentation-company-update.jpg)
![Investor Presentation - Analyst / Institutional Investor Meeting [Company Update]](https://img.pdfslide.us/doc/110x75/577c98301a28ab163a8b4855/investor-presentation-analyst-institutional-investor-meeting-company-update.jpg)