Embed Size (px)
Citation preview

Investor Presentation
January 2020

DISCLAIMER
Forward-Looking Statements
This presentation contains forward-looking statements within the meaning of the Private Securities Litigation Reform Act
of 1995. All statements other than statements of historical fact included in this presentation are forward-looking
statements. Forward-looking statements discuss our current expectations and projections relating to our financial
condition, results of operations, plans, objectives, future performance and business. These statements may be preceded
by, followed by or include the words “may,” “might,” “will,” “objective,” “intend,” “should,” “could,” “can,” “would,”
“expect,” “believe,” “design,” “estimate,” “predict,” “potential,” “plan” or the negatives thereof and other words and
terms of similar meaning. These statements are not guarantees of future performance and involve a number of known and
unknown risks, assumptions, trends, uncertainties and factors that are beyond our control, including without limitation,
those identified in our annual report on Form 10-K for the fiscal year ended January 1, 2019 filed on March 15, 2019 and
our quarterly reports on Form 10-Q, under the sections titled “Risk Factors,” “Cautionary Note Regarding Forward-Looking
Statements,” and “Management's Discussion and Analysis of Financial Condition and Results of Operations.” Should one or
more of these risks or uncertainties materialize or should underlying assumptions prove incorrect, actual results may
vary materially from those anticipated, estimated or projected. You should not place undue reliance on these statements.
We have based these forward-looking statements on our current expectations and projections about future events. Although
Noodles & Company ("we" or the "Company") believes that our assumptions made in connection with the forward-looking
statements are reasonable, we cannot assure you that the assumptions and expectations will prove to be correct. All
forward-looking statements speak only as of the date of this document. We undertake no obligations to update or revise
publicly any forward-looking statements in this presentation, whether as a result of new information, future events or
otherwise other than as required under the federal securities laws.
Note Regarding Non-GAAP Measures
In this presentation, we include certain supplemental financial measures, including EBITDA, Adjusted EBITDA, restaurant
contribution, and restaurant contribution margin, which are neither required by nor presented in accordance with
generally accepted accounting principles in the U.S. (“GAAP”). The presentation of this financial information is not
intended to be considered in isolation or as a substitute for, or to be superior to, the financial information prepared
and presented in accordance with GAAP. We use these non-GAAP financial measures for financial and operational decision
making and as a means to evaluate period-to-period comparisons. We believe that they provide useful information about
operating results, enhance the overall understanding of past financial performance and future prospects and allow for
greater transparency with respect to key metrics used by management in its financial and operational decision making.
You are cautioned, however, that these measures, as we calculate them, are not necessarily comparable to similarly
2

COMPANY SNAPSHOT
BRAND OVERVIEW 458 RESTAURANTS, ACROSS 30 STATES (1)
Founded: 1995
Headquarters: Broomfield, Colorado
LTM Total Revenue (1): $461 million
LTM Adjusted EBITDA (1)(2): $36 million
Systemwide Restaurants (1):
458 fast casual restaurants across 30
states– 391 Company-owned (85%)
– 67 franchised (15%)
Per Person Spend (3): $8.99
Average Unit Volume (1): $1.16 million
55% off-premise, 45% dine-inChannel Mix (4):
Company-Operated / Franchised
(1) As of LTM period ending October 1, 2019. States includes D.C.
(2) See appendix for Adjusted EBITDA calculation and reconciliation to GAAP metric.
(3) As of fiscal year ended January 1, 2019.
(4) As of the last of the quarter ended October 1, 2019.
3

INVESTMENT HIGHLIGHTS
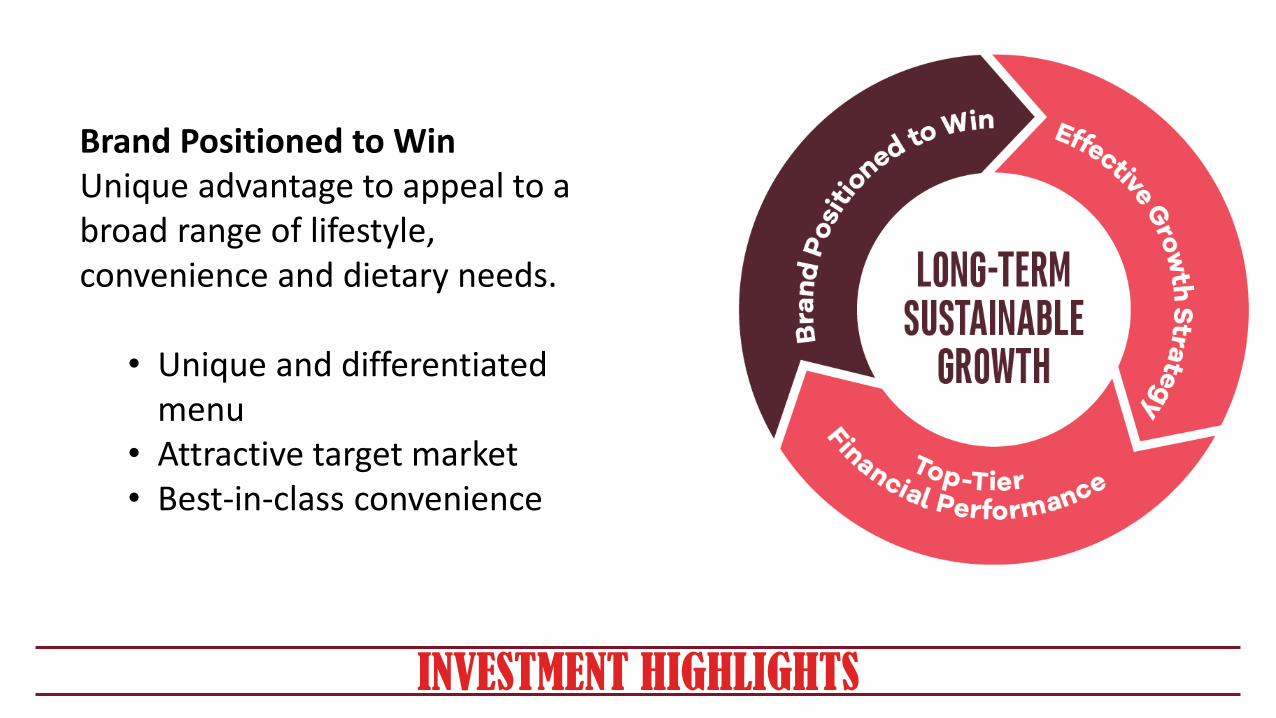
INVESTMENT HIGHLIGHTS
Brand Positioned to WinUnique advantage to appeal to a broad range of lifestyle, convenience and dietary needs.
• Unique and differentiated menu
• Attractive target market• Best-in-class convenience
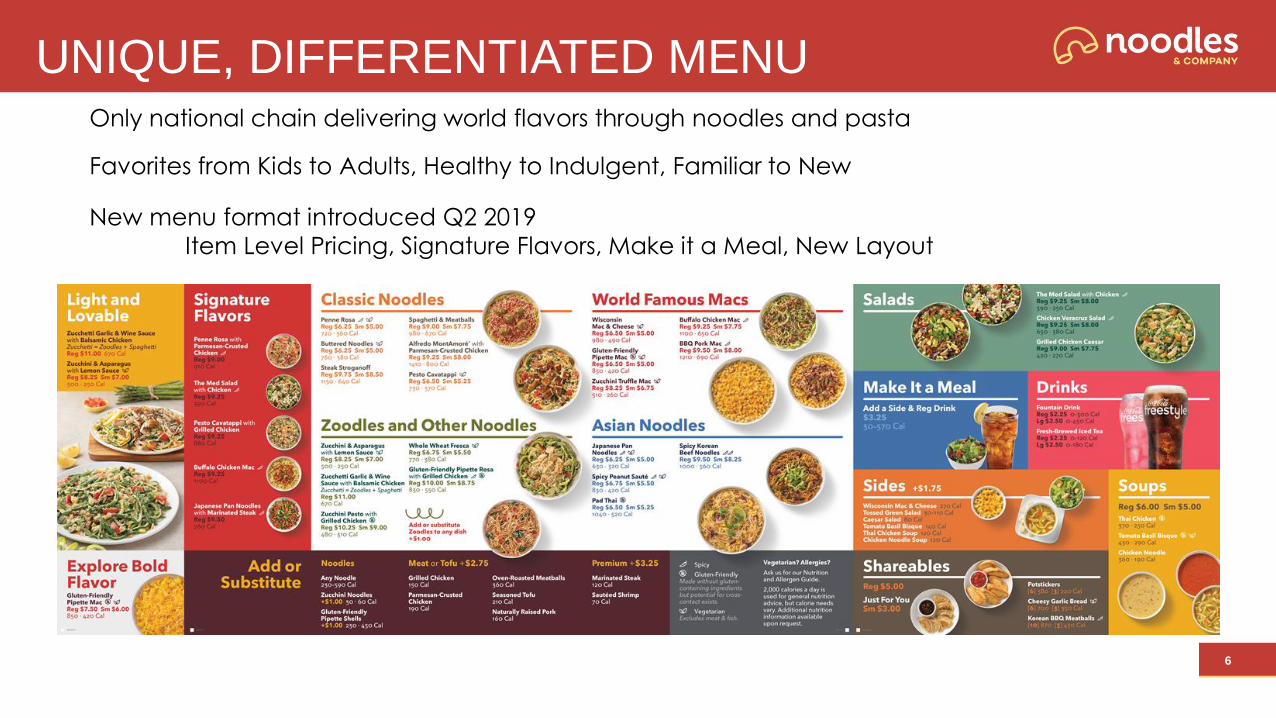
UNIQUE, DIFFERENTIATED MENU
6
Only national chain delivering world flavors through noodles and pasta
Favorites from Kids to Adults, Healthy to Indulgent, Familiar to New
New menu format introduced Q2 2019
Item Level Pricing, Signature Flavors, Make it a Meal, New Layout

ZUCCHINI NOODLE UNLOCKED LOW-CARB MARKET
7
Meets all major dietary preferences
- Low Carb
- Plant-based
- Gluten Free
Versatile – great as substitution in all dishes

Over-index on:
- Millennials and Generation Z
- Young families
- Females
- Higher educated and higher income
ATTRACTIVE TARGET MARKET
8
31%
21%
14%
34%
20% 21%
13%
47%
<$45k $45k-$75k $75k-$100k $100k+
Household Income
Fast Casual Average Noodles Guest Average
Source: NPD Market Monitor YE May ‘17
10%
41%
26%
16%
7%
14%
41%
25%
15%
5%
13-17 18-34 35-49 50-64 65+
Age
Fast Casual Average Noodles Guest Average
12%
24%
46%
19%
8%
22%
52%
19%
1 2 3 to 4 5+
Household Size
Fast Casual Average Noodles Guest Average

BEST-IN-CLASS CONVENIENCE
9
45%
48%50%
54%56% 56% 55%
Q3 '16 Q3 '17 Q3 '18 Q4 '18 Q1 '19 Q2 '19 Q3'19
OFF-PREMISE % OF SALES Q3 2019 SALES BY ORDER METHOD
- Uniquely positioned to meet increased demand for convenience
- Menu variety
- Menu items travel well
- Favorable price point and speed
- Significant delivery and catering expansion opportunity
31%
8%
15%
1%
45%
Takeout
Delivery
Online (Quick Pick-Up)
Catering
Dine-IN

INVESTMENT HIGHLIGHTS
Effective Growth StrategyDemonstrated path to higher average unit volume, expanded restaurant margin and new unit growth
• Average unit volume growth: Culinary, Off-Premise, and Digital Innovation
• Restaurant margin expansion• Unit growth opportunity

AUV GROWTH: CULINARY INNOVATION
11
Cauliflower Rigatoni – Launched 9/25
Redefining how guests view menu
Meets growing plant-based demand
Full serving of vegetables
Easily substitutable in all dishes

AUV GROWTH: OFF-PREMISE INNOVATION
12
Quick Pickup
- Throughput equalizer
- Incorporating windows in new units
Delivery
- Available in 99% of company locations; 7.6% of sales in Q3 2019
- Implemented premium pricing in early Q4 2019, direct delivery through digital channels
Catering
- Significant long-term growth opportunity; Anticipated 2020
relaunch- Reflects <2% of sales currently
- Differentiated offering with meaningful variety

AUV GROWTH: TECHNOLOGY INNOVATION
13
New Guest Engagement Platform (Q4 2019)
- Personalized experience
- Increased guest communication relevancy
- Simplified ordering process
New Rewards Program (Q4 2019)
- Deliver guest value
- Increased visibility into guest behavior
- Highly-targeted marketing to drive growth

OPERATING MODEL
14
Labor Efficiency
New kitchen prototype in process for 2020 launch
New back-of-house labor system implemented Q1 ’19
Investment in people to reduce turnover costs
Supply Chain
Increased discipline and visibility throughout organization
Improved approach to contract management and negotiation
Distribution optimization opportunity

UNIT GROWTH OPPORTUNITY
15
Disciplined Approach to Target of over 1,000 Units
- Target 5% annual unit growth in 2021
- Strict Adherence to economic & site criteria
- Focus on people to ensure execution
Improved New Unit Economics
- Incorporate more efficient kitchen layout
- Reduced square footage
- Target 30%+ cash-on-cash return
- Designed to maximize off-premise occasion
Increased Franchise Participation
- Recent momentum in franchise community
- More attractive economic model- Modest shift towards more aggressive franchise
growth vs. company

INVESTMENT HIGHLIGHTS
Top-Tier Financial PerformanceFinancial performance demonstrates the strategy is working
• Strong same-store sales• Improved restaurant margin• EBITDA growth and low balance
sheet leverage

SSS GROWTH AHEAD OF INDUSTRY AVERAGE
17
(0.2%)
0.7%
1.2% 1.4%
0.8%
0.2%
(0.4%)(0.2%)
5.4%
5.5%
4.0%
3.0%
4.6%
2.1%
Q1'18 Q2'18 Q3'18 Q4'18 Q1'19 Q2'19 Q3'19
Industry NDLS
SAME STORE SALES GROWTH(1,2)
(1) Represents systemwide SSS
(2) Black Box Industry Benchmark

LTM RESTAURANT-LEVEL MARGIN EXPANSION(1)
13.3%
14.2%
14.7%
14.8%
15.0% 15.0% 15.0%
15.4%
15.6%
Quarterly
Margin: 15.6% 15.1% 12.9% 15.5% 16.4% 15.2% 17.1%
70bps Quarter-over-Quarter
Improvement
12.6% 17.1%
IMPROVED EARNINGS AND MARGIN PROFILE
(1) Represents rolling LTM restaurant-level
contribution margin.
Improved Restaurant Level Margin
- Leverage on sales growth
- Effective cost management
Additional Margin Expansion Opportunity
- Supply chain discipline
- Distribution optimization
- Kitchen labor efficiency
18

$26 $31 $33 $36
$85
$58
$44 $42
2016 2017 2018 Q3 2019
Long-term Debt (in millions)
Adjusted EBITDA (in millions)
IMPROVED PERFORMANCE SUPPORTED BY STRONG
BALANCE SHEET
19
Q1 2017: $50MM Private Placement to Facilitate Closures of Underperforming Units & Payment of Data Breach Assessments
Q2/Q3 2018: Announcement of New Credit Facility; $25MM
Equity Capital Raise
Debt / EBITDA: 3.3X 1.9X 1.3X 1.2X

INVESTMENT HIGHLIGHTS
Brand Positioned to WinUnique advantage to appeal to a broad range of lifestyle, convenience and dietary needs
• Unique and differentiated menu• Best-in-class convenience• Growing target market
Top-Tier Financial PerformanceFinancial performance demonstrates the strategy is working
• Strong same-store sales• Improved restaurant margin• EBITDA growth and low leverage
Effective Growth StrategyDemonstrated path to higher average unit volume, expanded restaurant margin and new unit growth
• Average unit volume growth• Restaurant margin expansion• Thoughtful unit growth

APPENDIX

RESTAURANT CONTRIBUTION RECONCILIATION
22
Note: Restaurant contribution and restaurant contribution margin are non-GAAP measures that are neither required by, nor presented in accordance with GAAP. Restaurant
contribution represents restaurant revenue less restaurant operating costs which are cost of sales, labor, occupancy and other restaurant operating costs. Restaurant
contribution margin represents restaurant contribution as a percentage of restaurant revenue. The calculation of these measures may not be comparable to similar measures
reported by other companies. The presentation of restaurant contribution and restaurant contribution margin is not intended to be considered in isolation or as a
substitute for, or to be superior to, the financial information prepared and presented in accordance with GAAP. Management believes that restaurant contribution and
restaurant contribution margin are important tools for investors and other interested parties because they are widely-used metrics within the restaurant industry to
evaluate restaurant-level productivity, efficiency and performance. Management also uses restaurant contribution and restaurant contribution margin as metrics to
evaluate the profitability of incremental sales at our restaurants, restaurant performance across periods and restaurant financial performance compared with competitors.
(a) Restaurant impairments and closure costs in all periods presented above include amounts related to restaurants previously impaired or closed.

ADJUSTED EBITDA RECONCILIATION
23
Note: EBITDA and adjusted EBITDA are non-GAAP measures that are neither required by, nor presented in accordance with GAAP. We define EBITDA as net income (loss) before interest expense, provision
(benefit) for income taxes and depreciation and amortization. We define adjusted EBITDA as net income (loss) before interest expense, provision (benefit) for income taxes, depreciation and amortization,
restaurant impairments, closure costs and asset disposals, certain litigation settlements, non-recurring registration and related transaction costs, severance costs and stock-based compensation. The
calculation of these measures may not be comparable to similar measures reported by other companies. The presentation of EBITDA and adjusted EBITDA is not intended to be considered in isolation or as a
substitute for, or to be superior to, the financial information prepared and presented in accordance with GAAP. Management believes EBITDA and adjusted EBITDA provide clear pictures of our operating
results by eliminating certain non-recurring and non-cash expenses that may vary widely from period to period and are not reflective of the underlying business performance.
(a) Restaurant impairments and closure costs in all periods presented above include amounts related to restaurants previously impaired or closed.
(b) Fiscal year 2018 includes a charge of $3.4 million for the final settlement related to data breach liabilities, and a $0.3 million charge for a litigation settlement related to a Delaware gift card
matter. Fiscal year 2017 includes a gain on an employment-related litigation settlement due to final settlement being less than what the company had previously accrued. Fiscal year 2016 includes the
initial charge of $10.6 million for estimated losses associated with claims and anticipated claims by payment card companies from a data security incident and a $3.0 million charge for estimated costs
of the employment-related litigation settlement.
(c) Fiscal year 2018 includes the loss on extinguishment of debt, which resulted from writing off certain remaining unamortized balances of debt issuance costs related to the outstanding indebtedness with
Bank of America, N.A. when it was repaid in full in the second quarter of 2018.
(d) The third quarter of 2019 included expenses related to transaction and acquisition costs. The first three quarters of 2019 included acquisition costs related to the purchase of one franchise
restaurant and transaction costs. The first three quarters of 2019 included expenses related to the registration statement the Company filed in 2018.
(e) The third quarter of 2019 and first three quarters of 2019 and 2018 included severance costs from departmental structural changes.