Embed Size (px)
Citation preview
Ambit Capital and / or its affiliates do and seek to do business including investment banking with companies covered in its research reports. As a result, investors should be aware that Ambit Capital may have a conflict of interest that could affect the objectivity of this report. Investors should not consider this report as the only factor in making their investment decision.
Key financials
Year to March FY14 FY15 FY16E FY17E FY18E
Net Interest Income (̀ mn) 28,907 34,203 43,114 54,222 67,004
Operating Profits (` mn) 25,960 30,982 40,179 50,591 63,478
Net Profits (` mn) 14,080 17,937 23,059 29,363 37,206
EPS (`) 26.8 33.9 39.1 49.8 63.1
RoA (%) 1.76% 1.84% 1.88% 1.91% 1.94%
RoE (%) 17.6% 19.0% 17.4% 15.9% 17.4%
P/B (x) 5.74 4.88 3.22 2.81 2.43
Source: Company, Ambit Capital research
Benchmarking IIB to HDFC Bank
With IndusInd Bank’s consistent execution record and share price outperformance over last year, we compare IIB with a mature franchise that has similar businesses – HDFC Bank – to understand IIB’s evolution. We believe IIB’s CASA ratio is likely to increase gradually over FY16-17 due to its rapid branch expansion. IIB’s assets franchise is becoming more granular but its strengths in core vehicle finance may actually be a tailwind in the current stage of the cycle. IIB’s large guarantees business stands out vis-à-vis HDFCB but return on RWA suggests fair risk-reward. We believe IIB’s superior earnings growth will continue to support its premium valuation. We are BUYers with a TP of `1,075 (17x FY18E EPS).
Competitive position: MODERATE Changes to this position: STABLE Branch expansion to drive CASA gain IIB has significantly closed the gap with HDFCB on the CASA ratio, with IIB’s CASA ratio at 35% as of 1HFY16 vs HDFCB’s 40%. Even as competition for low-cost deposits is set to intensify in the coming years, IIB’s tailored approach to branch openings and customer segmentation along with rapid network expansion will continue to drive its CASA growth. We expect IIB to deliver CASA growth of 28% over FY15-17, with the CASA ratio reaching 36% by FY17E. A strong assets side of balance sheet, becoming more granular By introducing/scaling-up various retail products such as cars, tractors, two-wheelers, credit cards and mortgages, IIB is bridging the gap with HDFCB on asset diversification. Non-vehicle retail loans now form 20% of retail book (vs 10% two years ago) and vehicle finance form 33% of loans (vs 44% two years ago). A high proportion of the fixed rate diversified loan book (72% of the loans are fixed rate) implies that IIB is well placed to protect NIM during the downwards rate cycle. Whilst asset quality risk is contained with low exposure to stressed sectors (~16% of loans vs peers’ ~26%), rising exposure to real estate/construction could face challenges with the softening real estate sector. Superior fee income; favourable risk-reward in non-fund business IIB’s fee income has expanded at 34% CAGR over the last three years vs HDFCB’s 12%. Also, IIB’s fee income to asset ratio of 2.3% is superior to HDFCB’s 1.4% partly driven by a larger non-fund-based business. However, fee income and risk weights, seen as a percentage of total exposure, suggest that the bank is not taking undue risk to earn this fee income, an issue which has been a major concern for many investors. Premium valuation underpinned by robust growth Overall, IIB is moving in the right direction on most parameters, when benchmarked with HDFCB. The valuation (19x FY17E EPS) fairly reflects the execution track record along with the growth and profitability outlook. We expect superior earnings growth (FY15-18E CAGR of 23%) to drive share price return. We are BUYers with a December ’16 target price of `1,075 (unchanged).
COMPANY INSIGHT IIB IN EQUITY December 02, 2015
IndusInd BankBUY
BFSI
Recommendation Mcap (bn): `559/US$8.4 6M ADV (mn): `1,053/US$15.8 CMP: `943 TP (12 mths): `1,075 Upside (%): 14
Flags Accounting: GREEN Predictability: GREEN Earnings Momentum: GREEN
Catalysts
Continued loan growth of 25% over FY15-18E
Stable margins at 3.7%
EPS CAGR of 23% (FY15-18E)
Performance (%)
Source: Bloomberg, Ambit Capital research
80
95
110
125
Dec
-14
Feb-
15
Apr
-15
Jun-
15
Aug
-15
Oct
-15
Dec
-15
IIB IN SENSEX
Analyst Details
Ravi Singh
+91 22 3043 3181
Pankaj Agarwal, CFA
+91 22 3043 3206 [email protected]
Aadesh Mehta, CFA +91 22 3043 3239
IndusInd BankIndusInd Bank
December 02, 2015 Ambit Capital Pvt. Ltd. Page 2
CONTENTS
A credible track record ………………………………………………………………..3
CASA: Network expansion to continue driving gains ……………………………6
Striving for granularity on the assets side ………………………………………..9
Fee income: IIB scores over HDFC Bank ……………………………………….13
Cost efficiency drives a large part of the gap on profitability …………………15
Moving in the right direction; growth to drive share price return ……………17
Key assumptions and estimates ………………………………………………….18
IndusInd BankIndusInd Bank
December 02, 2015 Ambit Capital Pvt. Ltd. Page 3
A credible track record We initiated coverage on IndusInd Bank in December 2014 (click here), with the following factors highlighted as likely catalysts for earnings growth and hence share price performance:
Improving growth in the bank’s core vehicle finance business and market share gain in corporate loans leading to loan growth being superior to industry growth (24% CAGR in loan book over FY15-17E vs 28% CAGR over FY11-14)
Continued improvement on the low-cost deposits franchise supporting NIMs (FY15-17E NIMs staying stable at the FY14 level of ~3.7%)
Diversified fee income streams leading to sustained fee income momentum (23% CAGR over FY15-17E vs 41% CAGR over FY11-14)
Stable asset quality performance with credit cost of ~70bps over FY15-17E vs 76bps in FY14 and 64bps in FY13
The bank’s performance in the previous four quarters has been broadly in line with our expectations:
Loan book growth was at 25% YoY, on an average, with YoY growth in consumer finance loan book (led by CV loans) improving to 23% in 2QFY16 vs 7% in 2QFY15.
CA and SA balances reported an average growth of 24% YoY and 32% YoY over the last one year, with the CASA ratio improving to 34.7% as at end-2QFY16 vs 33.9% as at end-2QFY15.
Fee income growth was at 24% YoY on an average, with third-party product distribution income (up 47% YoY) compensating for lower growth in general banking (14% YoY), forex (18% YoY) and trade fees (18% YoY).
Barring, a couple of lumpy slippages in 4QFY15 (4 corporate accounts worth `4.2bn sold to asset reconstruction companies), asset quality has been broadly stable, with total stressed assets (including outstanding security receipts) at 1.7% of loans vs 1.6%, as at end-2QFY15, and average credit cost of 61bps during the last four quarters.
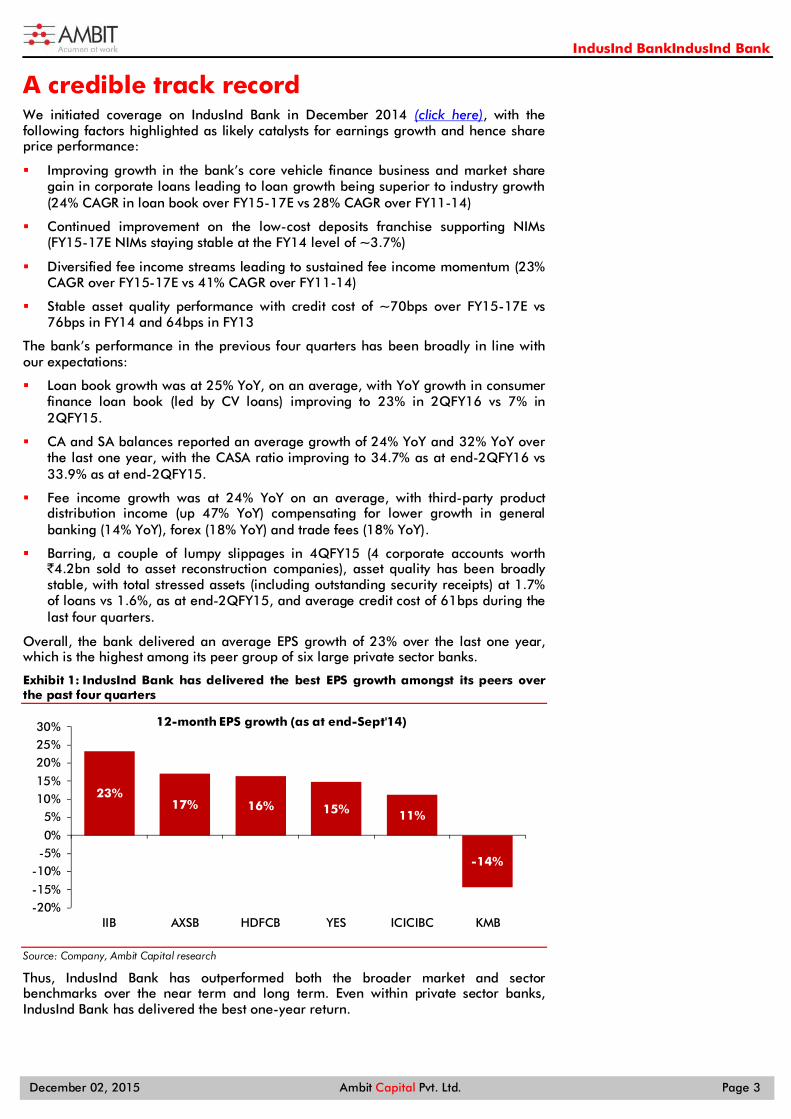
Overall, the bank delivered an average EPS growth of 23% over the last one year, which is the highest among its peer group of six large private sector banks.
Exhibit 1: IndusInd Bank has delivered the best EPS growth amongst its peers over the past four quarters
Source: Company, Ambit Capital research
Thus, IndusInd Bank has outperformed both the broader market and sector benchmarks over the near term and long term. Even within private sector banks, IndusInd Bank has delivered the best one-year return.
23%17% 16% 15% 11%
-14%
-20%-15%
-10%-5%0%
5%10%15%
20%25%30%
IIB AXSB HDFCB YES ICICIBC KMB
12-month EPS growth (as at end-Sept'14)
IndusInd BankIndusInd Bank
December 02, 2015 Ambit Capital Pvt. Ltd. Page 4
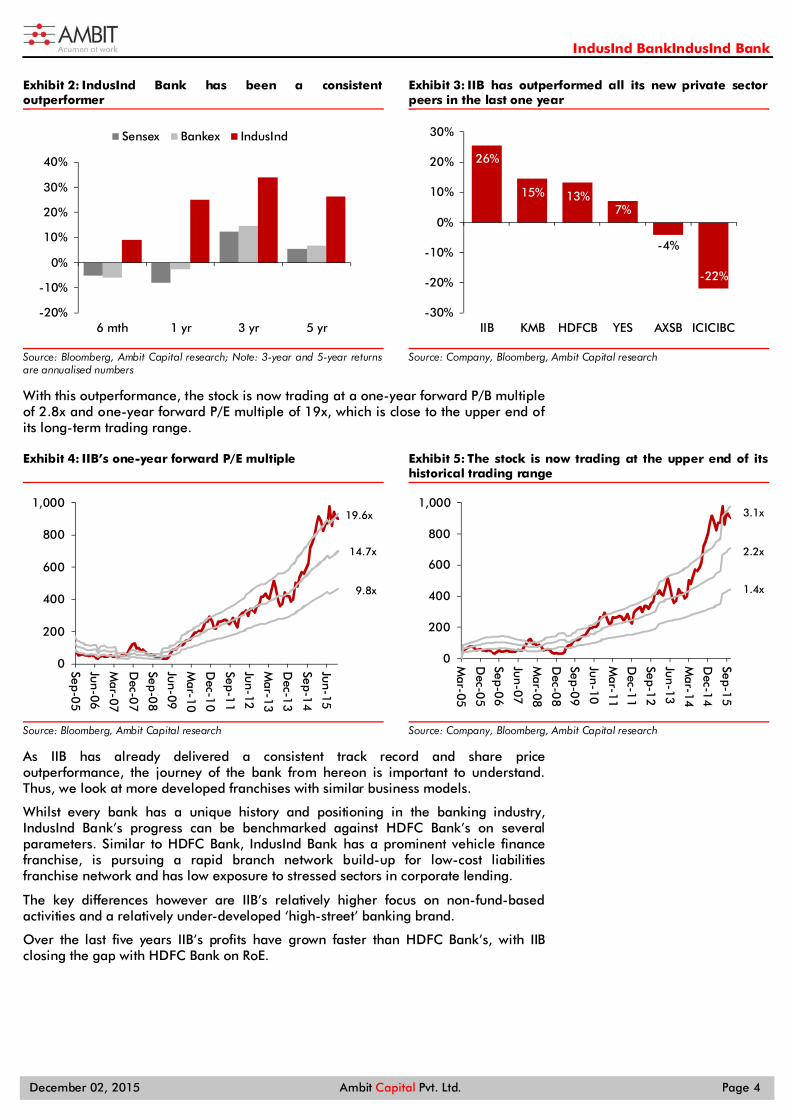
Exhibit 2: IndusInd Bank has been a consistent outperformer
Source: Bloomberg, Ambit Capital research; Note: 3-year and 5-year returns are annualised numbers
Exhibit 3: IIB has outperformed all its new private sector peers in the last one year
Source: Company, Bloomberg, Ambit Capital research
With this outperformance, the stock is now trading at a one-year forward P/B multiple of 2.8x and one-year forward P/E multiple of 19x, which is close to the upper end of its long-term trading range.
Exhibit 4: IIB’s one-year forward P/E multiple
Source: Bloomberg, Ambit Capital research
Exhibit 5: The stock is now trading at the upper end of its historical trading range
Source: Company, Bloomberg, Ambit Capital research
As IIB has already delivered a consistent track record and share price outperformance, the journey of the bank from hereon is important to understand. Thus, we look at more developed franchises with similar business models.
Whilst every bank has a unique history and positioning in the banking industry, IndusInd Bank’s progress can be benchmarked against HDFC Bank’s on several parameters. Similar to HDFC Bank, IndusInd Bank has a prominent vehicle finance franchise, is pursuing a rapid branch network build-up for low-cost liabilities franchise network and has low exposure to stressed sectors in corporate lending.
The key differences however are IIB’s relatively higher focus on non-fund-based activities and a relatively under-developed ‘high-street’ banking brand.
Over the last five years IIB’s profits have grown faster than HDFC Bank’s, with IIB closing the gap with HDFC Bank on RoE.
-20%
-10%
0%
10%
20%
30%
40%
6 mth 1 yr 3 yr 5 yr
Sensex Bankex IndusInd
26%
15% 13%7%
-4%
-22%
-30%
-20%
-10%
0%
10%
20%
30%
IIB KMB HDFCB YES AXSB ICICIBC
0
200
400
600
800
1,000
Sep-05
Jun-06
Mar-07
Dec-0
7
Sep-08
Jun-09
Mar-10
Dec-1
0
Sep-11
Jun-12
Mar-13
Dec-1
3
Sep-14
Jun-15
19.6x
14.7x
9.8x
0
200
400
600
800
1,000
Mar-05
Dec-0
5
Sep-06
Jun-07
Mar-08
Dec-0
8
Sep-09
Jun-10
Mar-11
Dec-1
1
Sep-12
Jun-13
Mar-14
Dec-1
4
Sep-15
3.1x
2.2x
1.4x
IndusInd BankIndusInd Bank
December 02, 2015 Ambit Capital Pvt. Ltd. Page 5
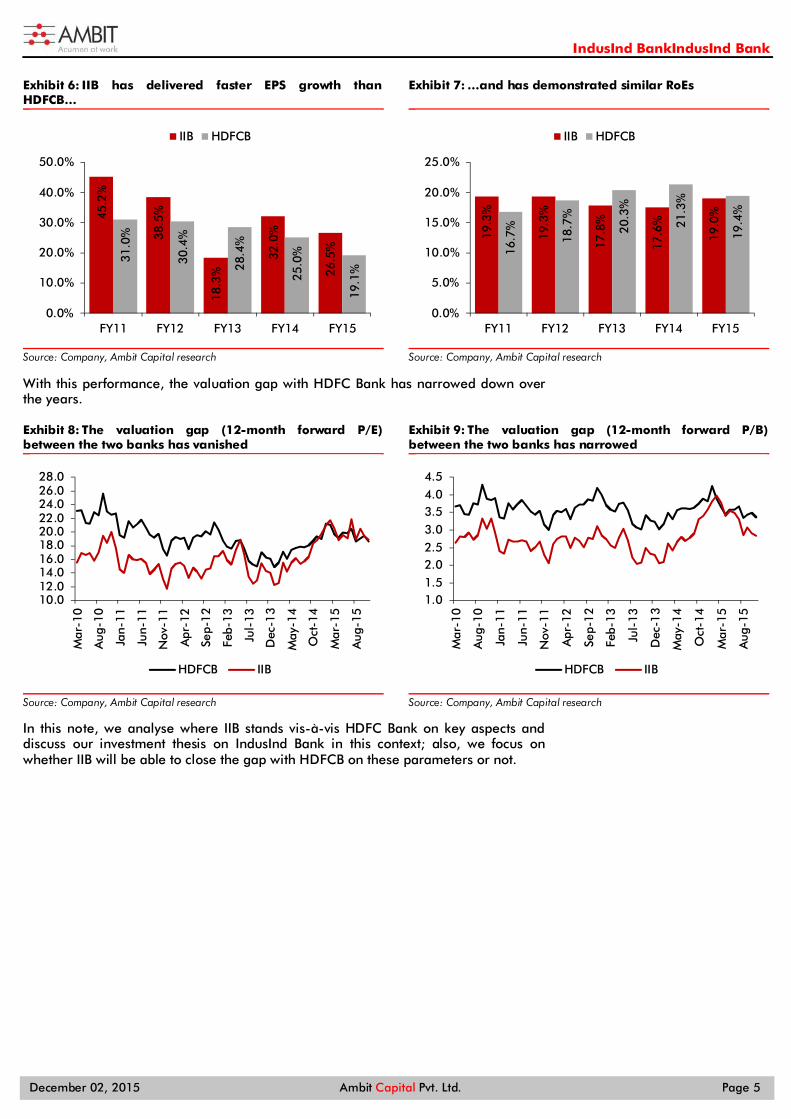
Exhibit 6: IIB has delivered faster EPS growth than HDFCB…
Source: Company, Ambit Capital research
Exhibit 7: …and has demonstrated similar RoEs
Source: Company, Ambit Capital research
With this performance, the valuation gap with HDFC Bank has narrowed down over the years.
Exhibit 8: The valuation gap (12-month forward P/E) between the two banks has vanished
Source: Company, Ambit Capital research
Exhibit 9: The valuation gap (12-month forward P/B) between the two banks has narrowed
Source: Company, Ambit Capital research
In this note, we analyse where IIB stands vis-à-vis HDFC Bank on key aspects and discuss our investment thesis on IndusInd Bank in this context; also, we focus on whether IIB will be able to close the gap with HDFCB on these parameters or not.
45.2
%
38.5
%
18.3
%
32.0
%
26.5
%
31.0
%
30.4
%
28.4
%
25.0
%
19.1
%
0.0%
10.0%
20.0%
30.0%
40.0%
50.0%
FY11 FY12 FY13 FY14 FY15
IIB HDFCB
19.3
%
19.3
%
17.8
%
17.6
%
19.0
%
16.7
%
18.7
%
20.3
%
21.3
%
19.4
%
0.0%
5.0%
10.0%
15.0%
20.0%
25.0%
FY11 FY12 FY13 FY14 FY15
IIB HDFCB
10.012.014.016.018.020.022.024.026.028.0
Mar
-10
Aug
-10
Jan-
11
Jun-
11
Nov
-11
Apr
-12
Sep-
12
Feb-
13
Jul-
13
Dec
-13
May
-14
Oct
-14
Mar
-15
Aug
-15
HDFCB IIB
1.01.52.02.53.03.54.04.5
Mar
-10
Aug
-10
Jan-
11
Jun-
11
Nov
-11
Apr
-12
Sep-
12
Feb-
13
Jul-
13
Dec
-13
May
-14
Oct
-14
Mar
-15
Aug
-15
HDFCB IIB
IndusInd BankIndusInd Bank
December 02, 2015 Ambit Capital Pvt. Ltd. Page 6
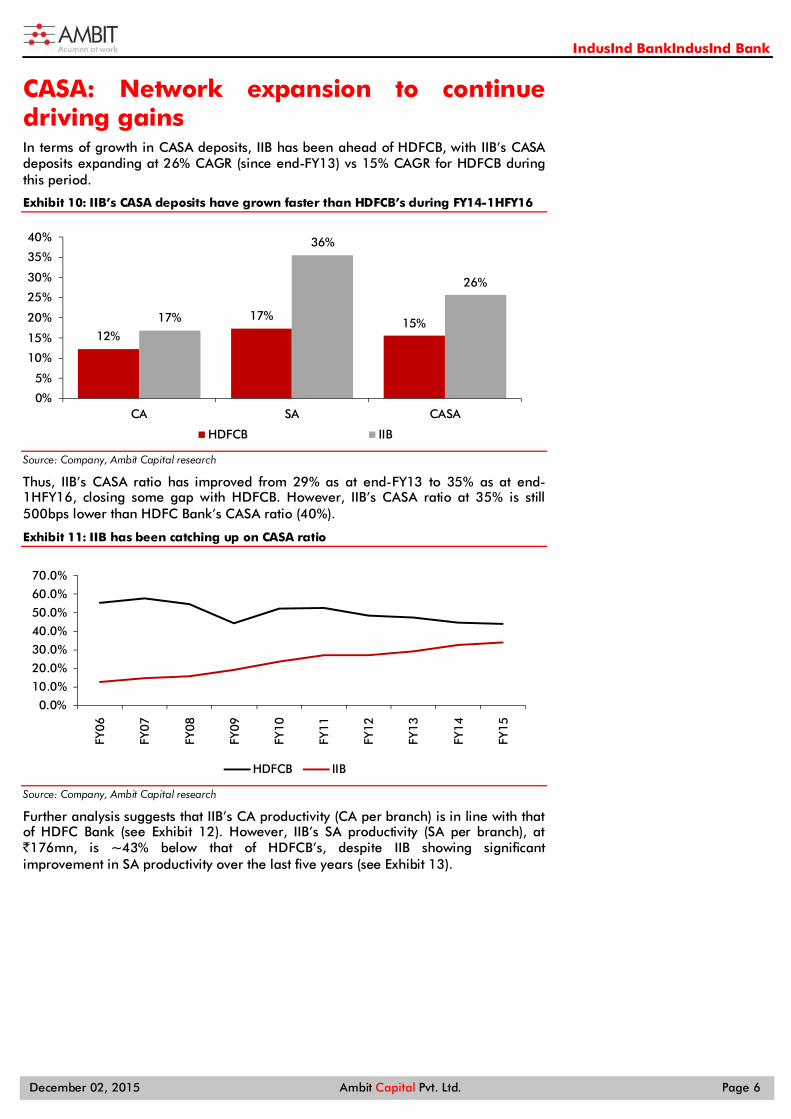
CASA: Network expansion to continue driving gains In terms of growth in CASA deposits, IIB has been ahead of HDFCB, with IIB’s CASA deposits expanding at 26% CAGR (since end-FY13) vs 15% CAGR for HDFCB during this period.
Exhibit 10: IIB’s CASA deposits have grown faster than HDFCB’s during FY14-1HFY16
Source: Company, Ambit Capital research
Thus, IIB’s CASA ratio has improved from 29% as at end-FY13 to 35% as at end-1HFY16, closing some gap with HDFCB. However, IIB’s CASA ratio at 35% is still 500bps lower than HDFC Bank’s CASA ratio (40%).
Exhibit 11: IIB has been catching up on CASA ratio
Source: Company, Ambit Capital research
Further analysis suggests that IIB’s CA productivity (CA per branch) is in line with that of HDFC Bank (see Exhibit 12). However, IIB’s SA productivity (SA per branch), at `176mn, is ~43% below that of HDFCB’s, despite IIB showing significant improvement in SA productivity over the last five years (see Exhibit 13).
12%
17%15%17%
36%
26%
0%
5%
10%
15%
20%
25%
30%
35%
40%
CA SA CASA
HDFCB IIB
0.0%
10.0%
20.0%
30.0%
40.0%
50.0%
60.0%
70.0%
FY0
6
FY0
7
FY0
8
FY0
9
FY1
0
FY1
1
FY1
2
FY1
3
FY1
4
FY1
5
HDFCB IIB
IndusInd BankIndusInd Bank
December 02, 2015 Ambit Capital Pvt. Ltd. Page 7
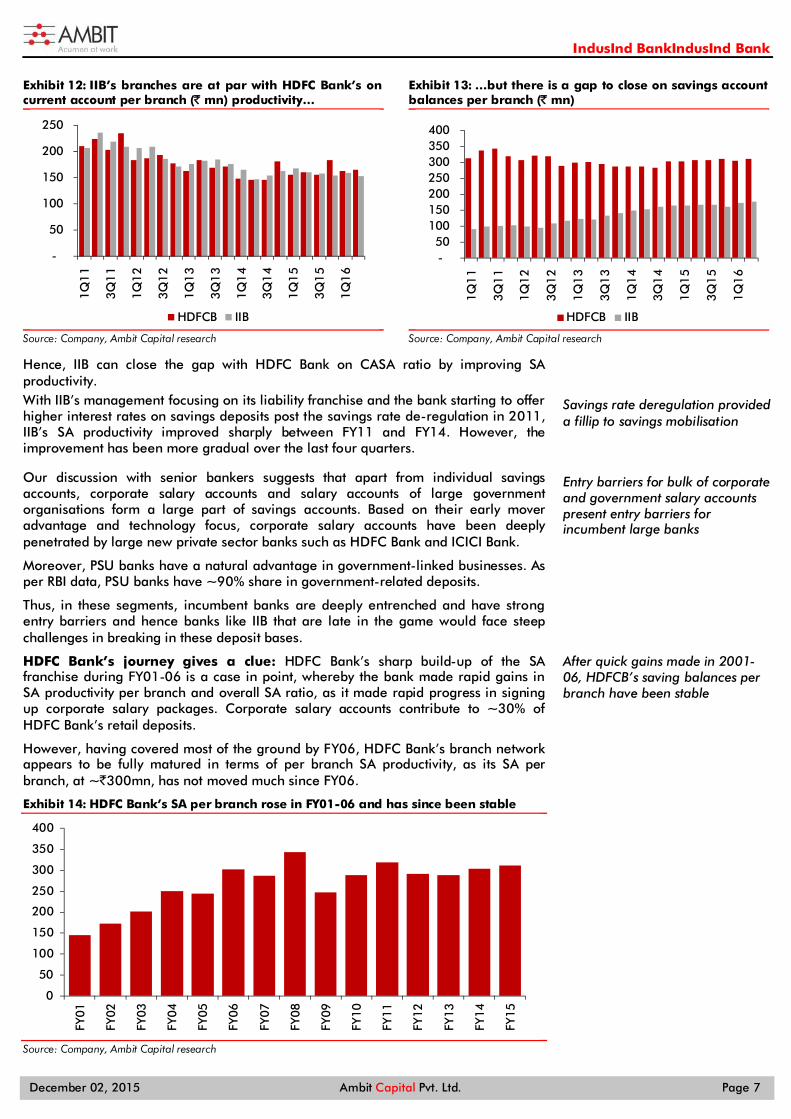
Exhibit 12: IIB’s branches are at par with HDFC Bank’s on current account per branch (` mn) productivity…
Source: Company, Ambit Capital research
Exhibit 13: …but there is a gap to close on savings account balances per branch (` mn)
Source: Company, Ambit Capital research
Hence, IIB can close the gap with HDFC Bank on CASA ratio by improving SA productivity. With IIB’s management focusing on its liability franchise and the bank starting to offer higher interest rates on savings deposits post the savings rate de-regulation in 2011, IIB’s SA productivity improved sharply between FY11 and FY14. However, the improvement has been more gradual over the last four quarters.
Our discussion with senior bankers suggests that apart from individual savings accounts, corporate salary accounts and salary accounts of large government organisations form a large part of savings accounts. Based on their early mover advantage and technology focus, corporate salary accounts have been deeply penetrated by large new private sector banks such as HDFC Bank and ICICI Bank.
Moreover, PSU banks have a natural advantage in government-linked businesses. As per RBI data, PSU banks have ~90% share in government-related deposits.
Thus, in these segments, incumbent banks are deeply entrenched and have strong entry barriers and hence banks like IIB that are late in the game would face steep challenges in breaking in these deposit bases.
HDFC Bank’s journey gives a clue: HDFC Bank’s sharp build-up of the SA franchise during FY01-06 is a case in point, whereby the bank made rapid gains in SA productivity per branch and overall SA ratio, as it made rapid progress in signing up corporate salary packages. Corporate salary accounts contribute to ~30% of HDFC Bank’s retail deposits.
However, having covered most of the ground by FY06, HDFC Bank’s branch network appears to be fully matured in terms of per branch SA productivity, as its SA per branch, at ~`300mn, has not moved much since FY06.
Exhibit 14: HDFC Bank’s SA per branch rose in FY01-06 and has since been stable
Source: Company, Ambit Capital research
-
50
100
150
200
250
1Q
11
3Q
11
1Q
12
3Q
12
1Q
13
3Q
13
1Q
14
3Q
14
1Q
15
3Q
15
1Q
16
HDFCB IIB
- 50
100 150 200 250 300 350 400
1Q
11
3Q
11
1Q
12
3Q
12
1Q
13
3Q
13
1Q
14
3Q
14
1Q
15
3Q
15
1Q
16
HDFCB IIB
0
50
100
150
200
250
300
350
400
FY01
FY02
FY03
FY04
FY05
FY06
FY07
FY08
FY09
FY10
FY11
FY12
FY13
FY14
FY15
Savings rate deregulation provided a fillip to savings mobilisation
Entry barriers for bulk of corporate and government salary accounts present entry barriers for incumbent large banks
After quick gains made in 2001-06, HDFCB’s saving balances per branch have been stable
IndusInd BankIndusInd Bank
December 02, 2015 Ambit Capital Pvt. Ltd. Page 8
However, IndusInd Bank is likely to find it relatively difficult to grow its savings franchise through corporate salary accounts/salaried class customers and government/government-owned entities.
The MD&CEO, during the 1QFY16 results, stated, “…we are not such a big bank on Salaries because I think Salaried are either high transactors…” and “…We are a low transactor but high balances because I do the Business Owner segment, I do not do the Salary segment, I am not such a big player on the Salary segment….”
Hence, the segment in which IIB has scope to grow its SA balances is the small business owners segment which is relatively untapped. IIB’s branch expansion strategy seems to be geared towards this, with it focusing on specific centres in certain geographies (which it calls ‘home markets’) and the limited presence in large metros (just to serve the needs of its segmented corporate/SME customers).
IIB’s branch expansion strategy in such ‘home markets’ is geared towards emerging as a ‘next door bank’ and achieving at least 5% market share by opening ~15 branches with one centralised big branch and smaller branches (‘hub and spoke’ model). This strategy helps in covering a particular market well with controlled costs. The bank currently has six such home markets already and is in the process of developing six more home markets. Further, the management highlighted that six more centres have been identified with the potential to be developed as the bank’s home markets. Thus, by 2017, the bank expects to have at least 15 home markets with ~250 branches. We expect IIB to continue expanding its branch network by ~22% per year during FY16-17E (vs 28% CAGR between FY11 and FY15), without stressing its cost ratios. With marginal improvement in CASA per branch, we expect CASA deposits to expand at 28% CAGR. With the overall balance sheet expanding at ~25% CAGR, this will lead to the CASA ratio inching up to 36% by end-FY17.
Key risk factor - Competition from new banks: In addition to the two universal banks launched in recent months, 11 payments banks and 10 small finance banks will set up shop in the coming year and will compete in the liabilities market. Mandated to build a low-cost liabilities franchise as soon as possible to ensure long-term sustainability, these banks are likely to intensely compete on rates and services offered to liabilities customers and raise overall competitive intensity even from existing banks. Thus, before these players gain significant size in the next 2-3 years, it makes sense for IIB to continue expanding its branch network and strengthen its own CASA franchise. However, some loss of income over the long term, due to higher rates on savings deposits and pressure on certain fee income streams (e.g., payments and remittances) is inevitable and strengths on the assets side would be the key for IndusInd Bank to build stickier customer relationships and protect its niche in the banking landscape.
IIB’s strategy acknowledges the challenge on salaried customers
Focused approach towards developing ‘home markets’ Serving primarily specific customer segments in main cities
Even as branch productivity rises gradually, the pace of branch expansion will continue to drive the CASA ratio
Competitive intensity to rise due to new banks, leading to some loss of income, but differentiation on the assets side is a key opportunity
IndusInd BankIndusInd Bank
December 02, 2015 Ambit Capital Pvt. Ltd. Page 9
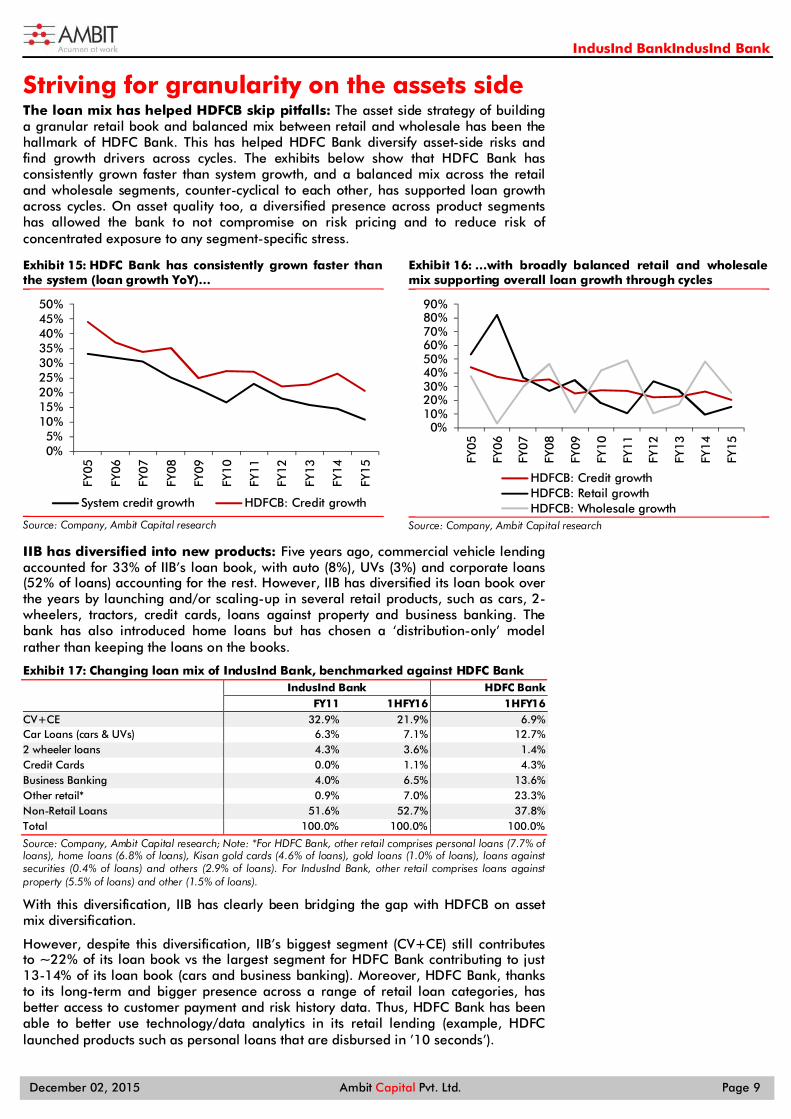
Striving for granularity on the assets side The loan mix has helped HDFCB skip pitfalls: The asset side strategy of building a granular retail book and balanced mix between retail and wholesale has been the hallmark of HDFC Bank. This has helped HDFC Bank diversify asset-side risks and find growth drivers across cycles. The exhibits below show that HDFC Bank has consistently grown faster than system growth, and a balanced mix across the retail and wholesale segments, counter-cyclical to each other, has supported loan growth across cycles. On asset quality too, a diversified presence across product segments has allowed the bank to not compromise on risk pricing and to reduce risk of concentrated exposure to any segment-specific stress.
Exhibit 15: HDFC Bank has consistently grown faster than the system (loan growth YoY)…
Source: Company, Ambit Capital research
Exhibit 16: …with broadly balanced retail and wholesale mix supporting overall loan growth through cycles
Source: Company, Ambit Capital research
IIB has diversified into new products: Five years ago, commercial vehicle lending accounted for 33% of IIB’s loan book, with auto (8%), UVs (3%) and corporate loans (52% of loans) accounting for the rest. However, IIB has diversified its loan book over the years by launching and/or scaling-up in several retail products, such as cars, 2-wheelers, tractors, credit cards, loans against property and business banking. The bank has also introduced home loans but has chosen a ‘distribution-only’ model rather than keeping the loans on the books.
Exhibit 17: Changing loan mix of IndusInd Bank, benchmarked against HDFC Bank IndusInd Bank HDFC Bank
FY11 1HFY16 1HFY16 CV+CE 32.9% 21.9% 6.9% Car Loans (cars & UVs) 6.3% 7.1% 12.7% 2 wheeler loans 4.3% 3.6% 1.4% Credit Cards 0.0% 1.1% 4.3% Business Banking 4.0% 6.5% 13.6% Other retail* 0.9% 7.0% 23.3% Non-Retail Loans 51.6% 52.7% 37.8% Total 100.0% 100.0% 100.0%
Source: Company, Ambit Capital research; Note: *For HDFC Bank, other retail comprises personal loans (7.7% of loans), home loans (6.8% of loans), Kisan gold cards (4.6% of loans), gold loans (1.0% of loans), loans against securities (0.4% of loans) and others (2.9% of loans). For IndusInd Bank, other retail comprises loans against property (5.5% of loans) and other (1.5% of loans).
With this diversification, IIB has clearly been bridging the gap with HDFCB on asset mix diversification.
However, despite this diversification, IIB’s biggest segment (CV+CE) still contributes to ~22% of its loan book vs the largest segment for HDFC Bank contributing to just 13-14% of its loan book (cars and business banking). Moreover, HDFC Bank, thanks to its long-term and bigger presence across a range of retail loan categories, has better access to customer payment and risk history data. Thus, HDFC Bank has been able to better use technology/data analytics in its retail lending (example, HDFC launched products such as personal loans that are disbursed in ’10 seconds’).
0%5%
10%15%20%25%30%35%40%45%50%
FY05
FY06
FY07
FY08
FY09
FY10
FY11
FY12
FY13
FY14
FY15
System credit growth HDFCB: Credit growth
0%10%20%30%40%50%60%70%80%90%
FY05
FY06
FY07
FY08
FY09
FY10
FY11
FY12
FY13
FY14
FY15
HDFCB: Credit growthHDFCB: Retail growthHDFCB: Wholesale growth
IndusInd BankIndusInd Bank
December 02, 2015 Ambit Capital Pvt. Ltd. Page 10
Whilst IndusInd Bank too has a track record of launching innovative technology offerings (e.g. virtual/video branch and unique ATM services), most of these have been in customer servicing and liability products and not necessarily in building an assets book.
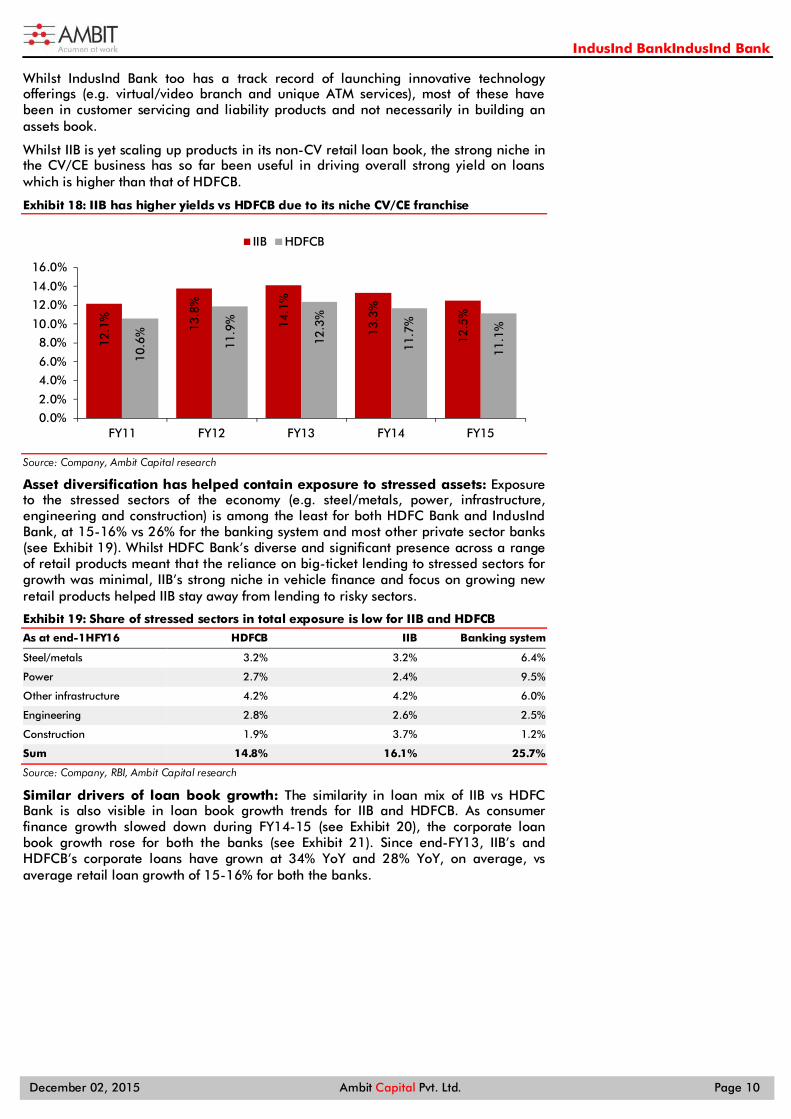
Whilst IIB is yet scaling up products in its non-CV retail loan book, the strong niche in the CV/CE business has so far been useful in driving overall strong yield on loans which is higher than that of HDFCB.
Exhibit 18: IIB has higher yields vs HDFCB due to its niche CV/CE franchise
Source: Company, Ambit Capital research
Asset diversification has helped contain exposure to stressed assets: Exposure to the stressed sectors of the economy (e.g. steel/metals, power, infrastructure, engineering and construction) is among the least for both HDFC Bank and IndusInd Bank, at 15-16% vs 26% for the banking system and most other private sector banks (see Exhibit 19). Whilst HDFC Bank’s diverse and significant presence across a range of retail products meant that the reliance on big-ticket lending to stressed sectors for growth was minimal, IIB’s strong niche in vehicle finance and focus on growing new retail products helped IIB stay away from lending to risky sectors.
Exhibit 19: Share of stressed sectors in total exposure is low for IIB and HDFCB
As at end-1HFY16 HDFCB IIB Banking system
Steel/metals 3.2% 3.2% 6.4%
Power 2.7% 2.4% 9.5%
Other infrastructure 4.2% 4.2% 6.0%
Engineering 2.8% 2.6% 2.5%
Construction 1.9% 3.7% 1.2%
Sum 14.8% 16.1% 25.7%
Source: Company, RBI, Ambit Capital research
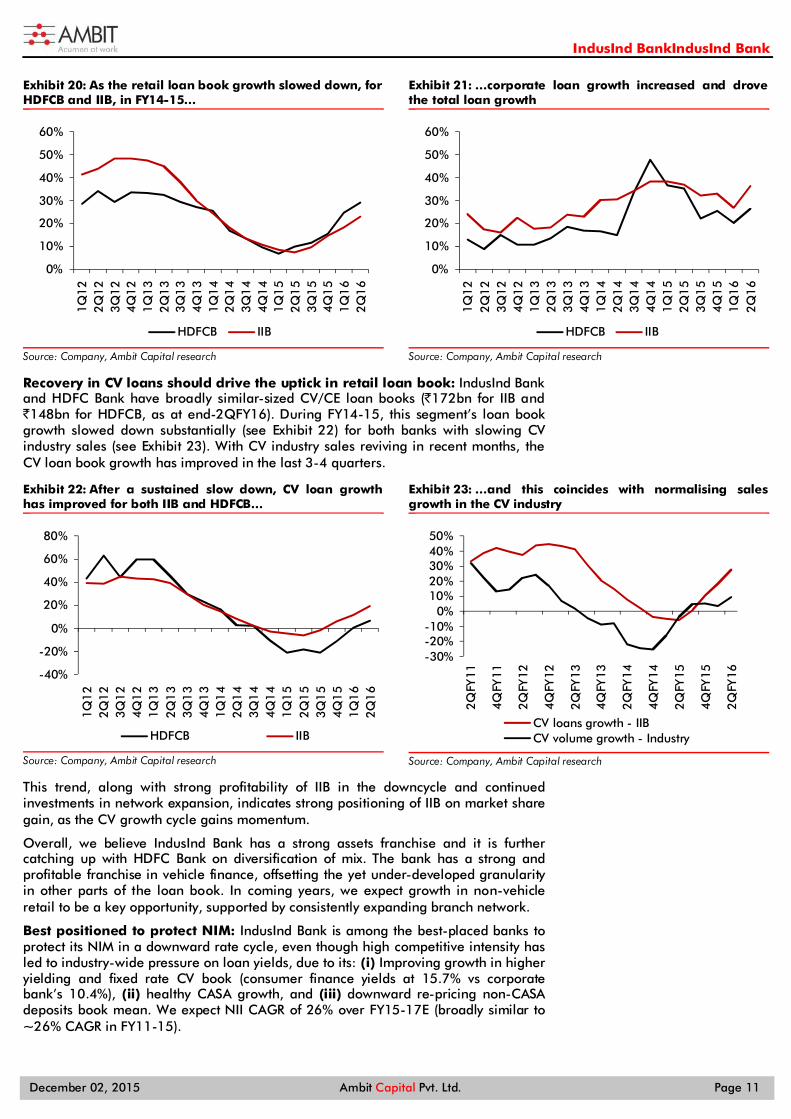
Similar drivers of loan book growth: The similarity in loan mix of IIB vs HDFC Bank is also visible in loan book growth trends for IIB and HDFCB. As consumer finance growth slowed down during FY14-15 (see Exhibit 20), the corporate loan book growth rose for both the banks (see Exhibit 21). Since end-FY13, IIB’s and HDFCB’s corporate loans have grown at 34% YoY and 28% YoY, on average, vs average retail loan growth of 15-16% for both the banks.
12.1
%
13.8
%
14.1
%
13.3
%
12.5
%
10.6
%
11.9
%
12.3
%
11.7
%
11.1
%
0.0%
2.0%
4.0%
6.0%
8.0%
10.0%
12.0%
14.0%
16.0%
FY11 FY12 FY13 FY14 FY15
IIB HDFCB
IndusInd BankIndusInd Bank
December 02, 2015 Ambit Capital Pvt. Ltd. Page 11
Exhibit 20: As the retail loan book growth slowed down, for HDFCB and IIB, in FY14-15…
Source: Company, Ambit Capital research
Exhibit 21: …corporate loan growth increased and drove the total loan growth
Source: Company, Ambit Capital research
Recovery in CV loans should drive the uptick in retail loan book: IndusInd Bank and HDFC Bank have broadly similar-sized CV/CE loan books (`172bn for IIB and `148bn for HDFCB, as at end-2QFY16). During FY14-15, this segment’s loan book growth slowed down substantially (see Exhibit 22) for both banks with slowing CV industry sales (see Exhibit 23). With CV industry sales reviving in recent months, the CV loan book growth has improved in the last 3-4 quarters.
Exhibit 22: After a sustained slow down, CV loan growth has improved for both IIB and HDFCB…
Source: Company, Ambit Capital research
Exhibit 23: …and this coincides with normalising sales growth in the CV industry
Source: Company, Ambit Capital research
This trend, along with strong profitability of IIB in the downcycle and continued investments in network expansion, indicates strong positioning of IIB on market share gain, as the CV growth cycle gains momentum.
Overall, we believe IndusInd Bank has a strong assets franchise and it is further catching up with HDFC Bank on diversification of mix. The bank has a strong and profitable franchise in vehicle finance, offsetting the yet under-developed granularity in other parts of the loan book. In coming years, we expect growth in non-vehicle retail to be a key opportunity, supported by consistently expanding branch network.
Best positioned to protect NIM: IndusInd Bank is among the best-placed banks to protect its NIM in a downward rate cycle, even though high competitive intensity has led to industry-wide pressure on loan yields, due to its: (i) Improving growth in higher yielding and fixed rate CV book (consumer finance yields at 15.7% vs corporate bank’s 10.4%), (ii) healthy CASA growth, and (iii) downward re-pricing non-CASA deposits book mean. We expect NII CAGR of 26% over FY15-17E (broadly similar to ~26% CAGR in FY11-15).
0%
10%
20%
30%
40%
50%
60%
1Q
12
2Q
12
3Q
12
4Q
12
1Q
13
2Q
13
3Q
13
4Q
13
1Q
14
2Q
14
3Q
14
4Q
14
1Q
15
2Q
15
3Q
15
4Q
15
1Q
16
2Q
16
HDFCB IIB
0%
10%
20%
30%
40%
50%
60%
1Q
12
2Q
12
3Q
12
4Q
12
1Q
13
2Q
13
3Q
13
4Q
13
1Q
14
2Q
14
3Q
14
4Q
14
1Q
15
2Q
15
3Q
15
4Q
15
1Q
16
2Q
16
HDFCB IIB
-40%
-20%
0%
20%
40%
60%
80%
1Q
12
2Q
12
3Q
12
4Q
12
1Q
13
2Q
13
3Q
13
4Q
13
1Q
14
2Q
14
3Q
14
4Q
14
1Q
15
2Q
15
3Q
15
4Q
15
1Q
16
2Q
16
HDFCB IIB
-30%-20%-10%
0%10%20%30%40%50%
2QFY
11
4QFY
11
2QFY
12
4QFY
12
2QFY
13
4QFY
13
2QFY
14
4QFY
14
2QFY
15
4QFY
15
2QFY
16CV loans growth - IIBCV volume growth - Industry
IndusInd BankIndusInd Bank
December 02, 2015 Ambit Capital Pvt. Ltd. Page 12
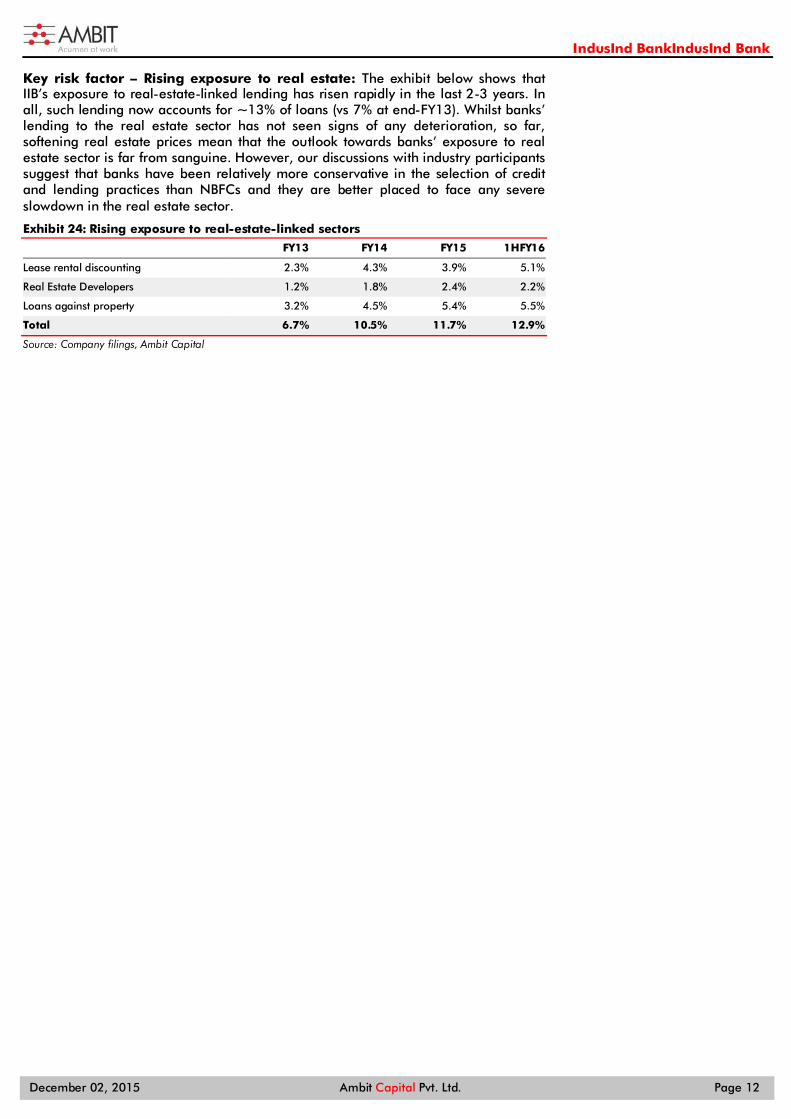
Key risk factor – Rising exposure to real estate: The exhibit below shows that IIB’s exposure to real-estate-linked lending has risen rapidly in the last 2-3 years. In all, such lending now accounts for ~13% of loans (vs 7% at end-FY13). Whilst banks’ lending to the real estate sector has not seen signs of any deterioration, so far, softening real estate prices mean that the outlook towards banks’ exposure to real estate sector is far from sanguine. However, our discussions with industry participants suggest that banks have been relatively more conservative in the selection of credit and lending practices than NBFCs and they are better placed to face any severe slowdown in the real estate sector.
Exhibit 24: Rising exposure to real-estate-linked sectors
FY13 FY14 FY15 1HFY16
Lease rental discounting 2.3% 4.3% 3.9% 5.1%
Real Estate Developers 1.2% 1.8% 2.4% 2.2%
Loans against property 3.2% 4.5% 5.4% 5.5%
Total 6.7% 10.5% 11.7% 12.9%
Source: Company filings, Ambit Capital
IndusInd BankIndusInd Bank
December 02, 2015 Ambit Capital Pvt. Ltd. Page 13
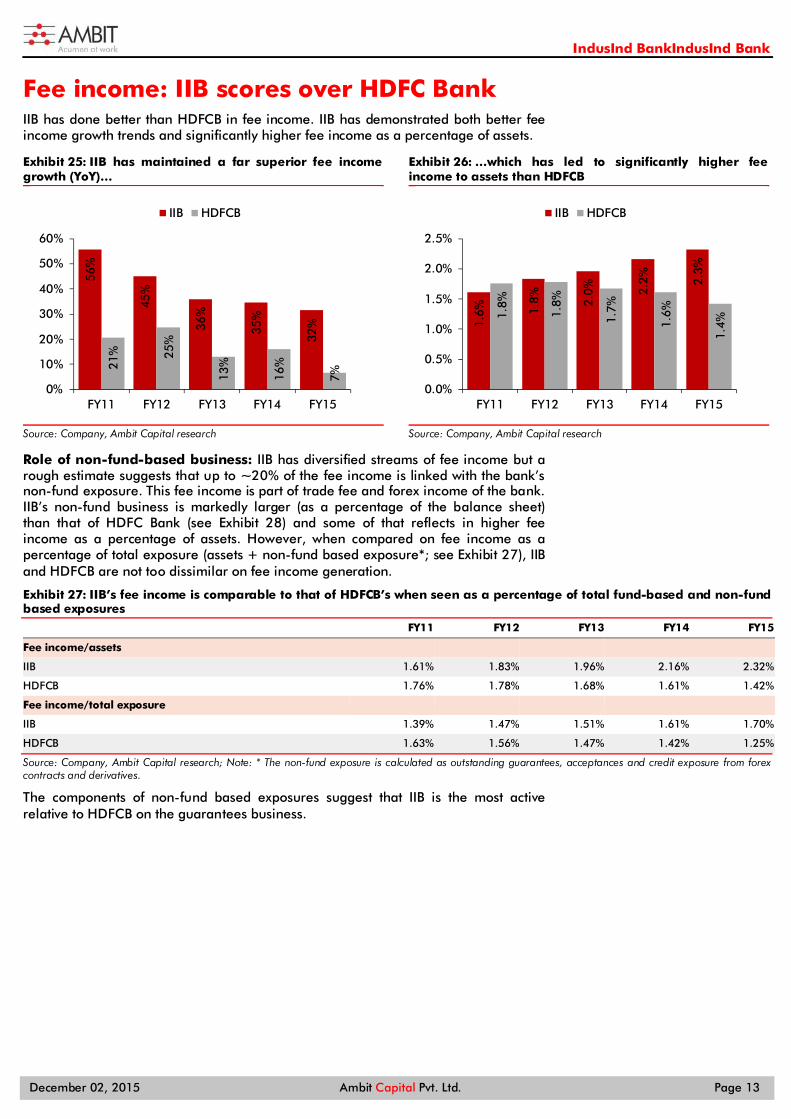
Fee income: IIB scores over HDFC Bank IIB has done better than HDFCB in fee income. IIB has demonstrated both better fee income growth trends and significantly higher fee income as a percentage of assets.
Exhibit 25: IIB has maintained a far superior fee income growth (YoY)…
Source: Company, Ambit Capital research
Exhibit 26: …which has led to significantly higher fee income to assets than HDFCB
Source: Company, Ambit Capital research
Role of non-fund-based business: IIB has diversified streams of fee income but a rough estimate suggests that up to ~20% of the fee income is linked with the bank’s non-fund exposure. This fee income is part of trade fee and forex income of the bank. IIB’s non-fund business is markedly larger (as a percentage of the balance sheet) than that of HDFC Bank (see Exhibit 28) and some of that reflects in higher fee income as a percentage of assets. However, when compared on fee income as a percentage of total exposure (assets + non-fund based exposure*; see Exhibit 27), IIB and HDFCB are not too dissimilar on fee income generation.
Exhibit 27: IIB’s fee income is comparable to that of HDFCB’s when seen as a percentage of total fund-based and non-fund based exposures
FY11 FY12 FY13 FY14 FY15
Fee income/assets
IIB 1.61% 1.83% 1.96% 2.16% 2.32%
HDFCB 1.76% 1.78% 1.68% 1.61% 1.42%
Fee income/total exposure IIB 1.39% 1.47% 1.51% 1.61% 1.70%
HDFCB 1.63% 1.56% 1.47% 1.42% 1.25%
Source: Company, Ambit Capital research; Note: * The non-fund exposure is calculated as outstanding guarantees, acceptances and credit exposure from forex contracts and derivatives.
The components of non-fund based exposures suggest that IIB is the most active relative to HDFCB on the guarantees business.
56%
45%
36%
35%
32%
21% 25
%
13%
16%
7%
0%
10%
20%
30%
40%
50%
60%
FY11 FY12 FY13 FY14 FY15
IIB HDFCB
1.6% 1.
8% 2.0% 2.
2% 2.3%
1.8%
1.8%
1.7%
1.6%
1.4%
0.0%
0.5%
1.0%
1.5%
2.0%
2.5%
FY11 FY12 FY13 FY14 FY15
IIB HDFCB
IndusInd BankIndusInd Bank
December 02, 2015 Ambit Capital Pvt. Ltd. Page 14
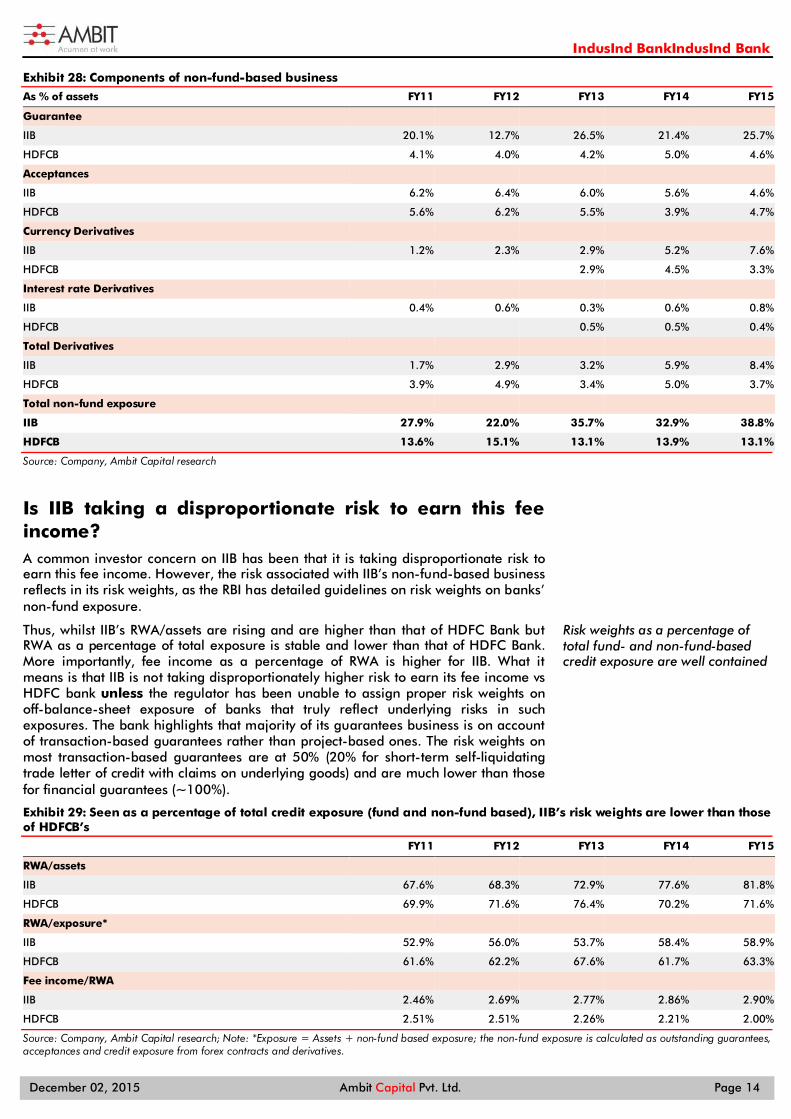
Exhibit 28: Components of non-fund-based business
As % of assets FY11 FY12 FY13 FY14 FY15
Guarantee
IIB 20.1% 12.7% 26.5% 21.4% 25.7%
HDFCB 4.1% 4.0% 4.2% 5.0% 4.6%
Acceptances IIB 6.2% 6.4% 6.0% 5.6% 4.6%
HDFCB 5.6% 6.2% 5.5% 3.9% 4.7%
Currency Derivatives IIB 1.2% 2.3% 2.9% 5.2% 7.6%
HDFCB 2.9% 4.5% 3.3%
Interest rate Derivatives IIB 0.4% 0.6% 0.3% 0.6% 0.8%
HDFCB 0.5% 0.5% 0.4%
Total Derivatives IIB 1.7% 2.9% 3.2% 5.9% 8.4%
HDFCB 3.9% 4.9% 3.4% 5.0% 3.7%
Total non-fund exposure IIB 27.9% 22.0% 35.7% 32.9% 38.8%
HDFCB 13.6% 15.1% 13.1% 13.9% 13.1%
Source: Company, Ambit Capital research
Is IIB taking a disproportionate risk to earn this fee income? A common investor concern on IIB has been that it is taking disproportionate risk to earn this fee income. However, the risk associated with IIB’s non-fund-based business reflects in its risk weights, as the RBI has detailed guidelines on risk weights on banks’ non-fund exposure.
Thus, whilst IIB’s RWA/assets are rising and are higher than that of HDFC Bank but RWA as a percentage of total exposure is stable and lower than that of HDFC Bank. More importantly, fee income as a percentage of RWA is higher for IIB. What it means is that IIB is not taking disproportionately higher risk to earn its fee income vs HDFC bank unless the regulator has been unable to assign proper risk weights on off-balance-sheet exposure of banks that truly reflect underlying risks in such exposures. The bank highlights that majority of its guarantees business is on account of transaction-based guarantees rather than project-based ones. The risk weights on most transaction-based guarantees are at 50% (20% for short-term self-liquidating trade letter of credit with claims on underlying goods) and are much lower than those for financial guarantees (~100%).
Exhibit 29: Seen as a percentage of total credit exposure (fund and non-fund based), IIB’s risk weights are lower than those of HDFCB’s
FY11 FY12 FY13 FY14 FY15
RWA/assets
IIB 67.6% 68.3% 72.9% 77.6% 81.8%
HDFCB 69.9% 71.6% 76.4% 70.2% 71.6%
RWA/exposure* IIB 52.9% 56.0% 53.7% 58.4% 58.9%
HDFCB 61.6% 62.2% 67.6% 61.7% 63.3%
Fee income/RWA
IIB 2.46% 2.69% 2.77% 2.86% 2.90%
HDFCB 2.51% 2.51% 2.26% 2.21% 2.00%
Source: Company, Ambit Capital research; Note: *Exposure = Assets + non-fund based exposure; the non-fund exposure is calculated as outstanding guarantees, acceptances and credit exposure from forex contracts and derivatives.
Risk weights as a percentage of total fund- and non-fund-based credit exposure are well contained
IndusInd BankIndusInd Bank
December 02, 2015 Ambit Capital Pvt. Ltd. Page 15
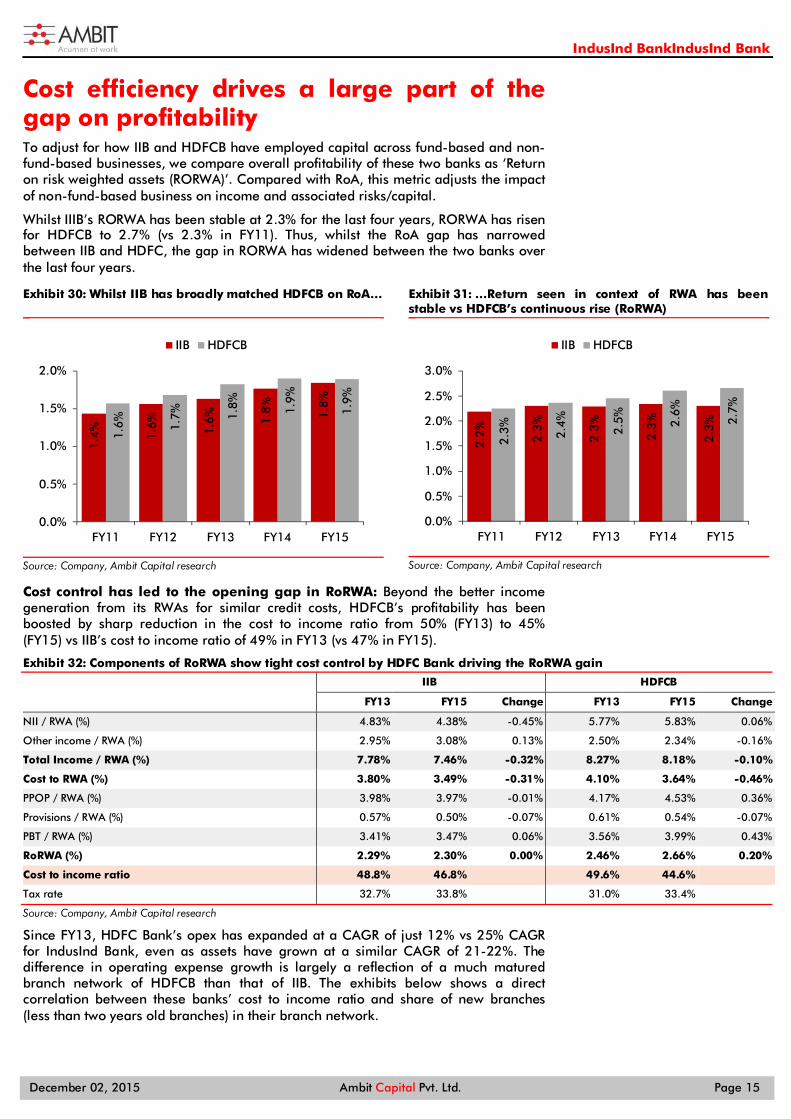
Cost efficiency drives a large part of the gap on profitability To adjust for how IIB and HDFCB have employed capital across fund-based and non-fund-based businesses, we compare overall profitability of these two banks as ‘Return on risk weighted assets (RORWA)’. Compared with RoA, this metric adjusts the impact of non-fund-based business on income and associated risks/capital.
Whilst IIIB’s RORWA has been stable at 2.3% for the last four years, RORWA has risen for HDFCB to 2.7% (vs 2.3% in FY11). Thus, whilst the RoA gap has narrowed between IIB and HDFC, the gap in RORWA has widened between the two banks over the last four years.
Exhibit 30: Whilst IIB has broadly matched HDFCB on RoA…
Source: Company, Ambit Capital research
Exhibit 31: …Return seen in context of RWA has been stable vs HDFCB’s continuous rise (RoRWA)
Source: Company, Ambit Capital research
Cost control has led to the opening gap in RoRWA: Beyond the better income generation from its RWAs for similar credit costs, HDFCB’s profitability has been boosted by sharp reduction in the cost to income ratio from 50% (FY13) to 45% (FY15) vs IIB’s cost to income ratio of 49% in FY13 (vs 47% in FY15).
Exhibit 32: Components of RoRWA show tight cost control by HDFC Bank driving the RoRWA gain
IIB HDFCB
FY13 FY15 Change FY13 FY15 Change
NII / RWA (%) 4.83% 4.38% -0.45% 5.77% 5.83% 0.06%
Other income / RWA (%) 2.95% 3.08% 0.13% 2.50% 2.34% -0.16%
Total Income / RWA (%) 7.78% 7.46% -0.32% 8.27% 8.18% -0.10%
Cost to RWA (%) 3.80% 3.49% -0.31% 4.10% 3.64% -0.46%
PPOP / RWA (%) 3.98% 3.97% -0.01% 4.17% 4.53% 0.36%
Provisions / RWA (%) 0.57% 0.50% -0.07% 0.61% 0.54% -0.07%
PBT / RWA (%) 3.41% 3.47% 0.06% 3.56% 3.99% 0.43%
RoRWA (%) 2.29% 2.30% 0.00% 2.46% 2.66% 0.20%
Cost to income ratio 48.8% 46.8% 49.6% 44.6% Tax rate 32.7% 33.8% 31.0% 33.4% Source: Company, Ambit Capital research
Since FY13, HDFC Bank’s opex has expanded at a CAGR of just 12% vs 25% CAGR for IndusInd Bank, even as assets have grown at a similar CAGR of 21-22%. The difference in operating expense growth is largely a reflection of a much matured branch network of HDFCB than that of IIB. The exhibits below shows a direct correlation between these banks’ cost to income ratio and share of new branches (less than two years old branches) in their branch network.
1.4% 1.
6% 1.6% 1.
8% 1.8%
1.6% 1.
7% 1.8% 1.9%
1.9%
0.0%
0.5%
1.0%
1.5%
2.0%
FY11 FY12 FY13 FY14 FY15
IIB HDFCB
2.2% 2.3%
2.3%
2.3%
2.3%
2.3% 2.4% 2.5% 2.
6%
2.7%
0.0%
0.5%
1.0%
1.5%
2.0%
2.5%
3.0%
FY11 FY12 FY13 FY14 FY15
IIB HDFCB
IndusInd BankIndusInd Bank
December 02, 2015 Ambit Capital Pvt. Ltd. Page 16
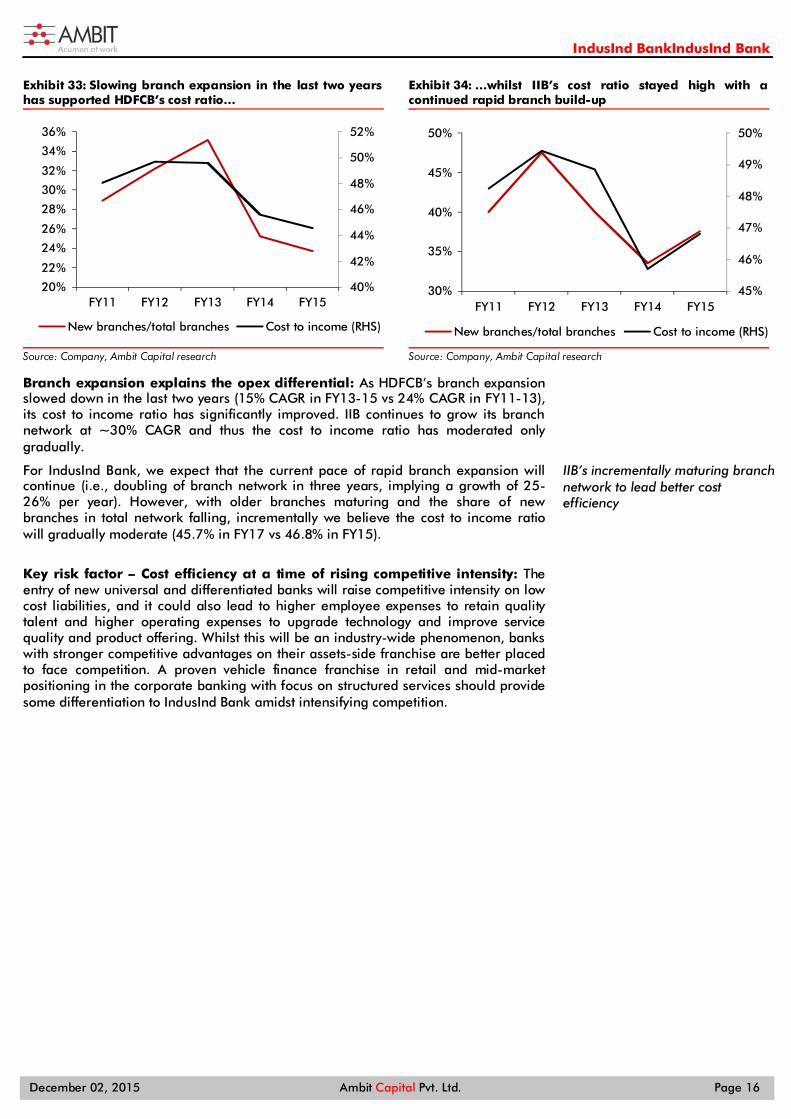
Exhibit 33: Slowing branch expansion in the last two years has supported HDFCB’s cost ratio…
Source: Company, Ambit Capital research
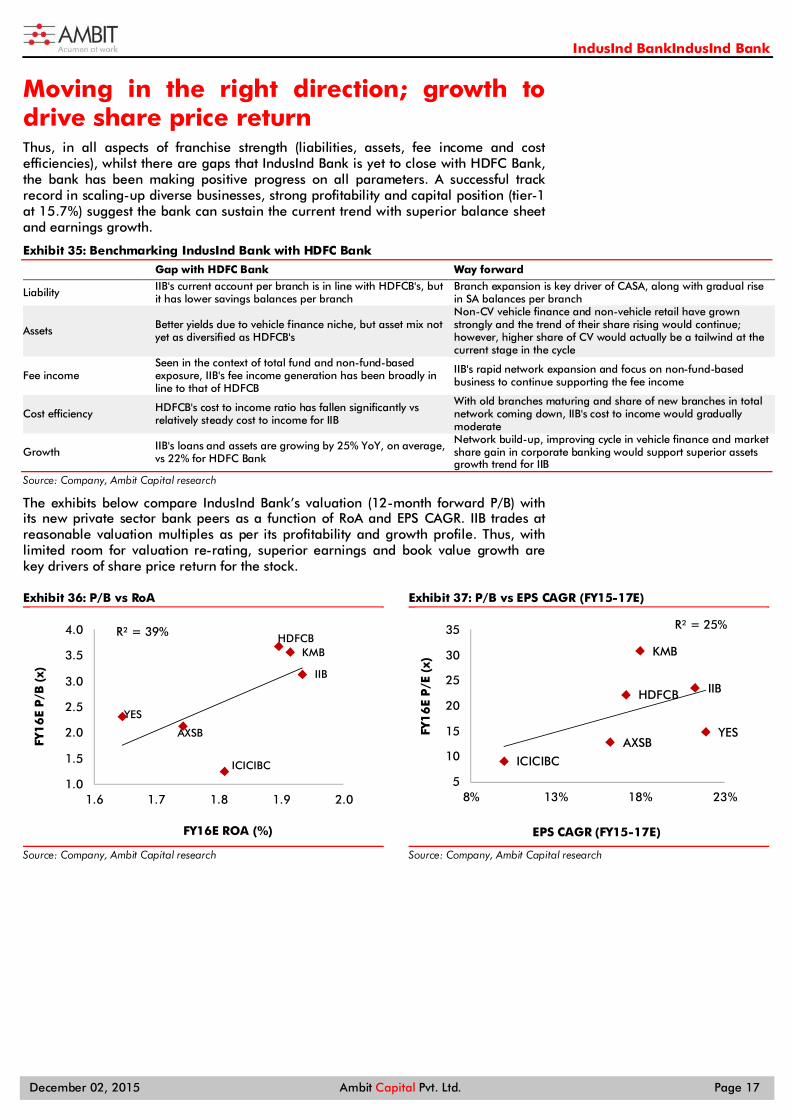
Exhibit 34: …whilst IIB’s cost ratio stayed high with a continued rapid branch build-up
Source: Company, Ambit Capital research
Branch expansion explains the opex differential: As HDFCB’s branch expansion slowed down in the last two years (15% CAGR in FY13-15 vs 24% CAGR in FY11-13), its cost to income ratio has significantly improved. IIB continues to grow its branch network at ~30% CAGR and thus the cost to income ratio has moderated only gradually.
For IndusInd Bank, we expect that the current pace of rapid branch expansion will continue (i.e., doubling of branch network in three years, implying a growth of 25-26% per year). However, with older branches maturing and the share of new branches in total network falling, incrementally we believe the cost to income ratio will gradually moderate (45.7% in FY17 vs 46.8% in FY15).
Key risk factor – Cost efficiency at a time of rising competitive intensity: The entry of new universal and differentiated banks will raise competitive intensity on low cost liabilities, and it could also lead to higher employee expenses to retain quality talent and higher operating expenses to upgrade technology and improve service quality and product offering. Whilst this will be an industry-wide phenomenon, banks with stronger competitive advantages on their assets-side franchise are better placed to face competition. A proven vehicle finance franchise in retail and mid-market positioning in the corporate banking with focus on structured services should provide some differentiation to IndusInd Bank amidst intensifying competition.
40%
42%
44%
46%
48%
50%
52%
20%
22%
24%
26%
28%
30%
32%
34%
36%
FY11 FY12 FY13 FY14 FY15
New branches/total branches Cost to income (RHS)
45%
46%
47%
48%
49%
50%
30%
35%
40%
45%
50%
FY11 FY12 FY13 FY14 FY15
New branches/total branches Cost to income (RHS)
IIB’s incrementally maturing branch network to lead better cost efficiency
IndusInd BankIndusInd Bank
December 02, 2015 Ambit Capital Pvt. Ltd. Page 17
Moving in the right direction; growth to drive share price return Thus, in all aspects of franchise strength (liabilities, assets, fee income and cost efficiencies), whilst there are gaps that IndusInd Bank is yet to close with HDFC Bank, the bank has been making positive progress on all parameters. A successful track record in scaling-up diverse businesses, strong profitability and capital position (tier-1 at 15.7%) suggest the bank can sustain the current trend with superior balance sheet and earnings growth.
Exhibit 35: Benchmarking IndusInd Bank with HDFC Bank
Gap with HDFC Bank Way forward
Liability IIB's current account per branch is in line with HDFCB's, but it has lower savings balances per branch
Branch expansion is key driver of CASA, along with gradual rise in SA balances per branch
Assets Better yields due to vehicle finance niche, but asset mix not yet as diversified as HDFCB's
Non-CV vehicle finance and non-vehicle retail have grown strongly and the trend of their share rising would continue; however, higher share of CV would actually be a tailwind at the current stage in the cycle
Fee income Seen in the context of total fund and non-fund-based exposure, IIB's fee income generation has been broadly in line to that of HDFCB
IIB's rapid network expansion and focus on non-fund-based business to continue supporting the fee income
Cost efficiency HDFCB's cost to income ratio has fallen significantly vs relatively steady cost to income for IIB
With old branches maturing and share of new branches in total network coming down, IIB's cost to income would gradually moderate
Growth IIB's loans and assets are growing by 25% YoY, on average, vs 22% for HDFC Bank
Network build-up, improving cycle in vehicle finance and market share gain in corporate banking would support superior assets growth trend for IIB
Source: Company, Ambit Capital research
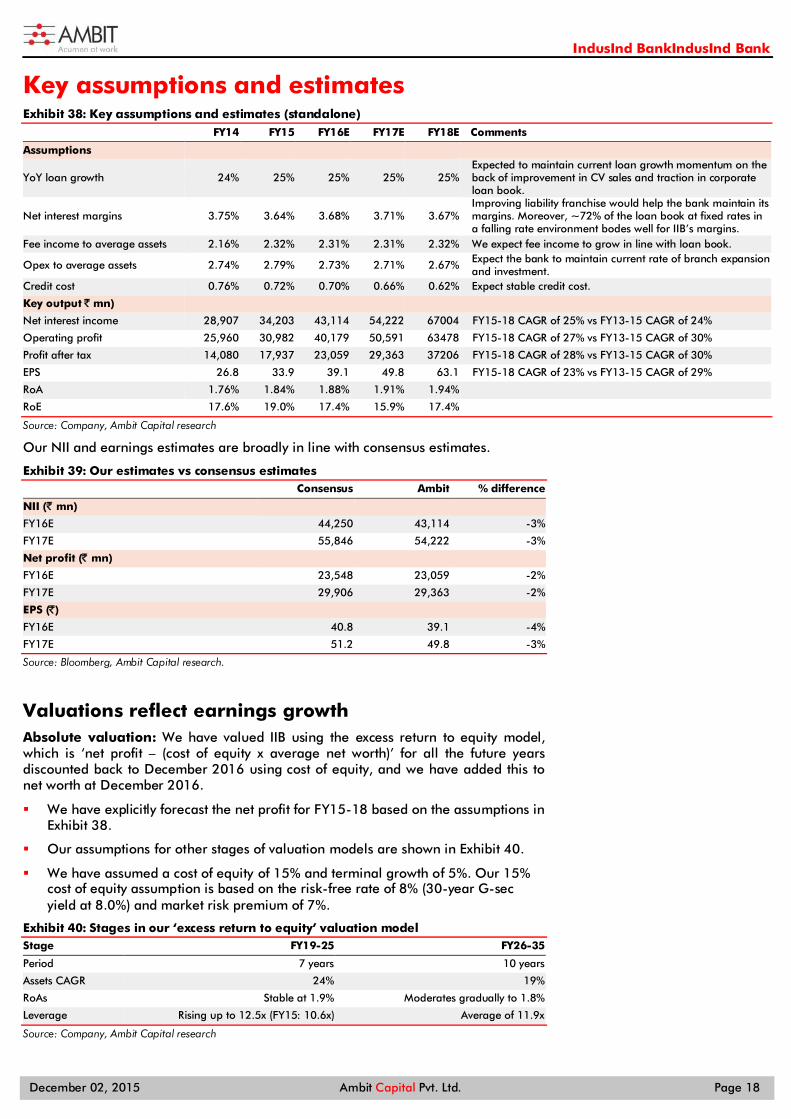
The exhibits below compare IndusInd Bank’s valuation (12-month forward P/B) with its new private sector bank peers as a function of RoA and EPS CAGR. IIB trades at reasonable valuation multiples as per its profitability and growth profile. Thus, with limited room for valuation re-rating, superior earnings and book value growth are key drivers of share price return for the stock.
Exhibit 36: P/B vs RoA
Source: Company, Ambit Capital research
Exhibit 37: P/B vs EPS CAGR (FY15-17E)
Source: Company, Ambit Capital research
AXSB
HDFCB
ICICIBC
IIB
KMB
YES
R² = 39%
1.6 1.7 1.8 1.9 2.01.0
1.5
2.0
2.5
3.0
3.5
4.0
FY16E ROA (%)
FY1
6E
P/B
(x)
AXSB
HDFCB
ICICIBC
IIB
KMB
YES
R² = 25%
8% 13% 18% 23%5
10
15
20
25
30
35
EPS CAGR (FY15-17E)
FY1
6E
P/E
(x)
IndusInd BankIndusInd Bank
December 02, 2015 Ambit Capital Pvt. Ltd. Page 18
Key assumptions and estimates Exhibit 38: Key assumptions and estimates (standalone) FY14 FY15 FY16E FY17E FY18E Comments
Assumptions
YoY loan growth 24% 25% 25% 25% 25% Expected to maintain current loan growth momentum on the back of improvement in CV sales and traction in corporate loan book.
Net interest margins 3.75% 3.64% 3.68% 3.71% 3.67% Improving liability franchise would help the bank maintain its margins. Moreover, ~72% of the loan book at fixed rates in a falling rate environment bodes well for IIB’s margins.
Fee income to average assets 2.16% 2.32% 2.31% 2.31% 2.32% We expect fee income to grow in line with loan book.
Opex to average assets 2.74% 2.79% 2.73% 2.71% 2.67% Expect the bank to maintain current rate of branch expansion and investment.
Credit cost 0.76% 0.72% 0.70% 0.66% 0.62% Expect stable credit cost.
Key output ̀ mn)
Net interest income 28,907 34,203 43,114 54,222 67004 FY15-18 CAGR of 25% vs FY13-15 CAGR of 24%
Operating profit 25,960 30,982 40,179 50,591 63478 FY15-18 CAGR of 27% vs FY13-15 CAGR of 30%
Profit after tax 14,080 17,937 23,059 29,363 37206 FY15-18 CAGR of 28% vs FY13-15 CAGR of 30%
EPS 26.8 33.9 39.1 49.8 63.1 FY15-18 CAGR of 23% vs FY13-15 CAGR of 29%
RoA 1.76% 1.84% 1.88% 1.91% 1.94%
RoE 17.6% 19.0% 17.4% 15.9% 17.4%
Source: Company, Ambit Capital research
Our NII and earnings estimates are broadly in line with consensus estimates.
Exhibit 39: Our estimates vs consensus estimates Consensus Ambit % difference
NII (` mn) FY16E 44,250 43,114 -3%
FY17E 55,846 54,222 -3%
Net profit (̀ mn)
FY16E 23,548 23,059 -2%
FY17E 29,906 29,363 -2%
EPS (̀ )
FY16E 40.8 39.1 -4%
FY17E 51.2 49.8 -3%
Source: Bloomberg, Ambit Capital research.
Valuations reflect earnings growth Absolute valuation: We have valued IIB using the excess return to equity model, which is ‘net profit – (cost of equity x average net worth)’ for all the future years discounted back to December 2016 using cost of equity, and we have added this to net worth at December 2016.
We have explicitly forecast the net profit for FY15-18 based on the assumptions in Exhibit 38.
Our assumptions for other stages of valuation models are shown in Exhibit 40.
We have assumed a cost of equity of 15% and terminal growth of 5%. Our 15% cost of equity assumption is based on the risk-free rate of 8% (30-year G-sec yield at 8.0%) and market risk premium of 7%.
Exhibit 40: Stages in our ‘excess return to equity’ valuation model Stage FY19-25 FY26-35
Period 7 years 10 years
Assets CAGR 24% 19%
RoAs Stable at 1.9% Moderates gradually to 1.8%
Leverage Rising up to 12.5x (FY15: 10.6x) Average of 11.9x
Source: Company, Ambit Capital research
IndusInd BankIndusInd Bank
December 02, 2015 Ambit Capital Pvt. Ltd. Page 19
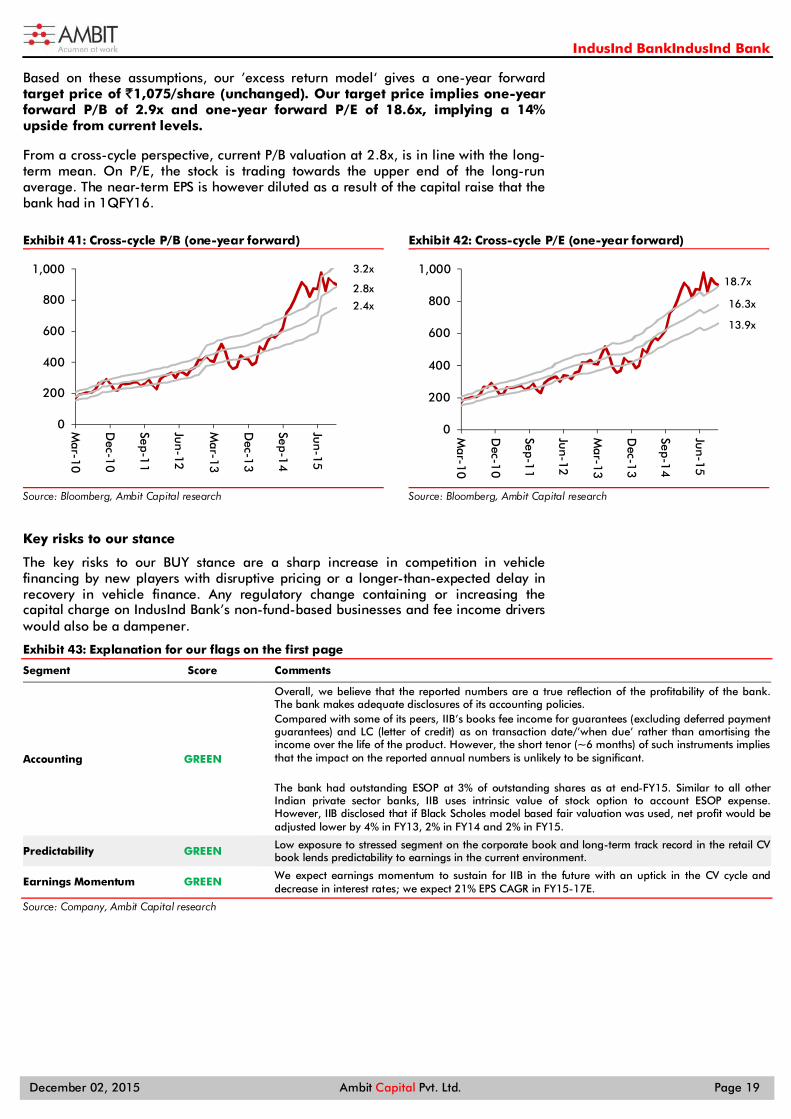
Based on these assumptions, our ’excess return model‘ gives a one-year forward target price of `1,075/share (unchanged). Our target price implies one-year forward P/B of 2.9x and one-year forward P/E of 18.6x, implying a 14% upside from current levels.
From a cross-cycle perspective, current P/B valuation at 2.8x, is in line with the long-term mean. On P/E, the stock is trading towards the upper end of the long-run average. The near-term EPS is however diluted as a result of the capital raise that the bank had in 1QFY16.
Exhibit 41: Cross-cycle P/B (one-year forward)
Source: Bloomberg, Ambit Capital research
Exhibit 42: Cross-cycle P/E (one-year forward)
Source: Bloomberg, Ambit Capital research
Key risks to our stance
The key risks to our BUY stance are a sharp increase in competition in vehicle financing by new players with disruptive pricing or a longer-than-expected delay in recovery in vehicle finance. Any regulatory change containing or increasing the capital charge on IndusInd Bank’s non-fund-based businesses and fee income drivers would also be a dampener.
Exhibit 43: Explanation for our flags on the first page
Segment Score Comments
Accounting GREEN
Overall, we believe that the reported numbers are a true reflection of the profitability of the bank. The bank makes adequate disclosures of its accounting policies. Compared with some of its peers, IIB’s books fee income for guarantees (excluding deferred payment guarantees) and LC (letter of credit) as on transaction date/’when due’ rather than amortising the income over the life of the product. However, the short tenor (~6 months) of such instruments implies that the impact on the reported annual numbers is unlikely to be significant. The bank had outstanding ESOP at 3% of outstanding shares as at end-FY15. Similar to all other Indian private sector banks, IIB uses intrinsic value of stock option to account ESOP expense. However, IIB disclosed that if Black Scholes model based fair valuation was used, net profit would be adjusted lower by 4% in FY13, 2% in FY14 and 2% in FY15.
Predictability GREEN Low exposure to stressed segment on the corporate book and long-term track record in the retail CV book lends predictability to earnings in the current environment.
Earnings Momentum GREEN We expect earnings momentum to sustain for IIB in the future with an uptick in the CV cycle and decrease in interest rates; we expect 21% EPS CAGR in FY15-17E.
Source: Company, Ambit Capital research
0
200
400
600
800
1,000
Mar-10
Dec-1
0
Sep-11
Jun-12
Mar-13
Dec-1
3
Sep-14
Jun-15
3.2x
2.8x
2.4x
0
200
400
600
800
1,000
Mar-10
Dec-1
0
Sep-11
Jun-12
Mar-13
Dec-1
3
Sep-14
Jun-15
18.7x
16.3x
13.9x
IndusInd BankIndusInd Bank
December 02, 2015 Ambit Capital Pvt. Ltd. Page 20
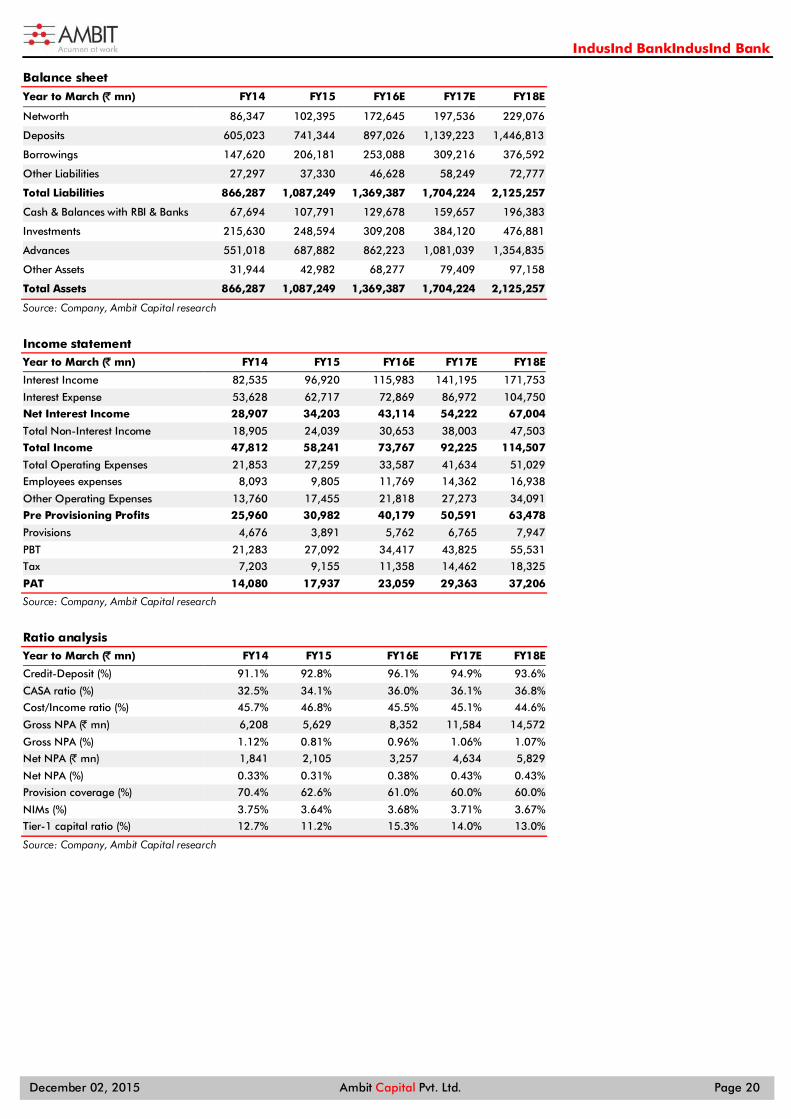
Balance sheet
Year to March (̀ mn) FY14 FY15 FY16E FY17E FY18E
Networth 86,347 102,395 172,645 197,536 229,076
Deposits 605,023 741,344 897,026 1,139,223 1,446,813
Borrowings 147,620 206,181 253,088 309,216 376,592
Other Liabilities 27,297 37,330 46,628 58,249 72,777
Total Liabilities 866,287 1,087,249 1,369,387 1,704,224 2,125,257
Cash & Balances with RBI & Banks 67,694 107,791 129,678 159,657 196,383
Investments 215,630 248,594 309,208 384,120 476,881
Advances 551,018 687,882 862,223 1,081,039 1,354,835
Other Assets 31,944 42,982 68,277 79,409 97,158
Total Assets 866,287 1,087,249 1,369,387 1,704,224 2,125,257
Source: Company, Ambit Capital research
Income statement Year to March (̀ mn) FY14 FY15 FY16E FY17E FY18E
Interest Income 82,535 96,920 115,983 141,195 171,753
Interest Expense 53,628 62,717 72,869 86,972 104,750
Net Interest Income 28,907 34,203 43,114 54,222 67,004
Total Non-Interest Income 18,905 24,039 30,653 38,003 47,503
Total Income 47,812 58,241 73,767 92,225 114,507
Total Operating Expenses 21,853 27,259 33,587 41,634 51,029
Employees expenses 8,093 9,805 11,769 14,362 16,938
Other Operating Expenses 13,760 17,455 21,818 27,273 34,091
Pre Provisioning Profits 25,960 30,982 40,179 50,591 63,478
Provisions 4,676 3,891 5,762 6,765 7,947
PBT 21,283 27,092 34,417 43,825 55,531
Tax 7,203 9,155 11,358 14,462 18,325
PAT 14,080 17,937 23,059 29,363 37,206
Source: Company, Ambit Capital research
Ratio analysis Year to March (̀ mn) FY14 FY15 FY16E FY17E FY18E
Credit-Deposit (%) 91.1% 92.8% 96.1% 94.9% 93.6%
CASA ratio (%) 32.5% 34.1% 36.0% 36.1% 36.8%
Cost/Income ratio (%) 45.7% 46.8% 45.5% 45.1% 44.6%
Gross NPA (̀ mn) 6,208 5,629 8,352 11,584 14,572
Gross NPA (%) 1.12% 0.81% 0.96% 1.06% 1.07%
Net NPA (̀ mn) 1,841 2,105 3,257 4,634 5,829
Net NPA (%) 0.33% 0.31% 0.38% 0.43% 0.43%
Provision coverage (%) 70.4% 62.6% 61.0% 60.0% 60.0%
NIMs (%) 3.75% 3.64% 3.68% 3.71% 3.67%
Tier-1 capital ratio (%) 12.7% 11.2% 15.3% 14.0% 13.0%
Source: Company, Ambit Capital research
IndusInd BankIndusInd Bank
December 02, 2015 Ambit Capital Pvt. Ltd. Page 21
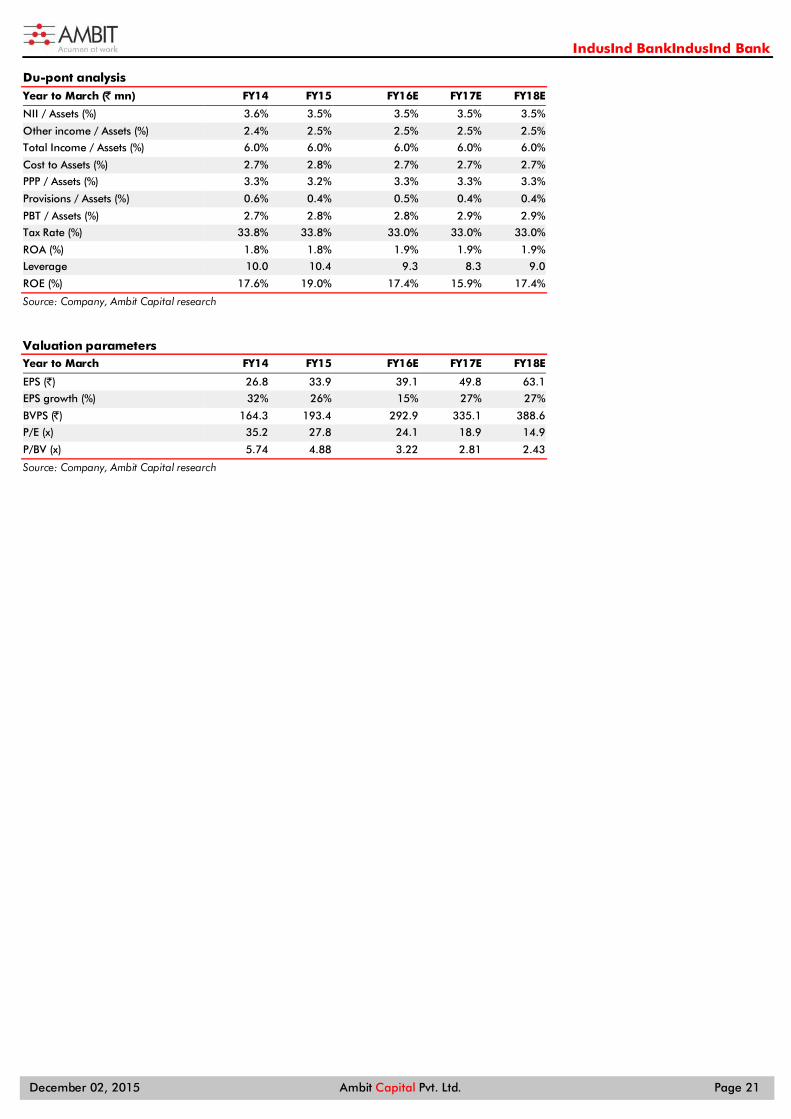
Du-pont analysis Year to March (̀ mn) FY14 FY15 FY16E FY17E FY18E
NII / Assets (%) 3.6% 3.5% 3.5% 3.5% 3.5%
Other income / Assets (%) 2.4% 2.5% 2.5% 2.5% 2.5%
Total Income / Assets (%) 6.0% 6.0% 6.0% 6.0% 6.0%
Cost to Assets (%) 2.7% 2.8% 2.7% 2.7% 2.7%
PPP / Assets (%) 3.3% 3.2% 3.3% 3.3% 3.3%
Provisions / Assets (%) 0.6% 0.4% 0.5% 0.4% 0.4%
PBT / Assets (%) 2.7% 2.8% 2.8% 2.9% 2.9%
Tax Rate (%) 33.8% 33.8% 33.0% 33.0% 33.0%
ROA (%) 1.8% 1.8% 1.9% 1.9% 1.9%
Leverage 10.0 10.4 9.3 8.3 9.0
ROE (%) 17.6% 19.0% 17.4% 15.9% 17.4%
Source: Company, Ambit Capital research
Valuation parameters Year to March FY14 FY15 FY16E FY17E FY18E
EPS (`) 26.8 33.9 39.1 49.8 63.1
EPS growth (%) 32% 26% 15% 27% 27%
BVPS (̀ ) 164.3 193.4 292.9 335.1 388.6
P/E (x) 35.2 27.8 24.1 18.9 14.9
P/BV (x) 5.74 4.88 3.22 2.81 2.43
Source: Company, Ambit Capital research
IndusInd BankIndusInd Bank
December 02, 2015 Ambit Capital Pvt. Ltd. Page 22
Institutional Equities Team Saurabh Mukherjea, CFA CEO, Institutional Equities (022) 30433174 [email protected]
Research
Analysts Industry Sectors Desk-Phone E-mail
Nitin Bhasin - Head of Research E&C / Infra / Cement / Industrials (022) 30433241 [email protected]
Aadesh Mehta, CFA Banking / Financial Services (022) 30433239 [email protected]
Abhishek Ranganathan, CFA Retail / Mid-caps (022) 30433085 [email protected]
Achint Bhagat, CFA Cement / Roads / Home Building (022) 30433178 [email protected]
Ashvin Shetty, CFA Automobile (022) 30433285 [email protected]
Bhargav Buddhadev Power Utilities / Capital Goods (022) 30433252 [email protected]
Deepesh Agarwal Power Utilities / Capital Goods (022) 30433275 [email protected] Gaurav Mehta, CFA Strategy / Derivatives Research (022) 30433255 [email protected]
Girisha Saraf Mid-caps / Small-caps (022) 30433211 [email protected]
Karan Khanna Strategy (022) 30433251 [email protected]
Kushank Poddar Technology (022) 30433203 [email protected] Pankaj Agarwal, CFA Banking / Financial Services (022) 30433206 [email protected]
Paresh Dave, CFA Healthcare (022) 30433212 [email protected]
Parita Ashar, CFA Metals & Mining (022) 30433223 [email protected]
Prashant Mittal, CFA Derivatives (022) 30433218 [email protected]
Rakshit Ranjan, CFA Consumer (022) 30433201 [email protected]
Ravi Singh Banking / Financial Services (022) 30433181 [email protected]
Ritesh Gupta, CFA Oil & Gas / Chemicals / Agri Inputs (022) 30433242 [email protected]
Ritesh Vaidya, CFA Consumer (022) 30433246 [email protected] Ritika Mankar Mukherjee, CFA Economy / Strategy (022) 30433175 [email protected]
Ritu Modi Automobile (022) 30433292 [email protected]
Sagar Rastogi Technology (022) 30433291 [email protected]
Sumit Shekhar Economy / Strategy (022) 30433229 [email protected]
Utsav Mehta, CFA E&C / Industrials (022) 30433209 [email protected]
Vivekanand Subbaraman, CFA Media (022) 30433261 [email protected]
Sales
Name Regions Desk-Phone E-mail
Sarojini Ramachandran - Head of Sales UK +44 (0) 20 7614 8374 [email protected]
Dharmen Shah India / Asia (022) 30433289 [email protected]
Dipti Mehta India / USA (022) 30433053 [email protected]
Hitakshi Mehra India (022) 30433204 [email protected]
Krishnan V India / Asia (022) 30433295 [email protected]
Nityam Shah, CFA USA / Europe (022) 30433259 [email protected]
Parees Purohit, CFA UK / USA (022) 30433169 [email protected]
Praveena Pattabiraman India / Asia (022) 30433268 [email protected]
Shaleen Silori India (022) 30433256 [email protected]
Singapore
Pramod Gubbi, CFA – Director Singapore +65 8606 6476 [email protected]
Shashank Abhisheik Singapore +65 6536 1935 [email protected]
USA / Canada
Ravilochan Pola - CEO Americas +1(646) 361 3107 [email protected]
Production
Sajid Merchant Production (022) 30433247 [email protected]
Sharoz G Hussain Production (022) 30433183 [email protected]
Joel Pereira Editor (022) 30433284 [email protected]
Nikhil Pillai Database (022) 30433265 [email protected]
E&C = Engineering & Construction
IndusInd BankIndusInd Bank
December 02, 2015 Ambit Capital Pvt. Ltd. Page 23
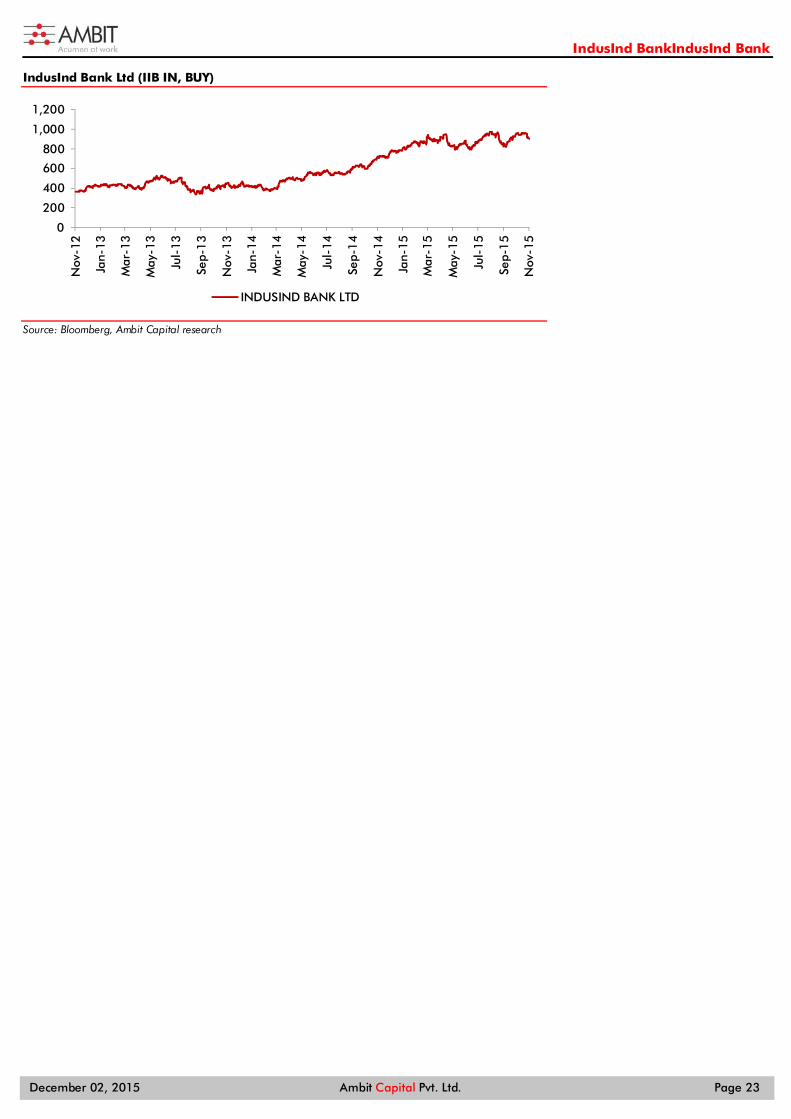
IndusInd Bank Ltd (IIB IN, BUY)
Source: Bloomberg, Ambit Capital research
0
200
400
600
800
1,000
1,200
Nov
-12
Jan-
13
Mar
-13
May
-13
Jul-
13
Sep-
13
Nov
-13
Jan-
14
Mar
-14
May
-14
Jul-
14
Sep-
14
Nov
-14
Jan-
15
Mar
-15
May
-15
Jul-
15
Sep-
15
Nov
-15
INDUSIND BANK LTD
IndusInd BankIndusInd Bank
December 02, 2015 Ambit Capital Pvt. Ltd. Page 24
Explanation of Investment Rating
Investment Rating Expected return (over 12-month)
BUY >10%
SELL <10%
NO STANCE We have forward looking estimates for the stock but we refrain from assigning valuation and recommendation
UNDER REVIEW We will revisit our recommendation, valuation and estimates on the stock following recent events
NOT RATED We do not have any forward looking estimates, valuation or recommendation for the stock Disclaimer
This report or any portion hereof may not be reprinted, sold or redistributed without the written consent of Ambit Capital. AMBIT Capital Research is disseminated and available primarily electronically, and, in some cases, in printed form.
Additional information on recommended securities is available on request.
Disclaimer
1. AMBIT Capital Private Limited (“AMBIT Capital”) and its affiliates are a full service, integrated investment banking, investment advisory and brokerage group. AMBIT Capital is a Stock Broker, Portfolio Manager and Depository Participant registered with Securities and Exchange Board of India Limited (SEBI) and is regulated by SEBI
2. AMBIT Capital makes best endeavours to ensure that the research analyst(s) use current, reliable, comprehensive information and obtain such information from sources which the analyst(s) believes to be reliable. However, such information has not been independently verified by AMBIT Capital and/or the analyst(s) and no representation or warranty, express or implied, is made as to the accuracy or completeness of any information obtained from third parties. The information, opinions, views expressed in this Research Report are those of the research analyst as at the date of this Research Report which are subject to change and do not represent to be an authority on the subject. AMBIT Capital may or may not subscribe to any and/ or all the views expressed herein.
3. This Research Report should be read and relied upon at the sole discretion and risk of the recipient. If you are dissatisfied with the contents of this complimentary Research Report or with the terms of this Disclaimer, your sole and exclusive remedy is to stop using this Research Report and AMBIT Capital or its affiliates shall not be responsible and/ or liable for any direct/consequential loss howsoever directly or indirectly, from any use of this Research Report.
4. If this Research Report is received by any client of AMBIT Capital or its affiliate, the relationship of AMBIT Capital/its affiliate with such client will continue to be governed by the terms and conditions in place between AMBIT Capital/ such affiliate and the client.
5. This Research Report is issued for information only and the 'Buy', 'Sell', or ‘Other Recommendation’ made in this Research Report such should not be construed as an investment advice to any recipient to acquire, subscribe, purchase, sell, dispose of, retain any securities and should not be intended or treated as a substitute for necessary review or validation or any professional advice. Recipients should consider this Research Report as only a single factor in making any investment decisions. This Research Report is not an offer to sell or the solicitation of an offer to purchase or subscribe for any investment or as an official endorsement of any investment.
6. This Research Report is being supplied to you solely for your information and may not be reproduced, redistributed or passed on, directly or indirectly, to any other person or published, copied in whole or in part, for any purpose. Neither this Research Report nor any copy of it may be taken or transmitted or distributed, directly or indirectly within India or into any other country including United States (to US Persons), Canada or Japan or to any resident thereof. The distribution of this Research Report in other jurisdictions may be strictly restricted and/ or prohibited by law or contract, and persons into whose possession this Research Report comes should inform themselves about such restriction and/ or prohibition, and observe any such restrictions and/ or prohibition.
7. Ambit Capital Private Limited is registered as a Research Entity under the SEBI (Research Analysts) Regulations, 2014.
Conflict of Interests
8. In the normal course of AMBIT Capital’s business circumstances may arise that could result in the interests of AMBIT Capital conflicting with the interests of clients or one client’s interests conflicting with the interest of another client. AMBIT Capital makes best efforts to ensure that conflicts are identified and managed and that clients’ interests are protected. AMBIT Capital has policies and procedures in place to control the flow and use of non-public, price sensitive information and employees’ personal account trading. Where appropriate and reasonably achievable, AMBIT Capital segregates the activities of staff working in areas where conflicts of interest may arise. However, clients/potential clients of AMBIT Capital should be aware of these possible conflicts of interests and should make informed decisions in relation to AMBIT Capital’s services.
9. AMBIT Capital and/or its affiliates may from time to time have or solicit investment banking, investment advisory and other business relationships with companies covered in this Research Report and may receive compensation for the same.
Additional Disclaimer for U.S. Persons
10. The research report is solely a product of AMBIT Capital 11. AMBIT Capital is the employer of the research analyst(s) who has prepared the research report 12. Any subsequent transactions in securities discussed in the research reports should be effected through Enclave Capital LLC. (“Enclave”). 13. Enclave does not accept or receive any compensation of any kind for the dissemination of the AMBIT Capital research reports. 14. The research analyst(s) preparing the email / Research Report/ attachment is resident outside the United States and is/are not associated persons of any U.S. regulated broker-dealer and that
therefore the analyst(s) is/are not subject to supervision by a U.S. broker-dealer, and is/are not required to satisfy the regulatory licensing requirements of FINRA or required to otherwise comply with U.S. rules or regulations regarding, among other things, communications with a subject company, public appearances and trading securities held by a research analyst account.
15. This report is prepared, approved, published and distributed by the Ambit Capital located outside of the United States (a non-US Group Company”). This report is distributed in the U.S.by Enclave Capital LLC, a U.S. registered broker dealer, on behalf of Ambit Capital only to major U.S. institutional investors (as defined in Rule 15a-6 under the U.S. Securities Exchange Act of 1934 (the “Exchange Act”)) pursuant to the exemption in Rule 15a-6 and any transaction effected by a U.S. customer in the securities described in this report must be effected through Enclave Capital LLC (19 West 44th Street, suite 1700, New York, NY 10036).
16. As of the publication of this report Enclave Capital LLC, does not make a market in the subject securities. 17. This document does not constitute an offer of, or an invitation by or on behalf of Ambit Capital or its affiliates or any other company to any person, to buy or sell any security. The information
contained herein has been obtained from published information and other sources, which Ambit Capital or its Affiliates consider to be reliable. None of Ambit Capital accepts any liability or responsibility whatsoever for the accuracy or completeness of any such information. All estimates, expressions of opinion and other subjective judgments contained herein are made as of the date of this document. Emerging securities markets may be subject to risks significantly higher than more established markets. In particular, the political and economic environment, company practices and market prices and volumes may be subject to significant variations. The ability to assess such risks may also be limited due to significantly lower information quantity and quality. By accepting this document, you agree to be bound by all the foregoing provisions.
Additional Disclaimer for Canadian Persons
18. AMBIT Capital is not registered in the Province of Ontario and /or Province of Québec to trade in securities and/or to provide advice with respect to securities. 19. AMBIT Capital's head office or principal place of business is located in India. 20. All or substantially all of AMBIT Capital's assets may be situated outside of Canada. 21. It may be difficult for enforcing legal rights against AMBIT Capital because of the above. 22. Name and address of AMBIT Capital's agent for service of process in the Province of Ontario is: Torys LLP, 79 Wellington St. W., 30th Floor, Box 270, TD South Tower, Toronto, Ontario M5K 1N2
Canada. 23. Name and address of AMBIT Capital's agent for service of process in the Province of Montréal is Torys Law Firm LLP, 1 Place Ville Marie, Suite 1919 Montréal, Québec H3B 2C3 Canada.
Additional Disclaimer for Singapore Persons 24. This Report is prepared and distributed by Ambit Capital Private Limited and distributed as per the approved arrangement under Paragraph 9 of Third Schedule of Securities and Futures Act (CAP
289) and Paragraph 11 of the First Schedule to the Financial Advisors Act (CAP 110) provided to Ambit Singapore Pte. Limited by Monetary Authority of Singapore. 25. This Report is only available to persons in Singapore who are institutional investors (as defined in section 4A of the Securities and Futures Act (Cap. 289) of Singapore (the “SFA”).” Accordingly, if a
Singapore Person is not or ceases to be such an institutional investor, such Singapore Person must immediately discontinue any use of this Report and inform Ambit Singapore Pte. Limited.
Disclosure 26. Ambit and/or its associates have financial interest in HDFC Bank, Kotak Mahindra Bank, Axis Bank, Yes Bank & ICICI Bank.
Analyst Certification Each of the analysts identified in this report certifies, with respect to the companies or securities that the individual analyses, that (1) the views expressed in this report reflect his or her personal views about all of the subject companies and securities and (2) no part of his or her compensation was, is or will be directly or indirectly dependent on the specific recommendations or views expressed in this report. © Copyright 2015 AMBIT Capital Private Limited. All rights reserved.
Ambit Capital Pvt. Ltd. Ambit House, 3rd Floor. 449, Senapati Bapat Marg, Lower Parel, Mumbai 400 013, India. Phone: +91-22-3043 3000 | Fax: +91-22-3043 3100 CIN: U74140MH1997PTC107598 www.ambitcapital.com