Embed Size (px)
Citation preview
Company Information 2
Core Values 3
Our Equities and Initiatives 4
Notice of Annual General Meeting 9
Financial Summary 11
Directors’ Report 12
Statement of Value Added 17
Statement of Compliance with the Code of Corporate Governance 18
Review Report to the Members on Statement of Compliance with 20best Practices of Code of Corporate Governance
Auditors’ Report to the Members 21
Balance Sheet 22
Profit and Loss Account 23
Statement of Changes in Equity 24
Cash Flow Statement 25
Notes to and Forming Part of the Financial Statements 26
Pattern of Shareholding 60
Operating and Financial Highlights 62
Form of Proxy
CONTENTS
ANNUAL REPORT 2014
02
COMPANY INFORMATIONBOARD OF DIRECTORS
Iqbal Ali Lakhani ChairmanAmin Mohammed LakhaniTasleemuddin Ahmed BatlayJerome Graham WebbMukul DeorasAliya Saeeda Khan (from March 10, 2014)A. Aziz H. Ebrahim (upto March 10, 2014)Zulfiqar Ali Lakhani Chief Executive
ADVISORSultan Ali Lakhani
AUDIT COMMITTEE
Aliya Saeeda Khan ChairpersonIqbal Ali LakhaniAmin Mohammed LakhaniTasleemuddin Ahmed Batlay
HUMAN RESOURCE &REMUNERATION COMMITTEE
Iqbal Ali Lakhani ChairmanZulfiqar Ali LakhaniAmin Mohammed Lakhani
COMPANY SECRETARY
Mansoor Ahmed
AUDITORS
A. F. Ferguson & Co.Chartered Accountants
INTERNAL AUDITORS
BDO Ebrahim & Co.Chartered Accountants
REGISTERED OFFICE
Lakson Square, Building No. 2,Sarwar Shaheed Road,Karachi-74200Pakistan
SHARES REGISTRAR
FAMCO Associates (Private) Limited8-F, Next to Hotel Faran, Nursery, Block-6,P.E.C.H.S., Shahra-e-Faisal, Karachi.
FACTORIES
G-6, S.I.T.E., KotriDistrict Jamshoro (Sindh)
217, Sundar Industrial EstateRaiwind Road, Lahore
WEBSITE
www.colgate.com.pk
03
A N N U A L R E P O R T 2 0 1 4
Core Values
CARINGThe Company cares about
people: Colgate people,
customers, shareholders and
business partners. Colgate is
committed to act with
compassion, integrity,
honesty and high ethics in all
situations, to listen with
respect to others and to value
differences. The Company is
also committed to protect the
global environment, to
enhance the communities
where Colgate people live
and work, and to be
compliant with government
laws and regulations.
TEAMWORKAll Colgate people are part of
a team, committed to
working together. Only by
sharing ideas, technologies
and talents can the Company
achieve and sustain profitable
growth.
CONTINUOUSIMPROVEMENTColgate is committed to
getting better every day in
all it does, as individuals
and as teams. By better
understanding consumers’
and customers’
expectations and
continuously working to
innovate and improve
products, services and
processes, Colgate will
“become the best”.

04
ORAL CARE
Colgate’s commitment to spread oral hygiene awareness and to improve oral health in the country is reflected in its various initiatives carried out throughout the year.
DENTAL HEALTH WEEK DRIVE
Colgate conducted three drives of Dental Health Week in Pakistan this year. These oral health initiatives reached thousands of consumers in semi-urban and smaller towns of Pakistan, as well as underprivileged areas in metro cities.
Dental Health Week, conducted on a national scale, not only created dental awareness but also helped consumers build a stronger association with Colgate and its products. With free dental checkups and oral hygiene education, Colgate continued to reach the segment of consumers that had no or very low level of oral health awareness.
BRIGHT SMILES,BRIGHT FUTURES
Since 1991, Colgate’s Bright Smiles, Bright Futures global oral health education program has provided oral health education to children worldwide. In Pakistan, our trained educators on oral hygiene conduct sessions across the country to emphasize the importance of oral health and hygiene. From urban cities to rural areas, private and government schools across Pakistan are reached through the program to spread awareness on the importance of oral hygiene.
05
A N N U A L R E P O R T 2 0 1 4
GLOBAL ART CONTEST (GAC)
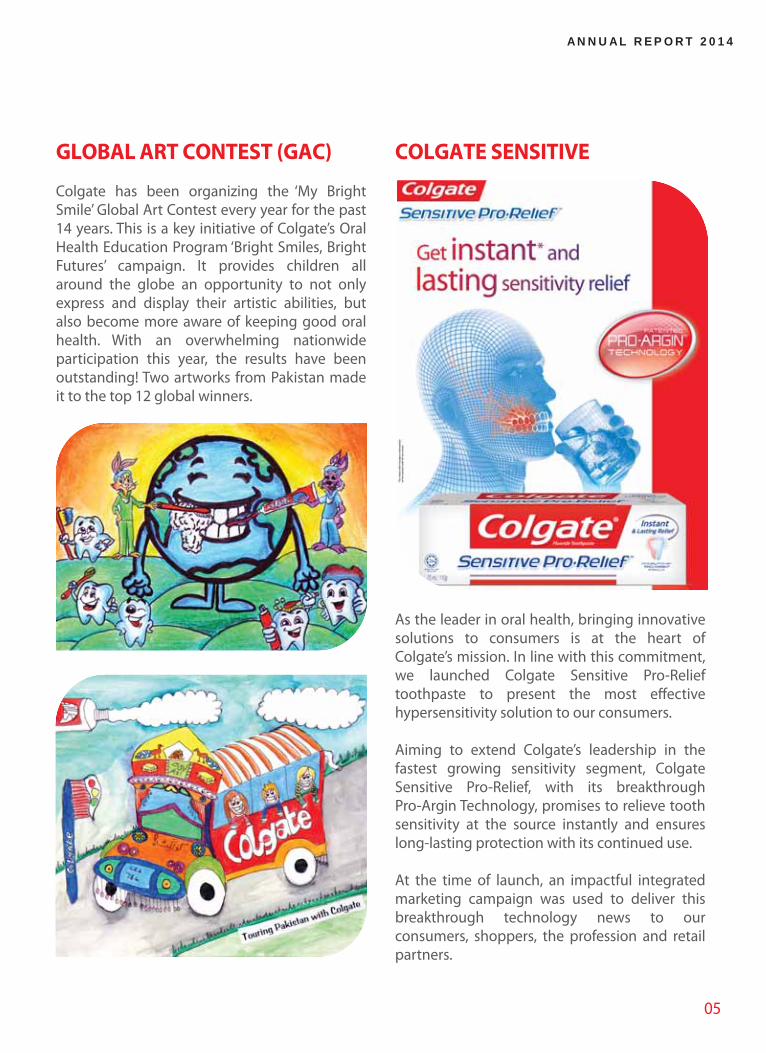
Colgate has been organizing the ‘My Bright Smile’ Global Art Contest every year for the past 14 years. This is a key initiative of Colgate’s Oral Health Education Program ‘Bright Smiles, Bright Futures’ campaign. It provides children all around the globe an opportunity to not only express and display their artistic abilities, but also become more aware of keeping good oral health. With an overwhelming nationwide participation this year, the results have been outstanding! Two artworks from Pakistan made it to the top 12 global winners.
COLGATE SENSITIVE
As the leader in oral health, bringing innovative solutions to consumers is at the heart of Colgate’s mission. In line with this commitment, we launched Colgate Sensitive Pro-Relief toothpaste to present the most effective hypersensitivity solution to our consumers.
Aiming to extend Colgate’s leadership in the fastest growing sensitivity segment, Colgate Sensitive Pro-Relief, with its breakthrough Pro-Argin Technology, promises to relieve tooth sensitivity at the source instantly and ensures long-lasting protection with its continued use.
At the time of launch, an impactful integrated marketing campaign was used to deliver this breakthrough technology news to our consumers, shoppers, the profession and retail partners.

06
COLGATE SLIMSOFT CHARCOAL
Colgate expanded its tapered bristles range by introducing Colgate SlimSoft Charcoal this year. Colgate SlimSoft Charcoal’s innovative and unique charcoal-infused bristles provide consumers with a superior bacteria-removal benefit. Combined with the 0.01 mm tipped super slim bristles, it provides a deeper and gentle clean.
PERSONAL CARE
The Personal Care category continued improving its shelf presence across all retail environments, complemented by concerted marketing activities. In view of market dynamics and challenges, several initiatives were taken, including the launch of 155g Palmolive Naturals Black Orchid SKU. Increasing pressure of parallel imports at an unfair price was felt by the business.
Palmolive Liquid Hand Wash extended its range with the launch of “Palmolive Naturals Sea Minerals – Conditioning Hand Wash” which contains natural sea minerals to gently and effectively cleanse hands, along with refreshing and conditioning the skin.
FABRIC CARE
In a highly challenging year with heavy media spending and promotional activities by competition, we managed to grow our detergent brands through a mix of strategic and tactical initiatives.
Bonus Tristar maintained its volume leadership and improved its value to consumers through a timely packaging change and a product upgrade which now includes red and green speckles. With a focus to recruit new users and increase the conversion rate from laundry soaps, Bonus Tristar was re-launched with a new integrated marketing campaign.
Brite Anti-Bacterial successfully reached new
07
A N N U A L R E P O R T 2 0 1 4
consumers with its 99% germ-removal benefit versus ordinary detergents. Besides the consumer investment in advertising and promotion, focused working with our retail partners and shopper engagement on the unique benefit of germ-removal from clothes improved assortment and share of shelf for Brite equity.
SURFACE CARE
LEMON MAX ULTRA
An insight-driven innovation of Lemon Max Ultra, a premium concentrated dishwashing liquid was the key launch of the year to strengthen our category leadership, particularly in top end retail. This latest addition to the Lemon Max Liquid portfolio has an attractive, premium packaging that clearly differentiates it on the shelf.
Lemon Max Ultra, with its “Double Power” claim, was launched with a 360 marketing campaign that effectively communicated its superior grease-cutting benefit through relevant touch points for consumers and shoppers.
Lemon Max Ultra is for those who never settle for second best - a must have in your kitchen!
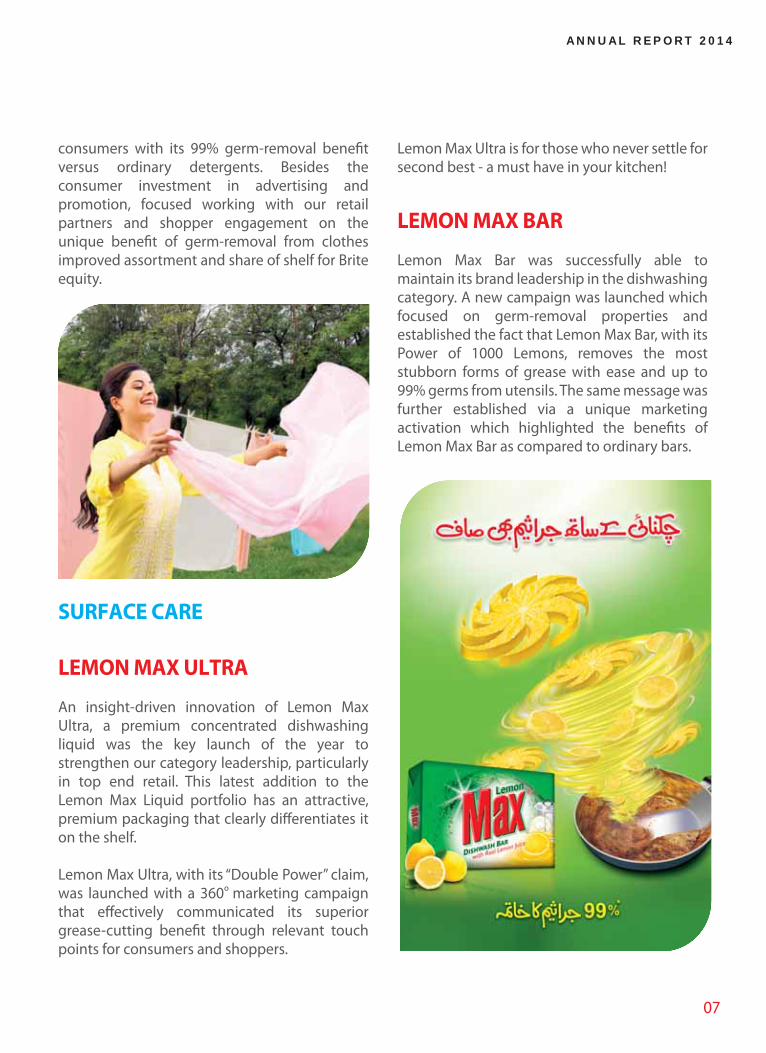
LEMON MAX BAR
Lemon Max Bar was successfully able to maintain its brand leadership in the dishwashing category. A new campaign was launched which focused on germ-removal properties and established the fact that Lemon Max Bar, with its Power of 1000 Lemons, removes the most stubborn forms of grease with ease and up to 99% germs from utensils. The same message was further established via a unique marketing activation which highlighted the benefits of Lemon Max Bar as compared to ordinary bars.
º
AwardsTOP 25 COMPANIES AWARDFor the 9th consecutive year, the Karachi Stock Exchange (KSE) ranked the Company amongst the top 25 listed companies.
KSE judges the Companies based on a criteria focusing on service to the shareholders, in compliance with listing regulations and good corporate governance.
MAP’S CORPORATE EXCELLENCE AWARDSThe Company was presented its 3rd
consecutive ‘Corporate Excellence Award’
at the 29th Corporate Excellence Awards
Ceremony organized by the Management
Association of Pakistan. The Company
was also awarded Corporate Excellence
Certificates on 5 earlier occasions in
recognition of its achievements and
overall performance.
08
NOTICE IS HEREBY GIVEN that the 36th Annual General Meeting of COLGATE-PALMOLIVE (PAKISTAN) LIMITEDwill be held on Wednesday, September 17, 2014 at 10:30 a.m. at Avari Towers Hotel, Fatima Jinnah Road, Karachi totransact the following business:
ORDINARY BUSINESS
1. To receive, consider and adopt the audited financial statements for the year ended June 30, 2014 together withthe Directors' and Auditors' Reports thereon.
2. To declare final dividend in cash @ 170% i.e. Rs.17 per share of Rs.10 each held by the members as recommendedby the Board of Directors.
3. To appoint auditors and fix their remuneration.
SPECIAL BUSINESS
4. To consider and approve the amendments in some of the clauses of Articles of Association of the Companyand pass Special Resolution with or without modification.
Statement under section 160 of the Companies Ordinance, 1984 in the above matter containing draft of the resolutionto be passed pertaining to item No. 4 is annexed.
By Order of the Board
MANSOOR AHMEDKARACHI: August 15, 2014 Company Secretary
NOTES:
1. The share transfer books of the Company will remain closed from September 11, 2014 to September 17, 2014,both days inclusive. Transfers received in order by the Shares Registrar of the Company M/s. FAMCO Associates(Private) Limited, 8-F, Next to Hotel Faran, Nursery, Block-6, P.E.C.H.S, Shahra-e-Faisal, Karachi upto September10, 2014 will be considered in time for entitlement of the dividend.
2. A member who has deposited his/her shares into Central Depository Company of Pakistan Limited, must bringhis/her participant's ID number and account/sub-account number alongwith original Computerized NationalIdentity Card (CNIC) or original Passport at the time of attending the meeting.
3. A member entitled to attend and vote at the general meeting may appoint another member as his/her proxyto attend, speak and vote instead of him/her.
4. Forms of proxy to be valid must be properly filled-in/executed and received at the Company's Registered Officeat Lakson Square, Building No.2, Sarwar Shaheed Road, Karachi not later than 48 hours before the time of themeeting.
5. Members are requested to notify the Shares Registrar of the Company promptly of any change in their addresses.
6. Members who have not yet submitted photocopy of their Computerized National Identity Cards (CNIC) arerequested to send the same to our Shares Registrar at the earliest.
7. Form of Proxy is enclosed herewith.
NOTICE OF ANNUAL GENERAL MEETING
09
ANNUAL REPORT 2014
10
STATEMENT UNDER SECTION 160 OF THE COMPANIES ORDINANCE, 1984
PERTAINING TO ITEM NO.4
A. The Board of Directors have recommended to the members to amend certain clauses of Articles of Associationof the Company. The proposed changes in certain clauses will update the Articles of Association of the Company.
B. The Directors are interested to the extent of shares held by them and the privileges attached thereto only.
C. The resolution as under will be considered to be passed by the members as special resolution:
“RESOLVED THAT THE AMENDMENTS AS UNDER BE AND ARE HEREBY MADE IN THE ARTICLES OFASSOCIATION OF THE COMPANY:
1) Substitute the words 'shall not exceed rupees five hundred per meeting of the Board of Directors or a Committeeof such Board attended by him' appearing in line-3 of clause 53(1) with the words, figures and commas ', shallbe Rupees 5,000 (Five Thousand) or as fixed by the Board of Directors from time to time for attending a meetingof the Board of Directors or a Committee of the Board, plus out of pocket expenses, if any'. The revised clausewill read as under:
53(1) The ordinary remuneration of a Director, other than the regularly paid Chief Executive and full time working Directors, shall be Rupees 5,000 (Five Thousand) or as fixed by the Board of Directors from time to timefor attending a meeting of the Board of Directors or a Committee of the Board, plus out of pocketexpenses, if any.
2) Insert the words 'in person or via teleconferencing or videoconferencing or by any other electronic means,'between the words 'together' and 'for the dispatch' in line-1, and 'once' between the words 'at least' and 'ineach quarter' in line-3 in clause 61. The revised clause will read as under:
61. The Directors may meet together in person or via teleconferencing or videoconferencing or by any otherelectronic means, for the dispatch of business, adjourn or otherwise regulate their meetings, as theythink fit provided that the Directors shall meet at least once in each quarter of a year. A Director may,and the Secretary on the requisition of a Director shall, at any time, summon a meeting of the Directors.It shall not be necessary to give notice of a meeting of Directors to any Director for the time being absentfrom Karachi.
3) Insert the words 'or through courier service or any other prescribed mode' after the word 'post' in line-3 inclause 88 and delete the word 'that' in line-5 in clause 88. The revised clause will read as under:
88. Any dividend or other moneys payable in cash on or in respect of a share may be paid by cheque orwarrant sent by registered post or through courier service or any other prescribed mode to the registeredaddress of the Member or person entitled thereto and in case of joint holders to the registered addressof one of the joint holders who is first named on the Register, or to such person and to such addressas the holder or joint holders may in writing direct. Every such cheque or warrants shall be made payableto the order of the person to whom it is sent or to such person as the holder or joint holders may directand payment of the cheque or warrant if purporting to be duly endorsed shall be a good discharge tothe Company. Every such cheque or warrant shall be sent at the risk of the person entitled to the moneyrepresented thereby.
4) Insert the words 'of the Ordinance or any statutory modifications thereof for the time being in force' before fullstop in Line-2 in clause 98 (1). The revised clause will be renumbered as '98' and shall read as under:
98. Auditors shall be appointed and their duties regulated in accordance with Sections 252 to 255 of theOrdinance or any statutory modifications thereof for the time being in force.
5) Delete the clause 98 (2), as this has become redundant.
6) Delete the clause 98 (3), as this has become redundant.”
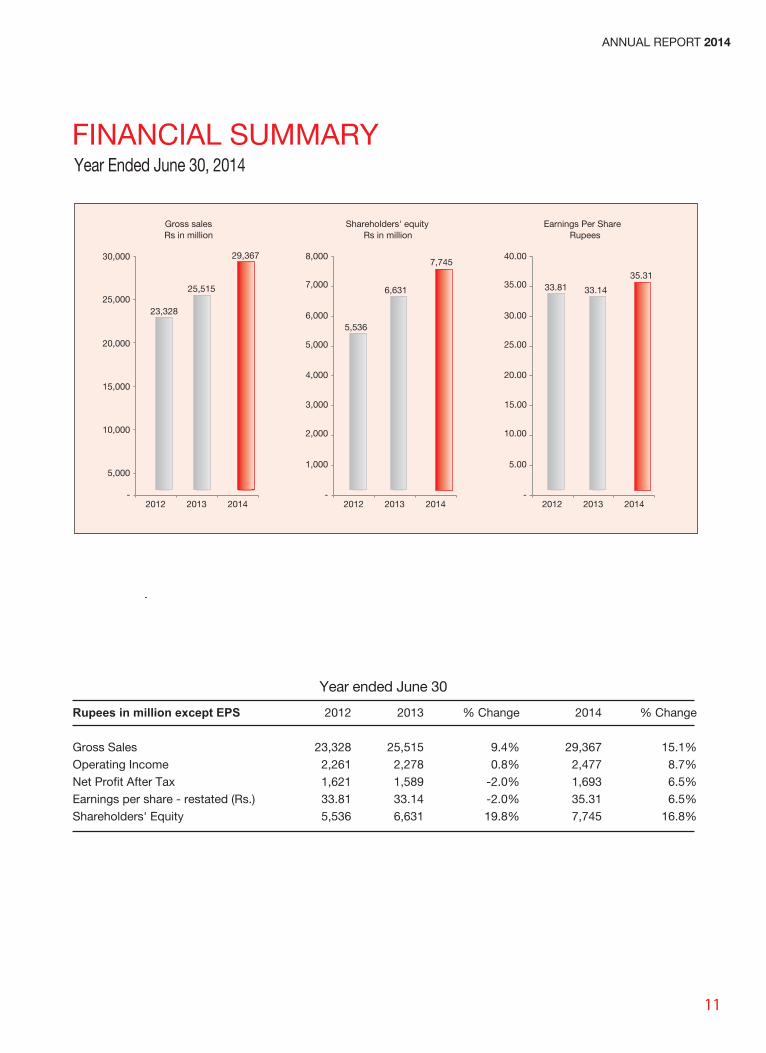
FINANCIAL SUMMARYYear Ended June 30, 2014
Earnings Per ShareRupees
Shareholders' equityRs in million
Gross salesRs in million
23,328
29,367
10,000
15,000
2012 2013 2014
5,000
20,000
25,000
5,536
6,631
2,000
3,000
2012 2013 2014
1,000
4,000
6,000
5,000
Rupees in million except EPS
Gross SalesOperating IncomeNet Profit After TaxEarnings per share - restated (Rs.)Shareholders' Equity
2013
25,515 2,278 1,589 33.14 6,631
% Change
9.4%0.8%
-2.0%-2.0%19.8%
2014
29,3672,4771,69335.317,745
% Change
15.1%8.7%6.5%6.5%
16.8%
Year ended June 30
30,000
25,515
8,0007,745
2012
23,328 2,261 1,621 33.81 5,536
7,000
--
33.81 33.14
10.00
15.00
2012 2013 2014
5.00
20.00
30.00
25.00
40.00
35.3135.00
-
11
ANNUAL REPORT 2014
12
DIRECTORS’ REPORT
The Directors of your Company are pleased to present the Annual Report with the audited financial statements of theCompany for the year ended June 30, 2014.
Financial Highlights
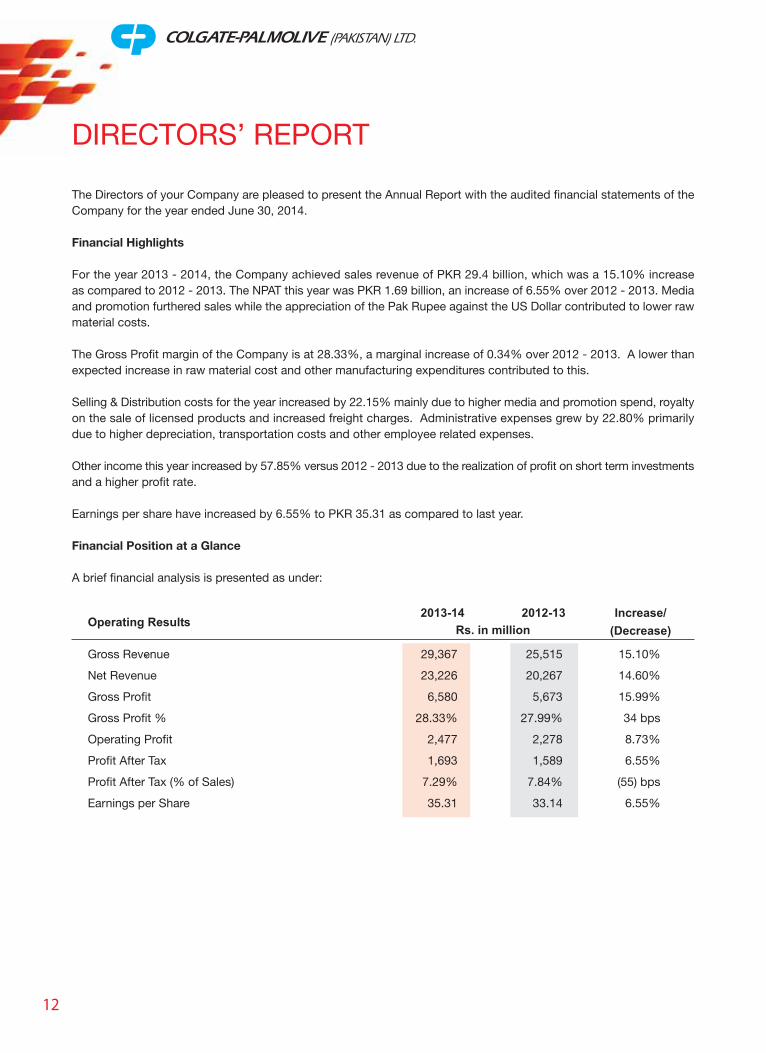
For the year 2013 - 2014, the Company achieved sales revenue of PKR 29.4 billion, which was a 15.10% increaseas compared to 2012 - 2013. The NPAT this year was PKR 1.69 billion, an increase of 6.55% over 2012 - 2013. Mediaand promotion furthered sales while the appreciation of the Pak Rupee against the US Dollar contributed to lower rawmaterial costs.
The Gross Profit margin of the Company is at 28.33%, a marginal increase of 0.34% over 2012 - 2013. A lower thanexpected increase in raw material cost and other manufacturing expenditures contributed to this.
Selling & Distribution costs for the year increased by 22.15% mainly due to higher media and promotion spend, royaltyon the sale of licensed products and increased freight charges. Administrative expenses grew by 22.80% primarilydue to higher depreciation, transportation costs and other employee related expenses.
Other income this year increased by 57.85% versus 2012 - 2013 due to the realization of profit on short term investmentsand a higher profit rate.
Earnings per share have increased by 6.55% to PKR 35.31 as compared to last year.
Financial Position at a Glance
A brief financial analysis is presented as under:
2013-14 2012-13 Increase/(Decrease)
Operating Results
Gross Revenue 29,367 25,515 15.10%
Net Revenue 23,226 20,267 14.60%
Gross Profit 6,580 5,673 15.99%
Gross Profit % 28.33% 27.99% 34 bps
Operating Profit 2,477 2,278 8.73%
Profit After Tax 1,693 1,589 6.55%
Profit After Tax (% of Sales) 7.29% 7.84% (55) bps
Earnings per Share 35.31 33.14 6.55%
Rs. in million
Business Performance Highlights
While the competitive environment has become very challenging, the Company is launching new andinnovative products to grow our business profitably. Furthermore, shopper and customer programs were rolled outto increase engagement at relevant touch points to drive market share.
Oral Care witnessed another successful year where effective advertising and promotional support drove both volumegrowth and market share. Colgate SlimSoft Charcoal toothbrush was launched which features unique charcoal-infusedbristles for superior bacteria removal. Combined with the 0.01 mm ultra-soft tapered bristles, this is an ideal toothbrushfor everyday use.
In the fastest growing Sensitivity segment, we launched Colgate Sensitive Pro-Relief. Its revolutionary Pro-Argintechnology helps patients find instant and long lasting relief from tooth sensitivity pain. With the support of an impactfulintegrated marketing campaign and a strong dentist and patient sampling drive, this product has strengthened Colgate'sleadership and helped us become a major player in the Sensitivity segment.
Palmolive bar soap growth came under pressure in the latter half of the year as we saw local soap manufacturers sufferby the influx of imported soaps brought into the country at a price much lower than the raw material cost ofmanufacturing. A combined effort at the industry level has been initiated to move the authorities to eliminate this costdisadvantage to local manufacturers and provide a level playing field.
In the Home Care category we continued to face intensified competition and have invested in advertising and promotionto defend and grow our market share. Our dish washing products performed well which delivered good growth. Wecontinued to focus on conversion activities from cheap/local bars with Max Bar. A new dish washing liquid, Max Ultrawas recently launched in the premium segment to gain share in the top end retail.
Targeting to increase the fabric detergents' user base, Bonus Tristar continued to engage laundry soap consumersfor conversion. In the premium segment Brite Anti-Bacterial successfully reached new consumers with it's laboratoryproven benefit of 99% germ removal versus ordinary detergents. A fully integrated marketing campaign focused ongerm removal from clothes improved assortment and share of shelf for Brite equity.
At Colgate, we are increasing our investment behind improving distribution network and systems to maximize ourproducts availability to consumers in both urban and rural markets. We remained focused in providing our retail partnersand shoppers the best service and value to deliver incremental growth.
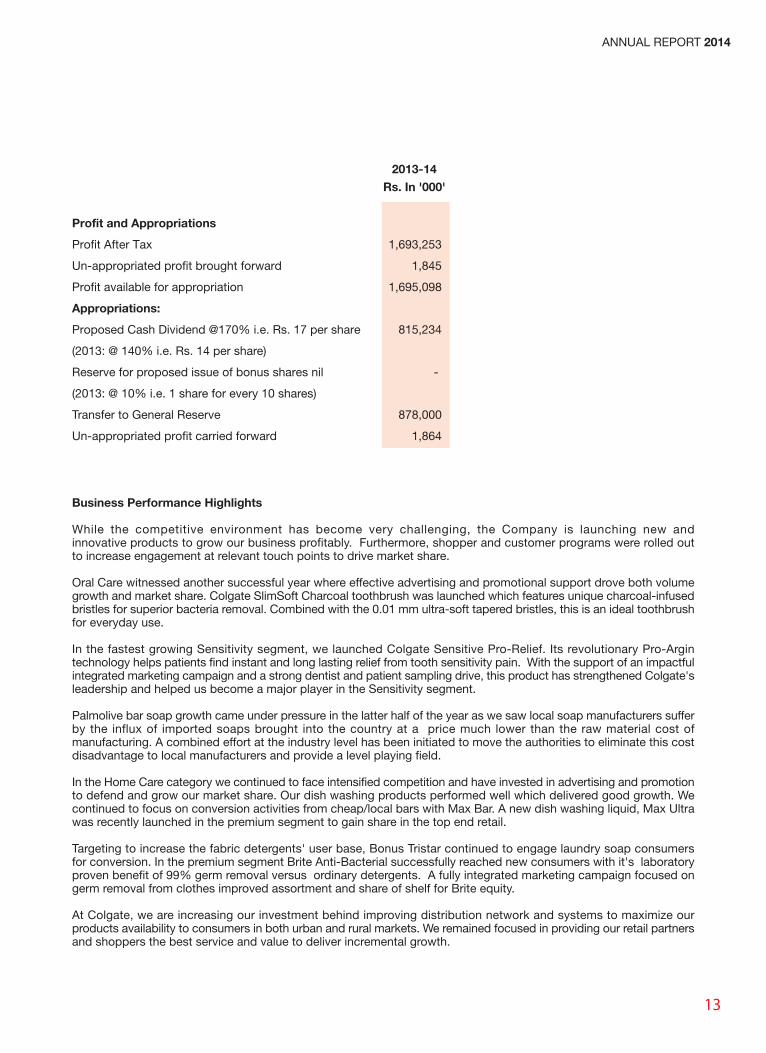
Profit and Appropriations
Profit After Tax 1,693,253
Un-appropriated profit brought forward 1,845
Profit available for appropriation 1,695,098
Appropriations:
Proposed Cash Dividend @170% i.e. Rs. 17 per share 815,234
(2013: @ 140% i.e. Rs. 14 per share)
Reserve for proposed issue of bonus shares nil -
(2013: @ 10% i.e. 1 share for every 10 shares)
Transfer to General Reserve 878,000
Un-appropriated profit carried forward 1,864
2013-14
Rs. In '000'
13
ANNUAL REPORT 2014
14
Corporate Social Responsibility
With a commitment to improve oral health in Pakistan, our global health education program (Bright Smiles, BrightFutures) has reached more than 7.3 million children since its inception in both urban and rural Pakistan. The programwhich is very popular in schools across Pakistan, engages children to learn about oral hygiene in a fun manner.
In its 14th year of partnering with hundreds of schools across Pakistan, the Global Art Contest based on the theme'My Bright Smile' saw another successful year. This contest not only provides children an opportunity to showcasetheir talent on an international level but also to learn about good oral hygiene practices. This year as well, an overwhelmingparticipation was recorded.
Dental Health weeks were organized in big urban centers, smaller towns and rural areas to provide free dental checkupsand spread oral hygiene awareness amongst masses. Instrumental in increasing our reach to people in these smalltowns and villages with no access to dental care services are our mobile dental units. Operated with qualified dentists,these mobile units examine patients' oral health and educate them about good oral hygiene practices to prevent dentalailments.
The Company also endeavored to give back to the society on World Environment Day by organizing visits to schoolsand arranging lectures on the environment for children. It also conducted tree plantation drives.
Future Outlook
In the wake of the expected Pak Rupee depreciation, the Company anticipates increase in raw material costs especiallyin its detergent business that will further put pressure on margins. The Company is focused on optimizing its operationsand associated costs for greater efficiencies that deliver savings to reduce pressure on margins.
The security concerns in the country also continue to be a challenge.
Despite competitive and macroeconomic challenges, we expect our growth momentum to continue in 2014-15. Weare pleased that we have a full new product pipeline to deliver the incremental volume that will support the Companyto achieve sustained, profitable growth.
The competition will intensify efforts in capturing market share through increased spending. However with faster speed-to-market, highly engaging consumer and shopper programs and strong business relationships with our trade partners,the Company is confident it will perform well in the market place.
Financial & Corporate Reporting Framework
The Directors are pleased to state that the Company is compliant with the provisions of the Code of CorporateGovernance as required by Securities & Exchange Commission of Pakistan (SECP).
Following are the statements on Corporate and Financial Reporting Framework:
• The financial statements prepared by the management of the Company present its state of affairs fairly, theresults of its operations, cash flows and changes in equity.
• The Company has maintained proper books of accounts.
• Appropriate accounting policies have been consistently applied in preparation of financial statements andaccounting estimates are based on reasonable and prudent judgment.
• International Financial Reporting Standards, as applicable in Pakistan, have been followed in preparation offinancial statements.
• The system of internal control is sound in design and has been effectively implemented and monitored.
• There are no doubts on the Company's ability to continue as a going concern.
• There has been no material departure from the best practices of corporate governance, as detailed in the listingregulations except as stated in the statement of compliance.
• Summary of key operational and financial data for the last six years annexed in this annual report.
• Information about taxes and levies is given in the notes to and forming part of financial statements.
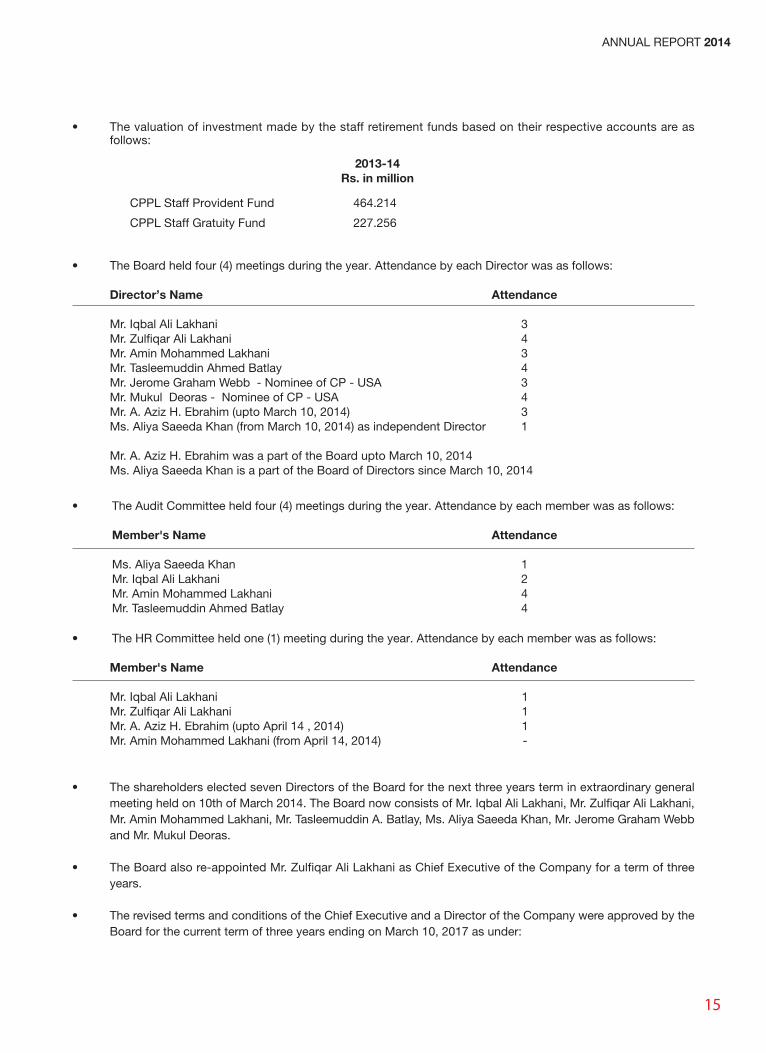
• The Board held four (4) meetings during the year. Attendance by each Director was as follows:
Director’s Name Attendance
Mr. Iqbal Ali Lakhani 3Mr. Zulfiqar Ali Lakhani 4Mr. Amin Mohammed Lakhani 3Mr. Tasleemuddin Ahmed Batlay 4Mr. Jerome Graham Webb - Nominee of CP - USA 3Mr. Mukul Deoras - Nominee of CP - USA 4Mr. A. Aziz H. Ebrahim (upto March 10, 2014) 3Ms. Aliya Saeeda Khan (from March 10, 2014) as independent Director 1
Mr. A. Aziz H. Ebrahim was a part of the Board upto March 10, 2014Ms. Aliya Saeeda Khan is a part of the Board of Directors since March 10, 2014
CPPL Staff Provident Fund 464.214
CPPL Staff Gratuity Fund 227.256
2013-14Rs. in million
• The valuation of investment made by the staff retirement funds based on their respective accounts are asfollows:
• The Audit Committee held four (4) meetings during the year. Attendance by each member was as follows:
Member's Name Attendance
Ms. Aliya Saeeda Khan 1Mr. Iqbal Ali Lakhani 2Mr. Amin Mohammed Lakhani 4Mr. Tasleemuddin Ahmed Batlay 4
• The HR Committee held one (1) meeting during the year. Attendance by each member was as follows:
Member's Name Attendance
Mr. Iqbal Ali Lakhani 1Mr. Zulfiqar Ali Lakhani 1Mr. A. Aziz H. Ebrahim (upto April 14 , 2014) 1Mr. Amin Mohammed Lakhani (from April 14, 2014) -
• The shareholders elected seven Directors of the Board for the next three years term in extraordinary generalmeeting held on 10th of March 2014. The Board now consists of Mr. Iqbal Ali Lakhani, Mr. Zulfiqar Ali Lakhani,Mr. Amin Mohammed Lakhani, Mr. Tasleemuddin A. Batlay, Ms. Aliya Saeeda Khan, Mr. Jerome Graham Webband Mr. Mukul Deoras.
• The Board also re-appointed Mr. Zulfiqar Ali Lakhani as Chief Executive of the Company for a term of threeyears.
• The revised terms and conditions of the Chief Executive and a Director of the Company were approved by theBoard for the current term of three years ending on March 10, 2017 as under:
15
ANNUAL REPORT 2014
16
Karachi: July 24, 2014
On behalf of Board of Directors
IQBAL ALI LAKHANIChairman
(1) Mr. Zulfiqar Ali Lakhani
Remuneration : Gross aggregate annual sum not exceeding Rs. 33million (Rupees Thirty Three Million) This will includehouse rent allowance.
Perquisites and allowances
Bonuses : As may be determined from year to year andapproved by the Board.
Electricity, Gas, Water : Bills at actual and Telephone at Residence
Conveyance : Company maintained car with driver.
Provident Fund, Medical, : As per Company's policy, rules andLeave and Retirement regulations in force for the time beingBenefits and as amended from time to time.
(2) Mr. Tasleemuddin Ahmed Batlay
Remuneration : Gross aggregate annual sum not exceeding Rs. 10million (Rupees Ten Million). This will include houserent allowance.
Perquisites and allowances
Conveyance, : As per Company's policy, rules and Provident Fund, regulations in force for the time being Bonuses, Medical, Leave, and as amended from time to time. Utilities at Residence, Telephone
and Retirement Benefits
• Mr. Zulfiqar Ali Lakhani - the Chief Executive and Mr. Tasleemuddin A. Batlay - Director of the Company andbeing shareholders of the Company have interest to the extent of remuneration and avail perquisites, benefitsand allowances to which they are entitled.
Auditors
The Auditors, Messrs A. F. Ferguson & Co., Chartered Accountants, retire at the conclusion of the 36th
Annual General Meeting. Being eligible, they have offered themselves for re-appointment.
Pattern of Shareholding
A statement showing pattern of shareholdings of the Company and additional information as at June 30, 2014 isincluded in the report.
The Board has determined threshold under clause xvi(l) of CCG-2012 in respect of trading of Company's shares byexecutives and employees who are drawing annual basic salary of Rs.1.5 million or more.
Acknowledgement
We would like to thank our customers for their loyalty and trust in our brands. We would also like to acknowledge thecontinued support of our shareholders, bankers and suppliers, and our employees for their dedication and contributionto the Company.
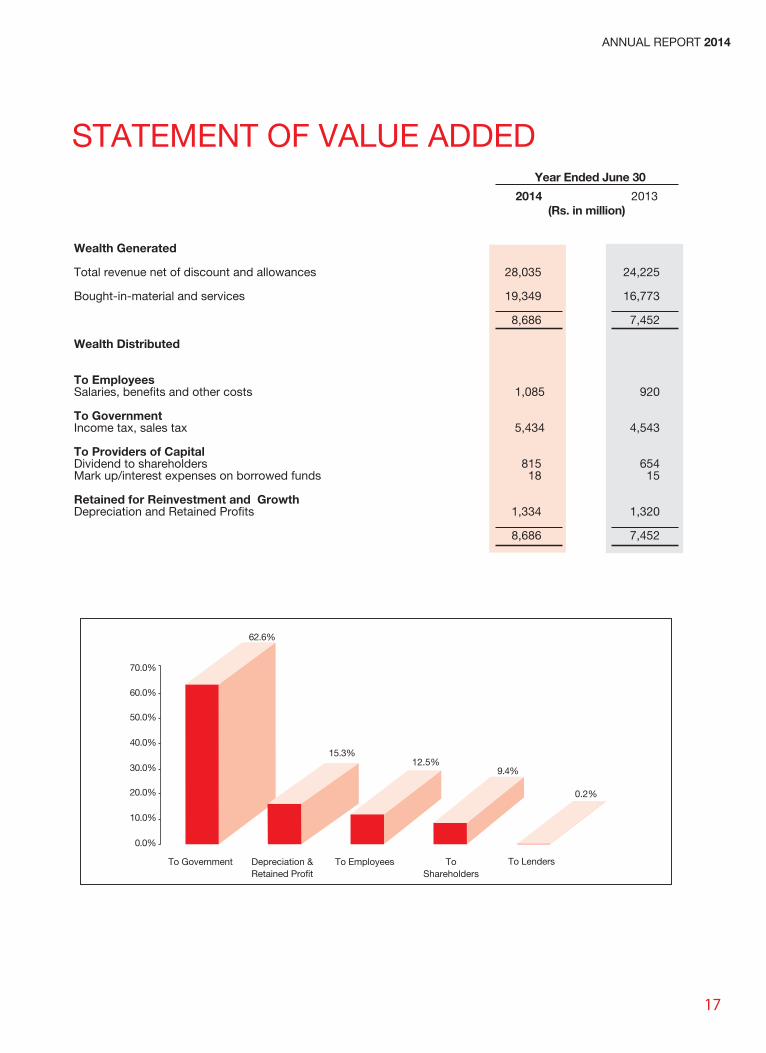
STATEMENT OF VALUE ADDED
Wealth Generated
Total revenue net of discount and allowances 28,035 24,225
Bought-in-material and services 19,349 16,773
8,686 7,452
Wealth Distributed
To EmployeesSalaries, benefits and other costs 1,085 920
To GovernmentIncome tax, sales tax 5,434 4,543
To Providers of CapitalDividend to shareholders 815 654Mark up/interest expenses on borrowed funds 18 15
Retained for Reinvestment and GrowthDepreciation and Retained Profits 1,334 1,320
8,686 7,452
Year Ended June 30
(Rs. in million)2014 2013
0.0%
10.0%
20.0%
30.0%
40.0%
50.0%
60.0%
9.4%
ToShareholders
12.5%
To Employees
62.6%
To Government
15.3%
Depreciation &Retained Profit
0.2%
To Lenders
70.0%
17
ANNUAL REPORT 2014
18
STATEMENT OF COMPLIANCE WITH THECODE OF CORPORATE GOVERNANCEFOR THE YEAR ENDED JUNE 30, 2014
This statement is being presented to comply with the Code of Corporate Governance contained in Regulation No.35of listing regulations of Karachi & Lahore Stock Exchanges for the purpose of establishing a framework of goodgovernance, whereby a listed Company is managed in compliance with the best practices of corporate governance.
The Company has applied the principles contained in the CCG in the following manner:
1. The Company encourages representation of independent non-executive Directors and Directors representingminority interests on its Board of Directors. The newly elected Board comprises of the following:
Category Name
Independent Director Ms. Aliya Saeeda Khan
Executive Directors M/s. Zulfiqar Ali Lakhani and Tasleemuddin A. Batlay
Non-Executive Directors M/s. Iqbal Ali Lakhani, Amin Mohammed Lakhani,Jerome Graham Webb and Mukul Deoras
2. The Directors have confirmed that none of them is serving as a Director in more than seven listed companies,including this Company.
3. All the resident Directors of the Company are registered as taxpayers and none of them has defaulted in paymentof any loan to a Banking company, a DFI or an NBFI.
4. The election of the Directors were held during the year in which seven Directors were elected for a term of threeyears. No casual vacancy occurred on the Board during the current year.
5. The Company has prepared a “Code of Conduct” and has ensured that appropriate steps have been taken todisseminate it throughout the Company along with its supporting policies and procedures.
6. The Board has developed a vision/mission statement, overall corporate strategy and significant policies of theCompany. A complete record of particulars of significant policies alongwith the dates on which they wereapproved or amended has been maintained.
7. All the powers of the Board have been duly exercised and decisions on material transactions, includingappointment and determination of remuneration and terms and conditions of employment of the CEO and otherexecutive Director have been taken by the Board.
8. The meetings of the Board were presided over by the Chairman and, in his absence, by a Director elected bythe Board for this purpose and the Board met at least once in every quarter. Written notices of the Boardmeetings, alongwith agenda and working papers, were circulated at least seven days before the meetings. Theminutes of the meetings were appropriately recorded and circulated. The Chairman Audit Committee was,however, unable to attend the preceding Annual General Meeting of the Company.
9. In accordance with the criteria specified on clause (xi) of CCG, majority of Directors of the Company areexempted from the requirement of Directors' training program and rest of the Directors to be trained withinspecified time.
10. The Board has approved appointment of CFO including their remuneration and terms and conditions of
Karachi: July 24, 2014
Zulfiqar Ali LakhaniChief Executive
Tasleemuddin Ahmed BatlayDirector
employment. Mr. Mansoor Ahmed was assigned the responsibilities of Company Secretary of Colgate-Palmolive(Pakistan) Limited in addition to his responsibilities in other Group Companies. Internal Audit function of theCompany was outsourced with the approval of the Board. The Board has approved appointment of Head ofInternal Audit and terms and conditions of his appointment.
11. The Directors' report for this year has been prepared in compliance with the requirements of the CCG and fullydescribes the salient matters required to be disclosed.
12. The financial statements of the Company were duly endorsed by CEO and CFO before approval of the Board.
13. The Directors, CEO and Executives do not hold any interest in the shares of the Company other than thatdisclosed in the pattern of shareholding.
14. The Company has complied with all the corporate and financial reporting requirements of the CCG. Annualevaluation of the Board's own performance is in process.
15. During the year as a result of constitution of the audit committee following the election of the Board, the auditcommittee from March,2014 comprises two non-executive directors and one executive director. Subsequentto the year end the Company is taking measures to reconstitute the audit committee in accordance with therequirements of the Code.
16. The meetings of the Audit Committee were held at least once every quarter prior to approval of interim and finalresults of the Company. The Terms of Reference of the Committee have been formed and advised to theCommittee for compliance.
17. The Board has formed a HR and Remuneration Committee. It comprises of three members, of whom two arenon executive Directors and the Chairman of the Committee is a non executive Director.
18. The Board has outsourced internal audit function of the Company to a firm of Chartered Accountants, who areconsidered suitably qualified and experienced for the purpose and are conversant with the policies and procedureof the Company.
19. The statutory auditors of the Company have confirmed that they have been given a satisfactory rating underthe quality control review program of the Institute of Chartered Accountants of Pakistan, that they or any ofthe partners of the firm, their spouses and minor children do not hold shares of the Company and that the firmand all its partners are in compliance with International Federation of Accountants (IFAC) guidelines on Codeof Ethics as adopted by the Institute of Chartered Accountants of Pakistan.
20. The statutory auditors or the persons associated with them have not been appointed to provide other servicesexcept in accordance with the listing regulations and the auditors have confirmed that they have observed IFACguidelines in this regard.
21. The 'closed period' prior of the announcement of interim/final results, and business decisions, which maymaterially affect the market price of Company's securities, was determined and intimated to directors, employeesand stock exchanges(s).
22. Material/price sensitive information has been disseminated among all market participants at once through stockexchange(s).
23. We confirm that all other material principles enshrined in the CCG have been complied with.
19
ANNUAL REPORT 2014

20
REVIEW REPORT TO THE MEMBERS ON STATEMENT OFCOMPLIANCE WITH BEST PRACTICES OF CODE OF CORPORATEGOVERNANCE
A.F. FERGUSON & CO.Chartered Accountants
A. F. FERGUSON & CO.
A. F. FERGUSON & CO., Chartered Accountants, a member firm of the PwC networkState Life Building No. 1-C, I.I Chundrigar Road, P.O. Box 4716, Karachi-74000, PakistanTel: +92 (21) 32426682-6/32426711-5; Fax: +92 (21) 32415007/32427938; <www.pwc.com/pk>
Lahore: 23-C, Aziz Avenue, Canal Bank, Gulberg V, P.O.Box 39, Shahrah-e-Quaid-e-Azam, Lahore-54660, Tel: +92 (42) 35715864-71; Fax: +92 (42) 35715872Islamabad: PIA Building, 3rd Floor, 49 Blue Area, Fazl-ul-Haq Road, P.O.Box 3021, Islamabad-44000; Tel: +92 (51) 2273457-60; Fax: +92 (51) 2277924Kabul: House No. 1916, Street No. 1, Behind Cinema Bariqot, Nahar-e-Darsan, Karte-4, Kabul, Afghanistan; Tel: +93 (779) 315320, +93 (799) 315320
We have reviewed the enclosed Statement of Compliance with the best practices contained in the Code of CorporateGovernance (the Code) prepared by the Board of Directors of Colgate-Palmolive (Pakistan) Limited for the year endedJune 30, 2014 to comply with the requirements of Listing Regulation No. 35 of the Karachi and Lahore Stock Exchangeswhere the Company is listed.
The responsibility for compliance with the Code is that of the Board of Directors of the Company. Our responsibilityis to review, to the extent where such compliance can be objectively verified, whether the Statement of Compliancereflects the status of the Company's compliance with the provisions of the Code and report if it does not and to highlightany non-compliance with the requirements of the Code. A review is limited primarily to inquiries of the Company'spersonnel and review of various documents prepared by the Company to comply with the Code.
As a part of our audit of the financial statements we are required to obtain an understanding of the accounting andinternal control systems sufficient to plan the audit and develop an effective audit approach. We are not required toconsider whether the Board of Directors' statement on internal control covers all risks and controls or to form anopinion on the effectiveness of such internal controls, the Company's corporate governance procedures and risks.
The Code requires the Company to place before the Audit Committee, and upon recommendation of the AuditCommittee, place before the Board of Directors for their review and approval its related party transactions distinguishingbetween transactions carried out on terms equivalent to those that prevail in arm's length transactions and transactionswhich are not executed at arm's length price and recording proper justification for using such alternate pricingmechanism. We are only required and have ensured compliance of this requirement to the extent of the approval ofthe related party transactions by the Board of Directors upon recommendation of the Audit Committee. We have notcarried out any procedures to determine whether the related party transactions were undertaken at arm's length priceor not.
Based on our review, nothing has come to our attention which causes us to believe that the Statement of Compliancedoes not appropriately reflect the Company's compliance, in all material respects, with the best practices containedin the Code as applicable to the Company for the year ended June 30, 2014.
Further, we would like to highlight below instances of non-compliance with the requirements of the Code as reflectedin point reference where these are stated in the Statement of Compliance:
S. No. Paragraph Descriptionreference
i. 7 The mechanism is in the process of development for an annual evaluation of the board'sown performance.
ii. 8 The chairman of Audit Committee was unable to attend the preceding Annual GeneralMeeting held on September 18, 2013.
iii. 15 From March, 2014 the audit committee comprises of two non-executive and one executivedirector instead of three non-executive directors as required by the Code.
Karachi, July 24, 2014
21
ANNUAL REPORT 2014
A. F. FERGUSON & CO.
A. F. FERGUSON & CO., Chartered Accountants, a member firm of the PwC networkState Life Building No. 1-C, I.I Chundrigar Road, P.O. Box 4716, Karachi-74000, PakistanTel: +92 (21) 32426682-6/32426711-5; Fax: +92 (21) 32415007/32427938; <www.pwc.com/pk>
Lahore: 23-C, Aziz Avenue, Canal Bank, Gulberg V, P.O.Box 39, Shahrah-e-Quaid-e-Azam, Lahore-54660, Tel: +92 (42) 35715864-71; Fax: +92 (42) 35715872Islamabad: PIA Building, 3rd Floor, 49 Blue Area, Fazl-ul-Haq Road, P.O.Box 3021, Islamabad-44000; Tel: +92 (51) 2273457-60; Fax: +92 (51) 2277924Kabul: House No. 1916, Street No. 1, Behind Cinema Bariqot, Nahar-e-Darsan, Karte-4, Kabul, Afghanistan; Tel: +93 (779) 315320, +93 (799) 315320
AUDITORS' REPORT TO THE MEMBERS
We have audited the annexed balance sheet of Colgate-Palmolive (Pakistan) Limited as at June 30, 2014 and therelated profit and loss account, statement of changes in equity and cash flow statement together with the notes formingpart thereof, for the year then ended and we state that we have obtained all the information and explanations which,to the best of our knowledge and belief, were necessary for the purposes of our audit.
It is the responsibility of the Company's management to establish and maintain a system of internal control, andprepare and present the above said statements in conformity with the approved accounting standards and therequirements of the Companies Ordinance, 1984. Our responsibility is to express an opinion on these statementsbased on our audit.
We conducted our audit in accordance with the auditing standards as applicable in Pakistan. These standards requirethat we plan and perform the audit to obtain reasonable assurance about whether the above said statements are freeof any material misstatement. An audit includes examining, on a test basis, evidence supporting the amounts anddisclosures in the above said statements. An audit also includes assessing the accounting policies and significantestimates made by management, as well as, evaluating the overall presentation of the above said statements. Webelieve that our audit provides a reasonable basis for our opinion and, after due verification, we report that-
(a) in our opinion, proper books of account have been kept by the Company as required by the CompaniesOrdinance, 1984;
(b) in our opinion-
(i) the balance sheet and profit and loss account together with the notes thereon have been drawn up inconformity with the Companies Ordinance, 1984, and are in agreement with the books of account andare further in accordance with accounting policies consistently applied.
(ii) the expenditure incurred during the year was for the purpose of the Company's business; and
(iii) the business conducted, investments made and the expenditure incurred during the year were in accordancewith the objects of the Company;
(c) in our opinion and to the best of our information and according to the explanations given to us, the balancesheet, profit and loss account, statement of changes in equity and cash flow statement together with the notesforming part thereof conform with approved accounting standards as applicable in Pakistan, and give theinformation required by the Companies Ordinance, 1984, in the manner so required and respectively give atrue and fair view of the state of the Company's affairs as at June 30, 2014 and of the profit, its changes inequity and cash flows for the year then ended; and
(d) in our opinion, Zakat deductible at source under the Zakat and Ushr Ordinance, 1980, was deducted by theCompany and deposited in the Central Zakat Fund established under section 7 of that Ordinance.
Karachi, July 24, 2014
A.F. FERGUSON & CO.Chartered Accountants
Audit Engagement Partner: Saad Kaliya
22
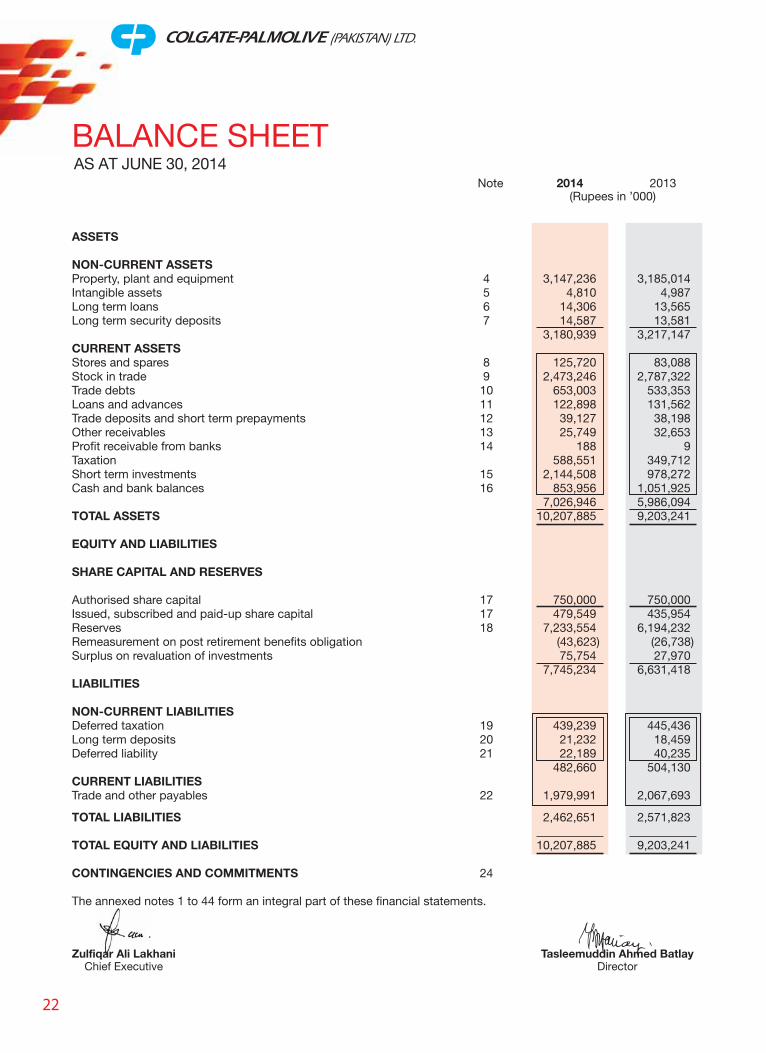
BALANCE SHEETAS AT JUNE 30, 2014
Zulfiqar Ali LakhaniChief Executive
Tasleemuddin Ahmed BatlayDirector
(Rupees in ’000)2014 2013Note
ASSETS
NON-CURRENT ASSETSProperty, plant and equipment 4 3,147,236 3,185,014Intangible assets 5 4,810 4,987Long term loans 6 14,306 13,565Long term security deposits 7 14,587 13,581
3,180,939 3,217,147CURRENT ASSETSStores and spares 8 125,720 83,088Stock in trade 9 2,473,246 2,787,322Trade debts 10 653,003 533,353Loans and advances 11 122,898 131,562Trade deposits and short term prepayments 12 39,127 38,198Other receivables 13 25,749 32,653Profit receivable from banks 14 188 9Taxation 588,551 349,712Short term investments 15 2,144,508 978,272Cash and bank balances 16 853,956 1,051,925
7,026,946 5,986,094TOTAL ASSETS 10,207,885 9,203,241
EQUITY AND LIABILITIES
SHARE CAPITAL AND RESERVES
Authorised share capital 17 750,000 750,000Issued, subscribed and paid-up share capital 17 479,549 435,954Reserves 18 7,233,554 6,194,232Remeasurement on post retirement benefits obligation (43,623) (26,738)Surplus on revaluation of investments 75,754 27,970
7,745,234 6,631,418LIABILITIES
NON-CURRENT LIABILITIESDeferred taxation 19 439,239 445,436Long term deposits 20 21,232 18,459Deferred liability 21 22,189 40,235
482,660 504,130CURRENT LIABILITIESTrade and other payables 22 1,979,991 2,067,693
TOTAL LIABILITIES 2,462,651 2,571,823
TOTAL EQUITY AND LIABILITIES 10,207,885 9,203,241
CONTINGENCIES AND COMMITMENTS 24
The annexed notes 1 to 44 form an integral part of these financial statements.
23
ANNUAL REPORT 2014
Zulfiqar Ali LakhaniChief Executive
Tasleemuddin Ahmed BatlayDirector
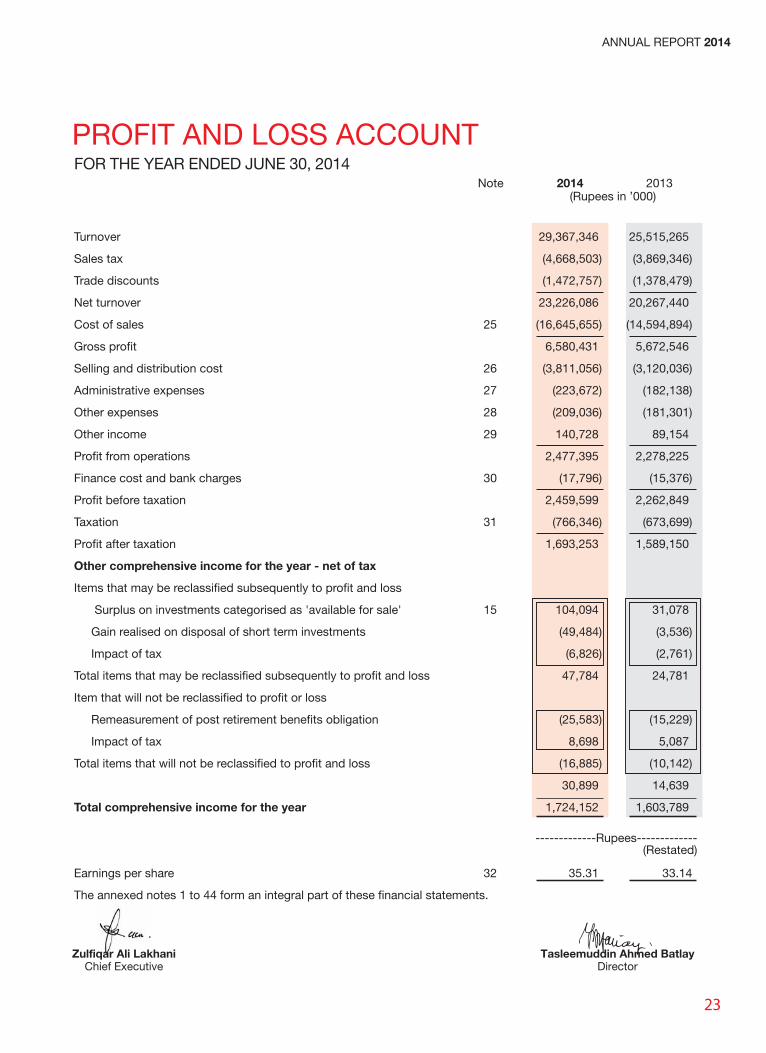
PROFIT AND LOSS ACCOUNTFOR THE YEAR ENDED JUNE 30, 2014
(Rupees in ’000)2014 2013Note
Turnover 29,367,346 25,515,265
Sales tax (4,668,503) (3,869,346)
Trade discounts (1,472,757) (1,378,479)
Net turnover 23,226,086 20,267,440
Cost of sales 25 (16,645,655) (14,594,894)
Gross profit 6,580,431 5,672,546
Selling and distribution cost 26 (3,811,056) (3,120,036)
Administrative expenses 27 (223,672) (182,138)
Other expenses 28 (209,036) (181,301)
Other income 29 140,728 89,154
Profit from operations 2,477,395 2,278,225
Finance cost and bank charges 30 (17,796) (15,376)
Profit before taxation 2,459,599 2,262,849
Taxation 31 (766,346) (673,699)
Profit after taxation 1,693,253 1,589,150
Other comprehensive income for the year - net of tax
Items that may be reclassified subsequently to profit and loss
Surplus on investments categorised as 'available for sale' 15 104,094 31,078
Gain realised on disposal of short term investments (49,484) (3,536)
Impact of tax (6,826) (2,761)
Total items that may be reclassified subsequently to profit and loss 47,784 24,781
Item that will not be reclassified to profit or loss
Remeasurement of post retirement benefits obligation (25,583) (15,229)
Impact of tax 8,698 5,087
Total items that will not be reclassified to profit and loss (16,885) (10,142)
30,899 14,639
Total comprehensive income for the year 1,724,152 1,603,789
Earnings per share 32 35.31 33.14
The annexed notes 1 to 44 form an integral part of these financial statements.
-------------Rupees-------------(Restated)
24
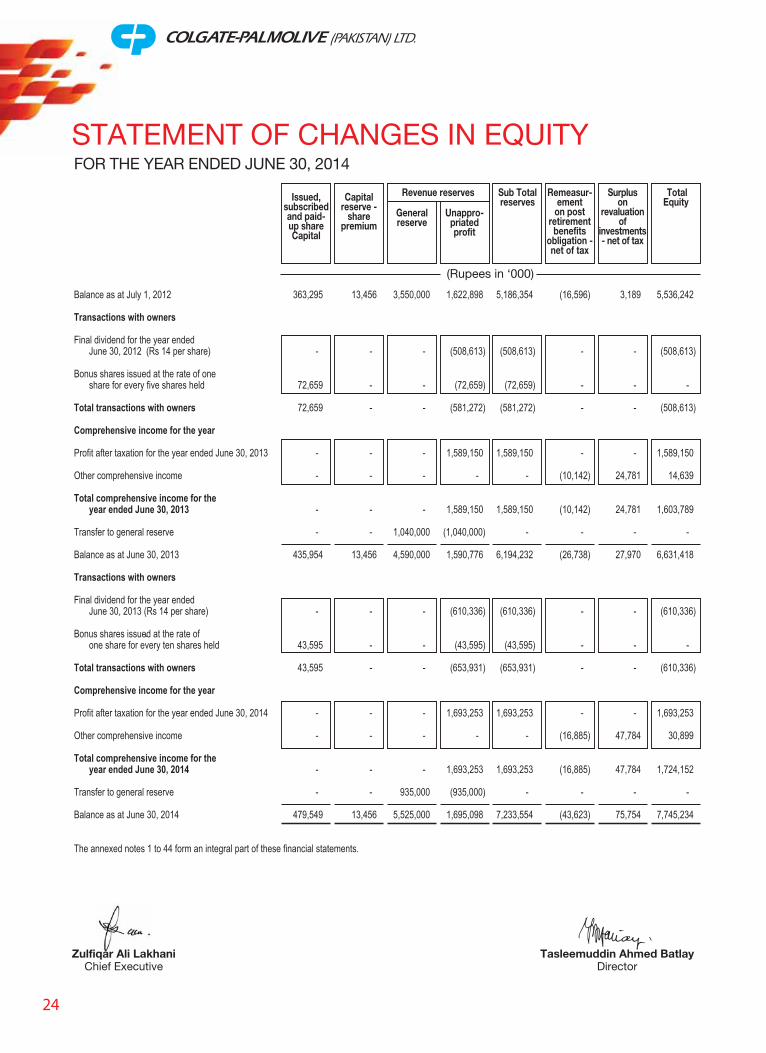
Balance as at July 1, 2012 363,295 13,456 3,550,000 1,622,898 5,186,354 (16,596) 3,189 5,536,242
Transactions with owners
Final dividend for the year ended June 30, 2012 (Rs 14 per share) - - - (508,613) (508,613) - - (508,613)
Bonus shares issued at the rate of oneshare for every five shares held 72,659 - - (72,659) (72,659) - - -
Total transactions with owners 72,659 - - (581,272) (581,272) - - (508,613)
Comprehensive income for the year
Profit after taxation for the year ended June 30, 2013 - - - 1,589,150 1,589,150 - - 1,589,150
Other comprehensive income - - - - - (10,142) 24,781 14,639
Total comprehensive income for the year ended June 30, 2013 - - - 1,589,150 1,589,150 (10,142) 24,781 1,603,789
Transfer to general reserve - - 1,040,000 (1,040,000) - - - -
Balance as at June 30, 2013 435,954 13,456 4,590,000 1,590,776 6,194,232 (26,738) 27,970 6,631,418
Transactions with owners
Final dividend for the year ended June 30, 2013 (Rs 14 per share) - - - (610,336) (610,336) - - (610,336)
Bonus shares issued at the rate of one share for every ten shares held 43,595 - - (43,595) (43,595) - - -
Total transactions with owners 43,595 - - (653,931) (653,931) - - (610,336)
Comprehensive income for the year
Profit after taxation for the year ended June 30, 2014 - - - 1,693,253 1,693,253 - - 1,693,253
Other comprehensive income - - - - - (16,885) 47,784 30,899
Total comprehensive income for theyear ended June 30, 2014 - - - 1,693,253 1,693,253 (16,885) 47,784 1,724,152
Transfer to general reserve - - 935,000 (935,000) - - - -
Balance as at June 30, 2014 479,549 13,456 5,525,000 1,695,098 7,233,554 (43,623) 75,754 7,745,234
The annexed notes 1 to 44 form an integral part of these financial statements.
Zulfiqar Ali LakhaniChief Executive
Tasleemuddin Ahmed BatlayDirector
STATEMENT OF CHANGES IN EQUITYFOR THE YEAR ENDED JUNE 30, 2014
(Rupees in ‘000)
Issued,subscribedand paid-up shareCapital
Generalreserve
Capitalreserve -
sharepremium
Revenue reserves
Unappro-priatedprofit
Sub Totalreserves
Remeasur-ement
on postretirement
benefitsobligation -net of tax
Surpluson
revaluationof
investments- net of tax
TotalEquity
25
ANNUAL REPORT 2014
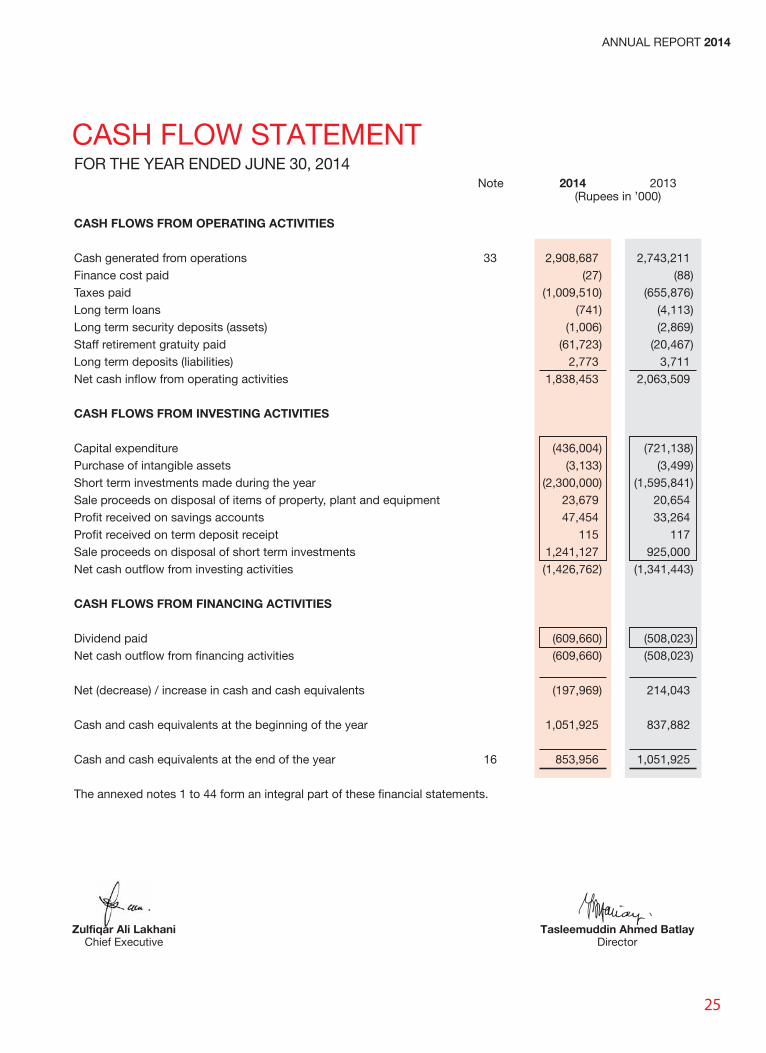
CASH FLOW STATEMENTFOR THE YEAR ENDED JUNE 30, 2014
CASH FLOWS FROM OPERATING ACTIVITIES
Cash generated from operations 33 2,908,687 2,743,211Finance cost paid (27) (88)Taxes paid (1,009,510) (655,876)Long term loans (741) (4,113)Long term security deposits (assets) (1,006) (2,869)Staff retirement gratuity paid (61,723) (20,467)Long term deposits (liabilities) 2,773 3,711Net cash inflow from operating activities 1,838,453 2,063,509
CASH FLOWS FROM INVESTING ACTIVITIES
Capital expenditure (436,004) (721,138)Purchase of intangible assets (3,133) (3,499)Short term investments made during the year (2,300,000) (1,595,841)Sale proceeds on disposal of items of property, plant and equipment 23,679 20,654Profit received on savings accounts 47,454 33,264Profit received on term deposit receipt 115 117Sale proceeds on disposal of short term investments 1,241,127 925,000Net cash outflow from investing activities (1,426,762) (1,341,443)
CASH FLOWS FROM FINANCING ACTIVITIES
Dividend paid (609,660) (508,023)Net cash outflow from financing activities (609,660) (508,023)
Net (decrease) / increase in cash and cash equivalents (197,969) 214,043
Cash and cash equivalents at the beginning of the year 1,051,925 837,882
Cash and cash equivalents at the end of the year 16 853,956 1,051,925
The annexed notes 1 to 44 form an integral part of these financial statements.
(Rupees in ’000)2014 2013Note
Zulfiqar Ali LakhaniChief Executive
Tasleemuddin Ahmed BatlayDirector
26
1. THE COMPANY AND ITS OPERATIONS
Colgate-Palmolive (Pakistan) Limited (the Company) was initially incorporated in Pakistan on December 5, 1977as a public limited company with the name of National Detergents Limited. The name of the Company waschanged to Colgate-Palmolive (Pakistan) Limited on March 28, 1990 when the Company entered into aParticipation Agreement with Colgate-Palmolive Company, USA. The Company is listed on the Karachi andLahore Stock Exchanges. The registered office of the Company is situated at Lakson Square, Building No. 2,Sarwar Shaheed Road, Karachi, Pakistan.
The Company is mainly engaged in the manufacture and sale of detergents, personal care and other relatedproducts.
2. SIGNIFICANT ACCOUNTING INFORMATION AND POLICIES
2.1 Basis of preparation and statement of compliance
These financial statements have been prepared under the historical cost convention unless otherwise specificallystated.
2.2 Statement of compliance
These financial statements have been prepared in accordance with the requirements of the approved accountingstandards as applicable in Pakistan. Approved accounting standards comprise of such International FinancialReporting Standards (IFRSs) issued by the International Accounting Standards Board as are notified under theCompanies Ordinance, 1984 (the Ordinance), provision of and directive issued under the Ordinance. In caserequirements differ, the provisions or directives of the Ordinance shall prevail.
2.3 New standards, amendments to approved accounting standards and new interpretations
2.3.1 New amendments to approved accounting standards and interpretation which became effective duringthe year ended June 30, 2014
There were certain new amendments to the approved accounting standards and a new interpretation issuedby the International Financial Reporting Interpretations Committee (IFRIC) which became effective during theyear but are considered not to be relevant or have any significant effect on the Company's operations and are,therefore, not disclosed in these financial statements.
2.3.2 New standard, amendments to approved accounting standards and new interpretation that is not yeteffective and has not been early adopted by the Company:
There are certain amendments to the approved accounting standards and a new interpretation issued by theInternational Financial Reporting Interpretations Committee (IFRIC) which will be effective after July 1, 2013but are considered not to be relevant or are expected to have any significant effect on the Company's operationsand are, therefore, not disclosed in these financial statements.
2.4 Property, plant and equipment
2.4.1 These assets are stated at cost less accumulated depreciation and accumulated impairment losses, if any,except for leasehold land and capital work in progress which are stated at cost.
Assets having cost exceeding the minimum threshold as determined by the management are capitalised. Allother assets are charged to income in the year when acquired.
NOTES TO AND FORMING PART OF THEFINANCIAL STATEMENTSFOR THE YEAR ENDED JUNE 30, 2014
27
ANNUAL REPORT 2014
Depreciation is charged to income applying the straight line method by applying rates (as stated in note 4.1.1).Depreciation on additions is charged from the month in which the asset is put to use and on disposal upto themonth of disposal at the rates stated in note 4.1.1.
No depreciation is charged if the asset's residual value exceeds its carrying amount.
Residual values and the useful lives are reviewed at each balance sheet date and adjusted if expectations differsignificantly from previous estimates.
Residual values are determined by the management as the amount it expects it would receive currently for anitem of property, plant and equipment if it was already of the age and in the condition expected at the end ofits useful life based on the prevailing market prices of similar assets already at the end of their useful lives.
Useful lives are determined by the management based on the expected usage of assets, physical wear andtear, technical and commercial obsolescence, legal and similar limits on the use of the assets and other similarfactors.
Normal repairs and maintenance are charged to income as and when incurred. Major renewals and improvementsare capitalised.
Profit or loss on disposal of assets is recognised in income currently.
2.4.2 Capital work in progress
All expenditure connected with specific assets incurred during installation and construction period are carriedunder capital work in progress. These are transferred to specific assets as and when assets are available foruse.
2.5 Intangible assets
An intangible asset is an identifiable non-monetary asset without physical substance.
Intangible assets are recognised when it is probable that the expected future economic benefits will flow to theentity and the cost of the asset can be measured reliably. Cost of the intangible asset (i.e. computer software)includes purchase cost and directly attributable expenses incidental to bring the asset for its intended use.
Costs associated with maintaining computer software are recognised as an expense as and when incurred.
Intangible assets are stated at cost less accumulated amortisation and accumulated impairment losses, if any.Amortisation is charged over the estimated useful life of the asset on a systematic basis applying the straightline method.
Useful lives of intangible operating assets are reviewed, at each balance sheet date and adjusted if the impactof amortisation is significant.
2.6 Impairment
The Company assesses at each balance sheet date whether there is any indication that property, plant andequipment and intangible assets may be impaired. If such indication exists, the carrying amounts of such assetsare reviewed to assess whether they are recorded in excess of their recoverable amounts. Where carrying valuesexceed recoverable amounts, assets are written down to their recoverable amounts and the differences arerecognised in income currently.
2.7 Stores and spares
Stores and spares are valued at lower of cost using the moving average method and estimated net realisablevalue. Items in transit are valued at cost as accumulated upto the balance sheet date. Provision for obsoleteitems, if any, is based on their condition as at the balance sheet date depending upon the management'sjudgement.
Loose tools are recognised as expense as and when purchased as their inventory is generally not significant.
28
2.8 Stock in trade
Stock in trade is valued at the lower of cost and estimated net realisable value. Cost is determined as follows:
Stages of stock in trade Basis of valuationRaw and packing material Moving average costRaw and packing material in bonded Cost accumulated upto the balance warehouse and in transit sheet dateWork in process and finished goods Cost of direct materials and appropriate
portion of production overheadsTrading goods Moving average cost
Net realisable value is determined on the basis of estimated selling price of the product in the ordinary courseof business less estimated costs of completion and the estimated costs necessary to be incurred for its sale.
2.9 Trade debts and other receivables
Trade debts are recognised initially at fair value and subsequently measured at amortised cost using the effectiveinterest method less provision for impairment. A provision for impairment of trade debts and other receivablesis established when there is objective evidence that the Company will not be able to collect all amounts dueaccording to the original terms of the receivable. Significant financial difficulties of the debtor, probability thatthe debtor will enter bankruptcy or financial reorganisation, and default or delinquency in payments are consideredindicators that the trade receivable is impaired. Debts, considered irrecoverable, are written off, as and whenidentified.
2.10 Taxation
Current
Provision for current taxation is based on taxable income for the year at the current rates of taxation after takinginto account tax credits and tax rebates available, if any, and tax paid on presumptive basis.
Deferred
Deferred tax is recognised using the balance sheet liability method on all temporary differences between thecarrying amount of the assets and liabilities and their tax bases.
Deferred tax liabilities are recognised for all major taxable temporary differences.
Deferred tax assets are recognised for all major deductible temporary differences to the extent that it is probablethat taxable profit will be available against which the deductible temporary differences can be utilised.
The carrying amount of the deferred tax asset is reviewed at each balance sheet date and is recognised onlyto the extent that it is probable that future taxable profits will be available against which the assets may beutilised. Deferred tax assets are reduced to the extent that it is no longer probable that the related tax benefitwill be realised.
Unrecognised deferred income tax assets are reassessed at each balance sheet date and are recognised tothe extent that it becomes probable that future taxable profit will allow deferred tax asset to be recovered.
Deferred tax assets and liabilities are measured at the tax rate that are expected to apply to the year when theasset is utilised or the liability is settled, based on the tax rates that have been enacted or substantially enactedat the balance sheet date.
2.11 Cash and cash equivalents
Cash and cash equivalents are carried in the balance sheet at cost. For the purpose of the cash flow statement,cash and cash equivalents comprise of cash and cheques in hand, deposits held with banks and runningfinances under mark-up arrangement.
29
ANNUAL REPORT 2014
2.12 Borrowing costs
Borrowing costs relating to the acquisition, construction or production of a qualifying asset are recognised aspart of the cost of that asset. All other borrowing costs are recognised as an expense in the period in whichthese are incurred.
2.13 ProvisionsProvisions are recognised when the Company has a present legal or constructive obligation as a result of pastevents, it is probable that an outflow of resources embodying economic benefits will be required to settle theobligation and a reliable estimate can be made of the amount of the obligation. Provisions are reviewedperiodically and adjusted to reflect the current best estimates.
2.14 Staff retirement benefits
Defined benefit plan
The Company operates a defined benefit plan i.e. an approved funded gratuity scheme for all its permanentemployees subject to attainment of retirement age and minimum service of prescribed period. Contributionsare made to the fund on the basis of actuarial recommendations. Actuarial valuation is carried out using theprojected unit credit method.
All actuarial gains and losses are recognised in 'other comprehensive income' as they occur.
Defined contribution plan
The Company operates an approved funded provident fund scheme for all its permanent employees. Equalmonthly contributions are made, both by the Company and its employees, to the fund at the rate of 9 percentof the basic salaries of employees.
Compensated absences
The liability in respect of compensated absences of employees is accounted for in the period in which theabsences accrue.
2.15 Revenue recognition
- Sales are recognised on despatch of goods to the customers.
- Profit on bank balances are recognised on a time proportion basis on the principal amount outstandingand at the applicable rate.
- Insurance commission income is recognised as and when received.
- Gains / (losses) arising on disposal of investments are included in income currently and are recognisedon the date when the transaction takes place.
- Unrealised gains / (losses) arising on revaluation of securities classified as 'available for sale' are includedin other comprehensive income in the period in which they arise.
2.16 Foreign currency transactions
Transactions in foreign currencies are translated in Pakistan rupees (functional and presentation currency) atthe exchange rate prevailing on the date of transaction. Monetary assets and liabilities in foreign currencies aretranslated into Pakistan rupees at the rates of exchange approximating those prevalent at the balance sheetdate. Exchange differences are charged to income currently.
2.17 Dividend and other appropriations
Dividend is recognised as a liability in the period in which it is declared. Appropriations of profit are reflectedin the statement of changes in equity in the period in which such appropriations are approved.
30
2.18 Financial instruments
2.18.1 Financial assets
The Company classifies its financial assets in the following categories: at fair value through profit or loss, loansand receivables, available for sale and held to maturity. The classification depends on the purpose for whichthe financial assets were acquired. Management determines the classification of its financial assets at the timeof initial recognition.
a) Financial assets at fair value through profit or loss
Financial assets at fair value through profit or loss are financial assets held for trading and financial assetsdesignated upon initial recognition as at fair value through profit or loss. A financial asset is classifiedas held for trading if acquired principally for the purpose of selling in the short term. Assets in thiscategory are classified as current assets.
b) Loans and receivables
Loans and receivables are non-derivative financial assets with fixed or determinable payments that arenot quoted in an active market.
c) Available for sale financial assets
Available for sale financial assets are non-derivatives that are either designated in this category or notclassified in any of the other categories. They are included in non-current assets unless managementintends to dispose of the investments within twelve months from the balance sheet date. Available forsale financial assets are classified as short term investments in the balance sheet.
When securities classified as available for sale are sold or impaired, the accumulated fair value adjustmentsrecognised as "Other comprehensive Income" are included in the profit and loss account as gains andlosses on disposal of short term investments. Interest on available for sale securities calculated usingeffective interest method is recognised in the profit and loss account. Dividends on available for saleequity instruments are recognised in the profit and loss account when the Company's right to receivepayments is established.
d) Held to maturity
Held to maturity are financial assets with fixed or determinable payments and fixed maturity that arequoted in an active market, where management has the intention and ability to hold till maturity arecarried at amortised cost.
All financial assets are recognised at the time when the Company becomes a party to the contractual provisionsof the instrument. Regular purchases and sales of investments are recognised at trade date i.e. the date onwhich the Company commits to purchase or sell the asset.
Financial assets are initially recognised at fair value plus transaction costs for all financial assets not carriedat fair value through profit or loss. Financial assets carried at fair value through profit or loss are initially recognisedat fair value and transaction costs are expensed in the profit and loss account.
Available for sale financial assets and financial assets at fair value through profit or loss are subsequently carriedat fair value. 'Loans and receivables' and 'held to maturity' investments are carried at amortised cost usingeffective interest rate method.
The fair values of quoted investments are based on current prices. If the market for a financial asset is not active(for unlisted securities), the Company measures the investments at cost less impairment in value, if any.
Financial assets are derecognised when the rights to receive cash flows from the assets have expired or havebeen transferred and the Company has transferred substantially all risks and rewards of ownership.
The Company assesses at each balance sheet date whether there is objective evidence that a financial assetor group of financial assets is impaired.
2.18.2 Financial liabilities
All financial liabilities are recognised at the time when the Company becomes a party to the contractual provisionsof the instrument.
31
ANNUAL REPORT 2014
Financial liabilities, other than those at fair value through profit or loss, are measured at amortised cost usingthe effective yield method.
A financial liability is derecognised when the obligation under the liability is discharged or cancelled or expired.Where an existing financial liability is replaced by another from the same lender on substantially different terms,or the terms of an existing liability are substantially modified, such an exchange and modification is treated asa derecognition of the original liability and the recognition of a new liability, and the difference in respectivecarrying amounts is recognised in the profit and loss account.
2.18.3 Off-setting of financial assets and financial liabilities
A financial asset and a financial liability is offset and the net amount is reported in the financial statements ifthe Company has a legally enforceable right to set-off the transaction and also intends either to settle on a netbasis or to realise the asset and settle the liability simultaneously.
2.19 Transactions with related parties
The Company enters into transactions with related parties for sale or purchase of goods and services on mutuallyagreed terms.
2.20 Contingent liabilities
Contingent liability is disclosed when:
- there is a possible obligation that arises from past events and whose existence will be confirmed onlyby the occurrence or non occurrence of one or more uncertain future events not wholly within the controlof the Company; or
- there is present obligation that arises from past events but it is not probable that an outflow of resourcesembodying economic benefits will be required to settle the obligation or the amount of the obligationcannot be measured with sufficient reliability.
2.21 Segment Reporting
Operating segments are reported in a manner consistent with the internal reporting provided to the chiefoperating decision-maker. The Chief Executive Officer has been identified as the 'chief operating decision-maker', who is responsible for allocating resources and assessing performance of the operating segments.
3. CRITICAL ACCOUNTING ESTIMATES AND JUDGEMENTS
The preparation of financial statements in conformity with approved accounting standards requires the use ofcertain critical accounting estimates. It also requires management to exercise its judgement in the process ofapplying the Company’s accounting policies. Estimates and judgements are continually evaluated and are basedon historic experience and other factors, including expectation of future events that are believed to be reasonableunder the circumstances. In the process of applying the Company's accounting policies, the management hasmade the following estimates and judgements which are significant to the financial statements:
a) Assumptions and estimates used in determining the recoverable amount, residual values and useful livesof property, plant and equipment (note 4);
b) assumptions and estimates used in determining the useful lives and residual values of intangible assets(note 5);
c) assumptions and estimates used in determining the provision for slow moving stores and spares(note 8);
d) assumptions and estimates used in writing down items of stock in trade to their net realisable value(note 9);
e) assumptions and estimates used in calculating the provision for impairment for trade debts (note 10);
f) assumptions and estimates used in the recognition of deferred taxation (note 19);
g) assumptions and estimates used in accounting for defined benefit plan (note 21);and
h) assumptions and estimates used in disclosure and assessment of provision for contingencies (note 24).
Estimates and judgements are continually evaluated and are based on historical experience and other factors,including expectation of future events that are believed to be reasonable under the circumstances.
32
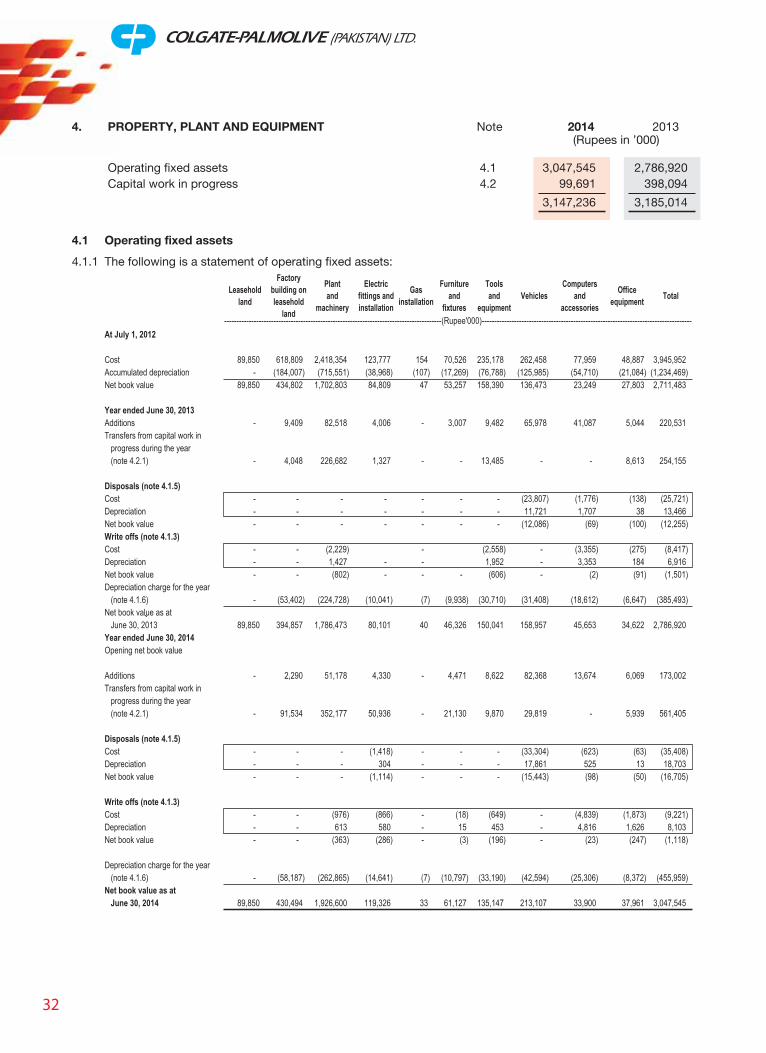
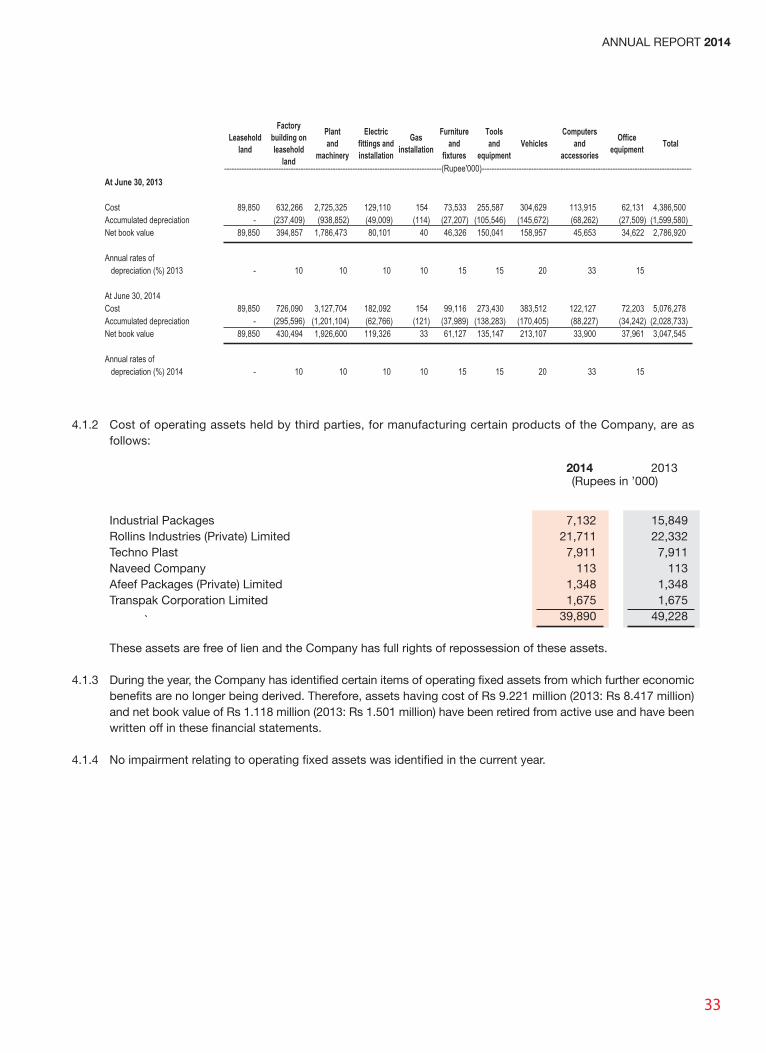
4.1 Operating fixed assets
4.1.1 The following is a statement of operating fixed assets:
At July 1, 2012
Cost 89,850 618,809 2,418,354 123,777 154 70,526 235,178 262,458 77,959 48,887 3,945,952Accumulated depreciation - (184,007) (715,551) (38,968) (107) (17,269) (76,788) (125,985) (54,710) (21,084) (1,234,469)Net book value 89,850 434,802 1,702,803 84,809 47 53,257 158,390 136,473 23,249 27,803 2,711,483
Year ended June 30, 2013Additions - 9,409 82,518 4,006 - 3,007 9,482 65,978 41,087 5,044 220,531Transfers from capital work in progress during the year (note 4.2.1) - 4,048 226,682 1,327 - - 13,485 - - 8,613 254,155
Disposals (note 4.1.5)Cost - - - - - - - (23,807) (1,776) (138) (25,721)Depreciation - - - - - - - 11,721 1,707 38 13,466Net book value - - - - - - - (12,086) (69) (100) (12,255)Write offs (note 4.1.3)Cost - - (2,229) - (2,558) - (3,355) (275) (8,417)Depreciation - - 1,427 - - 1,952 - 3,353 184 6,916Net book value - - (802) - - - (606) - (2) (91) (1,501)Depreciation charge for the year (note 4.1.6) - (53,402) (224,728) (10,041) (7) (9,938) (30,710) (31,408) (18,612) (6,647) (385,493)Net book value as at
June 30, 2013 89,850 394,857 1,786,473 80,101 40 46,326 150,041 158,957 45,653 34,622 2,786,920Year ended June 30, 2014Opening net book value
Additions - 2,290 51,178 4,330 - 4,471 8,622 82,368 13,674 6,069 173,002Transfers from capital work in progress during the year (note 4.2.1) - 91,534 352,177 50,936 - 21,130 9,870 29,819 - 5,939 561,405
Disposals (note 4.1.5)Cost - - - (1,418) - - - (33,304) (623) (63) (35,408)Depreciation - - - 304 - - - 17,861 525 13 18,703Net book value - - - (1,114) - - - (15,443) (98) (50) (16,705)
Write offs (note 4.1.3)Cost - - (976) (866) - (18) (649) - (4,839) (1,873) (9,221)Depreciation - - 613 580 - 15 453 - 4,816 1,626 8,103Net book value - - (363) (286) - (3) (196) - (23) (247) (1,118)
Depreciation charge for the year (note 4.1.6) - (58,187) (262,865) (14,641) (7) (10,797) (33,190) (42,594) (25,306) (8,372) (455,959)Net book value as at June 30, 2014 89,850 430,494 1,926,600 119,326 33 61,127 135,147 213,107 33,900 37,961 3,047,545
----------------------------------------------------------------------------------------(Rupee'000)-------------------------------------------------------------------------------------
Leaseholdland
Factorybuilding onleasehold
land
Plantand
machinery
Electricfittings andinstallation
Gasinstallation
Furnitureand
fixtures
Toolsand
equipmentVehicles
Computersand
accessories
Officeequipment Total
4. PROPERTY, PLANT AND EQUIPMENT(Rupees in ’000)
2014 2013Note
Operating fixed assets 4.1 3,047,545 2,786,920Capital work in progress 4.2 99,691 398,094
3,147,236 3,185,014
33
ANNUAL REPORT 2014
At June 30, 2013
Cost 89,850 632,266 2,725,325 129,110 154 73,533 255,587 304,629 113,915 62,131 4,386,500Accumulated depreciation - (237,409) (938,852) (49,009) (114) (27,207) (105,546) (145,672) (68,262) (27,509) (1,599,580)Net book value 89,850 394,857 1,786,473 80,101 40 46,326 150,041 158,957 45,653 34,622 2,786,920
Annual rates of depreciation (%) 2013 - 10 10 10 10 15 15 20 33 15
At June 30, 2014Cost 89,850 726,090 3,127,704 182,092 154 99,116 273,430 383,512 122,127 72,203 5,076,278Accumulated depreciation - (295,596) (1,201,104) (62,766) (121) (37,989) (138,283) (170,405) (88,227) (34,242) (2,028,733)Net book value 89,850 430,494 1,926,600 119,326 33 61,127 135,147 213,107 33,900 37,961 3,047,545
Annual rates of depreciation (%) 2014 - 10 10 10 10 15 15 20 33 15
----------------------------------------------------------------------------------------(Rupee'000)-------------------------------------------------------------------------------------
Leaseholdland
Factorybuilding onleasehold
land
Plantand
machinery
Electricfittings andinstallation
Gasinstallation
Furnitureand
fixtures
Toolsand
equipmentVehicles
Computersand
accessories
Officeequipment Total
(Rupees in ’000)2014 2013
4.1.2 Cost of operating assets held by third parties, for manufacturing certain products of the Company, are asfollows:
Industrial Packages 7,132 15,849Rollins Industries (Private) Limited 21,711 22,332Techno Plast 7,911 7,911Naveed Company 113 113Afeef Packages (Private) Limited 1,348 1,348Transpak Corporation Limited 1,675 1,675
39,890 49,228
These assets are free of lien and the Company has full rights of repossession of these assets.
4.1.3 During the year, the Company has identified certain items of operating fixed assets from which further economicbenefits are no longer being derived. Therefore, assets having cost of Rs 9.221 million (2013: Rs 8.417 million)and net book value of Rs 1.118 million (2013: Rs 1.501 million) have been retired from active use and have beenwritten off in these financial statements.
4.1.4 No impairment relating to operating fixed assets was identified in the current year.
34
Vehicles Maturity of the Company's 1,419 817 602 626 24 Muhammad Saleem Khan car scheme Employee of the Company
--do-- 631 449 182 368 186 Adnan ShahzadEmployee of the Company
--do-- 1,390 1,020 370 875 505 Omar QadriEmployee of the Company
--do-- 287 137 150 347 197 Mazhar AliEmployee of the Company
--do-- 424 309 115 199 84 Khalid Noor MuhammadEmployee of the Company
--do-- 403 296 107 184 77 Arif DadaniEmployee of the Company
--do-- 353 234 119 119 - Syed Aijaz AliEmployee of the Company
--do-- 1,389 973 416 536 120 Muhammad Yusuf KasbatiEmployee of the Company
--do-- 404 244 160 163 3 Muhammad IrfanEmployee of the Company
--do-- 1,389 973 416 536 120 Muhammad FarooqEmployee of the Company
--do-- 904 644 260 372 112 Naseem-ur-RehmanEmployee of the Company
--do-- 834 574 260 302 42 Mehmood AtharEmployee of the Company
Maturity of Company's maintained 742 148 594 700 106 Hassan Azhar car scheme Ex-employee of the Company--do-- 742 133 609 670 61 Shoukat Fareed
Ex-employee of the Company--do-- 589 192 397 500 103 Syed Asim Ali
Ex-employee of the Company--do-- 605 290 315 315 - Asghar Zafar
Employee of the Company--do-- 934 693 241 560 319 Naveed Ahmed
Employee of the Company--do-- 384 289 95 266 171 Qamar Haider
Employee of the Company--do-- 915 687 228 612 384 Muhammad Ibrahim
Employee of the Company--do-- 362 273 89 238 149 Fayyaz Ahmed Butt
Employee of the Company--do-- 376 299 77 164 87 Attaullah Khan
Employee of the Company--do-- 682 514 168 450 282 Zahoor Ahmed
Employee of the Company--do-- 389 300 89 275 186 Waseem Eiruj
Employee of the Company--do-- 925 715 210 682 472 Khurram Vohra
Employee of the Company--do-- 715 290 425 425 - Jamil Anwer
Employee of the Company--do-- 504 402 102 290 188 Muhammad Ali
Employee of the CompanyBid 390 300 90 285 195 Hussain Akber Ali
House # M/12,Gulshan-e-Karim, Nazimabad, Karachi--do-- 395 302 93 300 207 Abdul Hameed
House # S.3.604,Chisti Nagar, Sector 11-1/2, Karachi--do-- 335 197 138 316 178 Syed M. Qamar Naqvi
House # D-88,Nishtar Road, Pakistan Quarter,Garden West, Karachi
--do-- 335 197 138 316 178 Syed M. Raza NaqviHouse # D-88,Nishtar Road, Pakistan Quarter,Garden West, Karachi"
--do-- 395 307 88 295 207 Naseer AhmedHouse # 22/B, 37-D Area, Landhi # 1, Karachi
--do-- 842 609 233 250 17 Afzal SulemanHouse # 25, Al-Hilal Society, University Road, Karachi
--do-- 1,229 962 267 400 133 Abdul RehmanHouse # B-112, Afridi Colony Bin Qasim, Malir, Karachi
--do-- 590 471 119 370 251 Ali Diamond PiraniFlat # C-21, Noor Appartment, Block E,North Nazimabad, Karachi
--do-- 945 277 668 863 195 Muhammad Taimoor DyerHouse # 282, D'Cruz Road, Garden East, Karachi
--do-- 725 290 435 585 150 Muhammad Taimoor DyerHouse # 282, D'Cruz Road, Garden East, Karachi
--do-- 870 292 578 800 222 Muhammad Taimoor DyerHouse # 282, D'Cruz Road, Garden East, Karachi
4.1.5 The following operating fixed assets with a net book value exceeding Rs 50,000 were disposed of during theyear:
Particulars Mode of disposal Particulars of purchasers
---------------------------------- (Rupees in ‘000) --------------------------------
Cost Accumulateddepreciation
Net bookvalue
Sale proceeds /receivable from
insurance company
Gain /(loss)
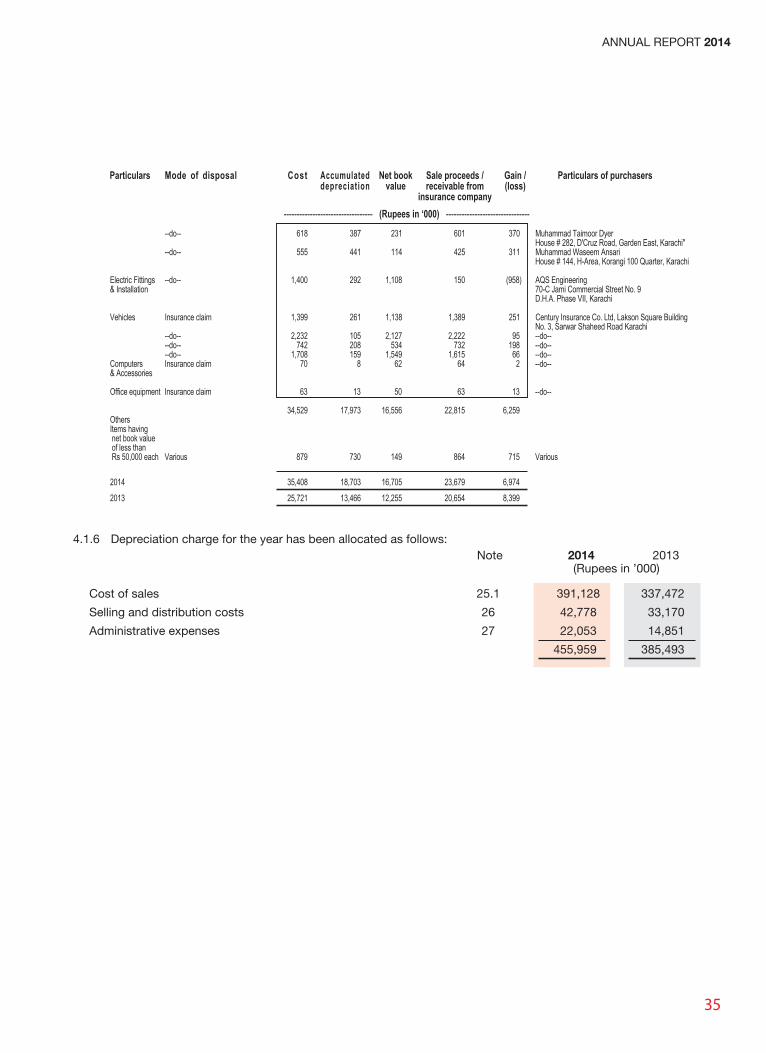
35
ANNUAL REPORT 2014
4.1.6 Depreciation charge for the year has been allocated as follows:
(Rupees in ’000)2014 2013Note
Cost of sales 25.1 391,128 337,472
Selling and distribution costs 26 42,778 33,170
Administrative expenses 27 22,053 14,851
455,959 385,493
Particulars Mode of disposal Particulars of purchasers
---------------------------------- (Rupees in ‘000) --------------------------------
Cost Accumulateddepreciation
Net bookvalue
Sale proceeds /receivable from
insurance company
Gain /(loss)
--do-- 618 387 231 601 370 Muhammad Taimoor DyerHouse # 282, D'Cruz Road, Garden East, Karachi"
--do-- 555 441 114 425 311 Muhammad Waseem AnsariHouse # 144, H-Area, Korangi 100 Quarter, Karachi
Electric Fittings --do-- 1,400 292 1,108 150 (958) AQS Engineering& Installation 70-C Jami Commercial Street No. 9
D.H.A. Phase VII, Karachi
Vehicles Insurance claim 1,399 261 1,138 1,389 251 Century Insurance Co. Ltd, Lakson Square BuildingNo. 3, Sarwar Shaheed Road Karachi
--do-- 2,232 105 2,127 2,222 95 --do----do-- 742 208 534 732 198 --do----do-- 1,708 159 1,549 1,615 66 --do--
Computers Insurance claim 70 8 62 64 2 --do--& Accessories
Office equipment Insurance claim 63 13 50 63 13 --do--
34,529 17,973 16,556 22,815 6,259 OthersItems having net book value of less than Rs 50,000 each Various 879 730 149 864 715 Various
2014 35,408 18,703 16,705 23,679 6,974 2013 25,721 13,466 12,255 20,654 8,399
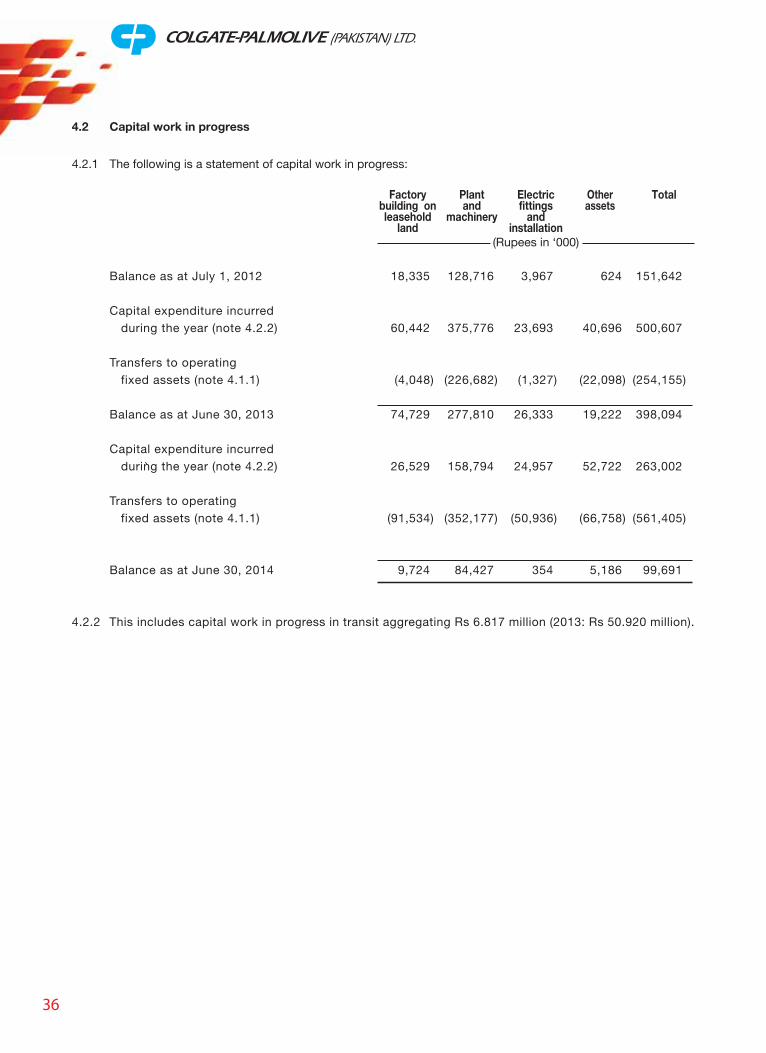
36
Balance as at July 1, 2012 18,335 128,716 3,967 624 151,642
Capital expenditure incurred during the year (note 4.2.2) 60,442 375,776 23,693 40,696 500,607
Transfers to operating fixed assets (note 4.1.1) (4,048) (226,682) (1,327) (22,098) (254,155)
Balance as at June 30, 2013 74,729 277,810 26,333 19,222 398,094
Capital expenditure incurred during the year (note 4.2.2) 26,529 158,794 24,957 52,722 263,002
Transfers to operating fixed assets (note 4.1.1) (91,534) (352,177) (50,936) (66,758) (561,405)
Balance as at June 30, 2014 9,724 84,427 354 5,186 99,691
4.2.2 This includes capital work in progress in transit aggregating Rs 6.817 million (2013: Rs 50.920 million).
4.2 Capital work in progress
4.2.1 The following is a statement of capital work in progress:
(Rupees in ‘000)
Factorybuilding onleasehold
land
Plantand
machinery
Electricfittings
andinstallation
TotalOtherassets
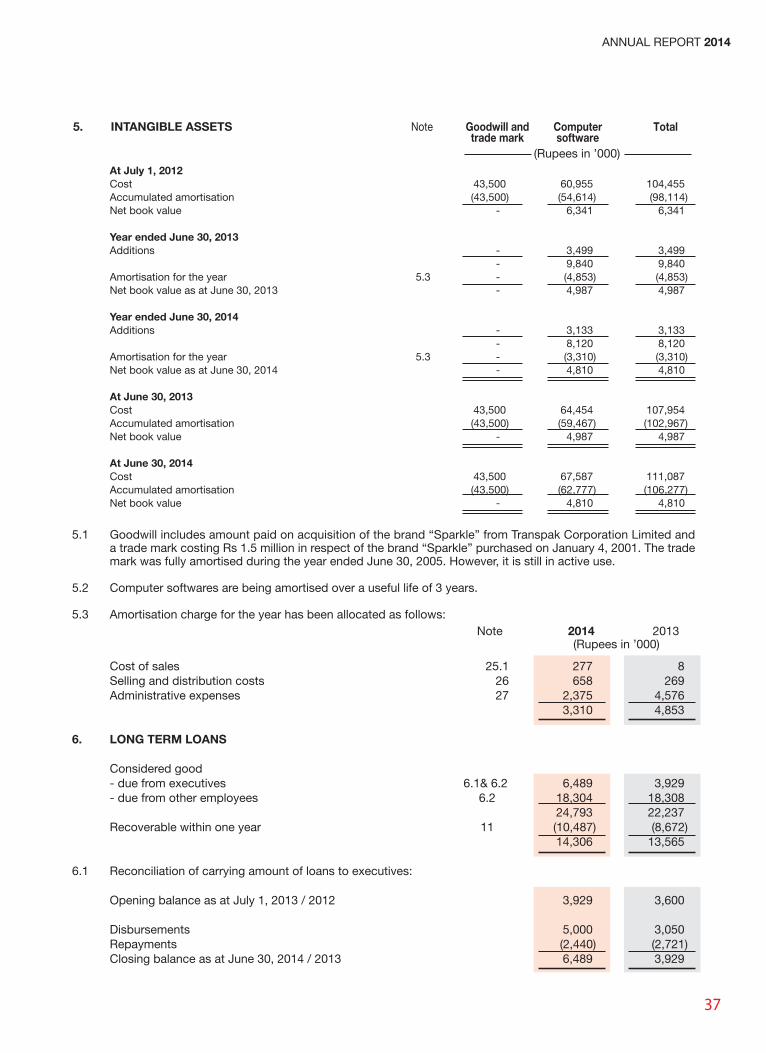
37
ANNUAL REPORT 2014
Cost of sales 25.1 277 8Selling and distribution costs 26 658 269Administrative expenses 27 2,375 4,576
3,310 4,853
6. LONG TERM LOANS
Considered good- due from executives 6.1& 6.2 6,489 3,929- due from other employees 6.2 18,304 18,308
24,793 22,237Recoverable within one year 11 (10,487) (8,672)
14,306 13,565
6.1 Reconciliation of carrying amount of loans to executives:
Opening balance as at July 1, 2013 / 2012 3,929 3,600
Disbursements 5,000 3,050Repayments (2,440) (2,721)Closing balance as at June 30, 2014 / 2013 6,489 3,929
5. INTANGIBLE ASSETS Goodwill andtrade mark
TotalNote
(Rupees in ’000)
Computersoftware
5.1 Goodwill includes amount paid on acquisition of the brand “Sparkle” from Transpak Corporation Limited anda trade mark costing Rs 1.5 million in respect of the brand “Sparkle” purchased on January 4, 2001. The trademark was fully amortised during the year ended June 30, 2005. However, it is still in active use.
5.2 Computer softwares are being amortised over a useful life of 3 years.
5.3 Amortisation charge for the year has been allocated as follows:
(Rupees in ’000)2014 2013Note
At July 1, 2012Cost 43,500 60,955 104,455Accumulated amortisation (43,500) (54,614) (98,114)Net book value - 6,341 6,341
Year ended June 30, 2013Additions - 3,499 3,499
- 9,840 9,840Amortisation for the year 5.3 - (4,853) (4,853)Net book value as at June 30, 2013 - 4,987 4,987
Year ended June 30, 2014Additions - 3,133 3,133 - 8,120 8,120Amortisation for the year 5.3 - (3,310) (3,310)Net book value as at June 30, 2014 - 4,810 4,810
At June 30, 2013Cost 43,500 64,454 107,954Accumulated amortisation (43,500) (59,467) (102,967)Net book value - 4,987 4,987
At June 30, 2014Cost 43,500 67,587 111,087Accumulated amortisation (43,500) (62,777) (106,277)Net book value - 4,810 4,810
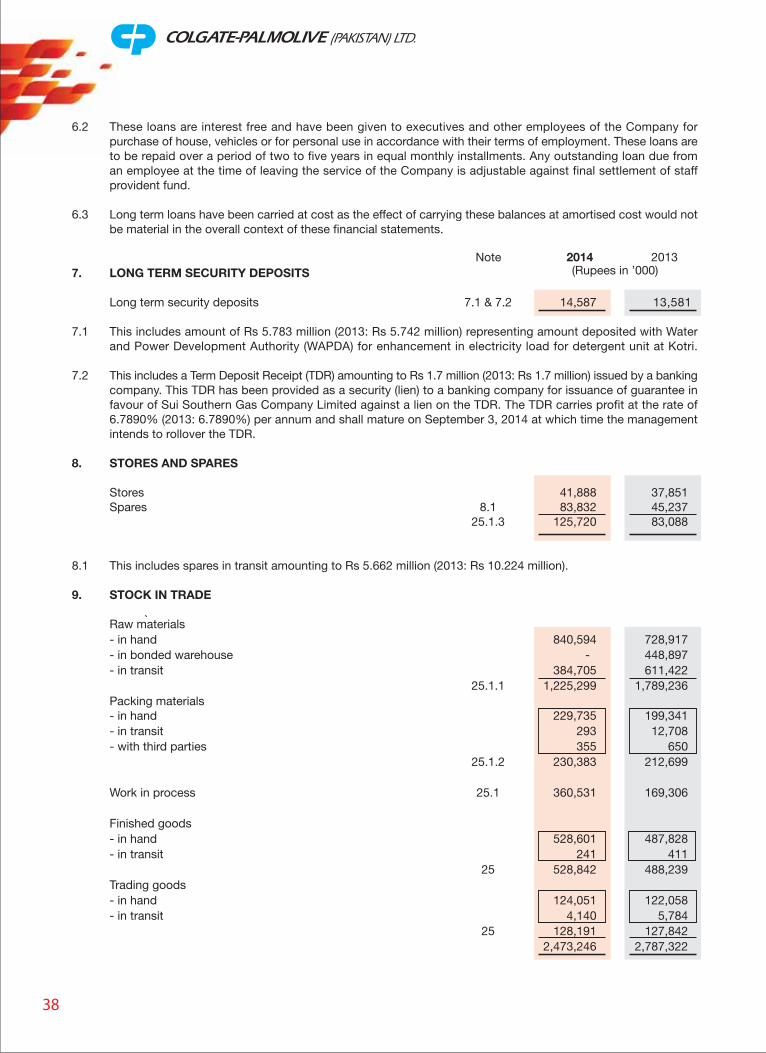
38
6.2 These loans are interest free and have been given to executives and other employees of the Company forpurchase of house, vehicles or for personal use in accordance with their terms of employment. These loans areto be repaid over a period of two to five years in equal monthly installments. Any outstanding loan due froman employee at the time of leaving the service of the Company is adjustable against final settlement of staffprovident fund.
6.3 Long term loans have been carried at cost as the effect of carrying these balances at amortised cost would notbe material in the overall context of these financial statements.
7. LONG TERM SECURITY DEPOSITS
Long term security deposits 7.1 & 7.2 14,587 13,581
7.1 This includes amount of Rs 5.783 million (2013: Rs 5.742 million) representing amount deposited with Waterand Power Development Authority (WAPDA) for enhancement in electricity load for detergent unit at Kotri.
7.2 This includes a Term Deposit Receipt (TDR) amounting to Rs 1.7 million (2013: Rs 1.7 million) issued by a bankingcompany. This TDR has been provided as a security (lien) to a banking company for issuance of guarantee infavour of Sui Southern Gas Company Limited against a lien on the TDR. The TDR carries profit at the rate of6.7890% (2013: 6.7890%) per annum and shall mature on September 3, 2014 at which time the managementintends to rollover the TDR.
8. STORES AND SPARES
Stores 41,888 37,851Spares 8.1 83,832 45,237
25.1.3 125,720 83,088
8.1 This includes spares in transit amounting to Rs 5.662 million (2013: Rs 10.224 million).
9. STOCK IN TRADE
Raw materials- in hand 840,594 728,917- in bonded warehouse - 448,897- in transit 384,705 611,422
25.1.1 1,225,299 1,789,236Packing materials- in hand 229,735 199,341- in transit 293 12,708- with third parties 355 650
25.1.2 230,383 212,699
Work in process 25.1 360,531 169,306
Finished goods- in hand 528,601 487,828- in transit 241 411
25 528,842 488,239Trading goods- in hand 124,051 122,058- in transit 4,140 5,784
25 128,191 127,842 2,473,246 2,787,322
(Rupees in ’000)2014 2013Note
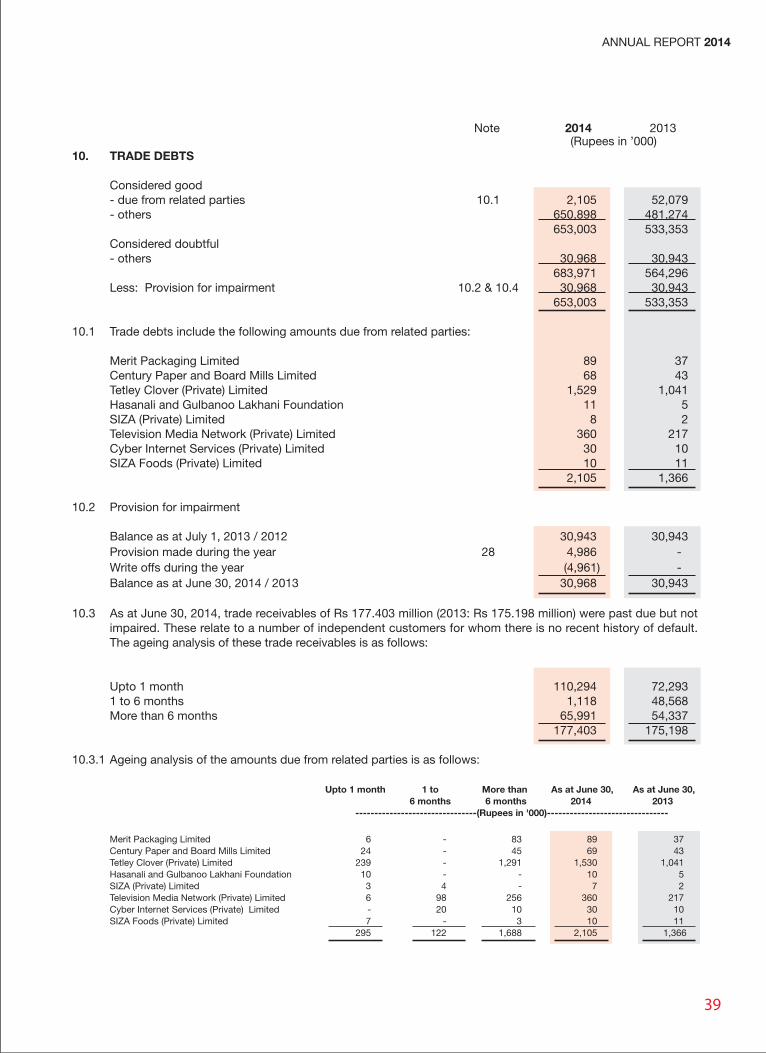
39
ANNUAL REPORT 2014
(Rupees in ’000)2014 2013Note
10. TRADE DEBTS
Considered good- due from related parties 10.1 2,105 52,079- others 650,898 481,274
653,003 533,353Considered doubtful- others 30,968 30,943
683,971 564,296Less: Provision for impairment 10.2 & 10.4 30,968 30,943
653,003 533,353
10.1 Trade debts include the following amounts due from related parties:
Merit Packaging Limited 89 37Century Paper and Board Mills Limited 68 43Tetley Clover (Private) Limited 1,529 1,041Hasanali and Gulbanoo Lakhani Foundation 11 5SIZA (Private) Limited 8 2Television Media Network (Private) Limited 360 217Cyber Internet Services (Private) Limited 30 10SIZA Foods (Private) Limited 10 11
2,105 1,366
10.2 Provision for impairment
Balance as at July 1, 2013 / 2012 30,943 30,943Provision made during the year 28 4,986 -Write offs during the year (4,961) -Balance as at June 30, 2014 / 2013 30,968 30,943
10.3 As at June 30, 2014, trade receivables of Rs 177.403 million (2013: Rs 175.198 million) were past due but notimpaired. These relate to a number of independent customers for whom there is no recent history of default.The ageing analysis of these trade receivables is as follows:
Upto 1 month 110,294 72,2931 to 6 months 1,118 48,568More than 6 months 65,991 54,337
177,403 175,198
10.3.1 Ageing analysis of the amounts due from related parties is as follows:
Upto 1 month 1 to More than As at June 30, As at June 30,6 months 6 months 2014 2013
--------------------------------(Rupees in '000)--------------------------------
Merit Packaging Limited 6 - 83 89 37Century Paper and Board Mills Limited 24 - 45 69 43Tetley Clover (Private) Limited 239 - 1,291 1,530 1,041Hasanali and Gulbanoo Lakhani Foundation 10 - - 10 5SIZA (Private) Limited 3 4 - 7 2Television Media Network (Private) Limited 6 98 256 360 217Cyber Internet Services (Private) Limited - 20 10 30 10SIZA Foods (Private) Limited 7 - 3 10 11
295 122 1,688 2,105 1,366
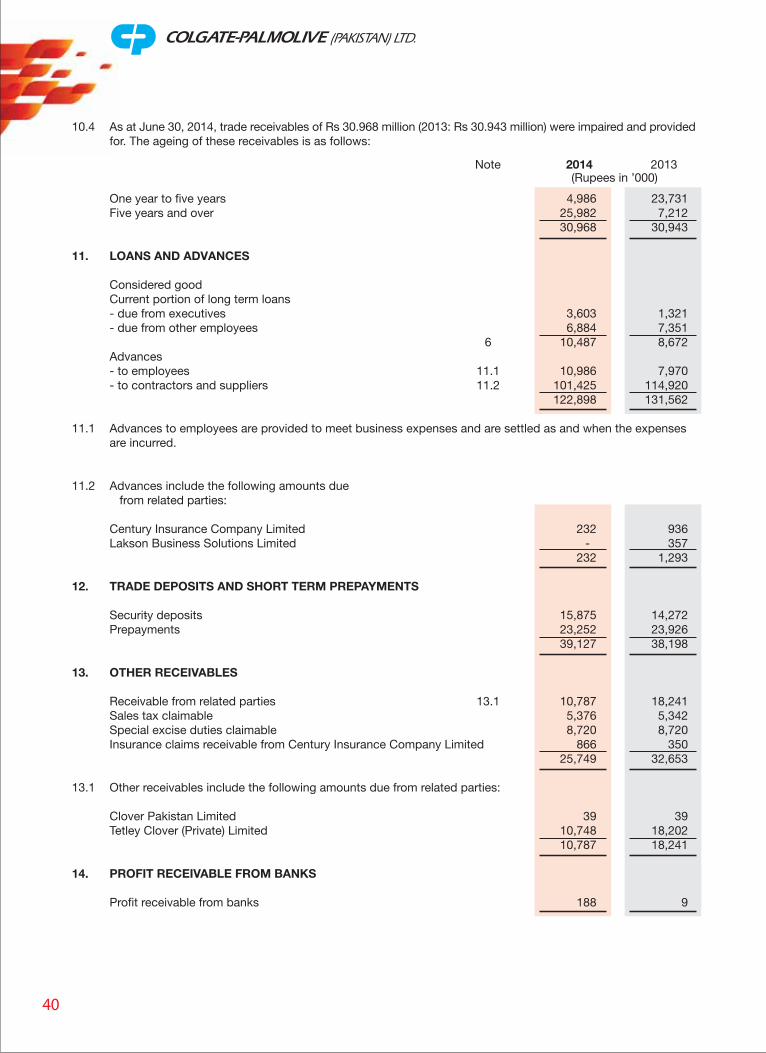
40
(Rupees in ’000)2014 2013Note
10.4 As at June 30, 2014, trade receivables of Rs 30.968 million (2013: Rs 30.943 million) were impaired and providedfor. The ageing of these receivables is as follows:
One year to five years 4,986 23,731Five years and over 25,982 7,212
30,968 30,943
11. LOANS AND ADVANCES
Considered goodCurrent portion of long term loans- due from executives 3,603 1,321- due from other employees 6,884 7,351
6 10,487 8,672Advances- to employees 11.1 10,986 7,970- to contractors and suppliers 11.2 101,425 114,920
122,898 131,562
11.1 Advances to employees are provided to meet business expenses and are settled as and when the expensesare incurred.
11.2 Advances include the following amounts due from related parties:
Century Insurance Company Limited 232 936Lakson Business Solutions Limited - 357
232 1,293
12. TRADE DEPOSITS AND SHORT TERM PREPAYMENTS
Security deposits 15,875 14,272Prepayments 23,252 23,926
39,127 38,198
13. OTHER RECEIVABLES
Receivable from related parties 13.1 10,787 18,241Sales tax claimable 5,376 5,342Special excise duties claimable 8,720 8,720Insurance claims receivable from Century Insurance Company Limited 866 350
25,749 32,653
13.1 Other receivables include the following amounts due from related parties:
Clover Pakistan Limited 39 39Tetley Clover (Private) Limited 10,748 18,202
10,787 18,241
14. PROFIT RECEIVABLE FROM BANKS
Profit receivable from banks 188 9
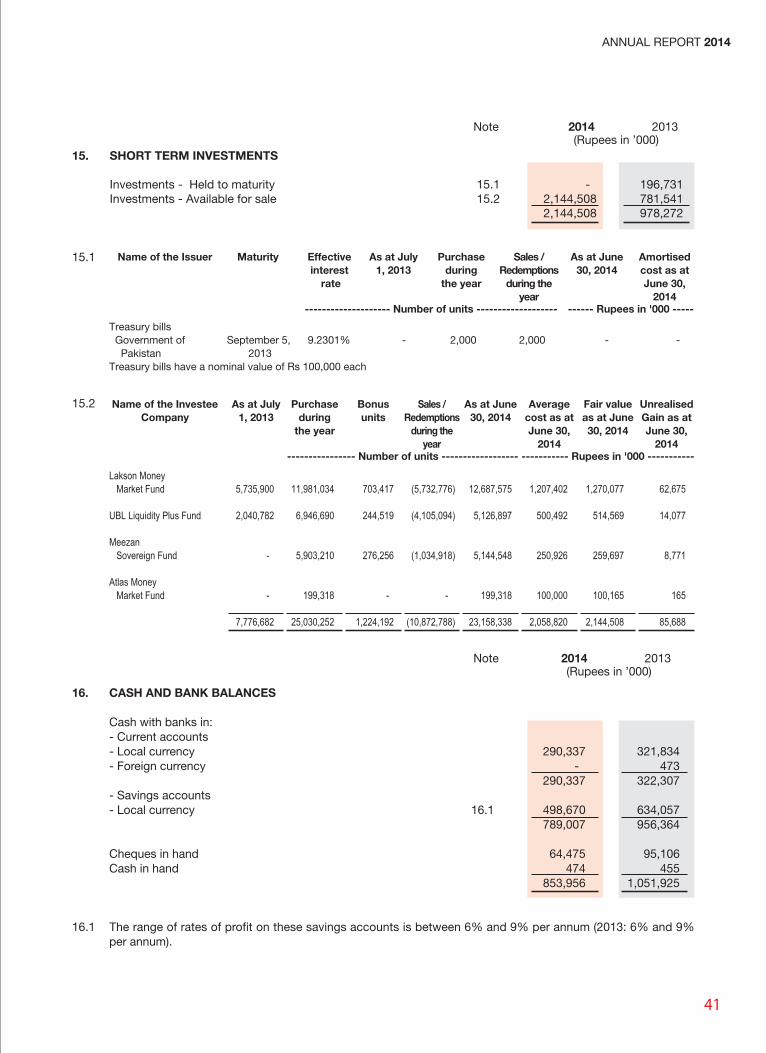
41
ANNUAL REPORT 2014
15. SHORT TERM INVESTMENTS
Investments - Held to maturity 15.1 - 196,731Investments - Available for sale 15.2 2,144,508 781,541
2,144,508 978,272
15.1
15.2
(Rupees in ’000)2014 2013Note
Name of the Issuer Maturity Effectiveinterest
rate
As at July1, 2013
Purchaseduring
the year
As at June30, 2014
Amortisedcost as atJune 30,
2014
Sales /Redemptions
during theyear
-------------------- Number of units ------------------- ------ Rupees in '000 -----
Treasury bills Government of September 5, 9.2301% - 2,000 2,000 - - Pakistan 2013Treasury bills have a nominal value of Rs 100,000 each
Name of the InvesteeCompany
Purchaseduring
the year
Bonusunits
Sales /Redemptions
during theyear
Averagecost as atJune 30,
2014
Fair valueas at June30, 2014
As at June30, 2014
---------------- Number of units ------------------ ----------- Rupees in '000 -----------
UnrealisedGain as atJune 30,
2014
As at July1, 2013
Lakson Money Market Fund 5,735,900 11,981,034 703,417 (5,732,776) 12,687,575 1,207,402 1,270,077 62,675
UBL Liquidity Plus Fund 2,040,782 6,946,690 244,519 (4,105,094) 5,126,897 500,492 514,569 14,077
Meezan Sovereign Fund - 5,903,210 276,256 (1,034,918) 5,144,548 250,926 259,697 8,771
Atlas Money Market Fund - 199,318 - - 199,318 100,000 100,165 165
7,776,682 25,030,252 1,224,192 (10,872,788) 23,158,338 2,058,820 2,144,508 85,688
16. CASH AND BANK BALANCES
Cash with banks in:- Current accounts- Local currency 290,337 321,834- Foreign currency - 473
290,337 322,307- Savings accounts- Local currency 16.1 498,670 634,057
789,007 956,364
Cheques in hand 64,475 95,106Cash in hand 474 455
853,956 1,051,925
16.1 The range of rates of profit on these savings accounts is between 6% and 9% per annum (2013: 6% and 9%per annum).
(Rupees in ’000)2014 2013Note
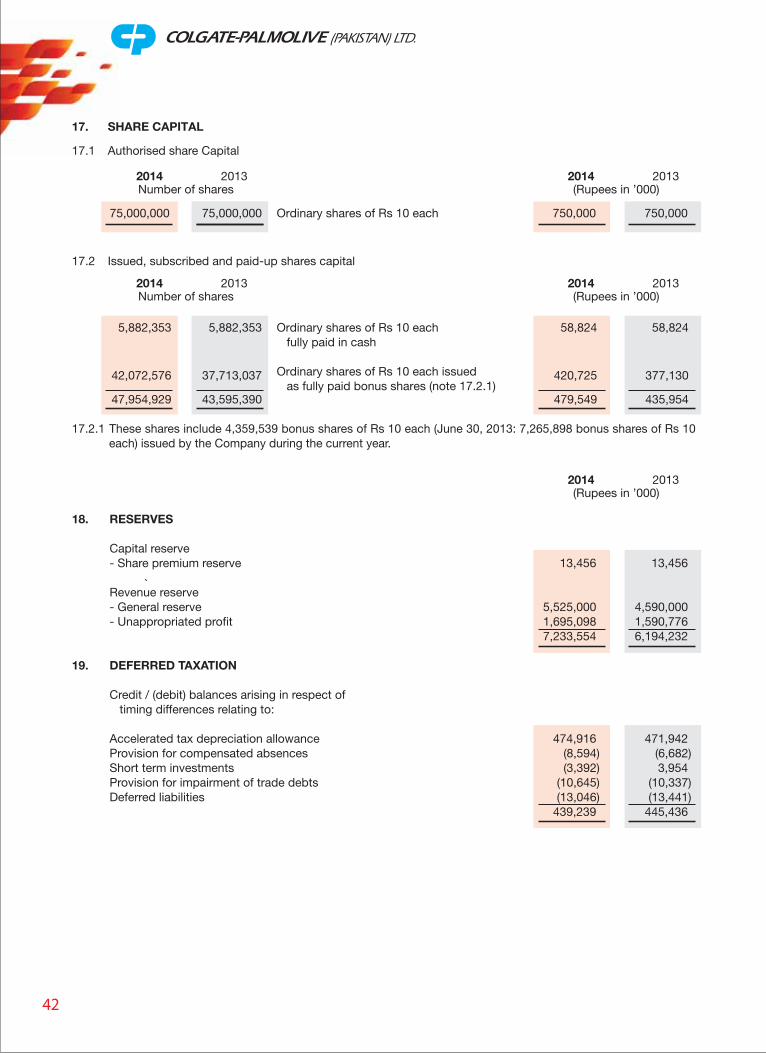
42
(Rupees in ’000)2014 2013
Number of shares2014 2013
75,000,000 75,000,000
17.2 Issued, subscribed and paid-up shares capital
5,882,353
42,072,576
47,954,929
58,824
420,725
479,549
58,824
377,130
435,954
Ordinary shares of Rs 10 each
5,882,353
37,713,037
43,595,390
Ordinary shares of Rs 10 each fully paid in cash
Ordinary shares of Rs 10 each issued as fully paid bonus shares (note 17.2.1)
750,000 750,000
17. SHARE CAPITAL
17.1 Authorised share Capital
(Rupees in ’000)2014 2013
Number of shares2014 2013
17.2.1 These shares include 4,359,539 bonus shares of Rs 10 each (June 30, 2013: 7,265,898 bonus shares of Rs 10each) issued by the Company during the current year.
18. RESERVES
Capital reserve- Share premium reserve 13,456 13,456
Revenue reserve- General reserve 5,525,000 4,590,000- Unappropriated profit 1,695,098 1,590,776
7,233,554 6,194,232
19. DEFERRED TAXATION
Credit / (debit) balances arising in respect of timing differences relating to:
Accelerated tax depreciation allowance 474,916 471,942Provision for compensated absences (8,594) (6,682)Short term investments (3,392) 3,954Provision for impairment of trade debts (10,645) (10,337)Deferred liabilities (13,046) (13,441)
439,239 445,436
(Rupees in ’000)2014 2013
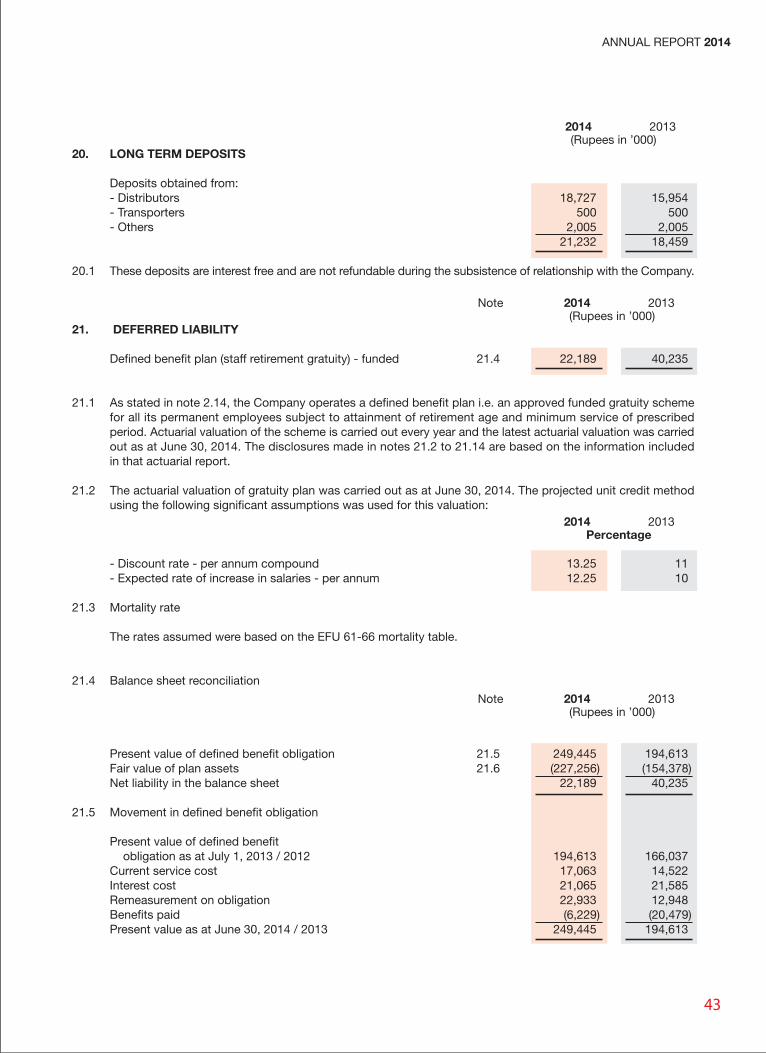
43
ANNUAL REPORT 2014
20. LONG TERM DEPOSITS
Deposits obtained from:- Distributors 18,727 15,954 - Transporters 500 500- Others 2,005 2,005
21,232 18,459
20.1 These deposits are interest free and are not refundable during the subsistence of relationship with the Company.
21. DEFERRED LIABILITY
Defined benefit plan (staff retirement gratuity) - funded 21.4 22,189 40,235
21.1 As stated in note 2.14, the Company operates a defined benefit plan i.e. an approved funded gratuity schemefor all its permanent employees subject to attainment of retirement age and minimum service of prescribedperiod. Actuarial valuation of the scheme is carried out every year and the latest actuarial valuation was carriedout as at June 30, 2014. The disclosures made in notes 21.2 to 21.14 are based on the information includedin that actuarial report.
21.2 The actuarial valuation of gratuity plan was carried out as at June 30, 2014. The projected unit credit methodusing the following significant assumptions was used for this valuation:
- Discount rate - per annum compound 13.25 11- Expected rate of increase in salaries - per annum 12.25 10
21.3 Mortality rate
The rates assumed were based on the EFU 61-66 mortality table.
21.4 Balance sheet reconciliation
Present value of defined benefit obligation 21.5 249,445 194,613Fair value of plan assets 21.6 (227,256) (154,378)Net liability in the balance sheet 22,189 40,235
21.5 Movement in defined benefit obligation
Present value of defined benefit obligation as at July 1, 2013 / 2012 194,613 166,037Current service cost 17,063 14,522Interest cost 21,065 21,585Remeasurement on obligation 22,933 12,948Benefits paid (6,229) (20,479)Present value as at June 30, 2014 / 2013 249,445 194,613
(Rupees in ’000)2014 2013
(Rupees in ’000)2014 2013Note
Percentage2014 2013
(Rupees in ’000)2014 2013Note
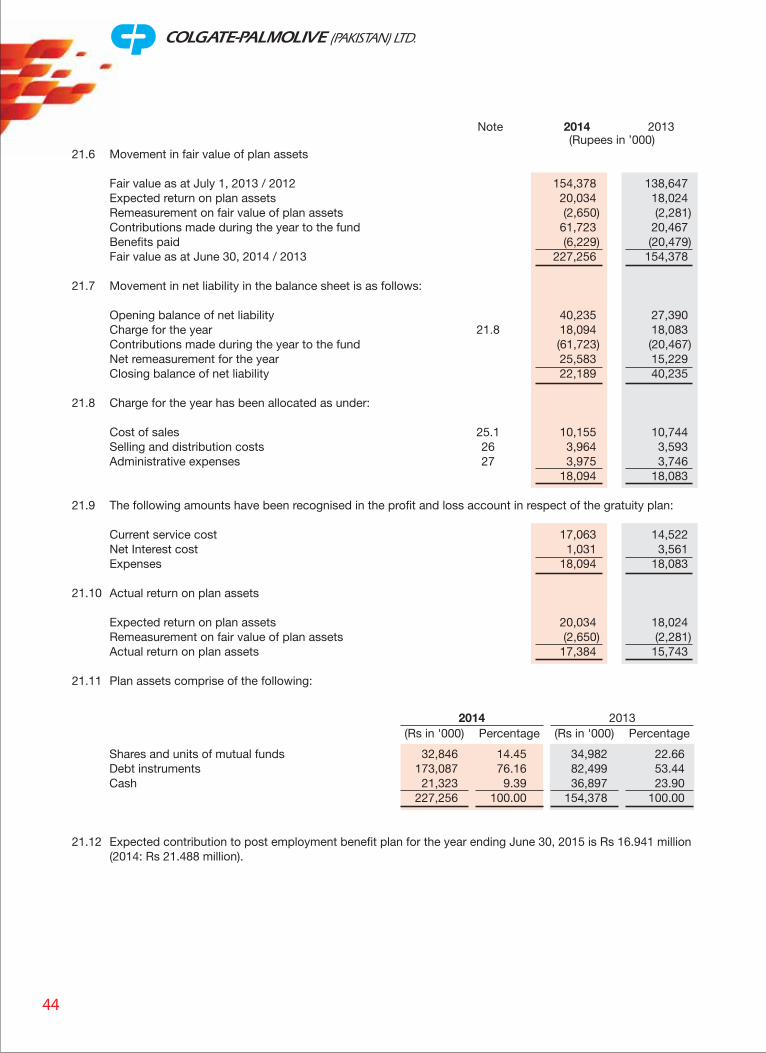
44
(Rupees in ’000)2014 2013Note
2014 2013(Rs in '000) Percentage (Rs in '000) Percentage
21.6 Movement in fair value of plan assets
Fair value as at July 1, 2013 / 2012 154,378 138,647Expected return on plan assets 20,034 18,024Remeasurement on fair value of plan assets (2,650) (2,281)Contributions made during the year to the fund 61,723 20,467Benefits paid (6,229) (20,479)Fair value as at June 30, 2014 / 2013 227,256 154,378
21.7 Movement in net liability in the balance sheet is as follows:
Opening balance of net liability 40,235 27,390Charge for the year 21.8 18,094 18,083Contributions made during the year to the fund (61,723) (20,467)Net remeasurement for the year 25,583 15,229Closing balance of net liability 22,189 40,235
21.8 Charge for the year has been allocated as under:
Cost of sales 25.1 10,155 10,744Selling and distribution costs 26 3,964 3,593Administrative expenses 27 3,975 3,746
18,094 18,083
21.9 The following amounts have been recognised in the profit and loss account in respect of the gratuity plan:
Current service cost 17,063 14,522Net Interest cost 1,031 3,561Expenses 18,094 18,083
21.10 Actual return on plan assets
Expected return on plan assets 20,034 18,024Remeasurement on fair value of plan assets (2,650) (2,281)Actual return on plan assets 17,384 15,743
21.11 Plan assets comprise of the following:
Shares and units of mutual funds 32,846 14.45 34,982 22.66Debt instruments 173,087 76.16 82,499 53.44Cash 21,323 9.39 36,897 23.90
227,256 100.00 154,378 100.00
21.12 Expected contribution to post employment benefit plan for the year ending June 30, 2015 is Rs 16.941 million(2014: Rs 21.488 million).
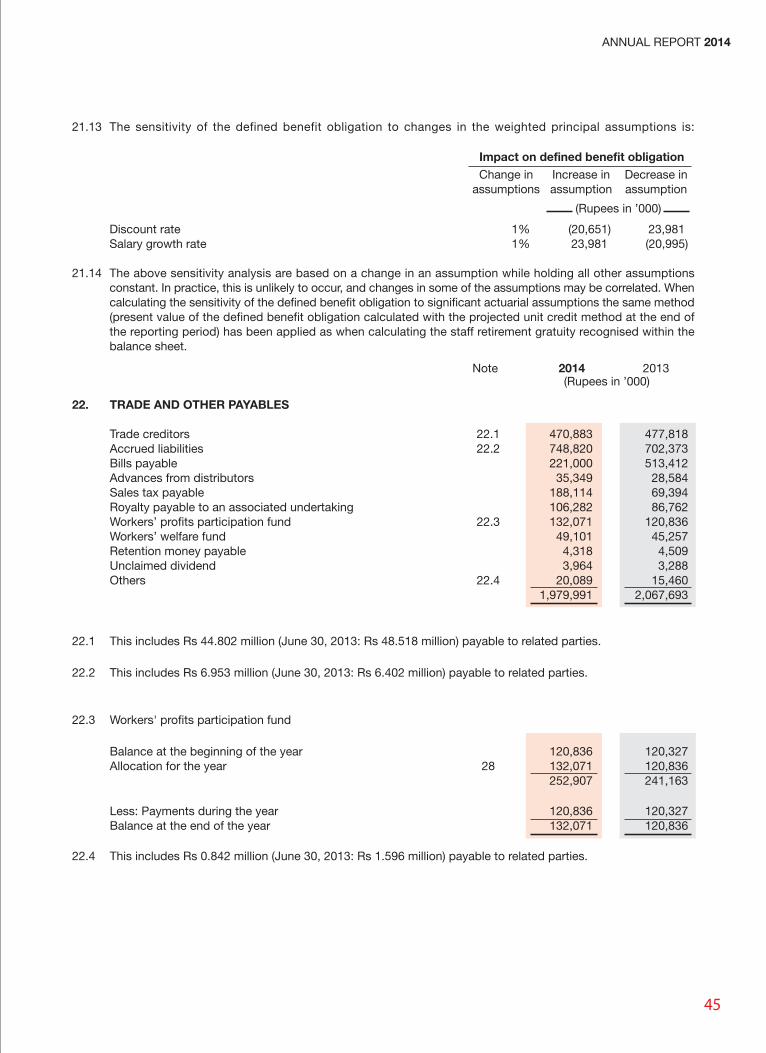
45
ANNUAL REPORT 2014
21.13 The sensitivity of the defined benefit obligation to changes in the weighted principal assumptions is:
Discount rate 1% (20,651) 23,981 Salary growth rate 1% 23,981 (20,995)
21.14 The above sensitivity analysis are based on a change in an assumption while holding all other assumptionsconstant. In practice, this is unlikely to occur, and changes in some of the assumptions may be correlated. Whencalculating the sensitivity of the defined benefit obligation to significant actuarial assumptions the same method(present value of the defined benefit obligation calculated with the projected unit credit method at the end ofthe reporting period) has been applied as when calculating the staff retirement gratuity recognised within thebalance sheet.
22. TRADE AND OTHER PAYABLES
Trade creditors 22.1 470,883 477,818 Accrued liabilities 22.2 748,820 702,373 Bills payable 221,000 513,412 Advances from distributors 35,349 28,584 Sales tax payable 188,114 69,394 Royalty payable to an associated undertaking 106,282 86,762 Workers’ profits participation fund 22.3 132,071 120,836 Workers’ welfare fund 49,101 45,257 Retention money payable 4,318 4,509 Unclaimed dividend 3,964 3,288 Others 22.4 20,089 15,460
1,979,991 2,067,693
22.1 This includes Rs 44.802 million (June 30, 2013: Rs 48.518 million) payable to related parties.
22.2 This includes Rs 6.953 million (June 30, 2013: Rs 6.402 million) payable to related parties.
22.3 Workers' profits participation fund
Balance at the beginning of the year 120,836 120,327 Allocation for the year 28 132,071 120,836
252,907 241,163
Less: Payments during the year 120,836 120,327 Balance at the end of the year 132,071 120,836
22.4 This includes Rs 0.842 million (June 30, 2013: Rs 1.596 million) payable to related parties.
Impact on defined benefit obligationChange in
assumptionsIncrease inassumption
Decrease inassumption
(Rupees in ’000)2014 2013Note
(Rupees in ’000)
46
23. SHORT TERM RUNNING FINANCES
23.1 The Company has arranged short-term borrowing facilities from various banks on mark-up basis to the extentof Rs 940 million (2013: Rs 1,040 million), which can be interchangeably utilised as running finance facilities orimport credit facilities. These facilities expired during the year and were renewed subsequently. The renewedfacilities are available for various periods expiring between July 31, 2014 to July 31, 2017. The arrangementsare secured by a joint hypothecation of stocks, stores and spares, trade debts, other current assets and secondcharge on immovable assets of the Company.
23.2 The mark-up on short-term running finance facilities ranges between 10.92% to 12.33% (2013: 10.27% to11.88%) per annum.
23.3 The facilities for opening letters of credit and guarantee as at June 30, 2014 aggregated Rs 3,900 million andRs 40 million (2013: Rs 4,276 million and Rs 40 million) respectively of which the amounts remaining unutilisedat the year end were Rs 3,335.334 million and Rs 7.069 million (2013: Rs 3,762.588 million and Rs 10.454 million)respectively.
24. CONTINGENCIES AND COMMITMENTS
24.1 Contingencies
24.1.1 As a result of a recovery suit of Rs 31.455 million along with interest at the rate of thirteen percent (13%) perannum filed by the Octroi Contractor against the Government of Sindh, Union Council Bulari and Kotri Associationof Trade and Industries (KATI) in the Civil Court, the Honorable Senior Judge issued a decree of Rs 7.336 millionin favour of Octroi Contractor. KATI had filed an appeal in the High Court of Sindh, whereas, the Octroi Contractorhad also filed an appeal requesting to enhance the amount of decree. Subsequently, the case was transferredto the Additional District Judge Kotri by the High Court of Sindh. The District Judge allowed the appeal in favourof KATI and remanded the case to Senior Civil Judge Kotri for adjudication. The relevant case had been dismissedby the Senior Civil Judge in favour of KATI. Subsequently the Octroi contractor filed an appeal in the DistrictCourt Jamshoro against the dismissal, which was dismissed during February 2014. At present, the managementbelieves that in case a further appeal is pursued by the contractor then also the subject matter will eventuallybe decided in favour of KATI. Accordingly, no provision has been made in the financial statements on thisaccount.
24.1.2 Cases have been filed against the Company by some employees claiming Rs 2.078 million (2013: Rs 2.587million) in aggregate. Provision has not been made in these financial statements for the said amount as themanagement of the Company, based on the advice of its legal counsel handling the subject cases, is of theopinion that matters shall be decided in the Company’s favour.
24.1.3 Post dated cheques have been issued to custom authorities as a security in respect of duties and taxes amountingto Rs 76.026 million (2013: Rs 291.276 million) payable at the time of exbonding of imported goods. In the eventthe goods are not cleared from custom warehouse within the prescribed time period, cheques issued as securityshall be encashable.
24.1.4 Contingent liabilities in respect of indemnities given to financial institutions for guarantees issued by them onbehalf of the Company in the normal course of business aggregate Rs 32.931 million (2013: Rs 29.547 million).
24.2 Commitments
24.2.1 Commitments in respect of capital expenditure and inventory items amount to Rs 46.134 million and Rs 325.056respectively (2013: Rs 48.726 million and Rs nil respectively).
24.2.2 Outstanding letters of credit amount to Rs 726.451 million (2013: Rs 520.214 million).
24.2.3 Outstanding duties leviable on clearing of stocks amount to Rs 10.677 million (2013: Rs 11.144 million).
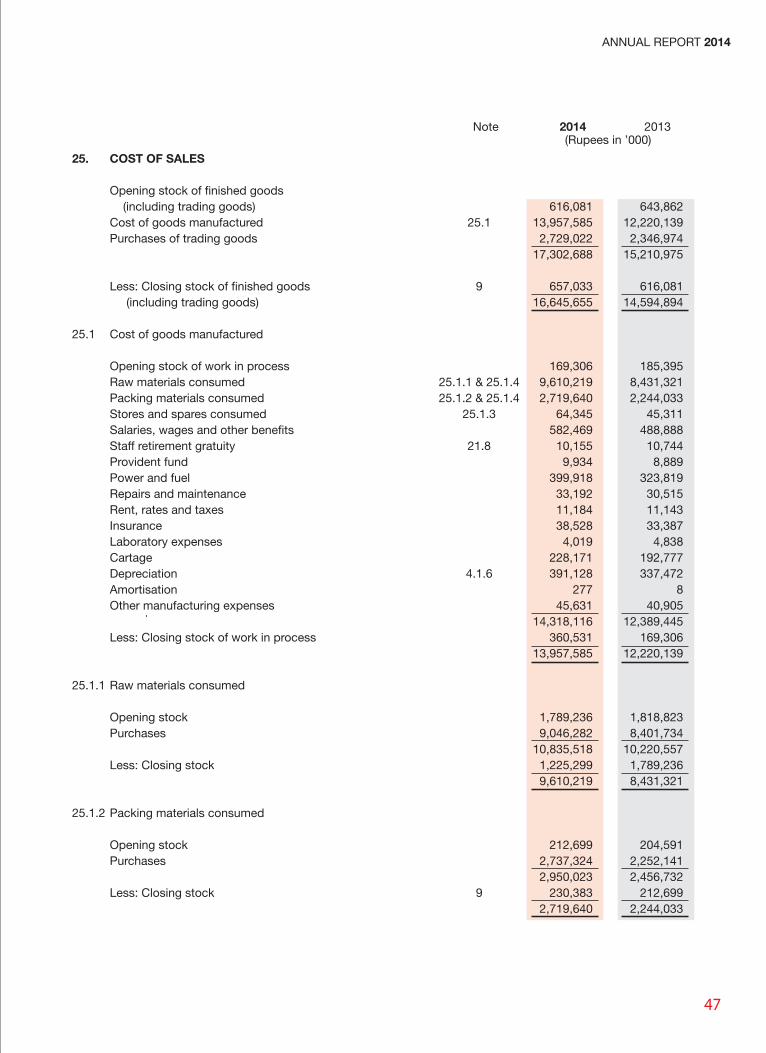
47
ANNUAL REPORT 2014
(Rupees in ’000)2014 2013Note
25. COST OF SALES
Opening stock of finished goods (including trading goods) 616,081 643,862Cost of goods manufactured 25.1 13,957,585 12,220,139Purchases of trading goods 2,729,022 2,346,974
17,302,688 15,210,975
Less: Closing stock of finished goods 9 657,033 616,081 (including trading goods) 16,645,655 14,594,894
25.1 Cost of goods manufactured
Opening stock of work in process 169,306 185,395Raw materials consumed 25.1.1 & 25.1.4 9,610,219 8,431,321Packing materials consumed 25.1.2 & 25.1.4 2,719,640 2,244,033Stores and spares consumed 25.1.3 64,345 45,311Salaries, wages and other benefits 582,469 488,888Staff retirement gratuity 21.8 10,155 10,744Provident fund 9,934 8,889Power and fuel 399,918 323,819Repairs and maintenance 33,192 30,515Rent, rates and taxes 11,184 11,143Insurance 38,528 33,387Laboratory expenses 4,019 4,838Cartage 228,171 192,777Depreciation 4.1.6 391,128 337,472Amortisation 277 8Other manufacturing expenses 45,631 40,905
14,318,116 12,389,445Less: Closing stock of work in process 360,531 169,306
13,957,585 12,220,139
25.1.1 Raw materials consumed
Opening stock 1,789,236 1,818,823Purchases 9,046,282 8,401,734
10,835,518 10,220,557Less: Closing stock 1,225,299 1,789,236
9,610,219 8,431,321
25.1.2 Packing materials consumed
Opening stock 212,699 204,591Purchases 2,737,324 2,252,141
2,950,023 2,456,732Less: Closing stock 9 230,383 212,699
2,719,640 2,244,033
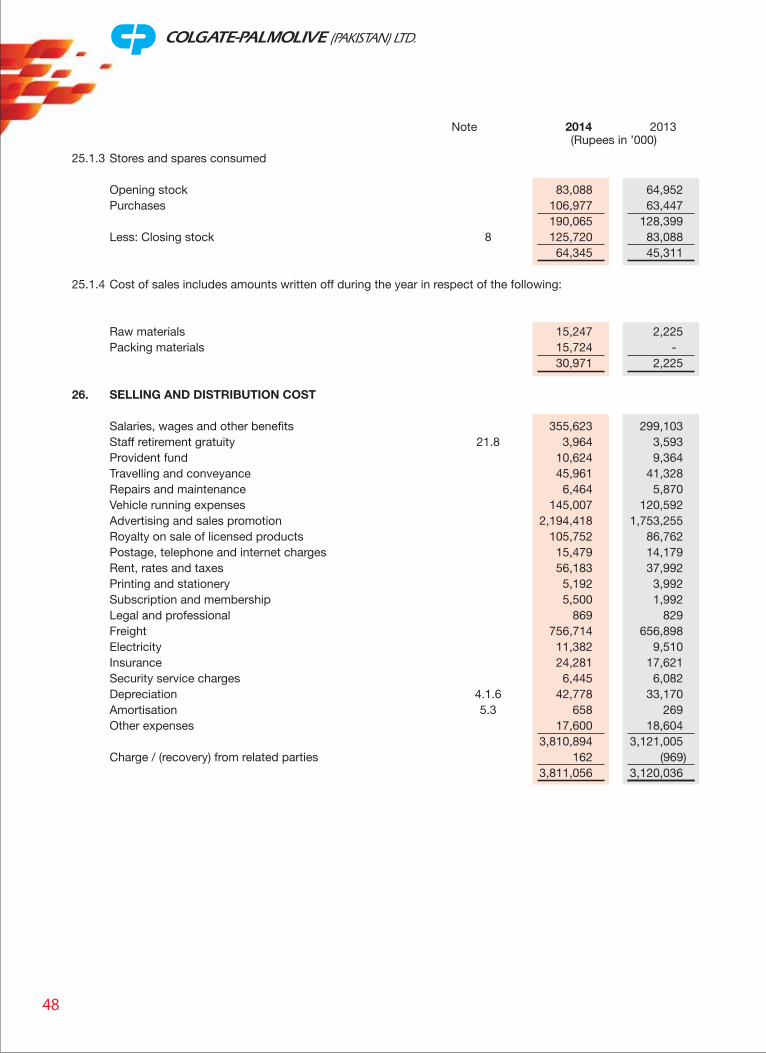
48
(Rupees in ’000)2014 2013Note
25.1.3 Stores and spares consumed
Opening stock 83,088 64,952Purchases 106,977 63,447
190,065 128,399Less: Closing stock 8 125,720 83,088
64,345 45,311
25.1.4 Cost of sales includes amounts written off during the year in respect of the following:
Raw materials 15,247 2,225Packing materials 15,724 -
30,971 2,225
26. SELLING AND DISTRIBUTION COST
Salaries, wages and other benefits 355,623 299,103Staff retirement gratuity 21.8 3,964 3,593Provident fund 10,624 9,364Travelling and conveyance 45,961 41,328Repairs and maintenance 6,464 5,870Vehicle running expenses 145,007 120,592Advertising and sales promotion 2,194,418 1,753,255Royalty on sale of licensed products 105,752 86,762Postage, telephone and internet charges 15,479 14,179Rent, rates and taxes 56,183 37,992Printing and stationery 5,192 3,992Subscription and membership 5,500 1,992Legal and professional 869 829Freight 756,714 656,898Electricity 11,382 9,510Insurance 24,281 17,621Security service charges 6,445 6,082Depreciation 4.1.6 42,778 33,170Amortisation 5.3 658 269Other expenses 17,600 18,604
3,810,894 3,121,005Charge / (recovery) from related parties 162 (969)
3,811,056 3,120,036
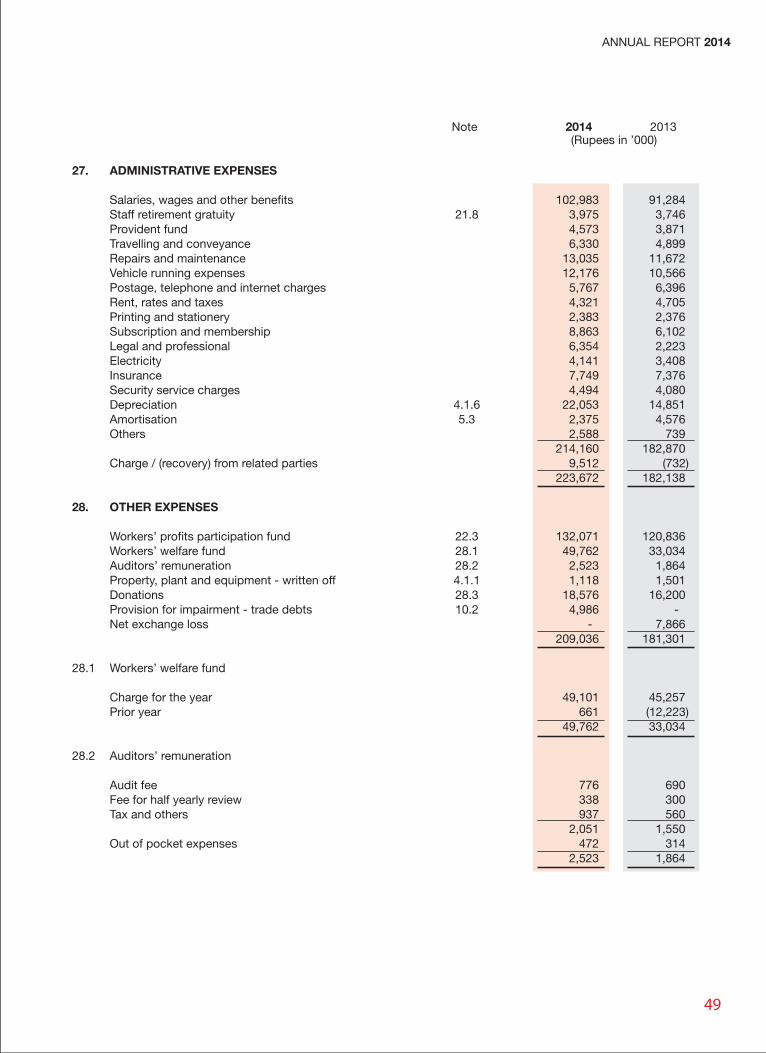
49
ANNUAL REPORT 2014
(Rupees in ’000)2014 2013Note
27. ADMINISTRATIVE EXPENSES
Salaries, wages and other benefits 102,983 91,284Staff retirement gratuity 21.8 3,975 3,746Provident fund 4,573 3,871Travelling and conveyance 6,330 4,899Repairs and maintenance 13,035 11,672Vehicle running expenses 12,176 10,566Postage, telephone and internet charges 5,767 6,396Rent, rates and taxes 4,321 4,705Printing and stationery 2,383 2,376Subscription and membership 8,863 6,102Legal and professional 6,354 2,223Electricity 4,141 3,408Insurance 7,749 7,376Security service charges 4,494 4,080Depreciation 4.1.6 22,053 14,851Amortisation 5.3 2,375 4,576Others 2,588 739
214,160 182,870Charge / (recovery) from related parties 9,512 (732)
223,672 182,138
28. OTHER EXPENSES
Workers’ profits participation fund 22.3 132,071 120,836Workers’ welfare fund 28.1 49,762 33,034Auditors’ remuneration 28.2 2,523 1,864Property, plant and equipment - written off 4.1.1 1,118 1,501Donations 28.3 18,576 16,200Provision for impairment - trade debts 10.2 4,986 -Net exchange loss - 7,866
209,036 181,301
28.1 Workers’ welfare fund
Charge for the year 49,101 45,257Prior year 661 (12,223)
49,762 33,034
28.2 Auditors’ remuneration
Audit fee 776 690Fee for half yearly review 338 300Tax and others 937 560
2,051 1,550Out of pocket expenses 472 314
2,523 1,864
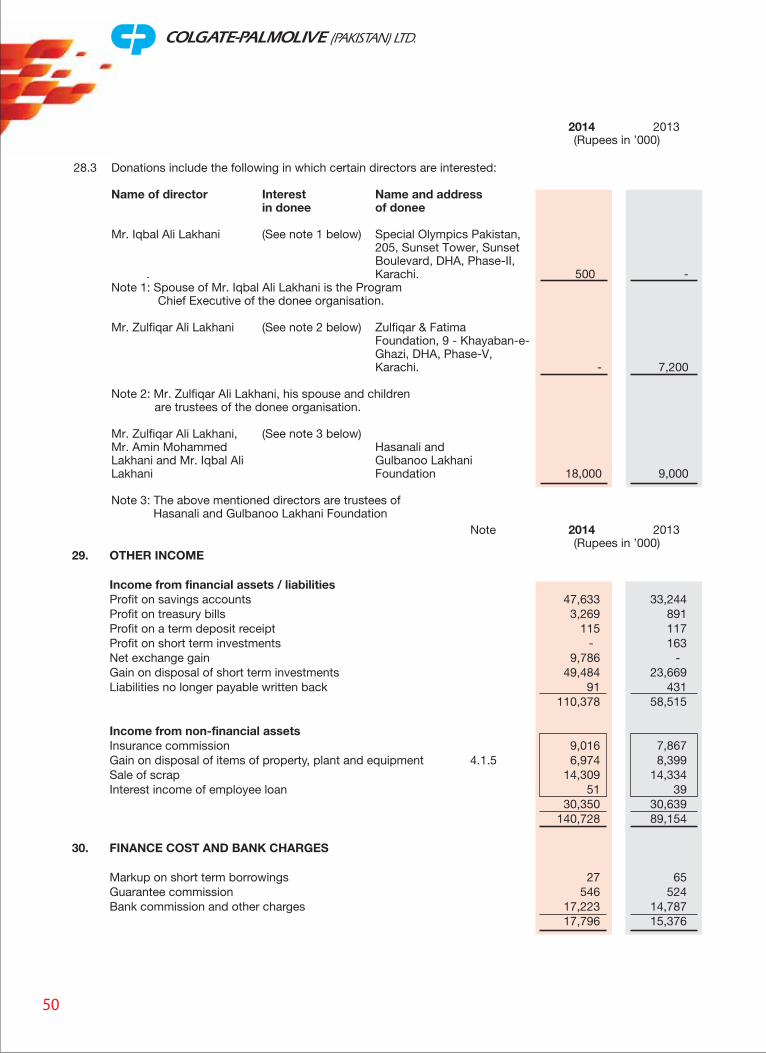
50
(Rupees in ’000)2014 2013
28.3 Donations include the following in which certain directors are interested:
Name of director Interest Name and address in donee of donee
Mr. Iqbal Ali Lakhani (See note 1 below) Special Olympics Pakistan,205, Sunset Tower, SunsetBoulevard, DHA, Phase-II,Karachi. 500 -
Note 1: Spouse of Mr. Iqbal Ali Lakhani is the Program Chief Executive of the donee organisation.
Mr. Zulfiqar Ali Lakhani (See note 2 below) Zulfiqar & FatimaFoundation, 9 - Khayaban-e-Ghazi, DHA, Phase-V,Karachi. - 7,200
Note 2: Mr. Zulfiqar Ali Lakhani, his spouse and children are trustees of the donee organisation.
Mr. Zulfiqar Ali Lakhani, (See note 3 below)Mr. Amin Mohammed Hasanali andLakhani and Mr. Iqbal Ali Gulbanoo LakhaniLakhani Foundation 18,000 9,000
Note 3: The above mentioned directors are trustees of Hasanali and Gulbanoo Lakhani Foundation
29. OTHER INCOME
Income from financial assets / liabilitiesProfit on savings accounts 47,633 33,244Profit on treasury bills 3,269 891Profit on a term deposit receipt 115 117Profit on short term investments - 163Net exchange gain 9,786 -Gain on disposal of short term investments 49,484 23,669Liabilities no longer payable written back 91 431
110,378 58,515
Income from non-financial assetsInsurance commission 9,016 7,867Gain on disposal of items of property, plant and equipment 4.1.5 6,974 8,399Sale of scrap 14,309 14,334Interest income of employee loan 51 39
30,350 30,639 140,728 89,154
30. FINANCE COST AND BANK CHARGES
Markup on short term borrowings 27 65Guarantee commission 546 524Bank commission and other charges 17,223 14,787
17,796 15,376
(Rupees in ’000)2014 2013Note
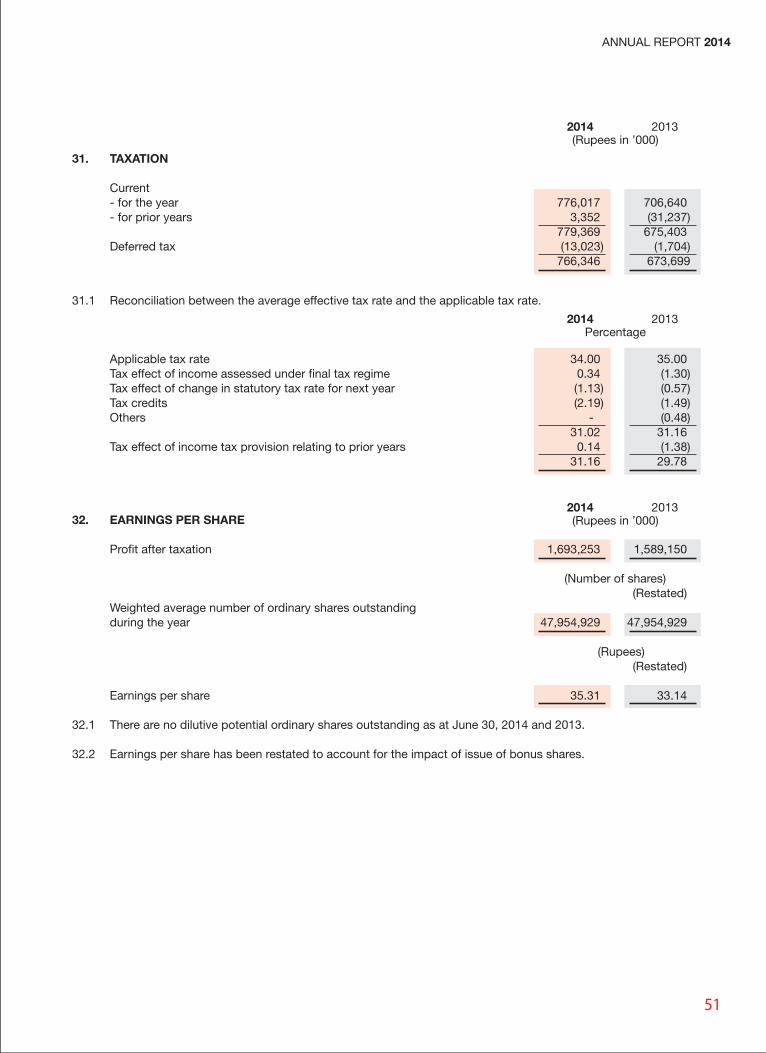
51
ANNUAL REPORT 2014
31.1 Reconciliation between the average effective tax rate and the applicable tax rate.
Applicable tax rate 34.00 35.00Tax effect of income assessed under final tax regime 0.34 (1.30)Tax effect of change in statutory tax rate for next year (1.13) (0.57)Tax credits (2.19) (1.49)Others - (0.48)
31.02 31.16Tax effect of income tax provision relating to prior years 0.14 (1.38)
31.16 29.78
32. EARNINGS PER SHARE
Profit after taxation 1,693,253 1,589,150
(Number of shares) (Restated)
Weighted average number of ordinary shares outstandingduring the year 47,954,929 47,954,929
(Rupees) (Restated)
Earnings per share 35.31 33.14
32.1 There are no dilutive potential ordinary shares outstanding as at June 30, 2014 and 2013.
32.2 Earnings per share has been restated to account for the impact of issue of bonus shares.
(Rupees in ’000)2014 2013
Percentage2014 2013
31. TAXATION
Current- for the year 776,017 706,640- for prior years 3,352 (31,237)
779,369 675,403Deferred tax (13,023) (1,704)
766,346 673,699
(Rupees in ’000)2014 2013
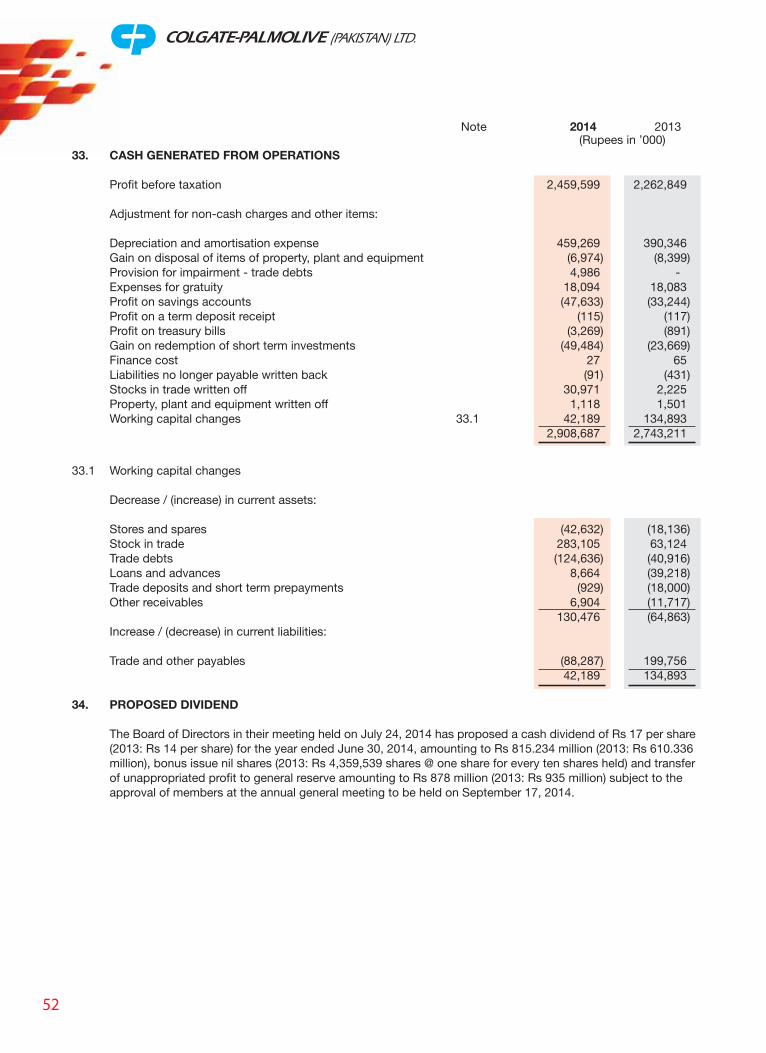
52
33.1 Working capital changes
Decrease / (increase) in current assets:
Stores and spares (42,632) (18,136)Stock in trade 283,105 63,124Trade debts (124,636) (40,916)Loans and advances 8,664 (39,218)Trade deposits and short term prepayments (929) (18,000)Other receivables 6,904 (11,717)
130,476 (64,863)Increase / (decrease) in current liabilities:
Trade and other payables (88,287) 199,756 42,189 134,893
34. PROPOSED DIVIDEND
The Board of Directors in their meeting held on July 24, 2014 has proposed a cash dividend of Rs 17 per share(2013: Rs 14 per share) for the year ended June 30, 2014, amounting to Rs 815.234 million (2013: Rs 610.336million), bonus issue nil shares (2013: Rs 4,359,539 shares @ one share for every ten shares held) and transferof unappropriated profit to general reserve amounting to Rs 878 million (2013: Rs 935 million) subject to theapproval of members at the annual general meeting to be held on September 17, 2014.
33. CASH GENERATED FROM OPERATIONS
Profit before taxation 2,459,599 2,262,849
Adjustment for non-cash charges and other items:
Depreciation and amortisation expense 459,269 390,346Gain on disposal of items of property, plant and equipment (6,974) (8,399)Provision for impairment - trade debts 4,986 -Expenses for gratuity 18,094 18,083Profit on savings accounts (47,633) (33,244)Profit on a term deposit receipt (115) (117)Profit on treasury bills (3,269) (891)Gain on redemption of short term investments (49,484) (23,669)Finance cost 27 65Liabilities no longer payable written back (91) (431)Stocks in trade written off 30,971 2,225Property, plant and equipment written off 1,118 1,501Working capital changes 33.1 42,189 134,893
2,908,687 2,743,211
(Rupees in ’000)2014 2013Note
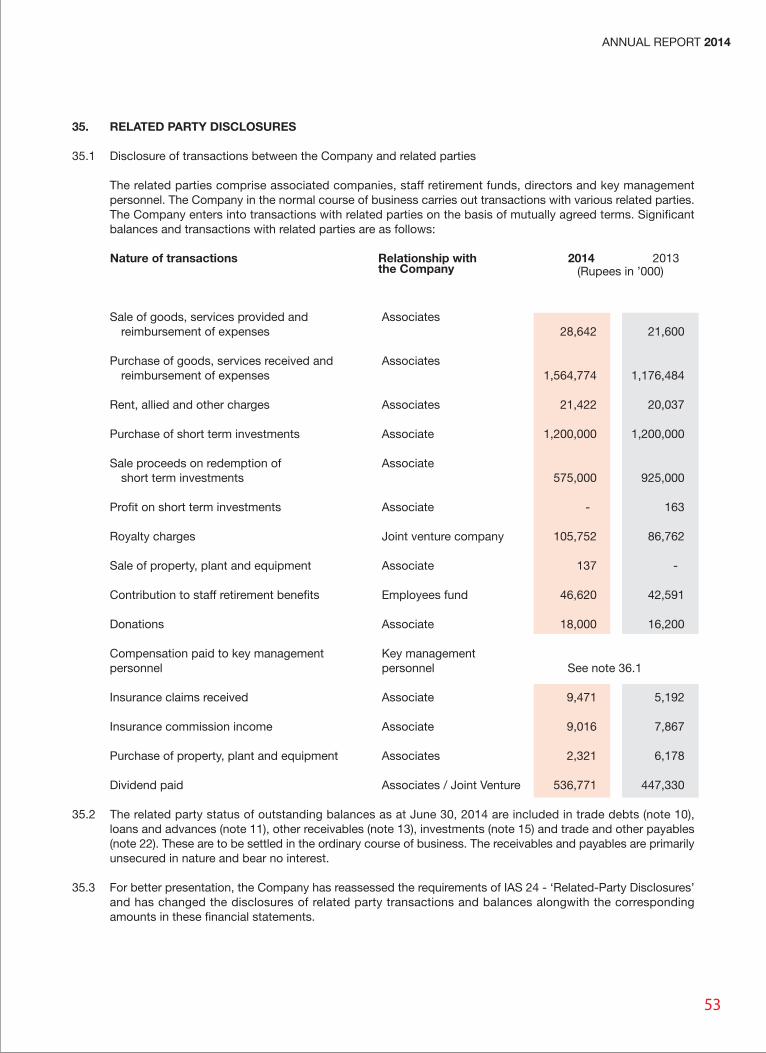
53
ANNUAL REPORT 2014
(Rupees in ’000)2014 2013Relationship with
the CompanyNature of transactions
35. RELATED PARTY DISCLOSURES
35.1 Disclosure of transactions between the Company and related parties
The related parties comprise associated companies, staff retirement funds, directors and key managementpersonnel. The Company in the normal course of business carries out transactions with various related parties.The Company enters into transactions with related parties on the basis of mutually agreed terms. Significantbalances and transactions with related parties are as follows:
Sale of goods, services provided and Associatesreimbursement of expenses 28,642 21,600
Purchase of goods, services received and Associatesreimbursement of expenses 1,564,774 1,176,484
Rent, allied and other charges Associates 21,422 20,037
Purchase of short term investments Associate 1,200,000 1,200,000
Sale proceeds on redemption of Associateshort term investments 575,000 925,000
Profit on short term investments Associate - 163
Royalty charges Joint venture company 105,752 86,762
Sale of property, plant and equipment Associate 137 -
Contribution to staff retirement benefits Employees fund 46,620 42,591
Donations Associate 18,000 16,200
Compensation paid to key management Key managementpersonnel personnel See note 36.1
Insurance claims received Associate 9,471 5,192
Insurance commission income Associate 9,016 7,867
Purchase of property, plant and equipment Associates 2,321 6,178
Dividend paid Associates / Joint Venture 536,771 447,330
35.2 The related party status of outstanding balances as at June 30, 2014 are included in trade debts (note 10),loans and advances (note 11), other receivables (note 13), investments (note 15) and trade and other payables(note 22). These are to be settled in the ordinary course of business. The receivables and payables are primarilyunsecured in nature and bear no interest.
35.3 For better presentation, the Company has reassessed the requirements of IAS 24 - ‘Related-Party Disclosures’and has changed the disclosures of related party transactions and balances alongwith the correspondingamounts in these financial statements.
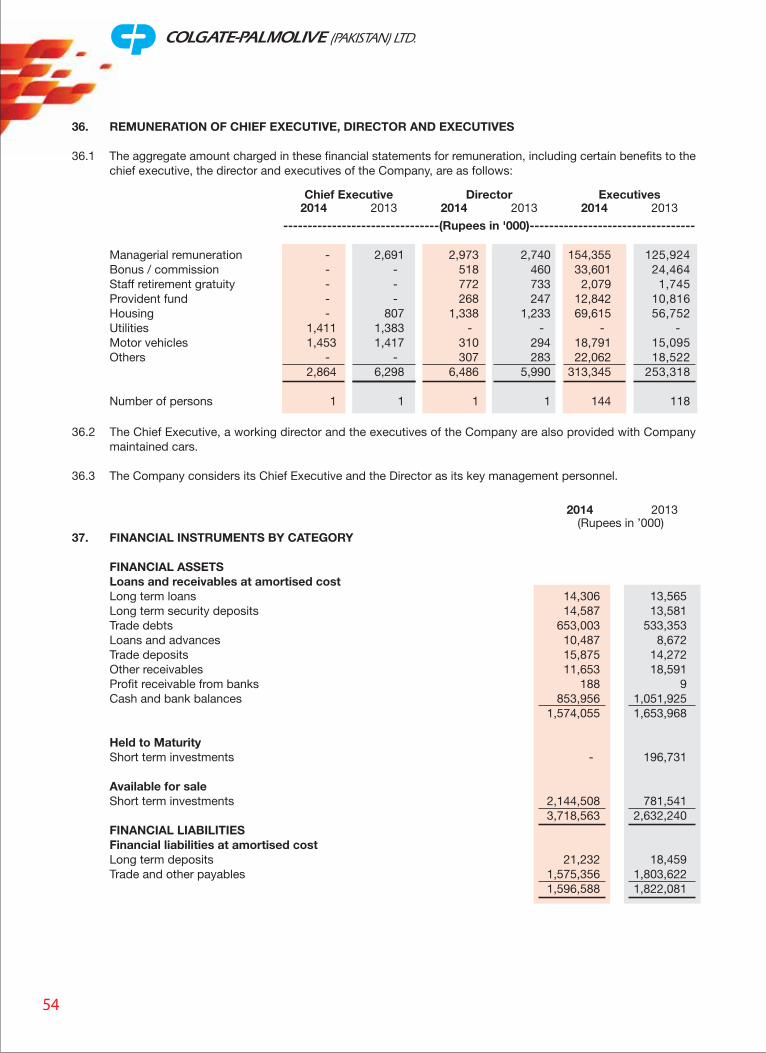
54
Chief Executive Director Executives2014 2013 2014 2013 2014 2013
--------------------------------(Rupees in '000)----------------------------------
Managerial remuneration - 2,691 2,973 2,740 154,355 125,924Bonus / commission - - 518 460 33,601 24,464Staff retirement gratuity - - 772 733 2,079 1,745Provident fund - - 268 247 12,842 10,816Housing - 807 1,338 1,233 69,615 56,752Utilities 1,411 1,383 - - - -Motor vehicles 1,453 1,417 310 294 18,791 15,095Others - - 307 283 22,062 18,522
2,864 6,298 6,486 5,990 313,345 253,318
Number of persons 1 1 1 1 144 118
36. REMUNERATION OF CHIEF EXECUTIVE, DIRECTOR AND EXECUTIVES
36.1 The aggregate amount charged in these financial statements for remuneration, including certain benefits to thechief executive, the director and executives of the Company, are as follows:
36.2 The Chief Executive, a working director and the executives of the Company are also provided with Companymaintained cars.
36.3 The Company considers its Chief Executive and the Director as its key management personnel.
(Rupees in ’000)2014 2013
37. FINANCIAL INSTRUMENTS BY CATEGORY
FINANCIAL ASSETSLoans and receivables at amortised costLong term loans 14,306 13,565Long term security deposits 14,587 13,581Trade debts 653,003 533,353Loans and advances 10,487 8,672Trade deposits 15,875 14,272Other receivables 11,653 18,591Profit receivable from banks 188 9Cash and bank balances 853,956 1,051,925
1,574,055 1,653,968
Held to MaturityShort term investments - 196,731
Available for saleShort term investments 2,144,508 781,541
3,718,563 2,632,240FINANCIAL LIABILITIESFinancial liabilities at amortised costLong term deposits 21,232 18,459Trade and other payables 1,575,356 1,803,622
1,596,588 1,822,081
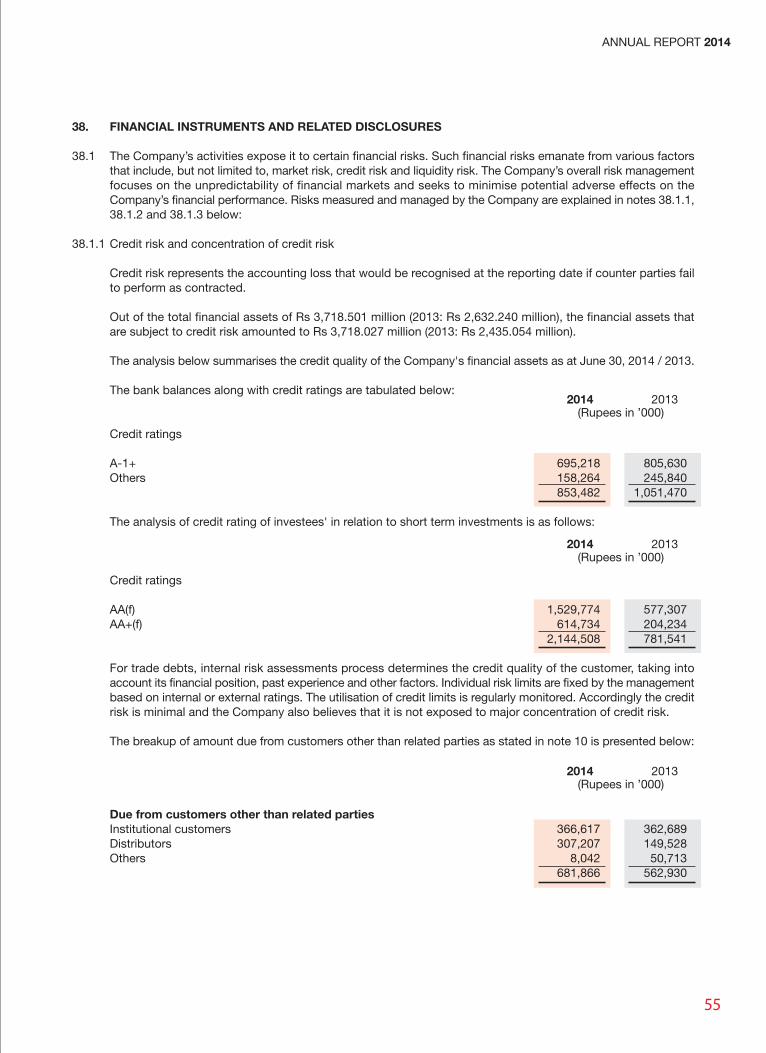
(Rupees in ’000)2014 2013
38. FINANCIAL INSTRUMENTS AND RELATED DISCLOSURES
38.1 The Company’s activities expose it to certain financial risks. Such financial risks emanate from various factorsthat include, but not limited to, market risk, credit risk and liquidity risk. The Company’s overall risk managementfocuses on the unpredictability of financial markets and seeks to minimise potential adverse effects on theCompany’s financial performance. Risks measured and managed by the Company are explained in notes 38.1.1,38.1.2 and 38.1.3 below:
38.1.1 Credit risk and concentration of credit risk
Credit risk represents the accounting loss that would be recognised at the reporting date if counter parties failto perform as contracted.
Out of the total financial assets of Rs 3,718.501 million (2013: Rs 2,632.240 million), the financial assets thatare subject to credit risk amounted to Rs 3,718.027 million (2013: Rs 2,435.054 million).
The analysis below summarises the credit quality of the Company's financial assets as at June 30, 2014 / 2013.
The bank balances along with credit ratings are tabulated below:
Credit ratings
A-1+ 695,218 805,630 Others 158,264 245,840
853,482 1,051,470
The analysis of credit rating of investees' in relation to short term investments is as follows:
Credit ratings
AA(f) 1,529,774 577,307 AA+(f) 614,734 204,234
2,144,508 781,541
For trade debts, internal risk assessments process determines the credit quality of the customer, taking intoaccount its financial position, past experience and other factors. Individual risk limits are fixed by the managementbased on internal or external ratings. The utilisation of credit limits is regularly monitored. Accordingly the creditrisk is minimal and the Company also believes that it is not exposed to major concentration of credit risk.
The breakup of amount due from customers other than related parties as stated in note 10 is presented below:
Due from customers other than related partiesInstitutional customers 366,617 362,689 Distributors 307,207 149,528 Others 8,042 50,713
681,866 562,930
(Rupees in ’000)2014 2013
(Rupees in ’000)2014 2013
55
ANNUAL REPORT 2014
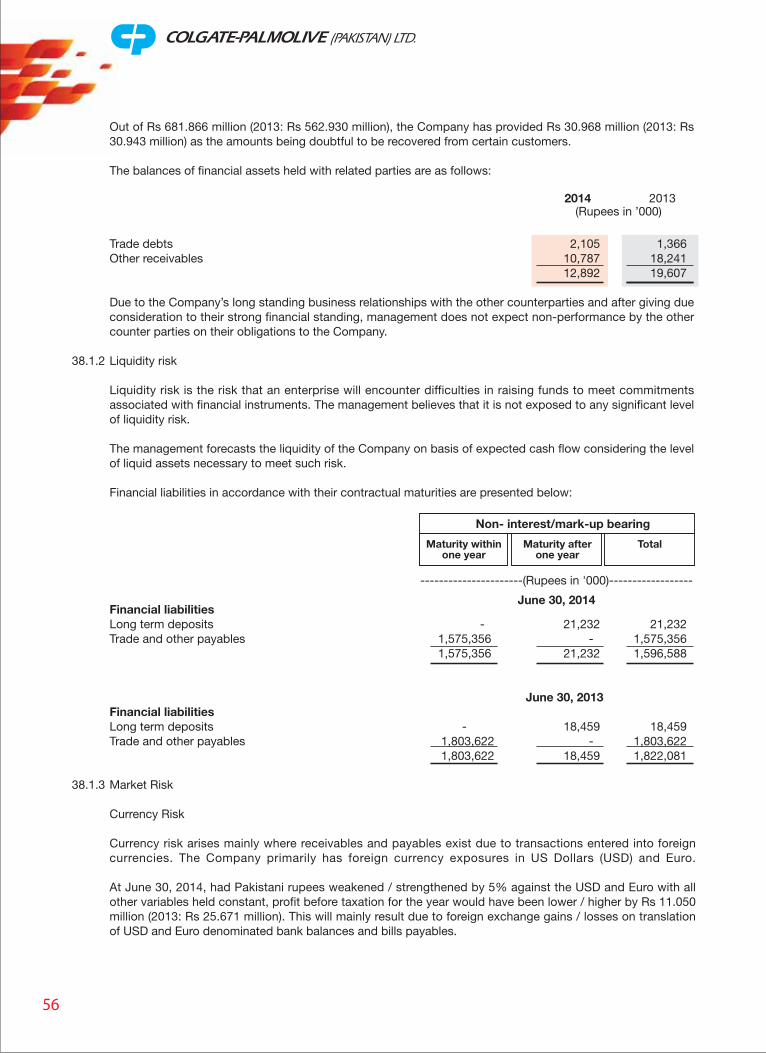
56
(Rupees in ’000)2014 2013
Non- interest/mark-up bearing
TotalMaturity withinone year
Maturity afterone year
----------------------(Rupees in '000)------------------
June 30, 2014
Out of Rs 681.866 million (2013: Rs 562.930 million), the Company has provided Rs 30.968 million (2013: Rs30.943 million) as the amounts being doubtful to be recovered from certain customers.
The balances of financial assets held with related parties are as follows:
Trade debts 2,105 1,366 Other receivables 10,787 18,241
12,892 19,607
Due to the Company’s long standing business relationships with the other counterparties and after giving dueconsideration to their strong financial standing, management does not expect non-performance by the othercounter parties on their obligations to the Company.
38.1.2 Liquidity risk
Liquidity risk is the risk that an enterprise will encounter difficulties in raising funds to meet commitmentsassociated with financial instruments. The management believes that it is not exposed to any significant levelof liquidity risk.
The management forecasts the liquidity of the Company on basis of expected cash flow considering the levelof liquid assets necessary to meet such risk.
Financial liabilities in accordance with their contractual maturities are presented below:
Financial liabilitiesLong term deposits - 21,232 21,232 Trade and other payables 1,575,356 - 1,575,356
1,575,356 21,232 1,596,588
June 30, 2013Financial liabilitiesLong term deposits - 18,459 18,459 Trade and other payables 1,803,622 - 1,803,622
1,803,622 18,459 1,822,081
38.1.3 Market Risk
Currency Risk
Currency risk arises mainly where receivables and payables exist due to transactions entered into foreigncurrencies. The Company primarily has foreign currency exposures in US Dollars (USD) and Euro.
At June 30, 2014, had Pakistani rupees weakened / strengthened by 5% against the USD and Euro with allother variables held constant, profit before taxation for the year would have been lower / higher by Rs 11.050million (2013: Rs 25.671 million). This will mainly result due to foreign exchange gains / losses on translationof USD and Euro denominated bank balances and bills payables.
Interest rate risk
Interest / mark-up rate risk arises from the possibility that changes in interest / mark-up rates will affect thevalue of financial instruments. At June 30, 2014 the Company's financial instruments mainly affected due tochanges in the interest rates are balances placed on deposit accounts with banks where changes in interestrates may have impact on the future profits / cash flows. The effects of changes in interest rates on the futureprofits arising on the balances placed on deposit accounts with banks is not considered to be material in theoverall context of these financial statements.
Other price risk
Other price risk is the risk that the fair value or future cash flows from a financial instrument will fluctuate dueto changes in market prices (other than those arising from interest rate risk or currency risk), whether thosechanges are caused by factors specific to the individual financial instrument or its issuer, or factors affectingall similar financial instruments traded in the market. The effects of changes in fair value of such investmentsmade by Company, on the future profits are not considered to be material in the overall context of these financialstatements.
38.1.4 Fair value of financial instruments
Fair value is an amount for which an asset could be exchanged, or a liability settled, between knowledgeablewilling parties in an arm's length transaction. Consequently, differences may arise between the carrying valueand the fair value estimates.
As at June 30, 2014 the net fair value of all financial assets and financial liabilities are estimated to approximatetheir carrying values.
Financial assets which are tradeable in an open market are revalued at the market prices prevailing on thebalance sheet date. The fair values of all other financial assets and liabilities are not considered to be significantlydifferent from their carrying values as these financial assets and liabilities are short term in nature.
The Company classifies the financial statements measured in the balance sheet at fair value in accordance withthe following fair value measurement hierarchy:
a) Quoted prices (unadjusted) in active markets for identical assets or liabilities (level 1).
b) Inputs other than quoted prices included within level 1 that are observable for the asset or liability, eitherdirectly (that is, as prices) or indirectly (that is, derived from prices) (level 2).
c) Inputs for the asset or liability that are not based on observable market data (that is, unobservable inputs)(level 3).
Financial assets classified as short term investments - available for sale are classified under level 1 as at June30, 2014.
39. CAPITAL RISK MANAGEMENT
The Company’s objectives when managing capital are to safeguard the Company’s ability to continue as agoing concern in order to provide returns for shareholders and benefits for other stakeholders and to maintainan optimal capital structure.
In order to maintain or adjust the capital structure, the Company may adjust the amount of dividends paid toshareholders, return capital to shareholders or issue new shares or sell assets to reduce debt.
Consistent with others in the industry, the Company manages its capital risk by monitoring its debt levels andliquid assets and keeping in view future investment requirements and expectation of the shareholders.
As at June 30, 2014 and 2013, the Company had surplus reserves to meet its requirements.
57
ANNUAL REPORT 2014
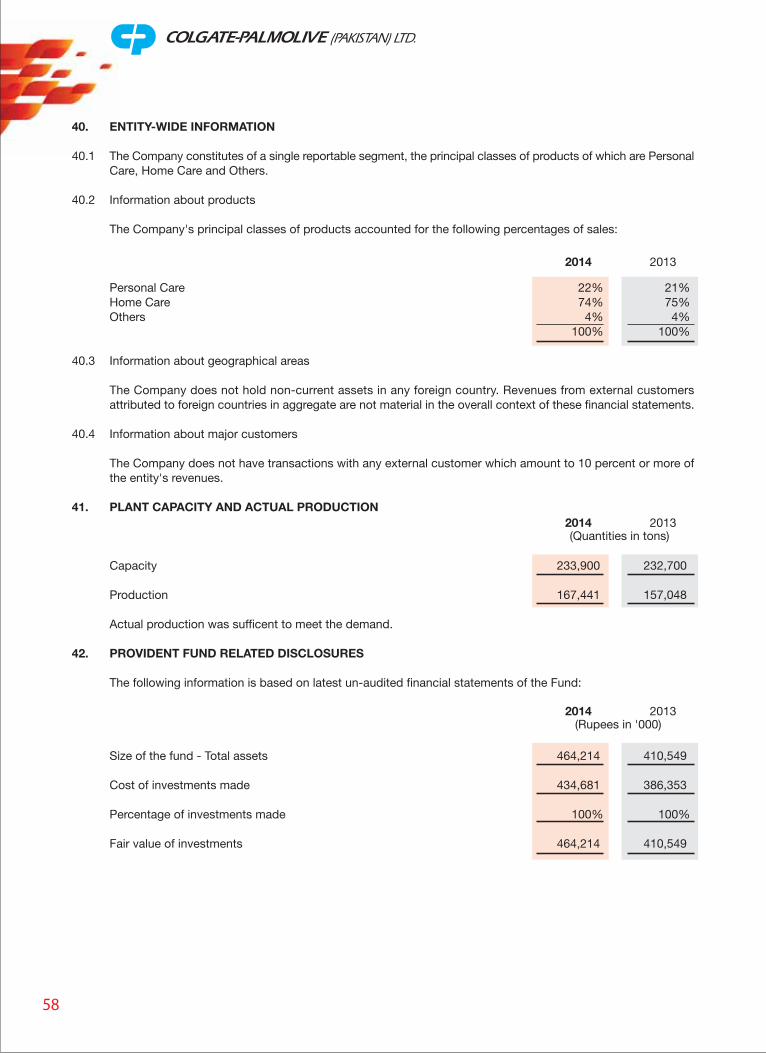
58
2014 2013
(Quantities in tons)2014 2013
(Rupees in '000)2014 2013
40. ENTITY-WIDE INFORMATION
40.1 The Company constitutes of a single reportable segment, the principal classes of products of which are PersonalCare, Home Care and Others.
40.2 Information about products
The Company's principal classes of products accounted for the following percentages of sales:
Personal Care 22% 21%Home Care 74% 75%Others 4% 4%
100% 100%
40.3 Information about geographical areas
The Company does not hold non-current assets in any foreign country. Revenues from external customersattributed to foreign countries in aggregate are not material in the overall context of these financial statements.
40.4 Information about major customers
The Company does not have transactions with any external customer which amount to 10 percent or more ofthe entity's revenues.
41. PLANT CAPACITY AND ACTUAL PRODUCTION
Capacity 233,900 232,700
Production 167,441 157,048
Actual production was sufficent to meet the demand.
42. PROVIDENT FUND RELATED DISCLOSURES
The following information is based on latest un-audited financial statements of the Fund:
Size of the fund - Total assets 464,214 410,549
Cost of investments made 434,681 386,353
Percentage of investments made 100% 100%
Fair value of investments 464,214 410,549
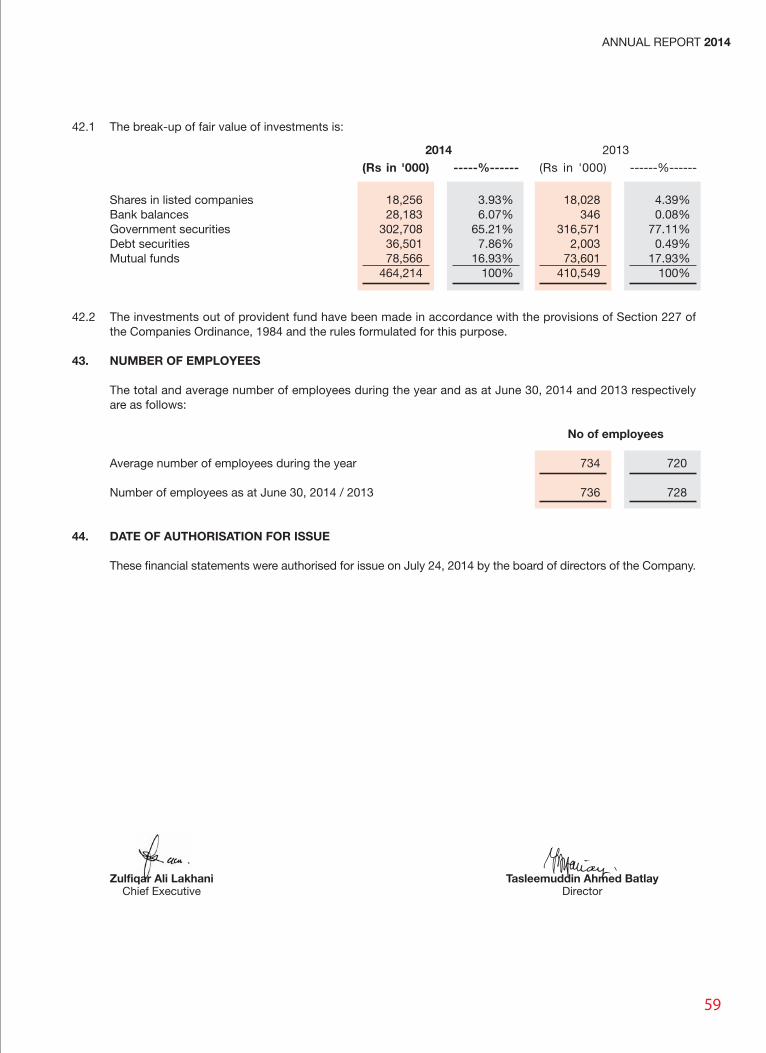
59
ANNUAL REPORT 2014
Tasleemuddin Ahmed BatlayDirector
Zulfiqar Ali LakhaniChief Executive
2014 2013
(Rs in '000) -----%------ (Rs in '000) ------%------
42.1 The break-up of fair value of investments is:
Shares in listed companies 18,256 3.93% 18,028 4.39%Bank balances 28,183 6.07% 346 0.08%Government securities 302,708 65.21% 316,571 77.11%Debt securities 36,501 7.86% 2,003 0.49%Mutual funds 78,566 16.93% 73,601 17.93%
464,214 100% 410,549 100%
42.2 The investments out of provident fund have been made in accordance with the provisions of Section 227 ofthe Companies Ordinance, 1984 and the rules formulated for this purpose.
43. NUMBER OF EMPLOYEES
The total and average number of employees during the year and as at June 30, 2014 and 2013 respectivelyare as follows:
No of employees
Average number of employees during the year 734 720
Number of employees as at June 30, 2014 / 2013 736 728
44. DATE OF AUTHORISATION FOR ISSUE
These financial statements were authorised for issue on July 24, 2014 by the board of directors of the Company.
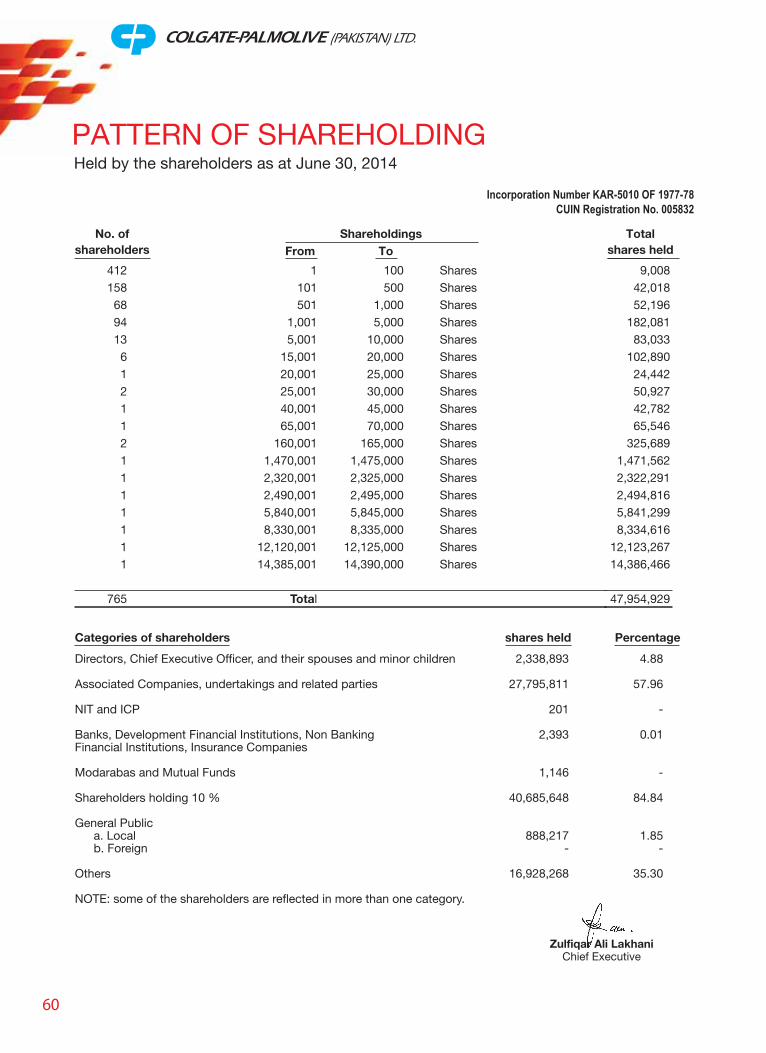
60
PATTERN OF SHAREHOLDINGHeld by the shareholders as at June 30, 2014
Incorporation Number KAR-5010 OF 1977-78CUIN Registration No. 005832
4121586894136121121111111
765
9,008 42,018 52,196
182,081 83,033
102,89024,442
50,927 42,782 65,546
325,689 1,471,562 2,322,291 2,494,816 5,841,299
8,334,616 12,123,267 14,386,466
47,954,929
No. ofshareholders
Totalshares held
1101501
1,0015,001
15,00120,00125,00140,00165,001
160,0011,470,0012,320,0012,490,0015,840,0018,330,001
12,120,00114,385,001
Total
100500
1,0005,000
10,00020,00025,00030,00045,00070,000
165,0001,475,0002,325,0002,495,0005,845,0008,335,000
12,125,00014,390,000
ShareholdingsFrom To
SharesSharesSharesSharesSharesSharesSharesSharesSharesSharesSharesSharesSharesSharesSharesSharesSharesShares
Directors, Chief Executive Officer, and their spouses and minor children 2,338,893 4.88
Associated Companies, undertakings and related parties 27,795,811 57.96
NIT and ICP 201 -
Banks, Development Financial Institutions, Non Banking 2,393 0.01Financial Institutions, Insurance Companies
Modarabas and Mutual Funds 1,146 -
Shareholders holding 10 % 40,685,648 84.84
General Publica. Local 888,217 1.85b. Foreign - -
Others 16,928,268 35.30
NOTE: some of the shareholders are reflected in more than one category.
Categories of shareholders Percentageshares held
Zulfiqar Ali LakhaniChief Executive
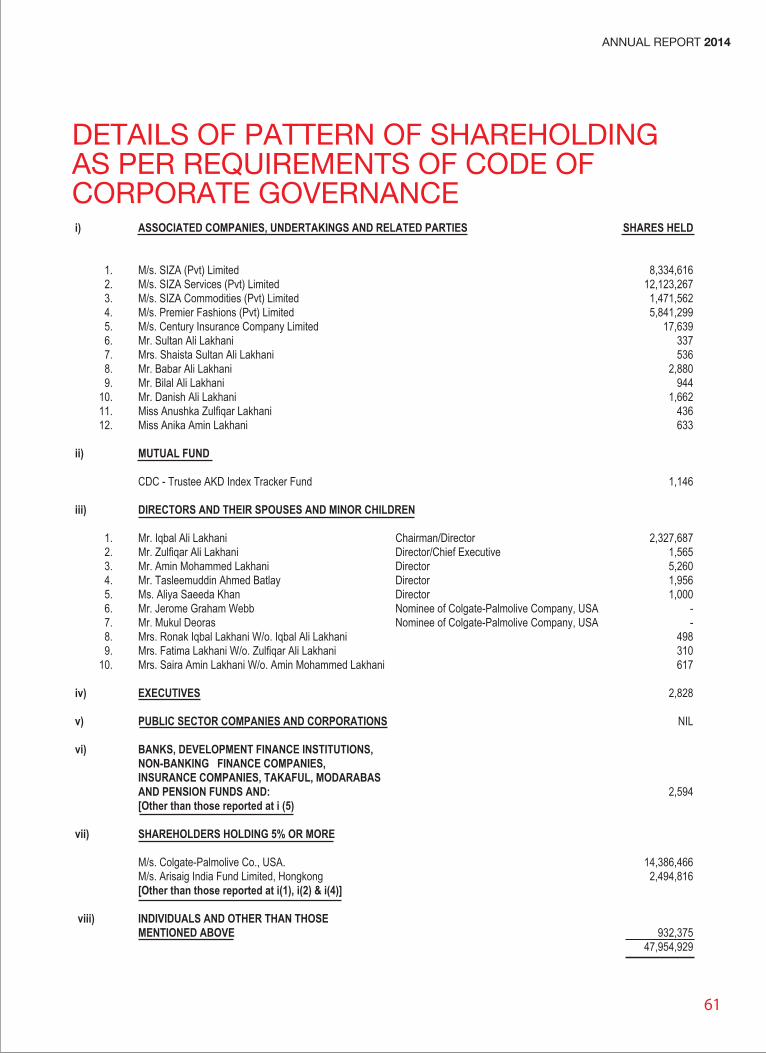
61
ANNUAL REPORT 2014
DETAILS OF PATTERN OF SHAREHOLDINGAS PER REQUIREMENTS OF CODE OFCORPORATE GOVERNANCEi) ASSOCIATED COMPANIES, UNDERTAKINGS AND RELATED PARTIES SHARES HELD
1. M/s. SIZA (Pvt) Limited 8,334,6162. M/s. SIZA Services (Pvt) Limited 12,123,2673. M/s. SIZA Commodities (Pvt) Limited 1,471,5624. M/s. Premier Fashions (Pvt) Limited 5,841,2995. M/s. Century Insurance Company Limited 17,6396. Mr. Sultan Ali Lakhani 3377. Mrs. Shaista Sultan Ali Lakhani 5368. Mr. Babar Ali Lakhani 2,8809. Mr. Bilal Ali Lakhani 944
10. Mr. Danish Ali Lakhani 1,66211. Miss Anushka Zulfiqar Lakhani 43612. Miss Anika Amin Lakhani 633
ii) MUTUAL FUND
CDC - Trustee AKD Index Tracker Fund 1,146
iii) DIRECTORS AND THEIR SPOUSES AND MINOR CHILDREN
1. Mr. Iqbal Ali Lakhani Chairman/Director 2,327,6872. Mr. Zulfiqar Ali Lakhani Director/Chief Executive 1,5653. Mr. Amin Mohammed Lakhani Director 5,2604. Mr. Tasleemuddin Ahmed Batlay Director 1,9565. Ms. Aliya Saeeda Khan Director 1,0006. Mr. Jerome Graham Webb Nominee of Colgate-Palmolive Company, USA -7. Mr. Mukul Deoras Nominee of Colgate-Palmolive Company, USA -8. Mrs. Ronak Iqbal Lakhani W/o. Iqbal Ali Lakhani 4989. Mrs. Fatima Lakhani W/o. Zulfiqar Ali Lakhani 310
10. Mrs. Saira Amin Lakhani W/o. Amin Mohammed Lakhani 617
iv) EXECUTIVES 2,828
v) PUBLIC SECTOR COMPANIES AND CORPORATIONS NIL
vi) BANKS, DEVELOPMENT FINANCE INSTITUTIONS,NON-BANKING FINANCE COMPANIES,INSURANCE COMPANIES, TAKAFUL, MODARABASAND PENSION FUNDS AND: 2,594[Other than those reported at i (5)
vii) SHAREHOLDERS HOLDING 5% OR MORE
M/s. Colgate-Palmolive Co., USA. 14,386,466M/s. Arisaig India Fund Limited, Hongkong 2,494,816[Other than those reported at i(1), i(2) & i(4)]
viii) INDIVIDUALS AND OTHER THAN THOSEMENTIONED ABOVE 932,375
47,954,929
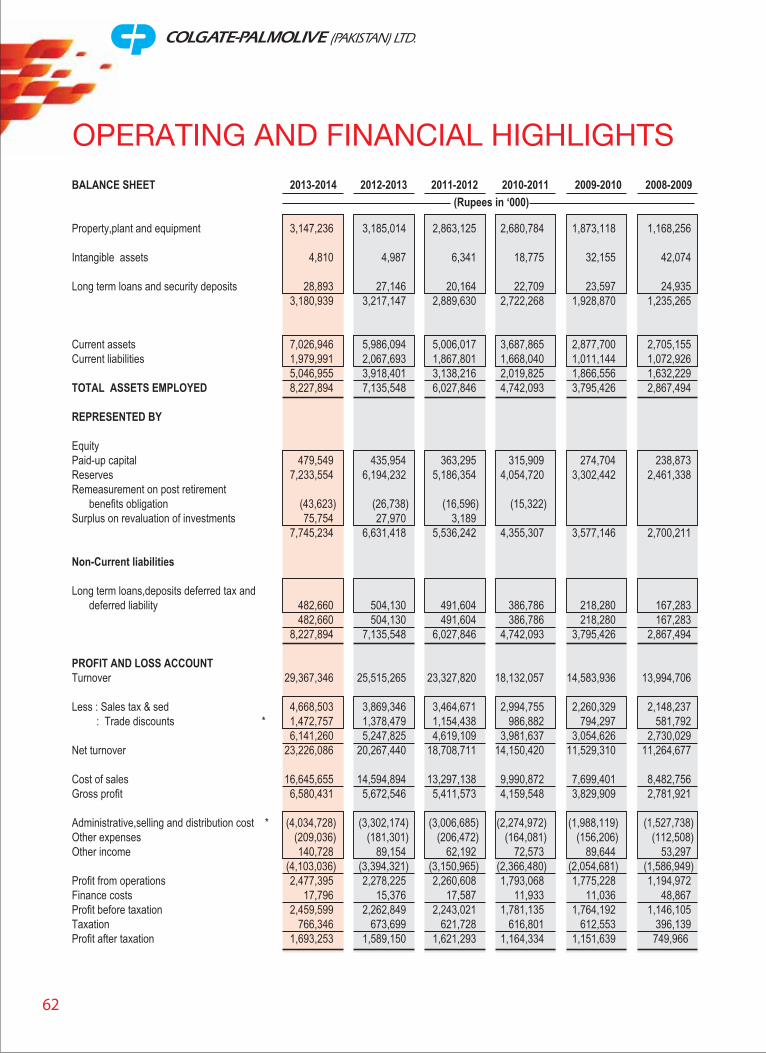
62
2009-2010 2008-20092010-20112011-2012
OPERATING AND FINANCIAL HIGHLIGHTSBALANCE SHEET
Property,plant and equipment 3,147,236 3,185,014 2,863,125 2,680,784 1,873,118 1,168,256
Intangible assets 4,810 4,987 6,341 18,775 32,155 42,074
Long term loans and security deposits 28,893 27,146 20,164 22,709 23,597 24,935 3,180,939 3,217,147 2,889,630 2,722,268 1,928,870 1,235,265
Current assets 7,026,946 5,986,094 5,006,017 3,687,865 2,877,700 2,705,155Current liabilities 1,979,991 2,067,693 1,867,801 1,668,040 1,011,144 1,072,926
5,046,955 3,918,401 3,138,216 2,019,825 1,866,556 1,632,229TOTAL ASSETS EMPLOYED 8,227,894 7,135,548 6,027,846 4,742,093 3,795,426 2,867,494
REPRESENTED BY
EquityPaid-up capital 479,549 435,954 363,295 315,909 274,704 238,873Reserves 7,233,554 6,194,232 5,186,354 4,054,720 3,302,442 2,461,338Remeasurement on post retirement
benefits obligation (43,623) (26,738) (16,596) (15,322)Surplus on revaluation of investments 75,754 27,970 3,189
7,745,234 6,631,418 5,536,242 4,355,307 3,577,146 2,700,211
Non-Current liabilities
Long term loans,deposits deferred tax and deferred liability 482,660 504,130 491,604 386,786 218,280 167,283
482,660 504,130 491,604 386,786 218,280 167,283 8,227,894 7,135,548 6,027,846 4,742,093 3,795,426 2,867,494
PROFIT AND LOSS ACCOUNT Turnover 29,367,346 25,515,265 23,327,820 18,132,057 14,583,936 13,994,706
Less : Sales tax & sed 4,668,503 3,869,346 3,464,671 2,994,755 2,260,329 2,148,237 : Trade discounts * 1,472,757 1,378,479 1,154,438 986,882 794,297 581,792
6,141,260 5,247,825 4,619,109 3,981,637 3,054,626 2,730,029Net turnover 23,226,086 20,267,440 18,708,711 14,150,420 11,529,310 11,264,677
Cost of sales 16,645,655 14,594,894 13,297,138 9,990,872 7,699,401 8,482,756Gross profit 6,580,431 5,672,546 5,411,573 4,159,548 3,829,909 2,781,921
Administrative,selling and distribution cost * (4,034,728) (3,302,174) (3,006,685) (2,274,972) (1,988,119) (1,527,738)Other expenses (209,036) (181,301) (206,472) (164,081) (156,206) (112,508)Other income 140,728 89,154 62,192 72,573 89,644 53,297
(4,103,036) (3,394,321) (3,150,965) (2,366,480) (2,054,681) (1,586,949)Profit from operations 2,477,395 2,278,225 2,260,608 1,793,068 1,775,228 1,194,972Finance costs 17,796 15,376 17,587 11,933 11,036 48,867Profit before taxation 2,459,599 2,262,849 2,243,021 1,781,135 1,764,192 1,146,105Taxation 766,346 673,699 621,728 616,801 612,553 396,139Profit after taxation 1,693,253 1,589,150 1,621,293 1,164,334 1,151,639 749,966
(Rupees in ‘000)2012-20132013-2014
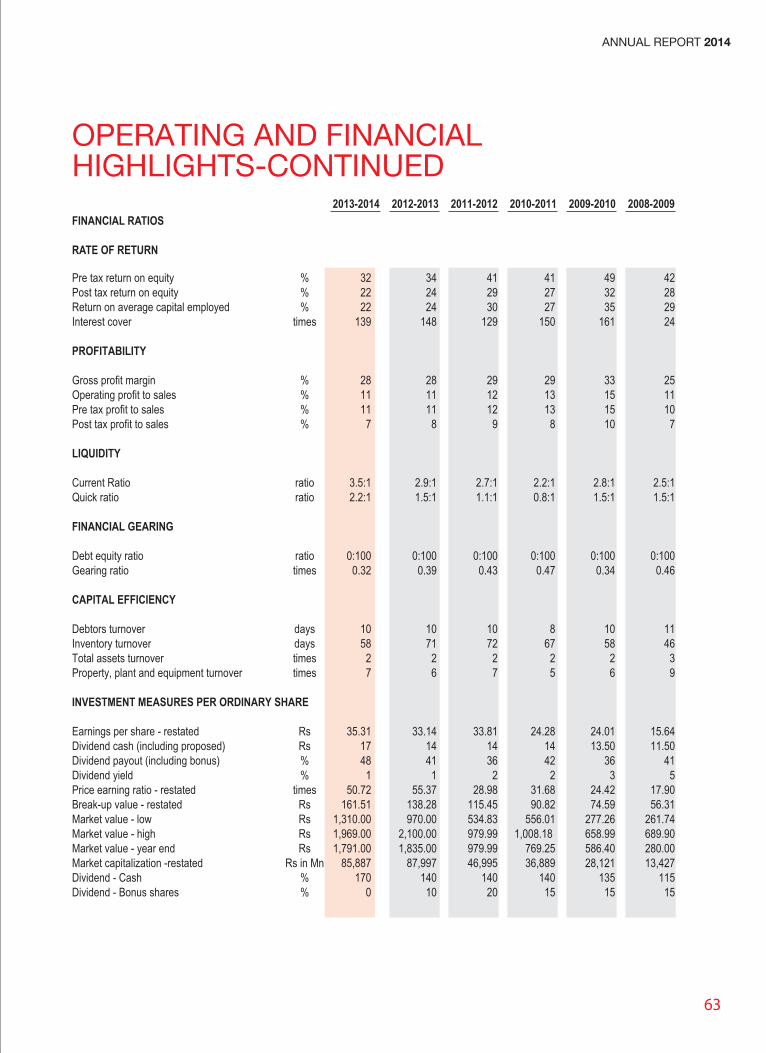
63
ANNUAL REPORT 2014
OPERATING AND FINANCIALHIGHLIGHTS-CONTINUED
FINANCIAL RATIOS
RATE OF RETURN
2013-2014 2012-2013 2011-2012 2010-2011 2008-20092009-2010
Pre tax return on equity % 32 34 41 41 49 42Post tax return on equity % 22 24 29 27 32 28Return on average capital employed % 22 24 30 27 35 29Interest cover times 139 148 129 150 161 24
PROFITABILITY
Gross profit margin % 28 28 29 29 33 25Operating profit to sales % 11 11 12 13 15 11Pre tax profit to sales % 11 11 12 13 15 10Post tax profit to sales % 7 8 9 8 10 7
LIQUIDITY
Current Ratio ratio 3.5:1 2.9:1 2.7:1 2.2:1 2.8:1 2.5:1Quick ratio ratio 2.2:1 1.5:1 1.1:1 0.8:1 1.5:1 1.5:1
FINANCIAL GEARING
Debt equity ratio ratio 0:100 0:100 0:100 0:100 0:100 0:100Gearing ratio times 0.32 0.39 0.43 0.47 0.34 0.46
CAPITAL EFFICIENCY
Debtors turnover days 10 10 10 8 10 11Inventory turnover days 58 71 72 67 58 46Total assets turnover times 2 2 2 2 2 3Property, plant and equipment turnover times 7 6 7 5 6 9
INVESTMENT MEASURES PER ORDINARY SHARE
Earnings per share - restated Rs 35.31 33.14 33.81 24.28 24.01 15.64Dividend cash (including proposed) Rs 17 14 14 14 13.50 11.50Dividend payout (including bonus) % 48 41 36 42 36 41Dividend yield % 1 1 2 2 3 5Price earning ratio - restated times 50.72 55.37 28.98 31.68 24.42 17.90Break-up value - restated Rs 161.51 138.28 115.45 90.82 74.59 56.31Market value - low Rs 1,310.00 970.00 534.83 556.01 277.26 261.74Market value - high Rs 1,969.00 2,100.00 979.99 1,008.18 658.99 689.90Market value - year end Rs 1,791.00 1,835.00 979.99 769.25 586.40 280.00Market capitalization -restated Rs in Mn 85,887 87,997 46,995 36,889 28,121 13,427Dividend - Cash % 170 140 140 140 135 115Dividend - Bonus shares % 0 10 20 15 15 15

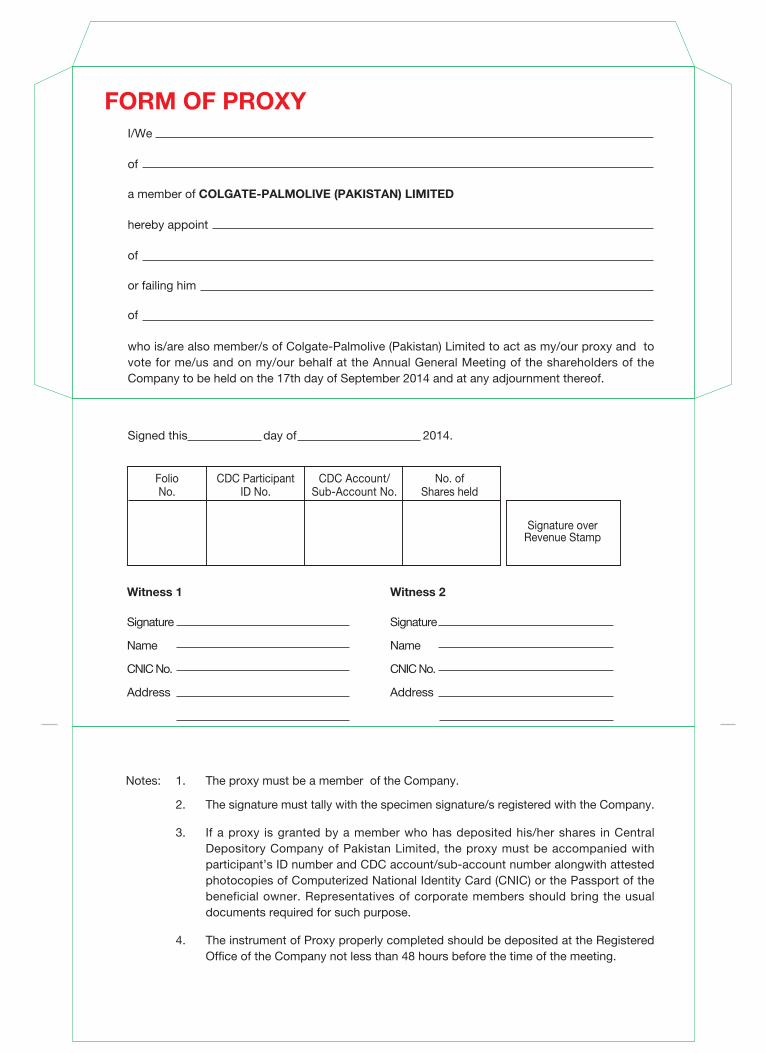
FORM OF PROXYI/We
of
a member of COLGATE-PALMOLIVE (PAKISTAN) LIMITED
hereby appoint
of
of
who is/are also member/s of Colgate-Palmolive (Pakistan) Limited to act as my/our proxy and tovote for me/us and on my/our behalf at the Annual General Meeting of the shareholders of theCompany to be held on the 17th day of September 2014 and at any adjournment thereof.
Signed this day of 2014.
Witness 1
FolioNo.
CDC ParticipantID No.
CDC Account/Sub-Account No.
No. ofShares held
Signature overRevenue Stamp
Notes: 1. The proxy must be a member of the Company.
2. The signature must tally with the specimen signature/s registered with the Company.
3. If a proxy is granted by a member who has deposited his/her shares in CentralDepository Company of Pakistan Limited, the proxy must be accompanied withparticipant’s ID number and CDC account/sub-account number alongwith attestedphotocopies of Computerized National Identity Card (CNIC) or the Passport of thebeneficial owner. Representatives of corporate members should bring the usualdocuments required for such purpose.
4. The instrument of Proxy properly completed should be deposited at the RegisteredOffice of the Company not less than 48 hours before the time of the meeting.
or failing him
Signature
Name
CNIC No.
Address
Signature
Name
CNIC No.
Address
Witness 2
Fold
Her
e
Fold
Her
e
Fold Here Fold Here
Fold Here Fold Here
Company Secretary
Lakson Square, Building No. 2,Sarwar Shaheed Road,Karachi.74200.Phone: 35698000
COLGATE-PALMOLIVE (PAKISTAN) LIMITED
AFFIXCORRECTPOSTAGE
Lakson Square, Building No. 2, Sarwar Shaheed Road, Karachi-74200. Tel: +9221-35698000