Embed Size (px)
Citation preview
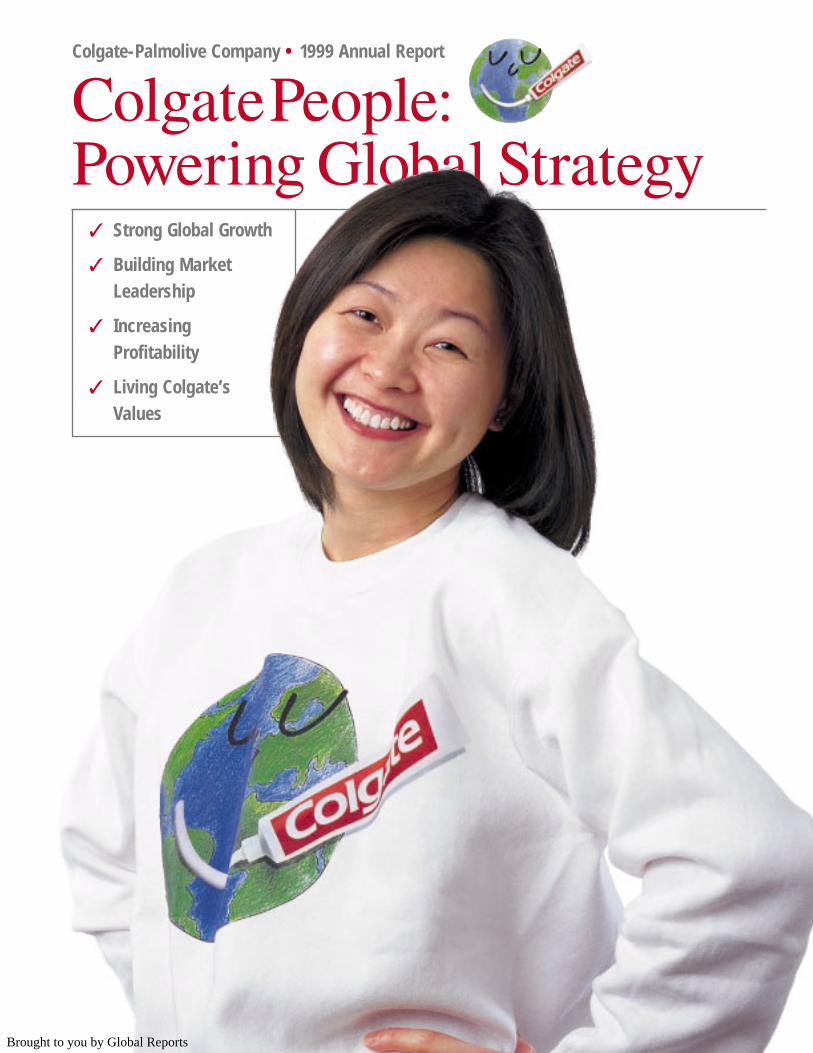
Colgate-Palmolive Company • 1999 Annual Report
ColgatePeople:Powering Global Strategy
✓ Strong Global Growth
✓ Building Market Leadership
✓ IncreasingProfitability
✓ Living Colgate’s Values
Colgate-Palmolive Company • 1999 Annual Report
ColgatePeople:Powering Global Strategy
Brought to you by Global Reports
Highlights
Strong Volume Growth
New Records in Profitability
Dear Colgate Shareholder 1
Glossary of Terms 4
Colgate People: Powering Global Strategy 4
Strong Global Growth 5
From every corner of the globe,
Colgate people are creating innovative
new products to drive strong and
consistent Company growth.
Building Market Leadership 8
Much to celebrate — as Colgate people
propel Number One brands higher, launch
new winners.
Increasing Profitability 12
The aggressive focus of Colgate people
on profitable new products, streamlined
operations and cost reduction once again
achieved sharp profit margin expansion.
Living Colgate’s Values 15
Colgate’s values are lived by 37,000 employees
worldwide and guide us toward improving people’s
lives, products, profitability and shareholder value.
Global Financial Review 18
Financial Statements 24
Notes 28
Quarterly Stock Market and Dividend Information 37
Your Board of Directors 38
Your Management Team 38
Shareholder Information 40
Eleven-Year Financial Summary 40
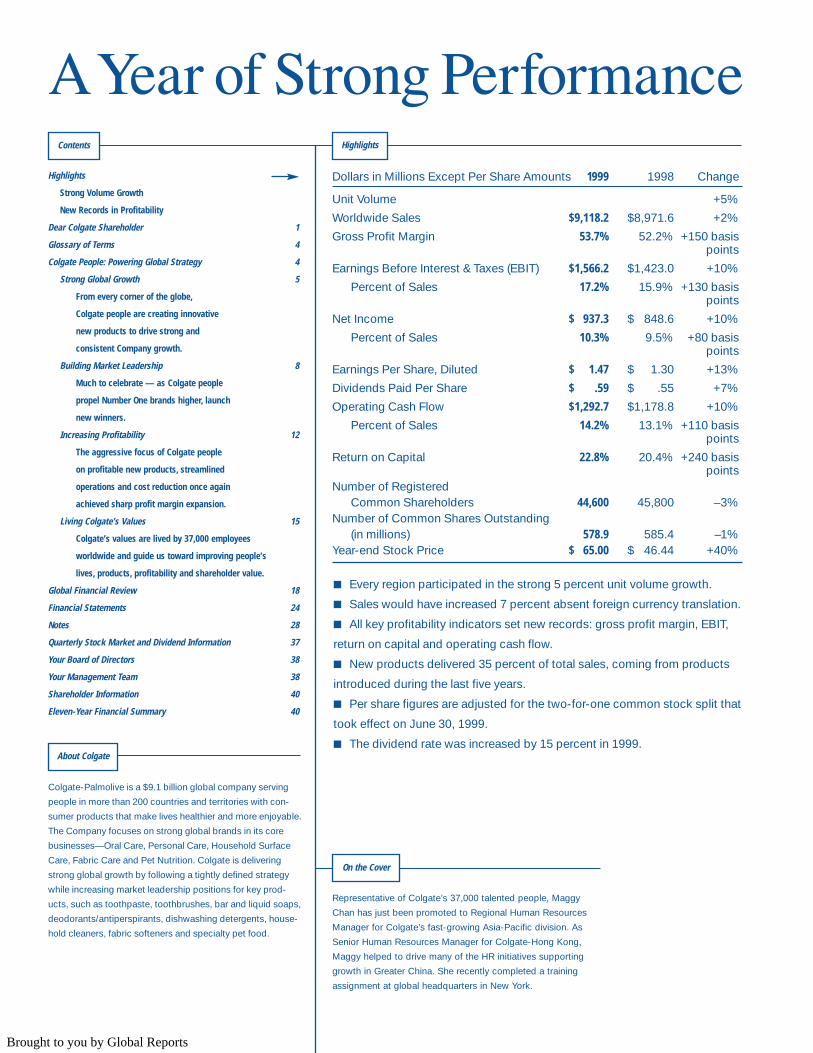
AYear of Strong PerformanceContents Highlights
Colgate-Palmolive is a $9.1 billion global company serving
people in more than 200 countries and territories with con-
sumer products that make lives healthier and more enjoyable.
The Company focuses on strong global brands in its core
businesses—Oral Care, Personal Care, Household Surface
Care, Fabric Care and Pet Nutrition. Colgate is delivering
strong global growth by following a tightly defined strategy
while increasing market leadership positions for key prod-
ucts, such as toothpaste, toothbrushes, bar and liquid soaps,
deodorants/antiperspirants, dishwashing detergents, house-
hold cleaners, fabric softeners and specialty pet food.
■ Every region participated in the strong 5 percent unit volume growth.
■ Sales would have increased 7 percent absent foreign currency translation.
■ All key profitability indicators set new records: gross profit margin, EBIT,
return on capital and operating cash flow.
■ New products delivered 35 percent of total sales, coming from products
introduced during the last five years.
■ Per share figures are adjusted for the two-for-one common stock split that
took effect on June 30, 1999.
■ The dividend rate was increased by 15 percent in 1999.
Representative of Colgate’s 37,000 talented people, Maggy
Chan has just been promoted to Regional Human Resources
Manager for Colgate’s fast-growing Asia-Pacific division. As
Senior Human Resources Manager for Colgate-Hong Kong,
Maggy helped to drive many of the HR initiatives supporting
growth in Greater China. She recently completed a training
assignment at global headquarters in New York.
Dollars in Millions Except Per Share Amounts 1999 1998 Change
Unit Volume +5%
Worldwide Sales $9,118.2 $8,971.6 +2%
Gross Profit Margin 53.7% 52.2% +150 basispoints
Earnings Before Interest & Taxes (EBIT) $1,566.2 $1,423.0 +10%
Percent of Sales 17.2% 15.9% +130 basispoints
Net Income $ 937.3 $ 848.6 +10%
Percent of Sales 10.3% 9.5% +80 basispoints
Earnings Per Share, Diluted $ 1.47 $ 1.30 +13%
Dividends Paid Per Share $ .59 $ .55 +7%
Operating Cash Flow $1,292.7 $1,178.8 +10%
Percent of Sales 14.2% 13.1% +110 basispoints
Return on Capital 22.8% 20.4% +240 basispoints
Number of Registered Common Shareholders 44,600 45,800 –3%
Number of Common Shares Outstanding(in millions) 578.9 585.4 –1%
Year-end Stock Price $ 65.00 $ 46.44 +40%
About Colgate
On the Cover
Brought to you by Global Reports
1
Colgate enters the millennium with excellent trends, hav-ing achieved strong, profitable growth throughout 1999.Our unit volume growth accelerated to 7 percent in the fourth quarter,
having grown progressively stronger in every quarter as our new
products won significant market share gains. For the full year, unit
volume rose 5 percent; gains in all divisions were led by Colgate-North
America, Colgate-Asia/Africa and Hill’s Pet Nutrition. Every division
worldwide achieved higher operating profits, greatly expanding our
profitability overall. Earnings per share on a diluted basis rose 13
percent to a new record of $1.47 versus $1.30 in 1998, and net income
rose 10 percent to $937.3 million, also a new record.
Declaring its confidence in Colgate’s near- and long-term prospects,
the Board of Directors authorized a 15 percent dividend increase and a
two-for-one stock split. Indeed, the strength of Colgate’s performance
in the 1990s has led the Board to approve a total of three stock splits—
two-for-one splits in 1991, 1997 and 1999.
Driving our outstanding performance are the 37,000 exceptionalmen and women who power our global strategy every singleday. They give Colgate an important competitive advantage.Especially impressive is how Colgate people at all levels maximize business
opportunities in both developed and high-growth markets. Despite uneven
global economic conditions, Colgate’s 1999 results continued to strengthen as
the year progressed. The timely actions taken in Brazil in early 1999, in Asia in
1997/1998 and in Russia in 1998 minimized the impact of downturns. Then, as
economies in Asia and Central Europe began to recover and Mexico surged
ahead, we had in place the right new products and marketing programs to
participate strongly in their economic expansions.
In the developed world, supply chain efficiencies and excellent response to
our value-added new products produced outstanding results in North America
and Europe and at Hill’s Pet Nutrition. For shareholders, our global presence
and experience managing under diverse conditions have produced consistent
total returns greater than many of our peers.
Dear Colgate Shareholder...
Another Record Year of Strong Volume and Earnings Growth
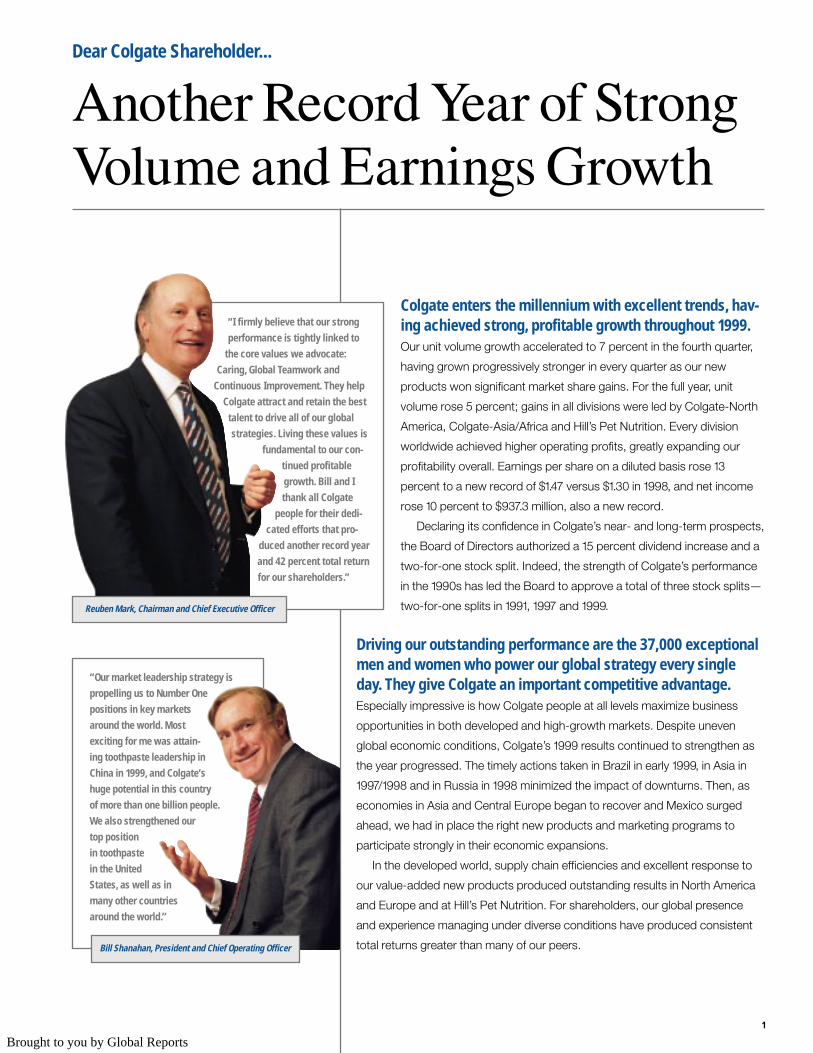
“Our market leadership strategy is
propelling us to Number One
positions in key markets
around the world. Most
exciting for me was attain-
ing toothpaste leadership in
China in 1999, and Colgate’s
huge potential in this country
of more than one billion people.
We also strengthened our
top position
in toothpaste
in the United
States, as well as in
many other countries
around the world.”
Bill Shanahan, President and Chief Operating Officer
“I firmly believe that our strong
performance is tightly linked to
the core values we advocate:
Caring, Global Teamwork and
Continuous Improvement. They help
Colgate attract and retain the best
talent to drive all of our global
strategies. Living these values is
fundamental to our con-
tinued profitable
growth. Bill and I
thank all Colgate
people for their dedi-
cated efforts that pro-
duced another record year
and 42 percent total return
for our shareholders.”
Reuben Mark, Chairman and Chief Executive Officer
Brought to you by Global Reports
2
New products continue to fuel our global growth. Sales of new
products were strong in every Colgate region. Of our total $9.1 billion sales in
1999, over $3.2 billion, or 35 percent, came from products introduced during
the past five years alone. We expect this strong momentum, fueled by our
active new product program and greater advertising support, to continue.
For our most promising new products, we have accelerated our expansion
by establishing new product centers in Europe, Latin America, North America
and Asia. These dedicated groups interact on a pan-regional basis, as well as
globally, to transfer our new product successes from one division to all regions.
For example, following the huge success of fragranced Ajax Fête des Fleurs
cleaners across Europe in 1997/98, we expanded the product line into both
Latin America and Asia in 1999. Today, 72 Colgate countries sell Ajax Fête des
Fleurs, and this vigorous brand continues on its growth trajectory.
In liquid hand soap, we successfully leveraged Colgate’s North American
leadership of this highly profitable product segment to launch into new regions.
Using the same packaging and formulations that have made our Softsoap liquid
soap brand Number One domestically, Colgate-U.S. began manufacturing liq-
uid hand soap for Mexico, under the powerful Palmolive brand name. Newly
introduced in mid-1998, Palmolive liquid hand soap has helped take Colgate-
Mexico to 41 percent of the market.
We also expanded our innovative 3-D pump designs for the Softsoap
Aquarium Series, developed in the U.S., into both Europe and Latin America.
Here again, we used the Palmolive global brand name, taking advantage of its
strong drawing power. The result: Palmolive Aquarium is winning incremental
market share in important markets.
Accelerating new product activity at Hill’s Pet Nutrition fueled strong 8 per-
cent volume growth and record profits. The unsurpassed world leader in pre-
mium pet food, Hill’s strengthened its Number One position with veterinarians
through technology-driven new products and clinic education programs.
Achieving market leadership has a powerful motivating effecton Colgate people everywhere. We understand the importance of
rewarding and communicating successes throughout our entire global organi-
zation. We start by clearly defining our brand leadership targets, by country and
by product. Where Colgate leads a category, we push to further increase our
lead. And where we rank a strong Number Two or Three, we work hard to
improve our position and achieve leadership. This culture of striving to be the
best has helped elevate Colgate to global leadership positions in many of the
most important segments in which we compete: toothpaste, male stick deodor-
ants, family value shampoos, liquid soaps, all-purpose cleaners, dishwashing
liquids and premium pet foods. We won’t stop with those.
Colgate’s financial strategy again expands profit margins. We
adhere to the simple but powerful financial strategy of increasing profit margins
and reducing overhead, year after year. The return generated is reinvested in
growth-fueling activities, including R&D, technology and advertising. In 1999,
Colgate’s gross profit margin increased by 150 basis points to 53.7 percent, and
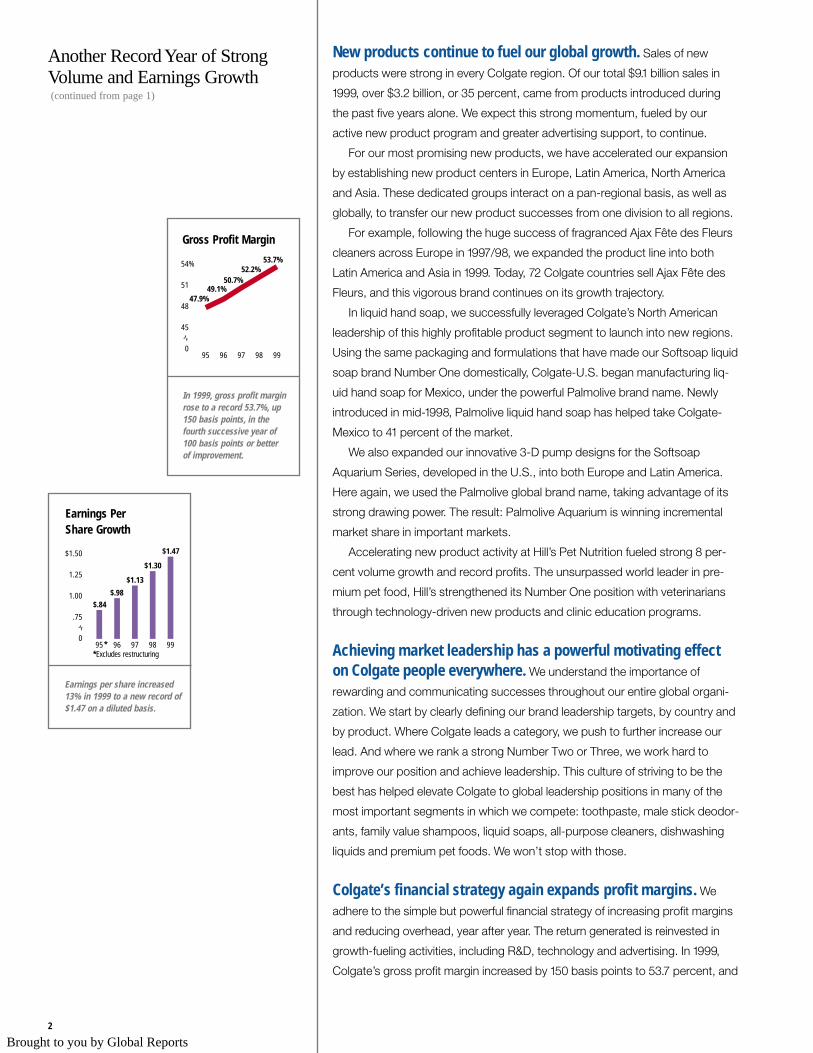
53.7%52.2%
50.7%49.1%
47.9%
0
45
48
51
54%
9998979695
$1.47
$1.30
$1.13
$.98
$.84
0
.75
1.00
1.25
$1.50
9998979695**Excludes restructuring
In 1999, gross profit marginrose to a record 53.7%, up150 basis points, in thefourth successive year of100 basis points or betterof improvement.
Another Record Year of StrongVolume and Earnings Growth(continued from page 1)
Earnings per share increased13% in 1999 to a new record of$1.47 on a diluted basis.
Earnings Per Share Growth
Gross Profit Margin
Brought to you by Global Reports
operating profit margin rose 130 points to 17.2 percent. By comparison, in 1984,
when this strategy was first implemented, gross profit margin and operating
margin were 39.2 percent and 5.6 percent, respectively. Driving these significant
improvements, especially in the developed world, have been our ongoing efforts
to streamline all aspects of the supply chain and reap savings from new tech-
nologies, such as enterprise-wide integrated software.
By applying these same principles, we expect to achieve significant future
savings in the high-growth markets of the developing world. Imple-
mentation of enterprise-wide software in Asia and several Latin
American countries has achieved excellent initial payoff. Importantly,
we are only beginning to reap the full benefits. In all regions, we
expect to see increasing benefits from information technology,
including margin expansion and more valuable information to
drive greater profitability.
The more we streamline, the more opportunities Colgate
people uncover. Colgate’s ongoing strategy to take costs out
of the supply chain helped increase the return on capital to
22.8 percent, up from 20.4 percent in 1998. Cash flow from
operations increased to a record $1.3 billion, representing
14.2 percent of sales, up from 13.1 percent of sales in 1998.
Strong cash generation has enabled the Company to
maintain our targeted debt-to-capital level, while increasing
dividends and repurchasing stock as appropriate.
We are invigorated as we approach Colgate’s third century ofgrowth and expansion. We fully expect that Colgate people will continue
our long record of performance momentum in 2000 and beyond. Highlighted on
pages 5-17 are the 1999 achievements of Colgate people who along with 37,000
others are creating shareholder value. Together they represent just some of the
exceptional achievements of countless high performers building value through
sales, marketing, new products, research, finance, supply chain, training and
technology. We encourage you to read about them.
Thank you.
Reuben Mark
Chairman and Chief Executive Officer
William S. Shanahan
President and Chief Operating Officer
3
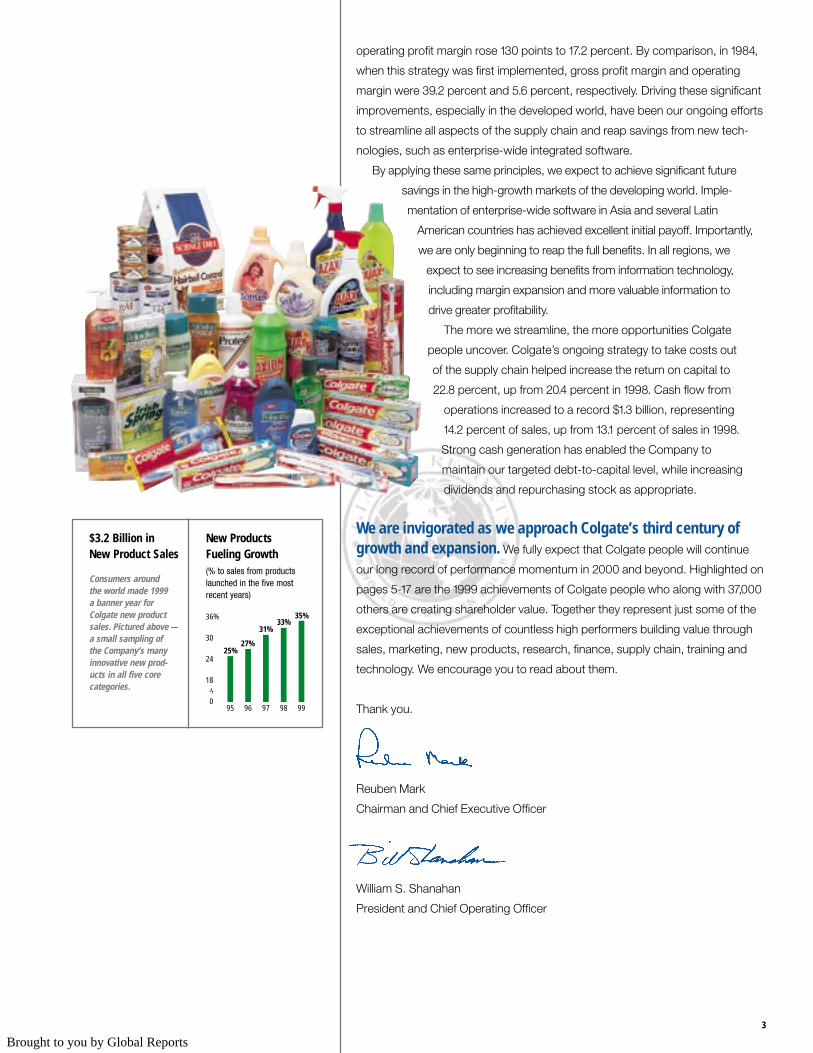
$3.2 Billion in New Product Sales
Consumers around the world made 1999 a banner year forColgate new productsales. Pictured above —a small sampling of the Company’s manyinnovative new prod-ucts in all five core categories.
35%33%
31%
27%25%
0
18
24
30
36%
9998979695
New Products Fueling Growth(% to sales from products launched in the five mostrecent years)
Brought to you by Global Reports
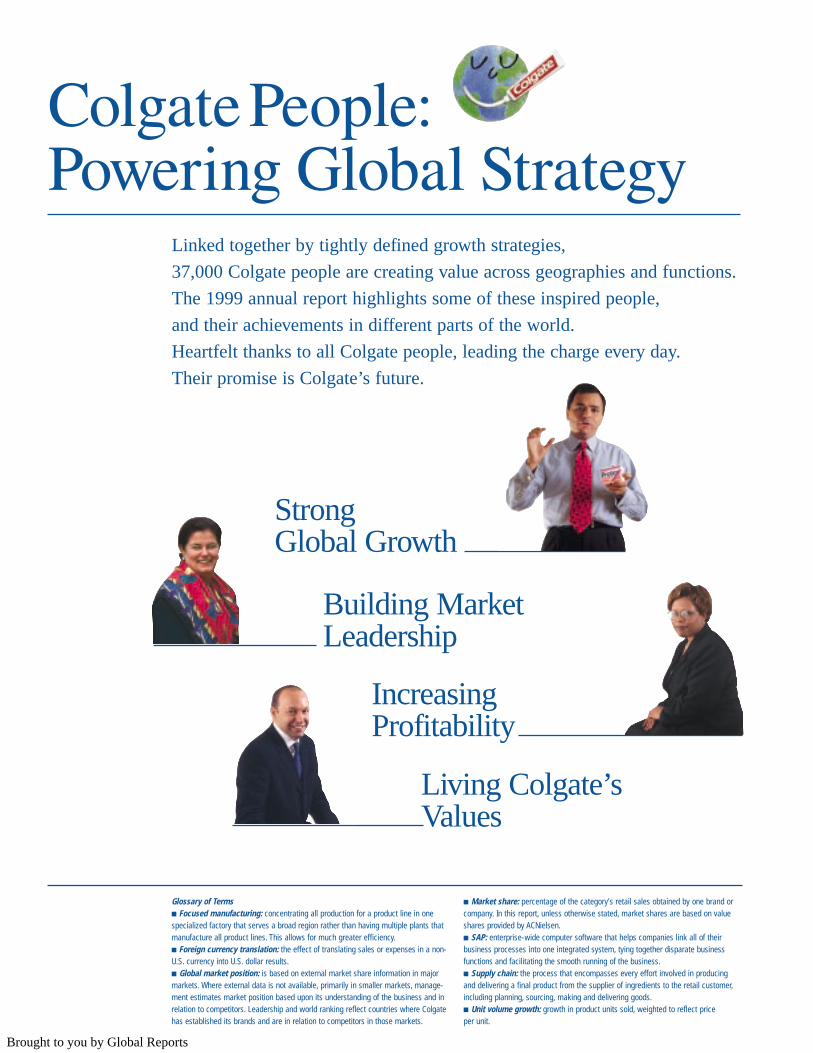
ColgatePeople:Powering Global Strategy
Linked together by tightly defined growth strategies,
37,000 Colgate people are creating value across geographies and functions.
The 1999 annual report highlights some of these inspired people,
and their achievements in different parts of the world.
Heartfelt thanks to all Colgate people, leading the charge every day.
Their promise is Colgate’s future.
Glossary of Terms■ Focused manufacturing: concentrating all production for a product line in onespecialized factory that serves a broad region rather than having multiple plants thatmanufacture all product lines. This allows for much greater efficiency.■ Foreign currency translation: the effect of translating sales or expenses in a non-U.S. currency into U.S. dollar results.■ Global market position: is based on external market share information in majormarkets. Where external data is not available, primarily in smaller markets, manage-ment estimates market position based upon its understanding of the business and inrelation to competitors. Leadership and world ranking reflect countries where Colgatehas established its brands and are in relation to competitors in those markets.
■ Market share: percentage of the category’s retail sales obtained by one brand orcompany. In this report, unless otherwise stated, market shares are based on valueshares provided by ACNielsen.■ SAP: enterprise-wide computer software that helps companies link all of theirbusiness processes into one integrated system, tying together disparate businessfunctions and facilitating the smooth running of the business.■ Supply chain: the process that encompasses every effort involved in producingand delivering a final product from the supplier of ingredients to the retail customer,including planning, sourcing, making and delivering goods.■ Unit volume growth: growth in product units sold, weighted to reflect priceper unit.
StrongGlobal Growth
Building Market Leadership
IncreasingProfitability
Living Colgate’s Values
Brought to you by Global Reports
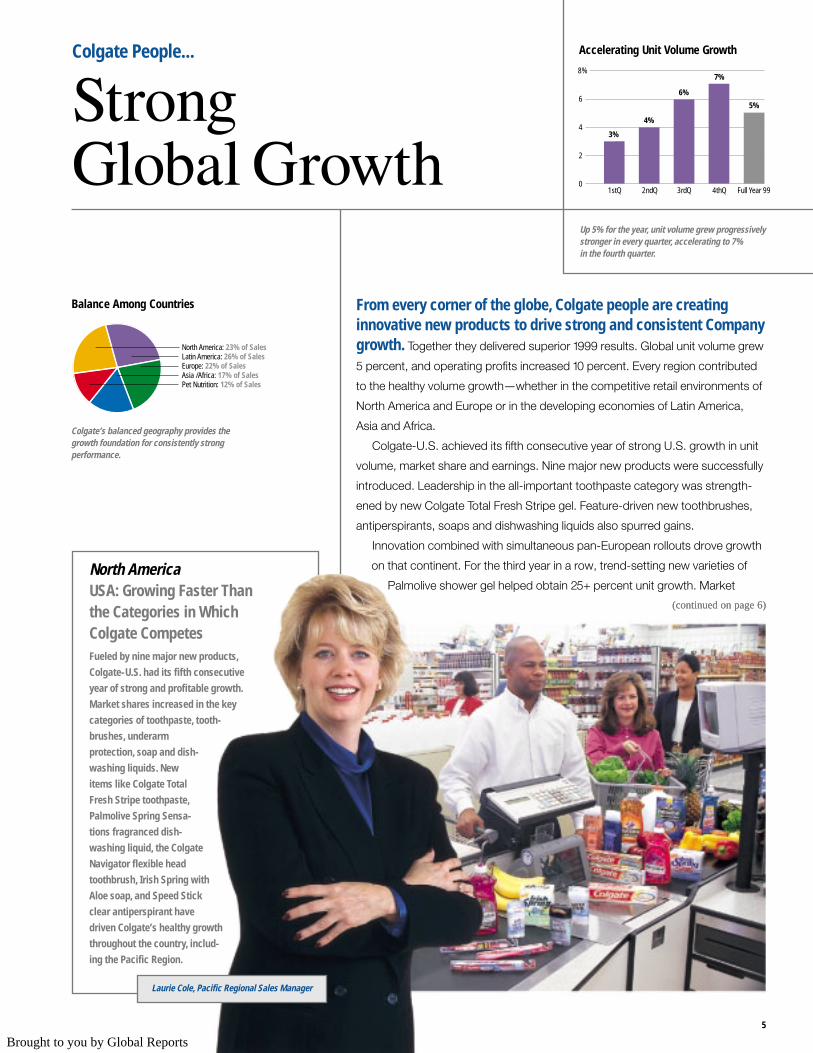
From every corner of the globe, Colgate people are creatinginnovative new products to drive strong and consistent Companygrowth. Together they delivered superior 1999 results. Global unit volume grew
5 percent, and operating profits increased 10 percent. Every region contributed
to the healthy volume growth—whether in the competitive retail environments of
North America and Europe or in the developing economies of Latin America,
Asia and Africa.
Colgate-U.S. achieved its fifth consecutive year of strong U.S. growth in unit
volume, market share and earnings. Nine major new products were successfully
introduced. Leadership in the all-important toothpaste category was strength-
ened by new Colgate Total Fresh Stripe gel. Feature-driven new toothbrushes,
antiperspirants, soaps and dishwashing liquids also spurred gains.
Innovation combined with simultaneous pan-European rollouts drove growth
on that continent. For the third year in a row, trend-setting new varieties of
Palmolive shower gel helped obtain 25+ percent unit growth. Market
Colgate People...
StrongGlobal Growth
Balance Among Countries
North America: 23% of SalesLatin America: 26% of SalesEurope: 22% of SalesAsia /Africa: 17% of SalesPet Nutrition: 12% of Sales
Colgate’s balanced geography provides thegrowth foundation for consistently strongperformance.
Accelerating Unit Volume Growth
Up 5% for the year, unit volume grew progressivelystronger in every quarter, accelerating to 7%in the fourth quarter.
0
2
4
6
8%
3rdQ2ndQ1stQ Full Year 994thQ
3%
4%
6%
7%
5%
(continued on page 6)(continued on page 6)
5
North America USA: Growing Faster Thanthe Categories in WhichColgate CompetesFueled by nine major new products,
Colgate-U.S. had its fifth consecutive
year of strong and profitable growth.
Market shares increased in the key
categories of toothpaste, tooth-
brushes, underarm
protection, soap and dish-
washing liquids. New
items like Colgate Total
Fresh Stripe toothpaste,
Palmolive Spring Sensa-
tions fragranced dish-
washing liquid, the Colgate
Navigator flexible head
toothbrush, Irish Spring with
Aloe soap, and Speed Stick
clear antiperspirant have
driven Colgate’s healthy growth
throughout the country, includ-
ing the Pacific Region.
Laurie Cole, Pacific Regional Sales Manager
Brought to you by Global Reports
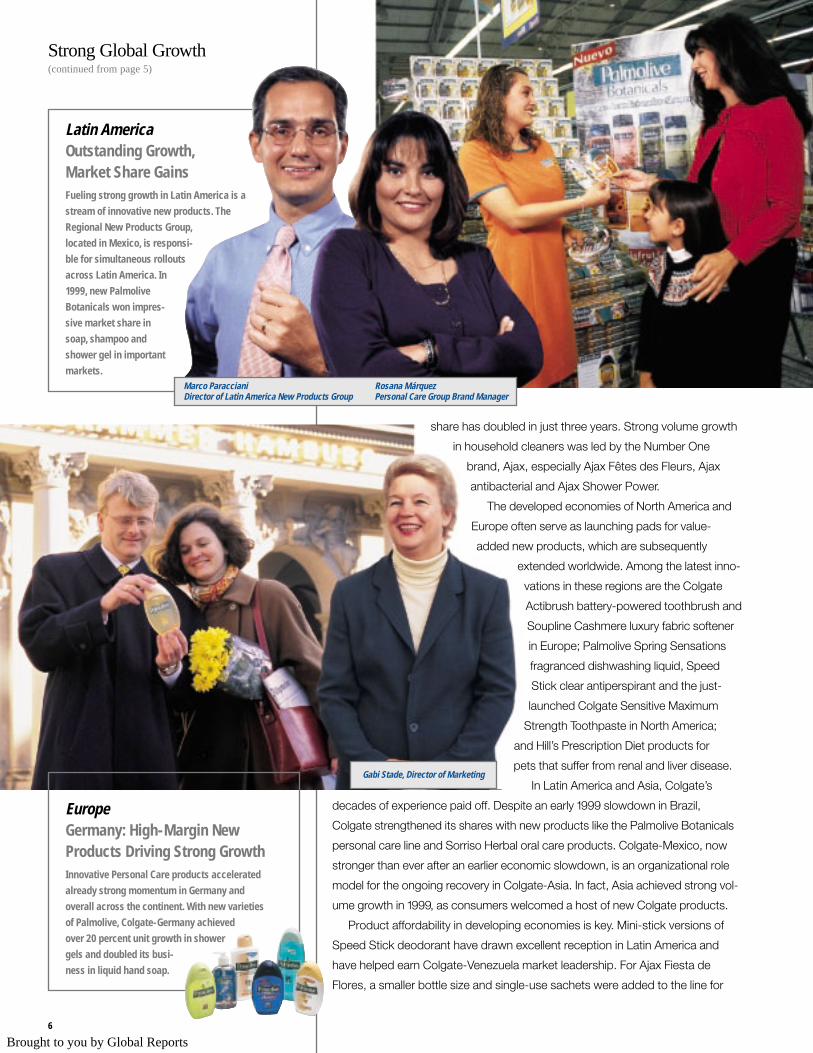
Latin America Outstanding Growth,Market Share GainsFueling strong growth in Latin America is a
stream of innovative new products. The
Regional New Products Group,
located in Mexico, is responsi-
ble for simultaneous rollouts
across Latin America. In
1999, new Palmolive
Botanicals won impres-
sive market share in
soap, shampoo and
shower gel in important
markets.
share has doubled in just three years. Strong volume growth
in household cleaners was led by the Number One
brand, Ajax, especially Ajax Fêtes des Fleurs, Ajax
antibacterial and Ajax Shower Power.
The developed economies of North America and
Europe often serve as launching pads for value-
added new products, which are subsequently
extended worldwide. Among the latest inno-
vations in these regions are the Colgate
Actibrush battery-powered toothbrush and
Soupline Cashmere luxury fabric softener
in Europe; Palmolive Spring Sensations
fragranced dishwashing liquid, Speed
Stick clear antiperspirant and the just-
launched Colgate Sensitive Maximum
Strength Toothpaste in North America;
and Hill’s Prescription Diet products for
pets that suffer from renal and liver disease.
In Latin America and Asia, Colgate’s
decades of experience paid off. Despite an early 1999 slowdown in Brazil,
Colgate strengthened its shares with new products like the Palmolive Botanicals
personal care line and Sorriso Herbal oral care products. Colgate-Mexico, now
stronger than ever after an earlier economic slowdown, is an organizational role
model for the ongoing recovery in Colgate-Asia. In fact, Asia achieved strong vol-
ume growth in 1999, as consumers welcomed a host of new Colgate products.
Product affordability in developing economies is key. Mini-stick versions of
Speed Stick deodorant have drawn excellent reception in Latin America and
have helped earn Colgate-Venezuela market leadership. For Ajax Fiesta de
Flores, a smaller bottle size and single-use sachets were added to the line for
6
Marco Paracciani Rosana MárquezDirector of Latin America New Products Group Personal Care Group Brand Manager
EuropeGermany: High-Margin NewProducts Driving Strong GrowthInnovative Personal Care products accelerated
already strong momentum in Germany and
overall across the continent. With new varieties
of Palmolive, Colgate-Germany achieved
over 20 percent unit growth in shower
gels and doubled its busi-
ness in liquid hand soap.
Strong Global Growth(continued from page 5)
Gabi Stade, Director of Marketing
Brought to you by Global Reports
the Latin American rollout. In India, low-cost
sachets of Colgate toothpowder served to
broaden consumption.
Impactful marketing programs go across
countries. Colgate Fresh Confidence, a new
gel that provides long-lasting fresh breath, communicates the same powerful
message to young adults throughout Latin America. Likewise, the germ-fighting
properties of Protex personal care products are highlighted in all of the 47 coun-
tries where this powerful brand is sold. Excellent response is fueling growth in
new Protex markets, including China, Vietnam and South Africa.
With distribution in 218 countries and territories, Colgate continues to expand
its global infrastructure. Significant opportunities remain in emerging markets
such as China and Vietnam. With knowledge gained during more than 70 years
of operating globally, Colgate people are creating new ways to accelerate global
growth and fuel Colgate performance.
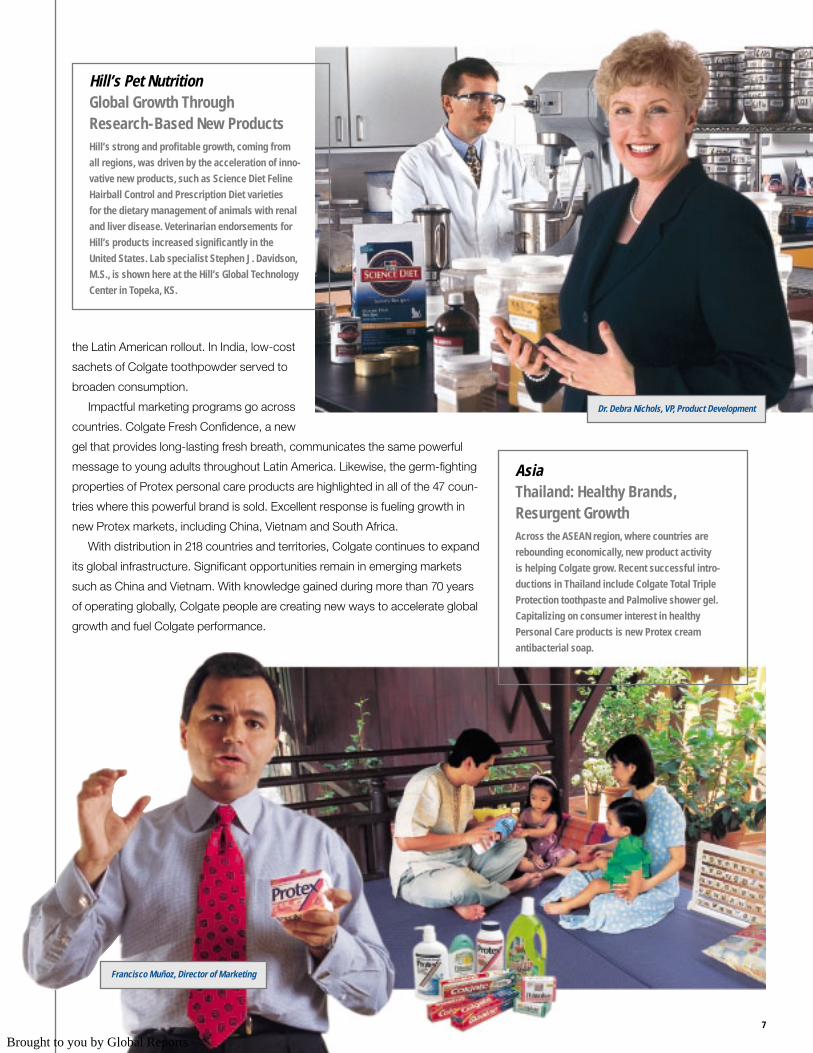
Hill’s Pet NutritionGlobal Growth Through Research-Based New ProductsHill’s strong and profitable growth, coming from
all regions, was driven by the acceleration of inno-
vative new products, such as Science Diet Feline
Hairball Control and Prescription Diet varieties
for the dietary management of animals with renal
and liver disease. Veterinarian endorsements for
Hill’s products increased significantly in the
United States. Lab specialist Stephen J. Davidson,
M.S., is shown here at the Hill’s Global Technology
Center in Topeka, KS.
Dr. Debra Nichols, VP, Product Development
AsiaThailand: Healthy Brands,Resurgent GrowthAcross the ASEAN region, where countries are
rebounding economically, new product activity
is helping Colgate grow. Recent successful intro-
ductions in Thailand include Colgate Total Triple
Protection toothpaste and Palmolive shower gel.
Capitalizing on consumer interest in healthy
Personal Care products is new Protex cream
antibacterial soap.
7
Francisco Muñoz, Director of Marketing
Brought to you by Global Reports
8
Colgate People...
Building MarketLeadership
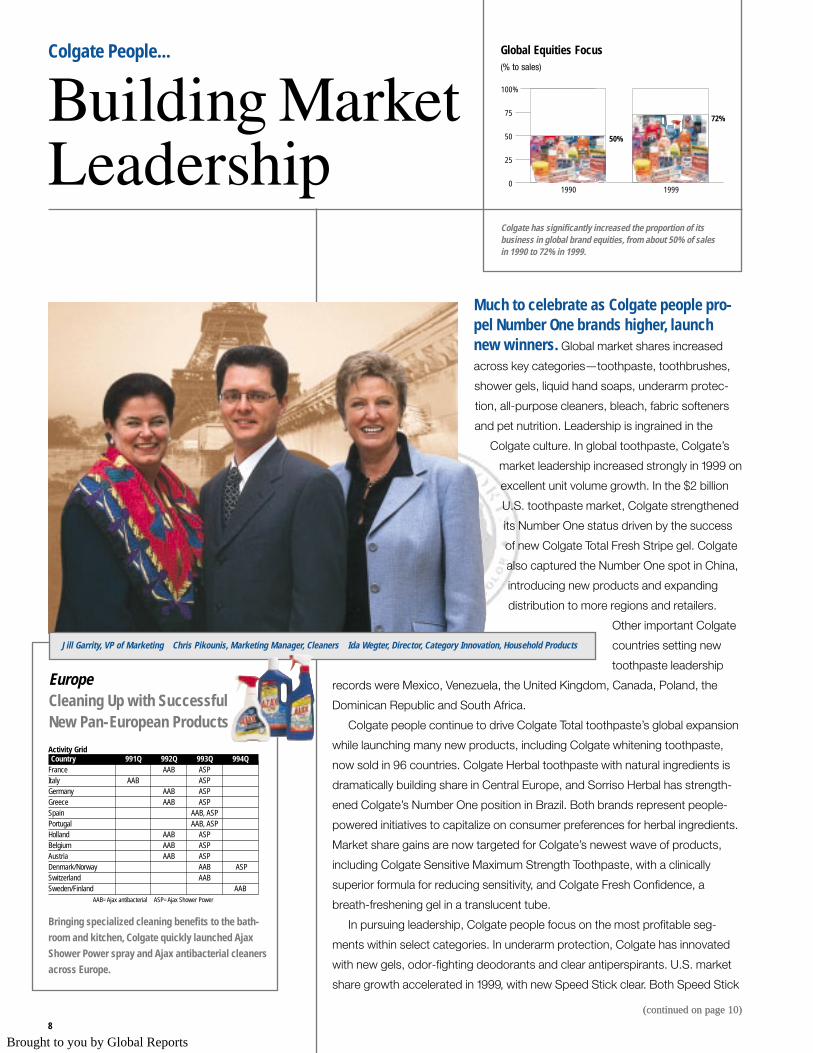
EuropeCleaning Up with Successful New Pan-European Products
Bringing specialized cleaning benefits to the bath-
room and kitchen, Colgate quickly launched Ajax
Shower Power spray and Ajax antibacterial cleaners
across Europe.
Activity GridCountry 991Q 992Q 993Q 994Q
France AAB ASPItaly AAB ASPGermany AAB ASPGreece AAB ASPSpain AAB, ASP Portugal AAB, ASP Holland AAB ASPBelgium AAB ASPAustria AAB ASPDenmark/Norway AAB ASP Switzerland AABSweden/Finland AAB
AAB=Ajax antibacterial ASP=Ajax Shower Power
Colgate has significantly increased the proportion of itsbusiness in global brand equities, from about 50% of salesin 1990 to 72% in 1999.
Global Equities Focus(% to sales)
0
25
50
75
100%
19991990
50%
72%
(continued on page 10)(continued on page 10)
Much to celebrate as Colgate people pro-pel Number One brands higher, launchnew winners. Global market shares increased
across key categories—toothpaste, toothbrushes,
shower gels, liquid hand soaps, underarm protec-
tion, all-purpose cleaners, bleach, fabric softeners
and pet nutrition. Leadership is ingrained in the
Colgate culture. In global toothpaste, Colgate’s
market leadership increased strongly in 1999 on
excellent unit volume growth. In the $2 billion
U.S. toothpaste market, Colgate strengthened
its Number One status driven by the success
of new Colgate Total Fresh Stripe gel. Colgate
also captured the Number One spot in China,
introducing new products and expanding
distribution to more regions and retailers.
Other important Colgate
countries setting new
toothpaste leadership
records were Mexico, Venezuela, the United Kingdom, Canada, Poland, the
Dominican Republic and South Africa.
Colgate people continue to drive Colgate Total toothpaste’s global expansion
while launching many new products, including Colgate whitening toothpaste,
now sold in 96 countries. Colgate Herbal toothpaste with natural ingredients is
dramatically building share in Central Europe, and Sorriso Herbal has strength-
ened Colgate’s Number One position in Brazil. Both brands represent people-
powered initiatives to capitalize on consumer preferences for herbal ingredients.
Market share gains are now targeted for Colgate’s newest wave of products,
including Colgate Sensitive Maximum Strength Toothpaste, with a clinically
superior formula for reducing sensitivity, and Colgate Fresh Confidence, a
breath-freshening gel in a translucent tube.
In pursuing leadership, Colgate people focus on the most profitable seg-
ments within select categories. In underarm protection, Colgate has innovated
with new gels, odor-fighting deodorants and clear antiperspirants. U.S. market
share growth accelerated in 1999, with new Speed Stick clear. Both Speed Stick
Jill Garrity, VP of Marketing Chris Pikounis, Marketing Manager, Cleaners Ida Wegter, Director, Category Innovation, Household Products
Brought to you by Global Reports
9
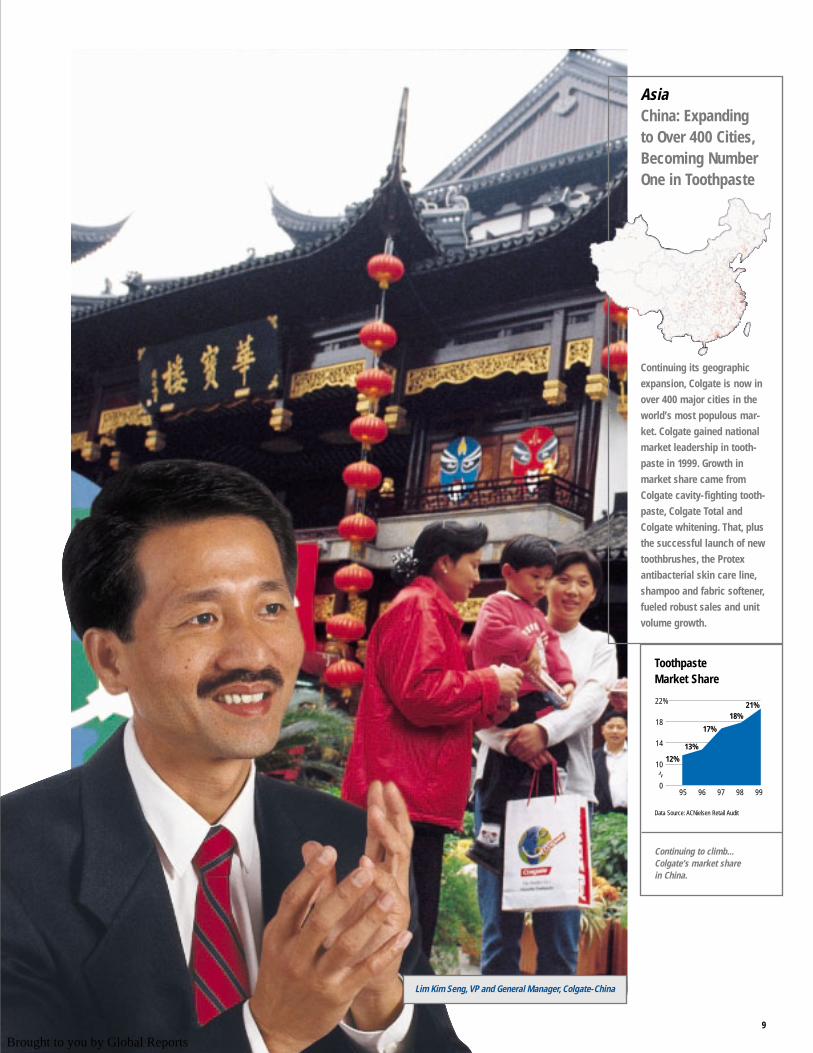
AsiaChina: Expandingto Over 400 Cities,Becoming NumberOne in Toothpaste
Continuing its geographic
expansion, Colgate is now in
over 400 major cities in the
world’s most populous mar-
ket. Colgate gained national
market leadership in tooth-
paste in 1999. Growth in
market share came from
Colgate cavity-fighting tooth-
paste, Colgate Total and
Colgate whitening. That, plus
the successful launch of new
toothbrushes, the Protex
antibacterial skin care line,
shampoo and fabric softener,
fueled robust sales and unit
volume growth.
Continuing to climb...Colgate’s market sharein China.
Lim Kim Seng, VP and General Manager, Colgate-China
Toothpaste Market Share
Data Source: ACNielsen Retail Audit
0
10
14
18
22%
9796 999895
17%
21%18%
13%
12%
Brought to you by Global Reports
10
and Lady Speed Stick were expanded into Australia. New record highs were set
in Mexico, Chile and Colombia, while new Number One positions were achieved
in Venezuela and Canada, as of the fourth quarter.
Colgate’s biggest product successes are rapidly transferred to new regions.
Palmolive shower gels, which first drove market share increases exceeding
25 percent in Western Europe, also expanded shares in Central Europe and
Latin America. Colgate developers drew on experience with Ajax Fête des
Fleurs cleaners in Europe for the U.S. launch of Palmolive Spring Sensations
dishwashing liquid. The sensorial fragrances and vibrant colors of this new line
helped drive Colgate-U.S. dishwashing market share to over 40 percent at
year-end. Fragrance creativity supports Colgate’s profitable growth in fabric
softeners as well. First introduced in Europe, the peach- and vanilla-fragranced
softeners have been expanded to the
Americas, Asia and Africa.
Colgate’s consistent focus on its powerful
global brands brings rapid consumer accep-
tance. For example, conveying the same
message in all 72 markets—the overwhelm-
ing first choice of veterinarians globally—Hill’s
Pet Nutrition is now recognized as the global
leader in specialty pet foods. Unit volume
grew 8 percent in 1999 as Hill’s introduced
new products and expanded geographic
distribution.
Colgate people commit to Number
One positions. Implementing proven
leadership strategies, these dedicated
and talented people continue to build the
Company’s success.
Building Market Leadership(continued from page 8)
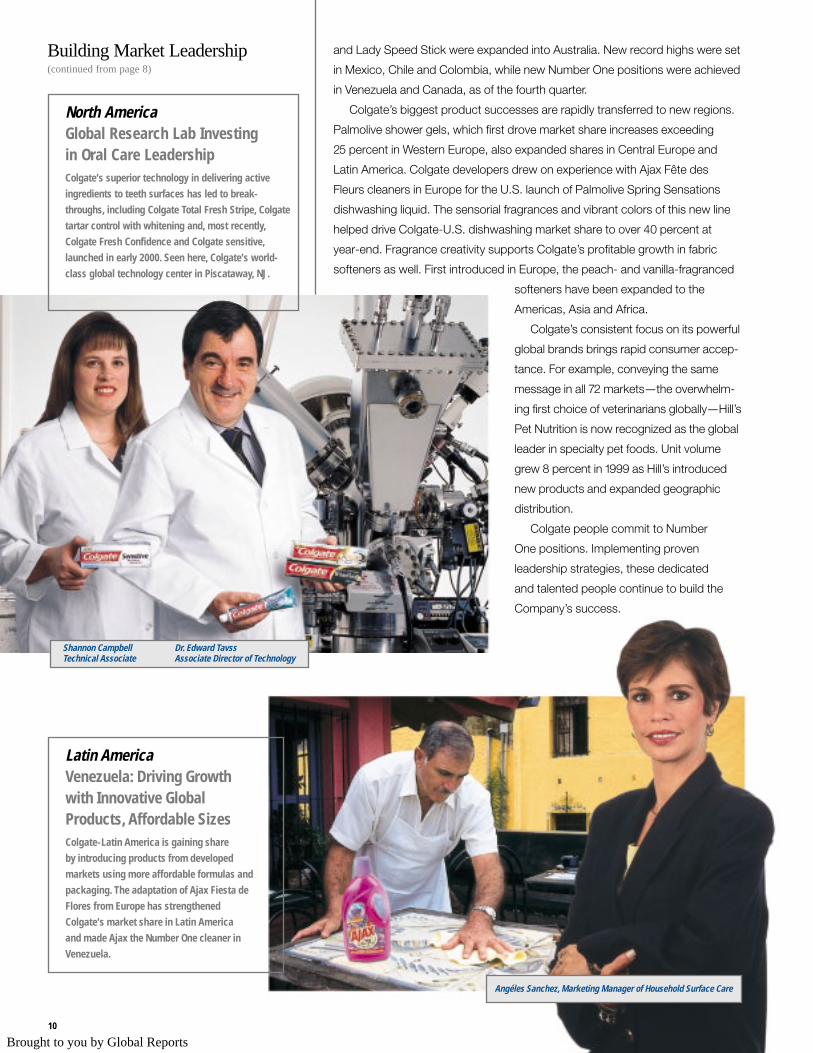
Latin AmericaVenezuela: Driving Growth with Innovative Global Products, Affordable SizesColgate-Latin America is gaining share
by introducing products from developed
markets using more affordable formulas and
packaging. The adaptation of Ajax Fiesta de
Flores from Europe has strengthened
Colgate’s market share in Latin America
and made Ajax the Number One cleaner in
Venezuela.
Angéles Sanchez, Marketing Manager of Household Surface Care
Shannon Campbell Dr. Edward TavssTechnical Associate Associate Director of Technology
North AmericaGlobal Research Lab Investing in Oral Care LeadershipColgate’s superior technology in delivering active
ingredients to teeth surfaces has led to break-
throughs, including Colgate Total Fresh Stripe, Colgate
tartar control with whitening and, most recently,
Colgate Fresh Confidence and Colgate sensitive,
launched in early 2000. Seen here, Colgate’s world-
class global technology center in Piscataway, NJ.
Brought to you by Global Reports

11
Steve Marton, VP, Hill’s-Europe
AfricaRed Storm Promotion Builds Toothpaste ShareOn April 12, 1999, scores of Colgate people in red shirts fanned out
across Africa and the Middle East in a coordinated marketing and sales
program to relaunch Colgate toothpaste. Its many consumer, professional
and trade activities helped build Colgate toothpaste share and produced the
highest ever share in South Africa. Pictured here is the Colgate-Kenya team.
Mouhamadou Ndiaye, Director of Marketing for Senegal and a member of the multicountry team for Red Storm
Hill’s Pet NutritionEurope: Perfect Shop/PerfectClinic Program Drives GrowthOutside and throughout stores and clinics,
Hill’s Perfect Shop/Perfect Clinic program
gives pet owners in Europe all the needed
information to choose Hill’s. Signage and
displays communicate the brand’s superior
nutrition, great taste, affordability and
veterinarian endorsements. Across Europe, this
comprehensive merchandising program
has improved shelf space,
image and market
shares for Hill’s.
Brought to you by Global Reports
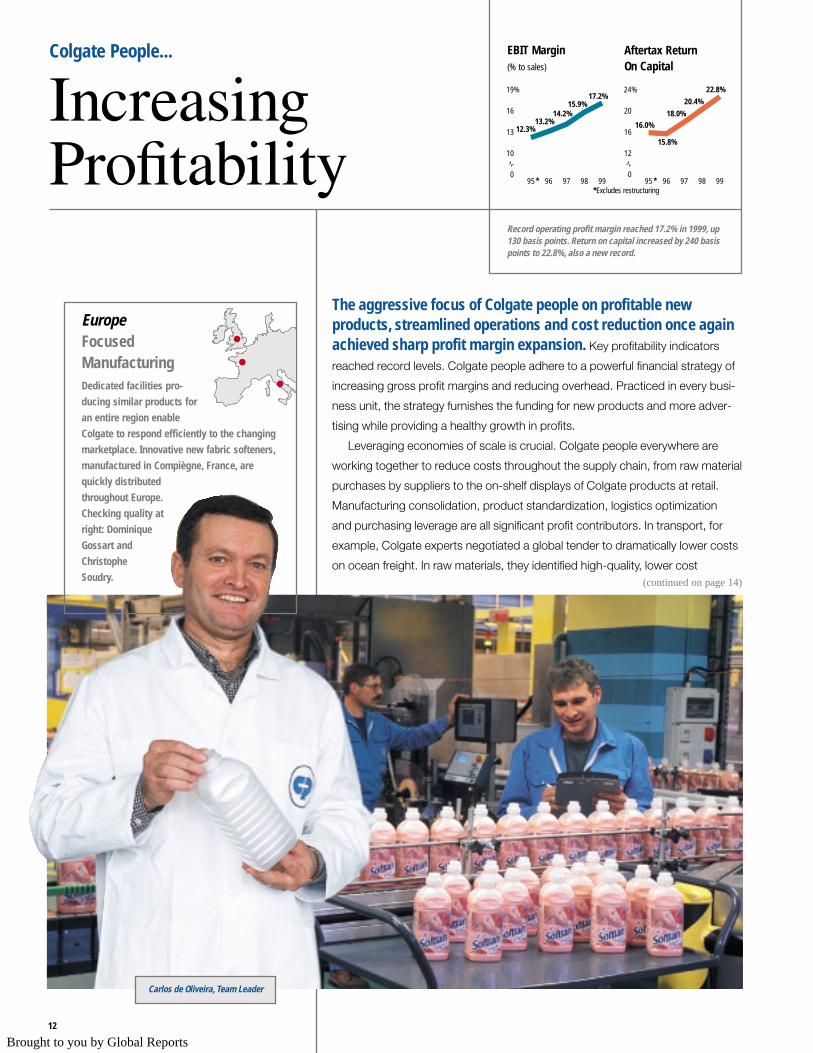
The aggressive focus of Colgate people on profitable newproducts, streamlined operations and cost reduction once againachieved sharp profit margin expansion. Key profitability indicators
reached record levels. Colgate people adhere to a powerful financial strategy of
increasing gross profit margins and reducing overhead. Practiced in every busi-
ness unit, the strategy furnishes the funding for new products and more adver-
tising while providing a healthy growth in profits.
Leveraging economies of scale is crucial. Colgate people everywhere are
working together to reduce costs throughout the supply chain, from raw material
purchases by suppliers to the on-shelf displays of Colgate products at retail.
Manufacturing consolidation, product standardization, logistics optimization
and purchasing leverage are all significant profit contributors. In transport, for
example, Colgate experts negotiated a global tender to dramatically lower costs
on ocean freight. In raw materials, they identified high-quality, lower cost
12
Colgate People...
IncreasingProfitability
Aftertax Return On Capital
EBIT Margin(% to sales)
17.2%15.9%
14.2%13.2%
12.3%
0
10
13
16
19%
9998979695 *
22.8%
20.4%
18.0%
15.8%
16.0%
0
12
16
20
24%
9998979695 **Excludes restructuring
Record operating profit margin reached 17.2% in 1999, up130 basis points. Return on capital increased by 240 basispoints to 22.8%, also a new record.
(continued on page 14)
EuropeFocusedManufacturingDedicated facilities pro-
ducing similar products for
an entire region enable
Colgate to respond efficiently to the changing
marketplace. Innovative new fabric softeners,
manufactured in Compiègne, France, are
quickly distributed
throughout Europe.
Checking quality at
right: Dominique
Gossart and
Christophe
Soudry.
Carlos de Oliveira, Team Leader
Brought to you by Global Reports
13
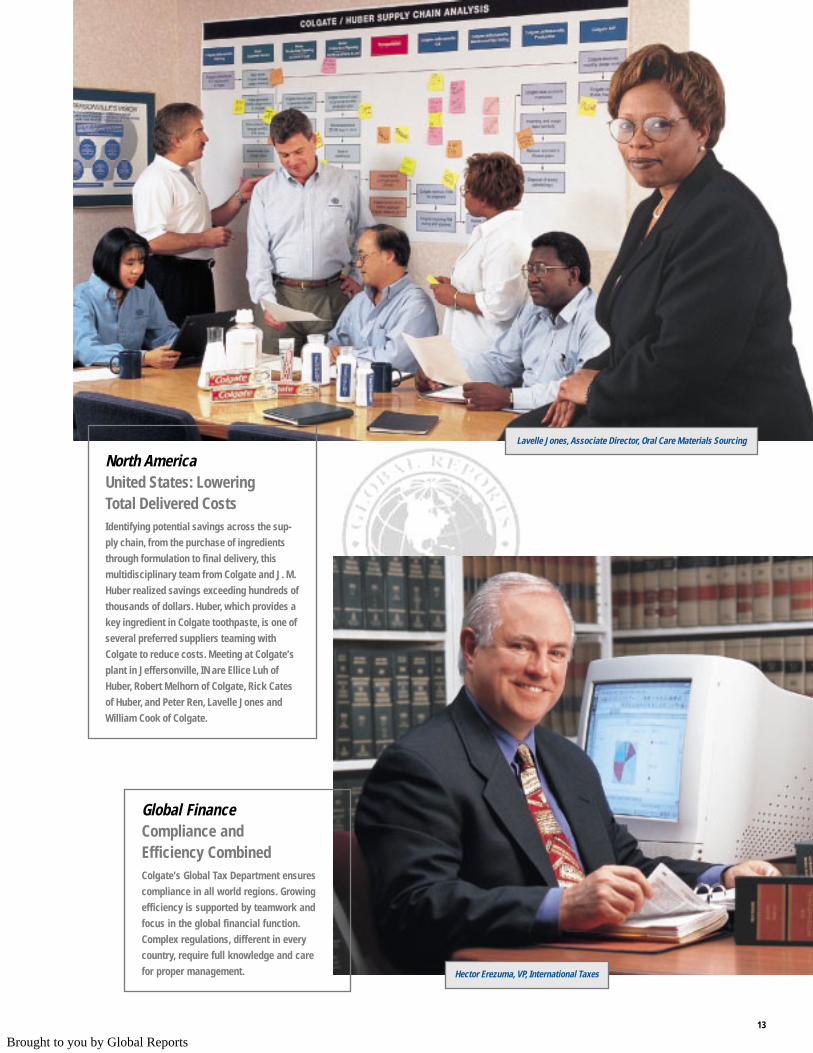
Hector Erezuma, VP, International Taxes
Lavelle Jones, Associate Director, Oral Care Materials Sourcing
North AmericaUnited States: Lowering Total Delivered CostsIdentifying potential savings across the sup-
ply chain, from the purchase of ingredients
through formulation to final delivery, this
multidisciplinary team from Colgate and J. M.
Huber realized savings exceeding hundreds of
thousands of dollars. Huber, which provides a
key ingredient in Colgate toothpaste, is one of
several preferred suppliers teaming with
Colgate to reduce costs. Meeting at Colgate’s
plant in Jeffersonville, IN are Ellice Luh of
Huber, Robert Melhorn of Colgate, Rick Cates
of Huber, and Peter Ren, Lavelle Jones and
William Cook of Colgate.
Global FinanceCompliance and Efficiency CombinedColgate’s Global Tax Department ensures
compliance in all world regions. Growing
efficiency is supported by teamwork and
focus in the global financial function.
Complex regulations, different in every
country, require full knowledge and care
for proper management.
Brought to you by Global Reports
14
Increasing Profitability(continued from page 12)
sources in China and India. And in new product development, Colgate scientists
are pooling research with preferred suppliers.
In technology, early strategic investments continue to produce big cost
savings. Colgate’s realized savings in North America from integrated SAP soft-
ware, which optimizes all aspects of sales, inventory, manufacturing, distribution
and finance, have far exceeded goals. And Colgate’s largest domestic cus-
tomers have benefited by a one-third reduction in average order-to-delivery time
over the past few years. Colgate-Europe and Hill’s are enjoying these same
technology-driven savings. Today, nearly 75 percent of Colgate’s operations
are supported by SAP. Within two years, the figure is expected to increase to
over 90 percent. Benefits will continue to climb, to include customer relation-
ships, demand forecasting and e-commerce systems. For example, Colgate is
collaborating with key trade partners, such as Wal-Mart and KMart, to link in-
store information to achieve better forecasting.
These initiatives contributed to Colgate’s record $1.3 billion cash flow in 1999.
Return on capital increased to 22.8 percent, up from 20.4 percent in 1998 and
15.8 percent just three years ago. Worldwide, approximately 60 percent of
Colgate’s capital spending budget is directed to savings projects. These proj-
ects, on average, have returned 40 percent aftertax annually. In 1999, they
ranged from in-house manufacturing of toothpaste tube laminate in Latin
America to regional consolidation of soap production for the ASEAN countries.
All over the world, Colgate people are finding new and better ways to create,
produce and distribute powerful global brands.
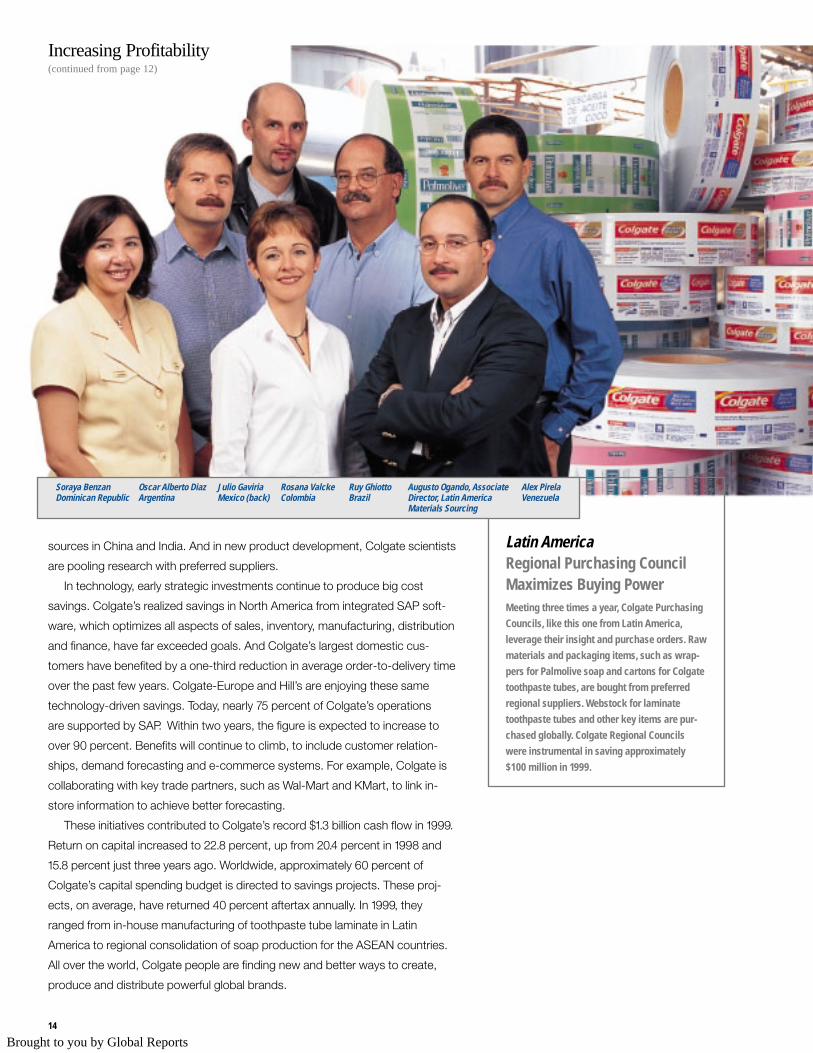
Latin AmericaRegional Purchasing CouncilMaximizes Buying PowerMeeting three times a year, Colgate Purchasing
Councils, like this one from Latin America,
leverage their insight and purchase orders. Raw
materials and packaging items, such as wrap-
pers for Palmolive soap and cartons for Colgate
toothpaste tubes, are bought from preferred
regional suppliers. Webstock for laminate
toothpaste tubes and other key items are pur-
chased globally. Colgate Regional Councils
were instrumental in saving approximately
$100 million in 1999.
Soraya Benzan Oscar Alberto Diaz Julio Gaviria Rosana Valcke Ruy Ghiotto Augusto Ogando, Associate Alex PirelaDominican Republic Argentina Mexico (back) Colombia Brazil Director, Latin America Venezuela
Materials Sourcing
Brought to you by Global Reports

0
10
20
30
40
50
9998979695
37
4642
30
21
Colgate’s values are lived by 37,000 employees worldwide andguide us toward improving people’s lives, products, profitabilityand shareholder value. Our fundamental values of caring, global teamwork
and continuous improvement go hand in hand with attracting an exceptional
workforce and represent a true business advantage for Colgate.
These are but a few examples of the dedication of Colgate people:
■ Around the world, 46 million children receive oral hygiene education under
Colgate’s Bright Smiles, Bright Futures initiative.
■ More than 16,000 employee suggestions are considered each year for the
“Chairman’s You Can Make a Difference” program. The global winners receive
Colgate stock and are honored at the annual meeting.
■ All Colgate people learn about the Company’s growth goals at biannual Inter-
com meetings. Presentation materials are explained by local Colgate leaders,
and best practices are shared in discussion groups.
■ Every winter, Colgate-U.S. conducts a multiproduct promotion that donates a
portion of sales to the Starlight Foundation, an organization that makes dreams
come true for sick children.
Colgate People...
Living Colgate’s Values
Three Values Guide Colgate People:
✓Caring✓Global Teamwork✓Continuous Improvement
More and more children arebenefiting from Colgate’s oralhealth program. The number ofchildren reached has morethan doubled since 1995.
Total Number of ChildrenReached Globally(millions annually)
Nenette Sadiua, Oral Care Marketing Manager (now National Trade Marketing Manager)
AsiaPhilippines: Bright Smiles,Bright FuturesColgate’s Bright Smiles, Bright Futures program
brings oral health care and education to children
in almost 80 countries. In the Philippines, Colgate’s
oral care program has become part of that coun-
try’s nationwide school curriculum. Colgate’s part-
nerships with local groups reach children who
might not otherwise see a dental professional.
The program, including dental screening and
treatment referral, travels to the people,
often in specially equipped
Colgate vans. ✓Caring
15
Brought to you by Global Reports
16
Living Colgate’s Values(continued from page 15)
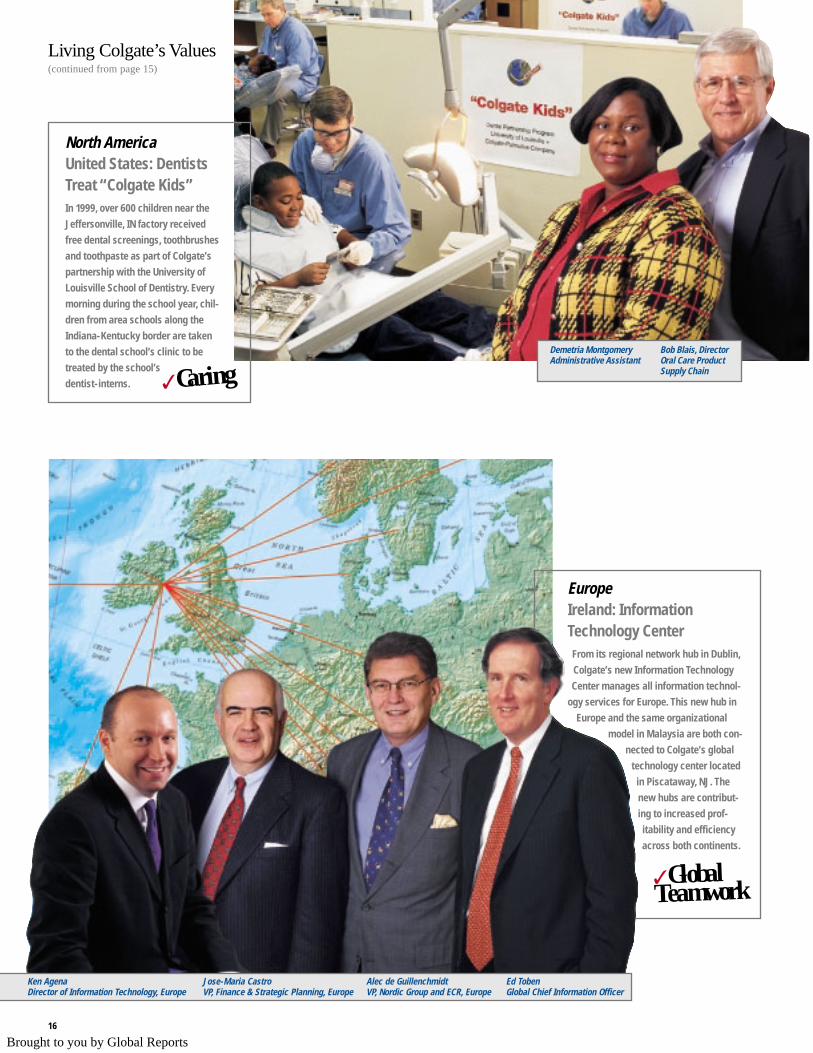
North AmericaUnited States: DentistsTreat “Colgate Kids”In 1999, over 600 children near the
Jeffersonville, IN factory received
free dental screenings, toothbrushes
and toothpaste as part of Colgate’s
partnership with the University of
Louisville School of Dentistry. Every
morning during the school year, chil-
dren from area schools along the
Indiana-Kentucky border are taken
to the dental school’s clinic to be
treated by the school’s
dentist-interns. ✓CaringDemetria Montgomery Bob Blais, DirectorAdministrative Assistant Oral Care Product
Supply Chain
rwiscanrwi
scan EuropeIreland: InformationTechnology CenterFrom its regional network hub in Dublin,
Colgate’s new Information Technology
Center manages all information technol-
ogy services for Europe. This new hub in
Europe and the same organizational
model in Malaysia are both con-
nected to Colgate’s global
technology center located
in Piscataway, NJ. The
new hubs are contribut-
ing to increased prof-
itability and efficiency
across both continents.
Ken Agena Jose-Maria Castro Alec de Guillenchmidt Ed TobenDirector of Information Technology, Europe VP, Finance & Strategic Planning, Europe VP, Nordic Group and ECR, Europe Global Chief Information Officer
✓GlobalTeamwork
Brought to you by Global Reports
17
■ Colgate-Turkiye employees reacted quickly to provide food, medicine, prod-
ucts, temporary accommodations and special children’s programs following
severe earthquakes in that country. Responding to disasters is part of how
Colgate cares for the people and the communities where it does business.
Colgate’s culture of caring is supported by a commitment to global teamwork.
Colgate people are taught to work as team members and apply their skills
in countries with diverse needs. Furthermore, Colgate people are trained to
think globally, a mind-set fostered by systematic personnel transfers from one
country to another, including more than 400 such career moves in the past
two years alone.
Global teamwork begins with broad, open communication. Dialogue takes
place at face-to-face meetings and through the internal Colgate Intranet, the
global e-mail system and videoconferencing. For example, Colgate people in
widely dispersed locations use Lotus Notes software to view proposed new
packages so that they can quickly collaborate on a design that works well every-
where. From the high-speed plant in Morristown, NJ, which supplies deodorants
to 58 countries, to the global information technology network, which has consol-
idated 75 separate data processing centers
worldwide, global teamwork is improving
profitability. Multidisciplinary teams also
work closely with Colgate’s suppliers and
retail customers to speed the supply
chain cycle.
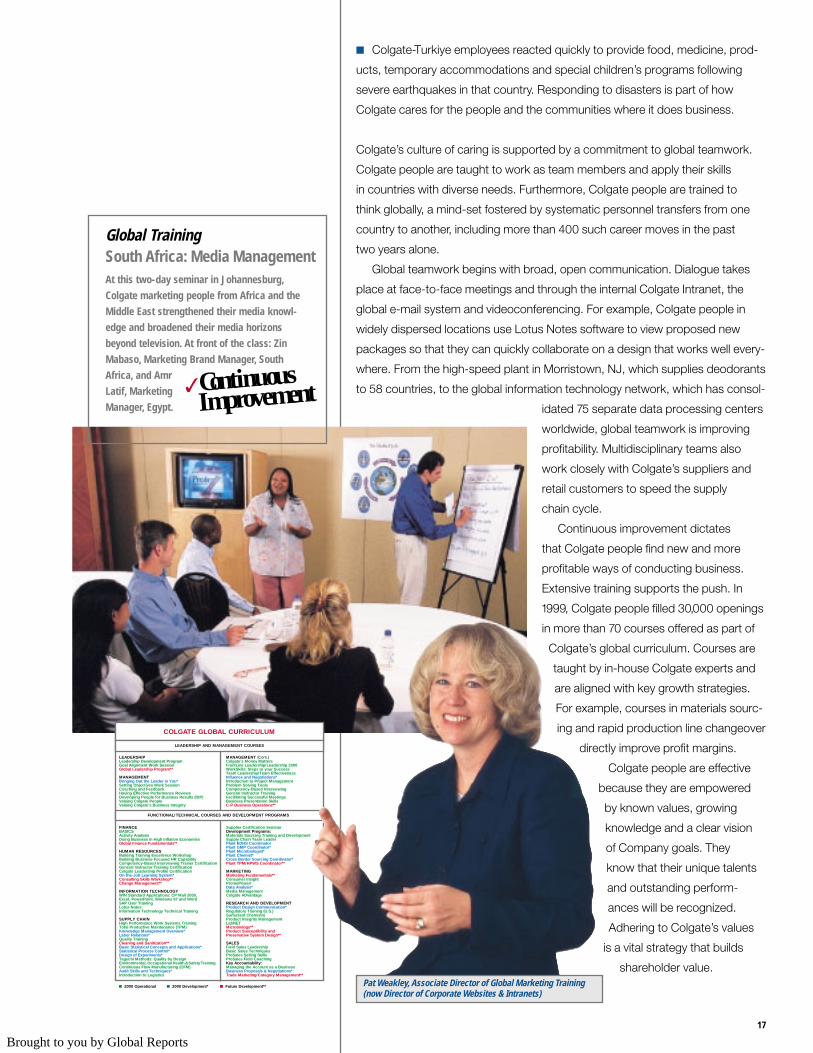
Continuous improvement dictates
that Colgate people find new and more
profitable ways of conducting business.
Extensive training supports the push. In
1999, Colgate people filled 30,000 openings
in more than 70 courses offered as part of
Colgate’s global curriculum. Courses are
taught by in-house Colgate experts and
are aligned with key growth strategies.
For example, courses in materials sourc-
ing and rapid production line changeover
directly improve profit margins.
Colgate people are effective
because they are empowered
by known values, growing
knowledge and a clear vision
of Company goals. They
know that their unique talents
and outstanding perform-
ances will be recognized.
Adhering to Colgate’s values
is a vital strategy that builds
shareholder value.
LEADERSHIPLeadership Development ProgramGoal Alignment Work SessionGlobal Leadership Program**
MANAGEMENTBringing Out the Leader in You*Setting Objectives Work SessionCoaching and FeedbackHaving Effective Performance ReviewsDeveloping People for Business Results (IDP)Valuing Colgate PeopleValuing Colgate’s Business Integrity
MANAGEMENT (Cont.)Colgate’s Money MattersFrontLine Leadership/Leadership 2000WorkSkills: Steps to your SuccessTeam Leadership/Team EffectivenessInfluence and Negotiations*Introduction to Project ManagementProblem Solving ToolsCompetency-Based InterviewingGeneral Instructor TrainingFacilitating Successful MeetingsBusiness Presentation SkillsC-P Business Operations**
COLGATE GLOBAL CURRICULUM
LEADERSHIP AND MANAGEMENT COURSES
FUNCTIONAL/TECHNICAL COURSES AND DEVELOPMENT PROGRAMS
Supplier Certification SeminarDevelopment Programs: Materials Sourcing Training and DevelopmentSupply Chain Team LeaderPlant EOHS CoordinatorPlant GMP Coordinator*Plant Microbiologist*Plant Chemist*Cross Border Sourcing Coordinator*Plant TPM/HPWS Coordinator**
MARKETINGMarketing Fundamentals**Consumer InsightPromoPower!Data Analysis*Media ManagementColgate ADvantage
RESEARCH AND DEVELOPMENTProduct Design Communication*Regulatory Training (U.S.)Surfactant Chemistry Product Integrity ManagementLabNETMicrobiology**Product Susceptibility and Preservative System Design**
SALESField Sales LeadershipBasic Sales TechniquesProSales Selling SkillsProSales Field CoachingKey Accountability:Managing the Account as a BusinessBusiness Proposals & Negotiations*Trade Marketing/Category Management**
FINANCEBASICSActivity AnalysisDoing Business in High Inflation EconomiesGlobal Finance Fundamentals**
HUMAN RESOURCESBuilding Training Excellence Workshop Building Business-Focused HR CapabilityCompetency-Based Interviewing Trainer CertificationGeneral Instructor Training CertificationColgate Leadership Profile CertificationOn-the-Job Learning System* Consulting Skills Workshop**Change Management**
INFORMATION TECHNOLOGYWIN Standard Applications: CP Mail 2000, Excel, PowerPoint, Windows 97 and WordSAP User TrainingLotus NotesInformation Technology Technical Training
SUPPLY CHAINHigh Performance Work Systems TrainingTotal Productive Maintenance (TPM)Knowledge Management Overview*Labor Relations*Quality TrainingCleaning and Sanitization**Basic Statistical Concepts and Applications*Statistical Process Control*Design of Experiments*Taguchi Methods: Quality by DesignEnvironmental, Occupational Health &SafetyTrainingContinuous Flow Manufacturing (CFM)Audit Skills and Techniques*Introduction to Logistics
■ 2000 Operational ■ 2000 Development* ■ Future Development** Pat Weakley, Associate Director of Global Marketing Training(now Director of Corporate Websites & Intranets)
Global TrainingSouth Africa: Media ManagementAt this two-day seminar in Johannesburg,
Colgate marketing people from Africa and the
Middle East strengthened their media knowl-
edge and broadened their media horizons
beyond television. At front of the class: Zin
Mabaso, Marketing Brand Manager, South
Africa, and Amr
Latif, Marketing
Manager, Egypt.
✓Continuous Improvement
Brought to you by Global Reports
38
*Reuben Mark, 61Chairman of the Boardand Chief ExecutiveOfficer
See biographicalinformation, left.
*William S. Shanahan, 59President and ChiefOperating Officer
Mr. Shanahan joinedColgate in 1965 and helda series of importantpositions in the UnitedStates and abroad. Theseinclude Vice President-General Manager for theWestern Hemisphere andGroup Vice President forEurope/Africa, Colgate-U.S. and other countries.He was elected ChiefOperating Officer in 1989and President in 1992.
*Lois D. Juliber, 51Executive Vice President,Chief of Operations,Developed Markets
Ms. Juliber joined Colgatein 1988 from GeneralFoods, where she wasVice President. Beforebeing promoted to hercurrent position in 1997,she had been Presidentof the Far East/Canadadivision, Chief Tech-nological Officer andPresident of Colgate-North America.
*David A. Metzler, 57Executive Vice President,Chief of Operations, HighGrowth Markets
Mr. Metzler joined Colgatein 1965. Before beingnamed to his currentposition in 1997, he wasPresident of Colgate-Europe and previouslyPresident of Colgate-LatinAmerica. Earlier, he hadresponsibilities for opera-tions in Canada, SouthPacific, Africa and India.
*Stephen C. Patrick, 50Chief Financial Officer
Joined Colgate in 1982after having been aManager at PriceWaterhouse. Before beingnamed CFO in 1996, Mr. Patrick held a seriesof key financial positions,including Vice Presidentand Corporate Controllerand Vice President-Finance for Colgate-LatinAmerica.
*John T. Reid, 59Chief Technological Officer
Joined Colgate in 1982 asVice President of StrategicPlanning from PfizerCorporation. Before beingnamed to his current posi-tion in 1997, Dr. Reid hadalso served as GeneralManager of Colgate-Greece, Vice Presidentand General Manager ofColgate-United Kingdomand Vice President of theSouth Pacific region.
*Andrew D. Hendry, 52Senior Vice President,General Counsel andSecretary
Joined Colgate in 1991from Unisys, where hewas Vice President andGeneral Counsel. A grad-uate of GeorgetownUniversity and NYU LawSchool, Mr. Hendry hasalso been a corporateattorney at the Battle &Fowler law firm in NewYork City and at ReynoldsMetals Company.
Emilio Alvarez-RecioVP, Advertising
Charles W. BeckVP, Global Materials,Logistics and Sourcing
*Steven R. BelascoVP, Taxation and Real Estate
David P. BenczeVP, Colgate-Europe
Philip A. BerryVP, Colgate-Europe
Robert E. BlanchardVP, Global ToothbrushDivision
John H. BourneVP, Colgate-North America
Johannes C. BrouwerVP, Turkiye
Nigel B. BurtonVP, United Kingdom & Ireland
Antonio CaroVP, Worldwide Sales
Jose-Maria CastroVP, Colgate-Europe
Peter C. ChaseVP, Colgate-Latin America
James H. ClarkVP, Colgate-Africa/Middle East
* Ian M. CookPresident, Colgate-North America
Michael A. CorboVP, Colgate-Central Europe & Russia
Graeme D. DalzielVP, Portugal
S. Peter DamPresident, Colgate-Asia Pacific
Your Management TeamYour Board of Directors
Reuben MarkChairman of the Boardand Chief Executive Officerof Colgate-PalmoliveCompany. Mr. Mark joinedColgate in 1963 and helda series of significantpositions in the UnitedStates and abroad beforebeing elected CEO in 1984.Elected director in 1983.Age 61
Jill K. ConwayVisiting Scholar, Programin Science, Technologyand Society atMassachusetts Institute ofTechnology since 1985.Mrs. Conway wasPresident of Smith Collegefrom 1975 to 1985. Electeddirector in 1984. Age 65
Ronald E. FergusonChairman and ChiefExecutive Officer ofGeneral Re Corporationsince 1987. Mr. Fergusonhas been with General Resince 1969. Electeddirector in 1987. Age 58
Ellen M. HancockPresident and ChiefExecutive Officer, ExodusCommunications, Inc. Mrs.Hancock previously wasExecutive Vice Presidentof Research andDevelopment and ChiefTechnology Officer atApple Computer Inc.,1996-1997, Executive VicePresident and ChiefOperating Officer atNational Semiconductor,1995-1996, and SeniorVice President at IBM.Elected director in 1988.Age 56
David W. JohnsonChairman Emeritus ofCampbell Soup Company.Mr. Johnson wasChairman of CampbellSoup Company, 1993-1999,and was CampbellPresident and ChiefExecutive Officer, 1990-1997. From 1987 to 1990,he served as Chairmanand Chief Executive Officerof Gerber ProductsCompany. Elected directorin 1991. Age 67
John P. KendallOfficer, Faneuil HallAssociates, Inc., a privateinvestment company,since 1973. Mr. Kendall is aformer Chairman of TheKendall Company. Hejoined that company in1956 and held a series ofsignificant positions.Elected directorin 1972. Age 71
Richard J. KoganChairman and ChiefExecutive Officer ofSchering-PloughCorporation since 1998.Mr. Kogan joinedSchering-Plough asExecutive Vice President,PharmaceuticalOperations, in 1982 andthen became Presidentand Chief OperatingOfficer of that company in1986 and President andChief Executive Officer in1996. Elected director in1996. Age 58
Howard B. Wentz, Jr.Chairman of Tambrands,Inc., 1993-1996. Mr. Wentzwas Chairman of ESSTARIncorporated, 1989-1995,and Chairman, Presidentand Chief Executive Officerof Amstar Company, 1983-1989. Elected director in1982. Age 70
Audit CommitteeRonald E. Ferguson, ChairJill K. ConwayEllen M. HancockJohn P. KendallHoward B. Wentz, Jr.
Committee on DirectorsDavid W. Johnson, ChairJill K. ConwayJohn P. KendallHoward B. Wentz, Jr.
Finance CommitteeHoward B. Wentz, Jr., ChairRonald E. FergusonEllen M. Hancock
John P. KendallRichard J. KoganReuben Mark
Personnel and Organization CommitteeJill K. Conway, ChairRonald E. FergusonDavid W. JohnsonJohn P. Kendall
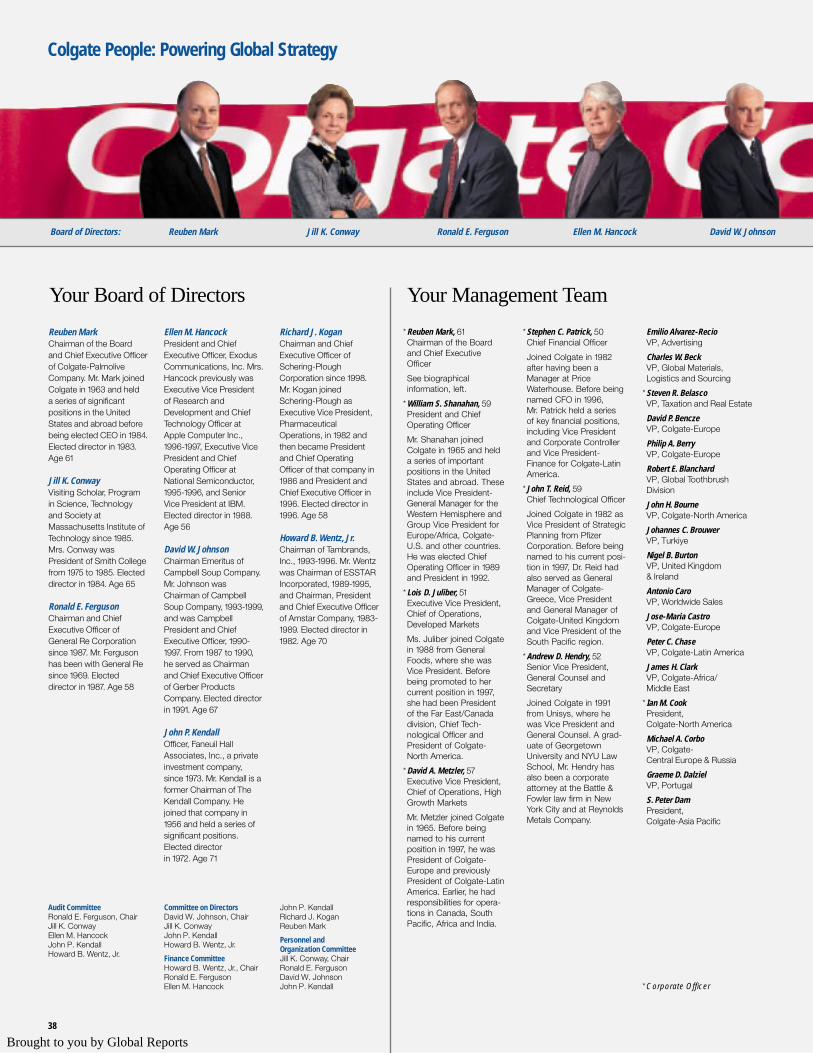
Colgate People: Powering Global Strategy
Board of Directors: Reuben Mark Jill K. Conway Ronald E. Ferguson Ellen M. Hancock David W. Johnson
*Corporate Officer
Brought to you by Global Reports
39
Edward C. DavisVP, Budget and Planning
Herbert L. DavisVP, Technology
Alec de GuillenchmidtVP, Nordic Group
Coloman de HegedusPresident, Colgate-Africa/Middle East
Virginia M. DotzauerVP, Hill’s Pet Nutrition
Joseph A. DouglasVP, Hill’s Pet Nutrition
Dale A. DvorakVP, Colgate-Latin America
Steven E. ElliottVP, Thailand
Hector I. ErezumaVP, International Taxes
James E. Farrell, Jr.VP, Legal
Guillermo M. FernandezVP, Mexico
James S. FiguraVP, Colgate-U.S.
Edward J. FiluschVP, Treasury
Stephen J. FogartyVP, Oral Care
Chester P.W. FongVP, Greater China
Abdul GaffarVP, Research andDevelopment
Robert GalanVP, Philippines
Jill GarrityVP, Colgate-Europe
James J. GerchowVP, Colgate-Africa/Middle East
Nina D. GillmanVP, Legal
Walter H. GolembeskiVP, Colgate-Asia Pacific
Stefan S. GorkinVP, Labor Relations
David R. GroenerVP, Colgate-North America
Karen GuerraVP, France
Luis GutierrezVP, Central America
Jack J. HaberVP, Chief Web Officer
Tarek S. HallabaVP, Colgate-U.S.
Suzan F. HarrisonVP, Colgate-U.S.
Richard F. HawkinsPresident, Hill’s-International
*Brian J. HeidtkeVP, Finance and Corporate Treasurer
Jean-Mathieu HellichVP, Colgate-Europe
*Dennis J. HickeyVP, Corporate Controller
Sheila A. HopkinsVP, Colgate-U.S.
William A. HoulzetVP, Argentina
Stuart A. HulkeVP, Technology
John J. HustonVP, Office of the Chairman
N. Jay JayaramanVP, Oral Care
Scott W. Jeffrey, Jr.VP, Colombia
*Robert J. JoyVP, Global HumanResources
Jules P. KaufmanVP, Legal
Robert G. KirkpatrickVP, Media
Betty M. KongVP, Technology
Yoshio KoshimuraVP, Hill’s-Asia Pacific
Leo LaitemVP, Research andDevelopment
Daniel B. MarsiliVP, Colgate-Latin America
Robert R. MartinVP, Global Demand Chain
Ronald T. MartinVP, Human Resources
Steven G. MartonVP, Hill’s-Europe
Robert F. MaruskaVP, Colgate-U.S.
*Michele C. MayesVP, Deputy General Counsel
Seamus E. McBrideVP, Italy
Charles F. McGrawVP, Colgate-North America
*Peter D. McLeodVP, ManufacturingEngineering Technology
Donna B. McNamaraVP, Human Resources
Richard MenerVP, Global Export/Middle East
Louis P. MignoneVP, Colgate-U.S.
Franck J. MoisonPresident, Colgate-Central Europe and Russia
Francis A. MorelliVP, Global Systems
Graeme B. MurrayVP, Canada
Robert A. MurrayVP, CorporateCommunications
James NapolitanoVP, Hill’s Pet Nutrition
Jean-Marc NavezVP, Colgate-Asia Pacific
Rosemary NelsonVP, Colgate-U.S.
Alan NimmeyVP, Technology
James NorfleetVP, Research andDevelopment
Morgan J. O’BrienVP, Colgate-Central Europe and Russia
Chris E. PedersenVP, South Pacific Region
Robert C. PierceVP, Research andDevelopment
Hans L. PohlschroederVP, Treasury
Roger M. PrattVP, Brazil
Ricardo RamosVP, Greece
Friedrich ReinshagenVP, Germanic Countries
Grace E. RichardsonVP, Consumer Affairs
Jill H. RothmanVP, Human Resources
Reuven M. SacherVP, Research andDevelopment
Jeff SalgueroVP, Advertising Production
Derrick E.M. SamuelVP, South Asia Region
Raffy L. SantosVP, Hawley & Hazel Taiwan
Lim Kim SengVP, China
*James M. SerafinoVP, Deputy General Counsel
James H. ShoultzVP, Venezuela
Barry N. SimpsonVP, Colgate-Asia Pacific
Leonard D. SmithVP, Global Supply Chain
James W. SparksVP, Hill’s Pet Nutrition
*Barrie M. SpellingPresident, Global Oral Care
Malcolm L. StokoeVP, Caricom Region
P. Dorset SuttonPresident, Hill’s Pet Nutrition
*Michael J. TangneyPresident, Colgate-Latin America
*Javier G. TeruelPresident, Colgate-Europe
Richard F. TheilerVP, Research andDevelopment
Bina H. ThompsonVP, Investor Relations
Scott E. ThompsonVP, Legal
Kathleen A. ThornhillVP, Consumer Insights
*John H. TietjenVP, Global BusinessDevelopment
Heiko TietkeVP, Personal Care
Edmund D. TobenChief Information Officer
Joseph A. UzzolinaVP, Household Surface Care
Daniel A. VettorettiVP, Poland Region
J. Nicholas VinkeVP, Colgate OralPharmaceuticals
Anthony R. VolpeVP, Research andDevelopment
*Robert C. WheelerChief Executive Officer,Hill’s Pet Nutrition
Richard J. WienckowskiVP, Hill’s Pet Nutrition
David K. WilcoxVP, Technology
Francis M. WilliamsonVP, Colgate-Latin America
Paul A. WitmondVP, Dominican Republic
Gregory P. WoodsonPresident, Fabric Care
Douglas R. WrightVP, Environmental Affairs,Occupational Health andSafety
Seng Aun YeohVP, Malaysia
John E. ZoogVP, Human Resources
John P. Kendall Richard J. Kogan Howard B. Wentz, Jr.
*Corporate Officer
Congratulations...Delano E. LewisLeaves Colgate’s Board on appoint-ment as Ambassador to South AfricaColgate congratulates former Director Delano
Lewis on his significant new appointment
as the U.S. Ambassador to South Africa. In
this new position, Mr. Lewis by law had to
resign from Colgate’s Board. We are deeply
indebted for his many contributions as a
Director and as Chairman of the Board’s
Committee on Directors. We thank Mr.
Lewis for over eight years of service
and wish him all the best in con-
tinuing his distinguished career. Delano E. Lewis
Brought to you by Global Reports
Results of OperationsWorldwide Net Sales by Business Segment and Geographic Region 1999 1998 1997
Oral, Personal and Household CareNorth America (1) $2,143.7 $2,047.5 $1,992.5Latin America 2,356.7 2,407.9 2,363.8Europe 2,028.8 2,067.7 2,078.8Asia/Africa 1,519.7 1,452.6 1,656.3
Total Oral, Personal and Household Care 8,048.9 7,975.7 8,091.4
Total Pet Nutrition (2) 1,069.3 995.9 965.3Total Net Sales $9,118.2 $8,971.6 $9,056.7
(1) Net sales in the United States for Oral, Personal and Household Care were$1,880.8, $1,799.6 and $1,756.1 in 1999, 1998 and 1997, respectively.
(2) Net sales in the United States for Pet Nutrition were $709.2, $688.6 and $689.4 in1999, 1998 and 1997, respectively.
Net Sales and Earnings Before Interest and Taxes (EBIT)Worldwide net sales increased 2% to $9,118.2 in 1999 on volumegrowth of 5%. Net sales would have grown 7% excluding foreigncurrency translation. Net sales in the Oral, Personal and House-hold Care segment increased 1% on 4% volume growth, while netsales in Pet Nutrition increased 7% on 8% volume growth. In
1998, worldwide net sales decreased 1% to $8,971.6 on volumegrowth of 3.5%, reflecting the negative impact of foreign currencytranslation.
EBIT rose from $1,423.0 to $1,566.2 in 1999. The 10% increasereflected the Company’s strong volume growth and cost-controlinitiatives that were effective in increasing margins. EBITincreased 11% in 1998 to $1,423.0 from $1,285.8 in 1997.
Gross ProfitGross profit margin increased to 53.7%, above both the 1998level of 52.2% and the 1997 level of 50.7%. This favorable trendcontinues to reflect the Company’s financial strategy to improveall aspects of its supply chain through global sourcing, restructur-ing and other cost-reduction initiatives, as well as its emphasis onhigher margin products.
Selling, General and Administrative ExpensesSelling, general and administrative expenses as a percentage ofsales were level at 36% for the three-year period 1997 to 1999.The amounts include higher advertising costs offset by theCompany’s continued focus on expense containment.
Other Expense, NetOther expense, net, consists principally of amortization of good-will and other intangible assets, minority interest in earnings ofless-than-100%-owned consolidated subsidiaries, earnings fromequity investments, gain on sale of real estate and non-coreproduct lines, and other miscellaneous gains and losses. Otherexpense, net, increased in 1999 from $61.2 to $73.6, primarily dueto one-time charges.
As part of the Company’s ongoing program of product stan-dardization and organization redesign, the Company incurredone-time charges related to the exiting of certain activities, suchas the manufacture of aluminum tubes in Brazil. These chargeswere offset by an aftertax gain of $17.6 recorded on the sale ofthe U.S. Baby Magic brand and an aftertax gain of $11.4 on thesale of real estate.
Dollars in Millions Except Per Share Amounts
18
GlobalFinancial Review
Results of Operations 18
Reports of Management and Independent Public Accountants 23
Consolidated Statements of Income 24
Consolidated Balance Sheets 25
Consolidated Statements of Retained Earnings,
Comprehensive Income and Changes in Capital Accounts 26
Consolidated Statements of Cash Flows 27
Notes to Consolidated Financial Statements 28
Quarterly Stock Market and Dividend Information 37
Eleven-Year Financial Summary 40
Financial Contents
Brought to you by Global Reports
19
Dollars in Millions Except Per Share Amounts
EuropeNet sales in Europe declined 2% to $2,028.8 on unit volumeincreases of 2%, offset by negative foreign currency impact. TheUnited Kingdom, Italy, the Netherlands and Spain achieved thestrongest sales growth and volume increases in the region. Vol-ume increases were driven by the relaunch of Colgate Total tooth-paste and new varieties of Palmolive shower gels and Palmoliveliquid soaps. In 1998, Europe net sales remained flat at $2,067.7,due primarily to weak economic conditions in Russia, while vol-ume grew 1%.
EBIT for Europe increased 8% to $342.0 despite the 2%decline in sales due to higher margins and higher volumes. EBITin 1998 rose 12% to $317.5.
Asia/AfricaNet sales in the Asia/Africa region increased 5% to $1,519.7 as vol-ume increased 7%. The strong performance is attributed to theeconomic recovery within the ASEAN region and the significantgrowth in India and China, through continued geographic expan-sion as well as new product launches. During 1999, the Companyachieved the Number One position in toothpaste in China. In 1998,net sales in the Asia/Africa region decreased 12% to $1,452.6 asvolume decreased 1%, reflecting the weaker ASEAN currencies.
EBIT grew 5% in Asia/Africa to $166.7 driven by increasedvolumes across the region. EBIT in 1998 decreased 11% to$158.6 reflecting weakened economies in the ASEAN countriesand strong competition in India.
Pet NutritionNet sales for Hill’s Pet Nutrition increased 7% to $1,069.3 on 8%volume growth. Within the United States, sales increased due tothe introduction of new products including Science Diet FelineHairball Control and new life-stage variants launched in the fourthquarter. Strong growth occurred in Japan and Europe due to theintroduction of new feline varieties and improvements in the entiredry cat food line, complemented by increased advertising. In1998, net sales for the Pet Nutrition segment increased 3% to$995.9 on 4% volume gains.
EBIT in the Pet Nutrition segment grew 27% to $219.9 drivenby volume, cost-improvement initiatives and the benefit of lowerraw material costs. EBIT in 1998 increased 7% to $173.8 on bothhigher volumes and improved gross profit margins.
Interest Expense, NetInterest expense, net, was $171.6 compared with $172.9 in 1998and $183.5 in 1997. The decline in net interest expense in 1998was primarily the result of lower average debt levels during theyear compared with 1997 and a decrease in interest rates.
Income TaxesThe effective tax rate on income was 32.8% in 1999 versus 32.1%in 1998 and 32.8% in 1997. Global tax planning strategies, includ-ing the realization of tax credits, benefited the effective tax rate inall three years presented.
Worldwide Earnings by Business Segment and Geographic Region 1999 1998 1997
Oral, Personal and Household CareNorth America $ 413.0 $ 395.5 $ 312.6Latin America 535.7 502.0 483.0Europe 342.0 317.5 283.5Asia/Africa 166.7 158.6 178.3
Total Oral, Personal and Household Care 1,457.4 1,373.6 1,257.4
Total Pet Nutrition 219.9 173.8 162.5Corporate (111.1) (124.4) (134.1)Earnings Before Interest and Taxes 1,566.2 1,423.0 1,285.8Interest Expense, Net (171.6) (172.9) (183.5)Income Before Income Taxes $1,394.6 $1,250.1 $1,102.3
Segment Results
North AmericaNorth America achieved excellent results for the year. Net salesexcluding divestments grew 6% to $2,143.7 as unit volume rose8% driven by innovative new products. The launch of ColgateTotal Fresh Stripe in the first quarter strengthened the Company’sNumber One position in toothpaste. The introduction of SpeedStick clear antiperspirant and Palmolive Spring Sensations dish-washing liquid increased market shares in the personal andhousehold care lines, respectively. In 1998, North America postedoverall sales growth excluding divestments of 6% to $2,047.5 onvolume growth of 5%.
EBIT for North America was up 4% to $413.0. The regionachieved earnings growth through volume gains, continued focuson cost-control and value-added initiatives. EBIT in 1998 was up27% to $395.5 due to higher margins on higher volumes.
Latin AmericaNet sales in Latin America decreased 2% to $2,356.7 on 3% vol-ume growth. Strong growth in Mexico, Venezuela and CentralAmerica largely offset challenging economic conditions in Braziland Ecuador. The continued success of products such as Col-gate Double Cool Stripe toothpaste and herbal toothpaste underthe Sorriso and Kolynos brand names as well as the introductionof Speed Stick gel and product extensions of Softsoap liquidsoap and Palmolive shower gels continue to strengthen marketleadership. In 1998, Latin America net sales increased 2% to$2,407.9 on 7% volume growth.
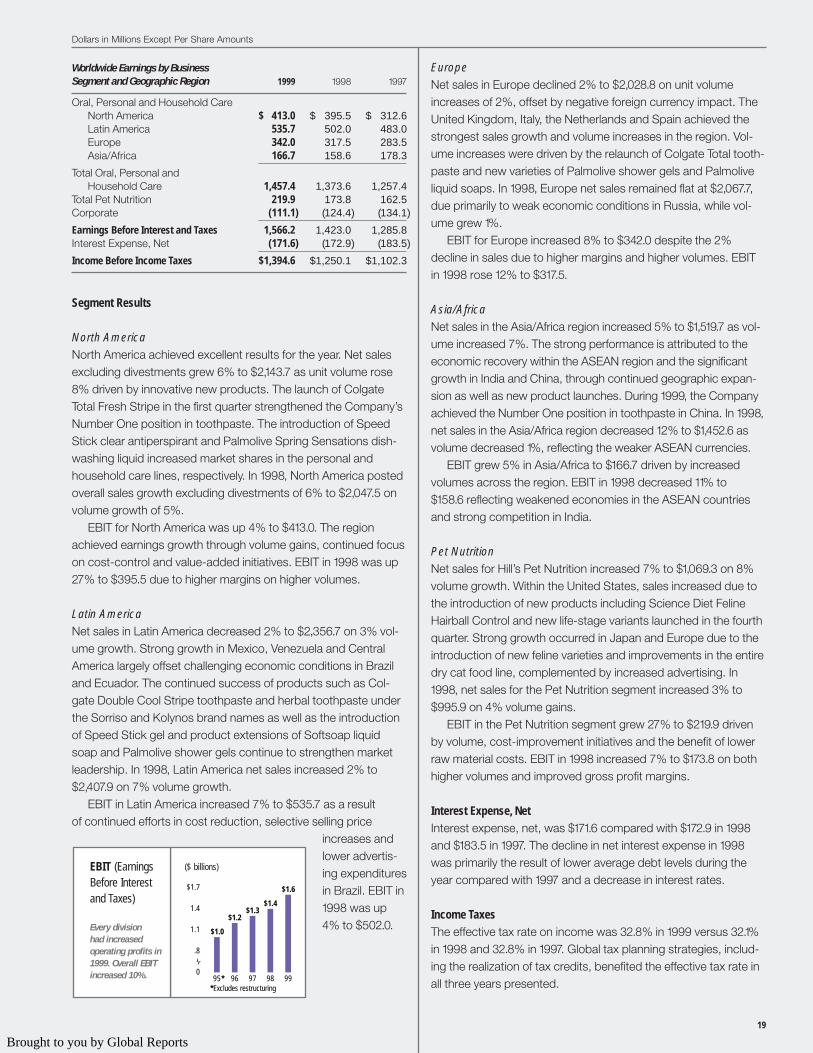
EBIT in Latin America increased 7% to $535.7 as a resultof continued efforts in cost reduction, selective selling price
increases andlower advertis-ing expendituresin Brazil. EBIT in1998 was up4% to $502.0.
($ billions)
$1.6
$1.4$1.3
$1.2
$1.0
0
.8
1.1
1.4
$1.7
9998979695**Excludes restructuring
EBIT (EarningsBefore Interest and Taxes)
Every division had increasedoperating profits in1999. Overall EBITincreased 10%.
Brought to you by Global Reports
Net IncomeNet income was $937.3 in 1999 or $1.47 per share on a dilutedbasis compared with $848.6 in 1998 or $1.30 per share and$740.4 in 1997 or $1.13 per share.
1999 1998 1997
Identifiable AssetsOral, Personal and Household Care
North America $2,581.6 $2,591.0 $2,553.2Latin America 1,941.7 2,128.3 2,204.8Europe 1,252.3 1,329.9 1,201.5Asia/Africa 982.7 952.4 891.9
Total Oral, Personal and Household Care 6,758.3 7,001.6 6,851.4
Total Pet Nutrition 476.1 502.6 517.3Total Corporate 188.7 181.0 170.0Total Identifiable Assets (1) $7,423.1 $7,685.2 $7,538.7
(1) Long-lived assets in the United States, primarily fixed assets and goodwill,represented approximately one-third of total long-lived assets of $4,952.3,$5,330.0 and $5,234.9 in 1999, 1998 and 1997, respectively.
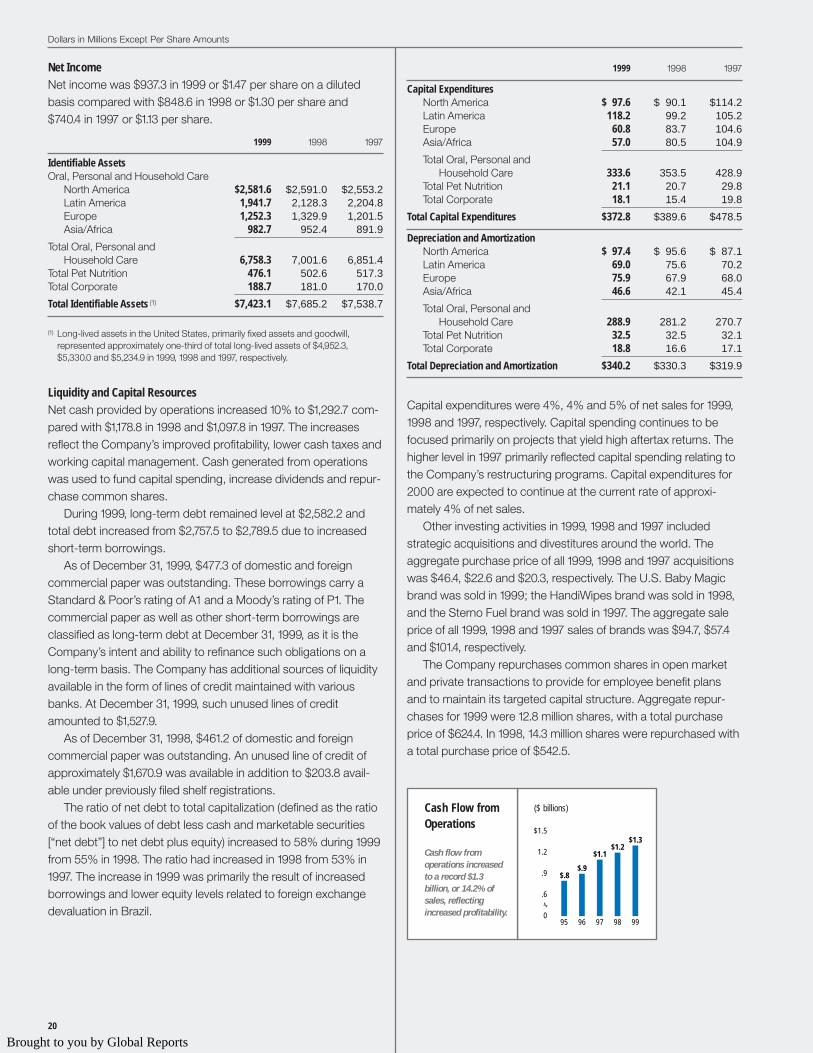
Liquidity and Capital ResourcesNet cash provided by operations increased 10% to $1,292.7 com-pared with $1,178.8 in 1998 and $1,097.8 in 1997. The increasesreflect the Company’s improved profitability, lower cash taxes andworking capital management. Cash generated from operationswas used to fund capital spending, increase dividends and repur-chase common shares.
During 1999, long-term debt remained level at $2,582.2 andtotal debt increased from $2,757.5 to $2,789.5 due to increasedshort-term borrowings.
As of December 31, 1999, $477.3 of domestic and foreigncommercial paper was outstanding. These borrowings carry aStandard & Poor’s rating of A1 and a Moody’s rating of P1. Thecommercial paper as well as other short-term borrowings areclassified as long-term debt at December 31, 1999, as it is theCompany’s intent and ability to refinance such obligations on along-term basis. The Company has additional sources of liquidityavailable in the form of lines of credit maintained with variousbanks. At December 31, 1999, such unused lines of creditamounted to $1,527.9.
As of December 31, 1998, $461.2 of domestic and foreigncommercial paper was outstanding. An unused line of credit ofapproximately $1,670.9 was available in addition to $203.8 avail-able under previously filed shelf registrations.
The ratio of net debt to total capitalization (defined as the ratioof the book values of debt less cash and marketable securities[“net debt”] to net debt plus equity) increased to 58% during 1999from 55% in 1998. The ratio had increased in 1998 from 53% in1997. The increase in 1999 was primarily the result of increasedborrowings and lower equity levels related to foreign exchangedevaluation in Brazil.
1999 1998 1997
Capital ExpendituresNorth America $ 97.6 $ 90.1 $114.2Latin America 118.2 99.2 105.2Europe 60.8 83.7 104.6Asia/Africa 57.0 80.5 104.9Total Oral, Personal and
Household Care 333.6 353.5 428.9Total Pet Nutrition 21.1 20.7 29.8Total Corporate 18.1 15.4 19.8
Total Capital Expenditures $372.8 $389.6 $478.5
Depreciation and AmortizationNorth America $ 97.4 $ 95.6 $ 87.1Latin America 69.0 75.6 70.2Europe 75.9 67.9 68.0Asia/Africa 46.6 42.1 45.4Total Oral, Personal and
Household Care 288.9 281.2 270.7Total Pet Nutrition 32.5 32.5 32.1Total Corporate 18.8 16.6 17.1
Total Depreciation and Amortization $340.2 $330.3 $319.9
Capital expenditures were 4%, 4% and 5% of net sales for 1999,1998 and 1997, respectively. Capital spending continues to befocused primarily on projects that yield high aftertax returns. Thehigher level in 1997 primarily reflected capital spending relating tothe Company’s restructuring programs. Capital expenditures for2000 are expected to continue at the current rate of approxi-mately 4% of net sales.
Other investing activities in 1999, 1998 and 1997 includedstrategic acquisitions and divestitures around the world. Theaggregate purchase price of all 1999, 1998 and 1997 acquisitionswas $46.4, $22.6 and $20.3, respectively. The U.S. Baby Magicbrand was sold in 1999; the HandiWipes brand was sold in 1998,and the Sterno Fuel brand was sold in 1997. The aggregate saleprice of all 1999, 1998 and 1997 sales of brands was $94.7, $57.4and $101.4, respectively.
The Company repurchases common shares in open marketand private transactions to provide for employee benefit plansand to maintain its targeted capital structure. Aggregate repur-chases for 1999 were 12.8 million shares, with a total purchaseprice of $624.4. In 1998, 14.3 million shares were repurchased witha total purchase price of $542.5.
Dollars in Millions Except Per Share Amounts
20
($ billions)
$1.3$1.2
$1.1
$.9$.8
0
.6
.9
1.2
$1.5
9998979695
Cash Flow fromOperations
Cash flow from operations increasedto a record $1.3 billion, or 14.2% ofsales, reflectingincreased profitability.
Brought to you by Global Reports
Dividend payments were $366.0, up from $345.6 in 1998 and$333.4 in 1997. Common stock dividend payments increased to$.59 per share in 1999 from $.55 per share in 1998 and $.53 pershare in 1997. The Series B Preference Stock dividends weredeclared and paid at the rate of $4.96 per share in 1999 and $4.88per share in both 1998 and 1997.
Internally generated cash flows appear to be adequate tosupport currently planned business operations, acquisitionsand capital expenditures. Significant acquisitions would requireexternal financing.
The Company is a party to various superfund and other envi-ronmental matters and is contingently liable with respect to law-suits, taxes and other matters arising out of the normal course ofbusiness. Management proactively reviews and manages itsexposure to, and the impact of, environmental matters. While it ispossible that the Company’s cash flows and results of operationsin particular quarterly or annual periods could be affected by theone-time impacts of the resolution of such contingencies, it is theopinion of management that the ultimate disposition of these mat-ters, to the extent not previously provided for, will not have amaterial impact on the Company’s financial condition or ongoingcash flows and results of operations.
Status of Restructuring ReserveIn September 1995, a reserve of $460.5 was established to covera worldwide restructuring of manufacturing and administrativeoperations. The primary elements of the reserve related toemployee termination costs and expenses associated with therealignment of the Company’s global manufacturing operations,as well as settlement of contractual obligations. The costs ofcompleting the restructuring activities to date approximated theoriginal estimate. As planned, the restructuring has producedsavings that increase pretax earnings by over $150.0 annually.
The planned restructuring projects, primarily in North Americaand Europe but also affecting Hill’s Pet Nutrition and Colgatelocations in Asia/Africa and certain Latin America locations, aresubstantially completed. The remaining reserve amount of $5.4relates to the consolidation of administrative operations followingthe implementation of SAP computer systems and relatedprocess changes in Europe.
Managing Foreign Currency and Interest Rate ExposureThe Company is exposed to market risk from foreign currencyexchange rate fluctuations and interest rates. To manage thevolatility relating to foreign currency exposures on a consolidatedbasis, the Company utilizes a number of techniques, includingselective borrowings in local currencies, purchases of forward for-eign currency exchange contracts, balance sheet managementand increases in selling prices.
The Company operates in over 200 countries and territoriesand is exposed to currency fluctuation related to manufacturingand selling its products in currencies other than the U.S. dollar.The major foreign currency exposures involve the markets inMexico, Brazil and France, each of which represents individually5% to 10% of worldwide sales. Each of the other countries’ oper-ations represents less than 4% of worldwide sales. In the coun-tries of Mexico and France during the three-year period from 1997to 1999, the combination of selling price increases and cost-containment measures have more than offset the impact of for-eign currency rate movements resulting in increased gross profitmargins during the periods presented. Profitability in Brazildecreased in 1999 following increases in 1998 and 1997 as aresult of a devaluation of the Brazilian currency in January 1999.
The Company utilizes simple instruments such as interest rateswaps to manage the Company’s mix of fixed and floating ratedebt. The Company’s target floating rate obligations as a percent-age of the Company’s global debt is set by policy. As a matter ofpolicy, the Company does not speculate in financial markets andtherefore does not hold or issue derivative financial instrumentsfor trading purposes.
Value at RiskThe Company’s risk management procedures include the moni-toring of interest rate and foreign exchange exposures and theCompany’s offsetting hedge positions utilizing analytical analysesof cash flows, market value, sensitivity analysis and value-at-riskestimations. However, the use of these techniques to quantify themarket risk of such instruments should not be construed as anendorsement of their accuracy or the accuracy of the relatedassumptions. The Company utilizes a Value-at-Risk (VAR) modeland an Earnings-at-Risk (EAR) model that are intended to mea-sure the maximum potential loss in its interest rate and foreignexchange financial instruments assuming adverse market condi-tions occur, given a 95% confidence level. The models utilize avariance/covariance modeling technique. Historical interest ratesand foreign exchange rates from the preceding year are used toestimate the volatility and correlation of future rates. The esti-mated maximum potential one-day loss in fair value of interestrate or foreign exchange rate instruments, calculated using theVAR model, is not material to the consolidated financial position,results of operations or cash flows of the Company.
The estimated maximum yearly loss in earnings due to interestrate or foreign exchange rate instruments, calculated utilizing theEAR model, is not material to the Company’s results of opera-tions. Actual results in the future may differ materially from theseprojected results due to actual developments in the global finan-cial markets.
A discussion of the Company’s accounting policies forfinancial instruments is included in the Summary of Significant
Dollars in Millions Except Per Share Amounts
21
Brought to you by Global Reports
Accounting Policies in the Notes to the Consolidated FinancialStatements, and further disclosure relating to financial instru-ments is included in the Fair Value of Financial Instruments note.
Year 2000 UpdateThe Company developed plans to address the possible expo-sures related to the year 2000 on the Company’s internal systemsand equipment. In the critical area of internal operating systems,the computer systems and embedded microprocessors andcontrol systems in all operations were either replaced (includingthrough conversion to SAP) or made compliant by December 31,1999. In addition, the other aspects of the year 2000 project planwere completed by December 31, 1999.
The incremental cost, including external contractor costs,costs to modify existing systems and costs of internal resourcesdedicated to preparing for the year 2000, was approximately$30.0. These costs were charged to expense as incurred andwere incremental to the investment in SAP systems which waspreviously planned and implemented.
No significant year 2000 problems have been encounteredwith the Company’s internal systems and equipment.
Conversion to the Euro CurrencyOn January 1, 1999, certain member countries of the EuropeanUnion established fixed conversion rates between their existingcurrencies and adopted the euro as their new common legalcurrency. As of that date, the euro began trading on currencyexchanges and the legacy currencies were to remain legal tenderin the participating countries for a transition period between Janu-ary 1, 1999 and January 1, 2002.
The Company is addressing most of the issues involved withthe introduction of the euro through its worldwide conversion tothe SAP system. The more important issues facing the Companyinclude reassessing currency risk and processing tax andaccounting records.
Based upon progress to date, the Company believes that useof the euro will not have a significant impact on the manner inwhich it conducts its business affairs and processes its businessand accounting records. Accordingly, conversion to the euro isnot expected to have a material effect on the Company’s financialcondition, cash flows or results of operations.
OutlookLooking forward into 2000, the Company is well positioned forstrong growth in most of its markets, particularly North Americaand Asia/Africa. However, movements in foreign currencyexchange rates can impact future operating results as measuredin U.S. dollars. In particular, economic uncertainty in some coun-tries in Latin America and the continued weakness in the euromay impact the overall results of Latin America and Europe.
The Company expects the continued success of Colgate Totaltoothpaste, using patented proprietary technology, to bolsterworldwide oral care leadership and expects new products in OralCare and other categories to add potential for further growth.Overall, subject to global economic conditions, the Companydoes not expect the 2000 market conditions to be materially dif-ferent from those experienced in 1999 and the Company expectsits positive momentum to continue. Historically, the consumerproducts industry has been less susceptible to changes in eco-nomic growth than many other industries, and therefore the Com-pany constantly evaluates projects that will focus operations onopportunities for enhanced growth potential. Over the long term,Colgate’s continued focus on its consumer products businessand the strength of its global brand names, its broad internationalpresence in both developed and developing markets, and itsstrong capital base all position the Company to take advantage ofgrowth opportunities and to continue to increase profitability andshareholder value.
Forward-Looking StatementsReaders are cautioned that the Results of Operations and othersections of this report contain forward-looking statements thatare based on management’s estimates, assumptions and pro-jections. A description of some of the factors that could causeactual results to differ materially from expectations expressedin the Company’s forward-looking statements set forth in theCompany’s Form 8-K filed with the Securities and ExchangeCommission on November 13, 1998 under the caption “Caution-ary Statement on Forward-Looking Statements” is incorporatedherein by reference. These factors include, but are not limitedto, the risks associated with international operations, theactivities of competitors, retail trade practices, the success ofnew product introductions, cost pressures, manufacturing andenvironmental matters.
Dollars in Millions Except Per Share Amounts
22
Brought to you by Global Reports
23
The management of Colgate-Palmolive Company has preparedthe accompanying consolidated financial statements and isresponsible for their content as well as other information con-tained in this annual report. These financial statements have beenprepared in accordance with generally accepted accounting prin-ciples and necessarily include amounts which are based on man-agement’s best estimates and judgments.
The Company maintains a system of internal accounting con-trol designed to be cost-effective while providing reasonableassurance that assets are safeguarded and that transactions areexecuted in accordance with management’s authorization andare properly recorded in the financial records. Internal controleffectiveness is supported through written communication of poli-cies and procedures, careful selection and training of personnel,and audits by a professional staff of internal auditors. The Com-pany’s control environment is further enhanced through a formalCode of Conduct which sets standards of professionalism andintegrity for employees worldwide.
The Company has retained Arthur Andersen LLP, independentpublic accountants, to examine the financial statements. Their
To the Board of Directors and Shareholders ofColgate-Palmolive Company:
We have audited the accompanying consolidated balance sheetsof Colgate-Palmolive Company (a Delaware corporation) andsubsidiaries as of December 31, 1999 and 1998, and the relatedconsolidated statements of income, retained earnings, compre-hensive income and changes in capital accounts, and cash flowsfor each of the three years in the period ended December 31,1999. These financial statements are the responsibility of theCompany’s management. Our responsibility is to express anopinion on these financial statements based on our audits.
We conducted our audits in accordance with generallyaccepted auditing standards. Those standards require that weplan and perform the audit to obtain reasonable assurance aboutwhether the financial statements are free of material misstate-ment. An audit includes examining, on a test basis, evidence
accompanying report is based on an examination conducted inaccordance with generally accepted auditing standards, whichincludes a review of the Company’s systems of internal control aswell as tests of accounting records and procedures sufficient toenable them to render an opinion on the Company’s financialstatements.
The Audit Committee of the Board of Directors is composedentirely of non-employee directors. The Committee meets period-ically and independently throughout the year with management,internal auditors and the independent accountants to discuss theCompany’s internal accounting controls, auditing and financialreporting matters. The internal auditors and independent accoun-tants have unrestricted access to the Audit Committee.
Reuben Mark Stephen C. PatrickChairman and Chief Financial OfficerChief Executive Officer
supporting the amounts and disclosures in the financial state-ments. An audit also includes assessing the accounting principlesused and significant estimates made by management, as well asevaluating the overall financial statement presentation. We believethat our audits provide a reasonable basis for our opinion.
In our opinion, the financial statements referred to above pre-sent fairly, in all material respects, the financial position of Colgate-Palmolive Company and subsidiaries as of December 31, 1999and 1998, and the results of their operations and their cash flowsfor each of the three years in the period ended December 31,1999, in conformity with generally accepted accounting principles.
New York, New YorkFebruary 1, 2000
Report of Management
Report of Independent Public Accountants
Brought to you by Global Reports
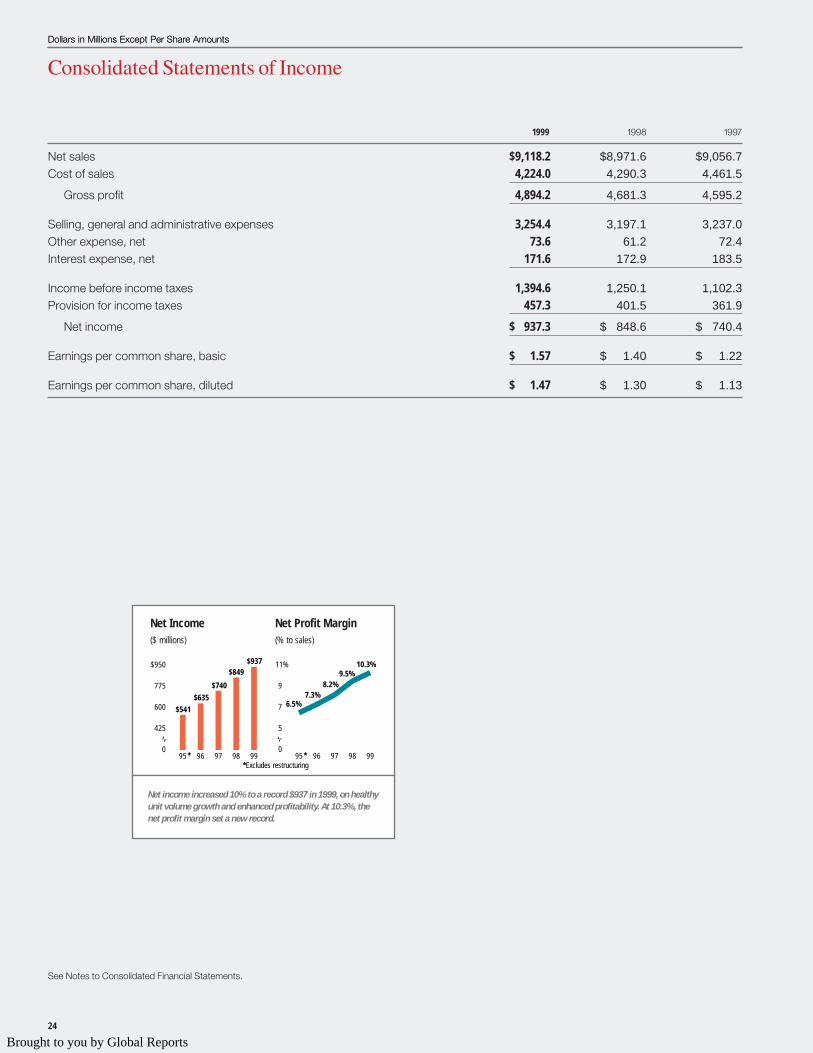
Dollars in Millions Except Per Share Amounts
24
See Notes to Consolidated Financial Statements.
1999 1998 1997
Net sales $9,118.2 $8,971.6 $9,056.7Cost of sales 4,224.0 4,290.3 4,461.5
Gross profit 4,894.2 4,681.3 4,595.2
Selling, general and administrative expenses 3,254.4 3,197.1 3,237.0Other expense, net 73.6 61.2 72.4Interest expense, net 171.6 172.9 183.5
Income before income taxes 1,394.6 1,250.1 1,102.3Provision for income taxes 457.3 401.5 361.9
Net income $ 937.3 $ 848.6 $ 740.4
Earnings per common share, basic $ 1.57 $ 1.40 $ 1.22
Earnings per common share, diluted $ 1.47 $ 1.30 $ 1.13
Consolidated Statements of Income
Dollars in Millions Except Per Share Amounts
Net income increased 10% to a record $937 in 1999, on healthyunit volume growth and enhanced profitability. At 10.3%, thenet profit margin set a new record.
$937$849
$740
$635
$541
10.3%9.5%
8.2%7.3%
6.5%
0
5
7
9
11%
99989796950
425
600
775
$950
9998979695 ***Excludes restructuring
Net Income($ millions)
Net Profit Margin(% to sales)
Brought to you by Global Reports
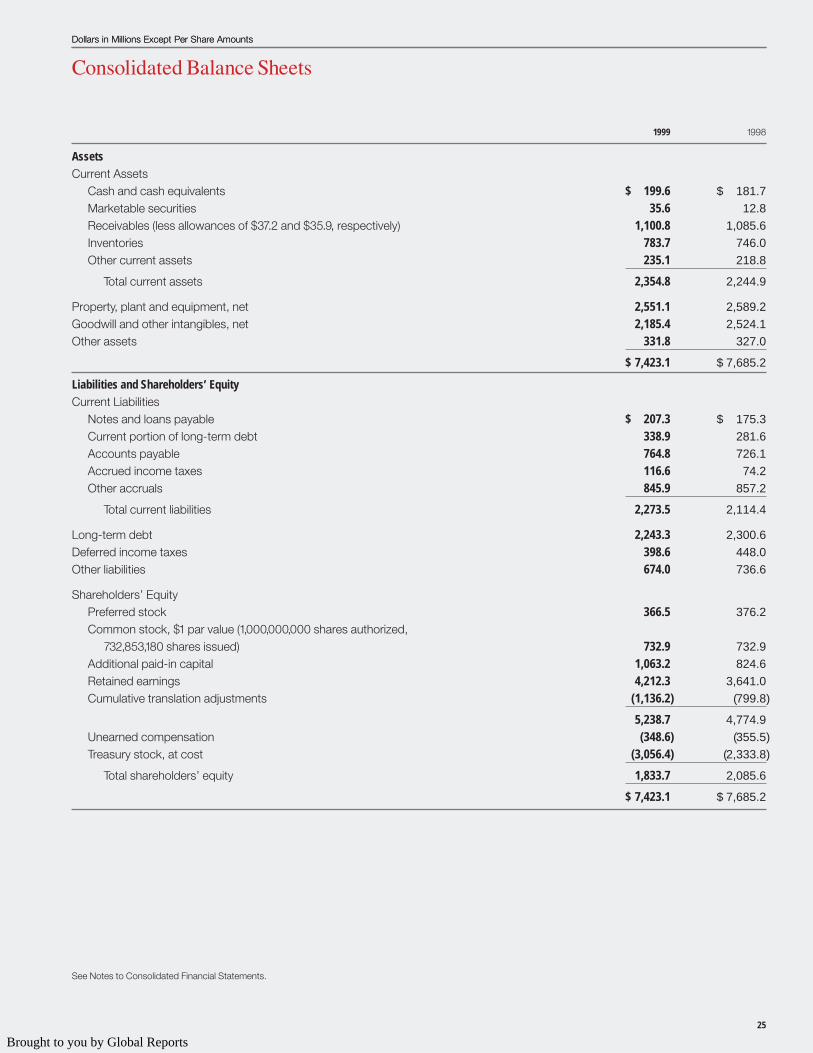
Dollars in Millions Except Per Share Amounts
25
Consolidated Balance Sheets
See Notes to Consolidated Financial Statements.
1999 1998
AssetsCurrent Assets
Cash and cash equivalents $ 199.6 $ 181.7Marketable securities 35.6 12.8Receivables (less allowances of $37.2 and $35.9, respectively) 1,100.8 1,085.6Inventories 783.7 746.0Other current assets 235.1 218.8
Total current assets 2,354.8 2,244.9
Property, plant and equipment, net 2,551.1 2,589.2Goodwill and other intangibles, net 2,185.4 2,524.1Other assets 331.8 327.0
$ 7,423.1 $ 7,685.2
Liabilities and Shareholders’ EquityCurrent Liabilities
Notes and loans payable $ 207.3 $ 175.3Current portion of long-term debt 338.9 281.6Accounts payable 764.8 726.1Accrued income taxes 116.6 74.2Other accruals 845.9 857.2
Total current liabilities 2,273.5 2,114.4
Long-term debt 2,243.3 2,300.6Deferred income taxes 398.6 448.0Other liabilities 674.0 736.6
Shareholders’ EquityPreferred stock 366.5 376.2Common stock, $1 par value (1,000,000,000 shares authorized,
732,853,180 shares issued) 732.9 732.9Additional paid-in capital 1,063.2 824.6Retained earnings 4,212.3 3,641.0Cumulative translation adjustments (1,136.2) (799.8)
5,238.7 4,774.9Unearned compensation (348.6) (355.5)Treasury stock, at cost (3,056.4) (2,333.8)
Total shareholders’ equity 1,833.7 2,085.6
$ 7,423.1 $ 7,685.2
Dollars in Millions Except Per Share Amounts
Brought to you by Global Reports
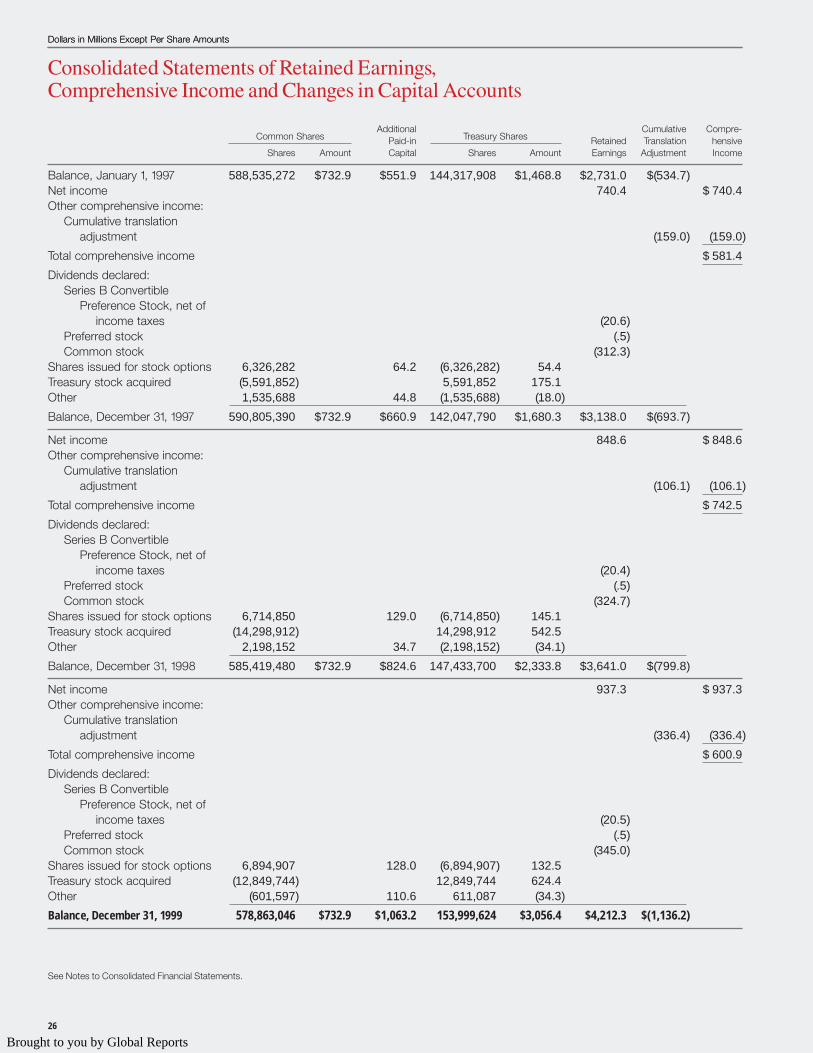
Dollars in Millions Except Per Share Amounts
26
See Notes to Consolidated Financial Statements.
Common SharesAdditional
Treasury SharesCumulative Compre-
Paid-in Retained Translation hensiveShares Amount Capital Shares Amount Earnings Adjustment Income
Balance, January 1, 1997 588,535,272 $732.9 $551.9 144,317,908 $1,468.8 $2,731.0 $(534.7)Net income 740.4 $ 740.4Other comprehensive income:
Cumulative translation adjustment (159.0) (159.0)
Total comprehensive income $ 581.4Dividends declared:
Series B ConvertiblePreference Stock, net of
income taxes (20.6)Preferred stock (.5)Common stock (312.3)
Shares issued for stock options 6,326,282 64.2 (6,326,282) 54.4Treasury stock acquired (5,591,852) 5,591,852 175.1Other 1,535,688 44.8 (1,535,688) (18.0)Balance, December 31, 1997 590,805,390 $732.9 $660.9 142,047,790 $1,680.3 $3,138.0 $(693.7)
Net income 848.6 $ 848.6Other comprehensive income:
Cumulative translation adjustment (106.1) (106.1)
Total comprehensive income $ 742.5Dividends declared:
Series B ConvertiblePreference Stock, net of
income taxes (20.4)Preferred stock (.5)Common stock (324.7)
Shares issued for stock options 6,714,850 129.0 (6,714,850) 145.1Treasury stock acquired (14,298,912) 14,298,912 542.5Other 2,198,152 34.7 (2,198,152) (34.1)Balance, December 31, 1998 585,419,480 $732.9 $824.6 147,433,700 $2,333.8 $3,641.0 $(799.8)
Net income 937.3 $ 937.3Other comprehensive income:
Cumulative translation adjustment (336.4) (336.4)
Total comprehensive income $ 600.9Dividends declared:
Series B ConvertiblePreference Stock, net of
income taxes (20.5)Preferred stock (.5)Common stock (345.0)
Shares issued for stock options 6,894,907 128.0 (6,894,907) 132.5Treasury stock acquired (12,849,744) 12,849,744 624.4Other (601,597) 110.6 611,087 (34.3)Balance, December 31, 1999 578,863,046 $732.9 $1,063.2 153,999,624 $3,056.4 $4,212.3 $(1,136.2)
Consolidated Statements of Retained Earnings, Comprehensive Income and Changes in Capital Accounts
Dollars in Millions Except Per Share Amounts
Brought to you by Global Reports
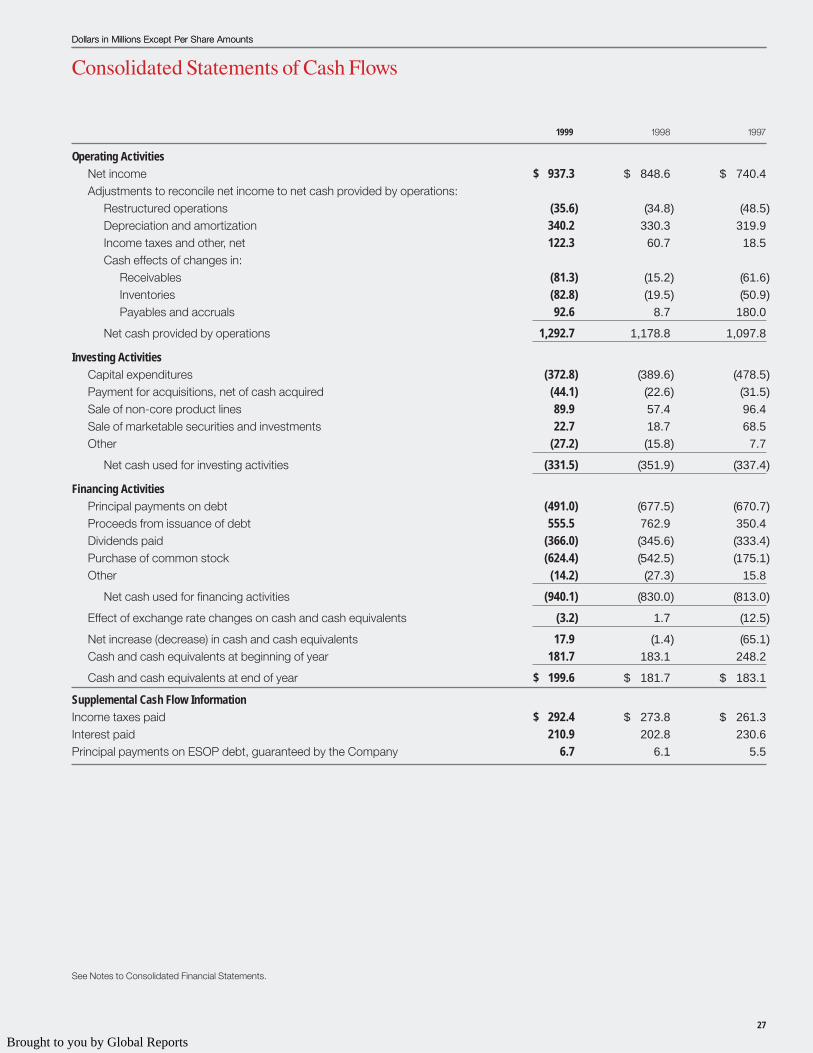
Dollars in Millions Except Per Share Amounts
27
1999 1998 1997
Operating ActivitiesNet income $ 937.3 $ 848.6 $ 740.4Adjustments to reconcile net income to net cash provided by operations:
Restructured operations (35.6) (34.8) (48.5)Depreciation and amortization 340.2 330.3 319.9Income taxes and other, net 122.3 60.7 18.5Cash effects of changes in:
Receivables (81.3) (15.2) (61.6)Inventories (82.8) (19.5) (50.9)Payables and accruals 92.6 8.7 180.0
Net cash provided by operations 1,292.7 1,178.8 1,097.8
Investing ActivitiesCapital expenditures (372.8) (389.6) (478.5)Payment for acquisitions, net of cash acquired (44.1) (22.6) (31.5)Sale of non-core product lines 89.9 57.4 96.4Sale of marketable securities and investments 22.7 18.7 68.5Other (27.2) (15.8) 7.7
Net cash used for investing activities (331.5) (351.9) (337.4)
Financing ActivitiesPrincipal payments on debt (491.0) (677.5) (670.7)Proceeds from issuance of debt 555.5 762.9 350.4Dividends paid (366.0) (345.6) (333.4)Purchase of common stock (624.4) (542.5) (175.1)Other (14.2) (27.3) 15.8
Net cash used for financing activities (940.1) (830.0) (813.0)
Effect of exchange rate changes on cash and cash equivalents (3.2) 1.7 (12.5)
Net increase (decrease) in cash and cash equivalents 17.9 (1.4) (65.1)Cash and cash equivalents at beginning of year 181.7 183.1 248.2
Cash and cash equivalents at end of year $ 199.6 $ 181.7 $ 183.1
Supplemental Cash Flow InformationIncome taxes paid $ 292.4 $ 273.8 $ 261.3Interest paid 210.9 202.8 230.6Principal payments on ESOP debt, guaranteed by the Company 6.7 6.1 5.5
Consolidated Statements of Cash Flows
See Notes to Consolidated Financial Statements.
Dollars in Millions Except Per Share Amounts
Brought to you by Global Reports
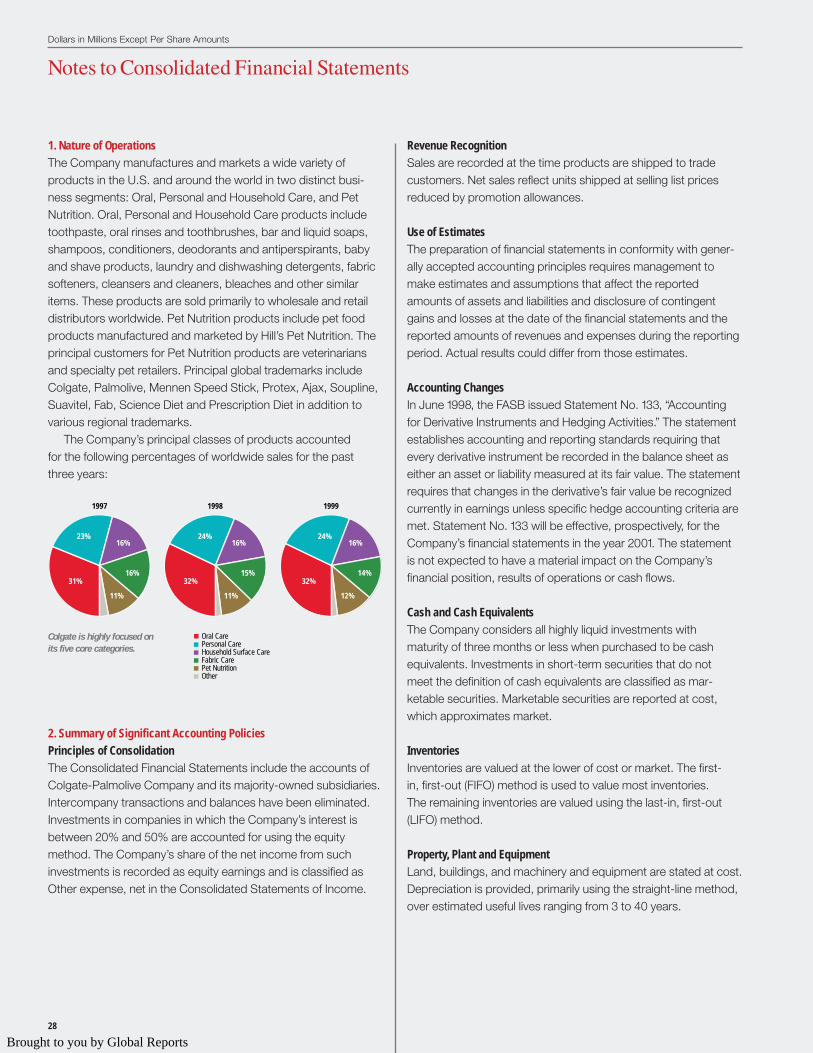
28
1. Nature of OperationsThe Company manufactures and markets a wide variety ofproducts in the U.S. and around the world in two distinct busi-ness segments: Oral, Personal and Household Care, and PetNutrition. Oral, Personal and Household Care products includetoothpaste, oral rinses and toothbrushes, bar and liquid soaps,shampoos, conditioners, deodorants and antiperspirants, babyand shave products, laundry and dishwashing detergents, fabricsofteners, cleansers and cleaners, bleaches and other similaritems. These products are sold primarily to wholesale and retaildistributors worldwide. Pet Nutrition products include pet foodproducts manufactured and marketed by Hill’s Pet Nutrition. Theprincipal customers for Pet Nutrition products are veterinariansand specialty pet retailers. Principal global trademarks includeColgate, Palmolive, Mennen Speed Stick, Protex, Ajax, Soupline,Suavitel, Fab, Science Diet and Prescription Diet in addition tovarious regional trademarks.
The Company’s principal classes of products accountedfor the following percentages of worldwide sales for the pastthree years:
2. Summary of Significant Accounting PoliciesPrinciples of ConsolidationThe Consolidated Financial Statements include the accounts ofColgate-Palmolive Company and its majority-owned subsidiaries.Intercompany transactions and balances have been eliminated.Investments in companies in which the Company’s interest isbetween 20% and 50% are accounted for using the equitymethod. The Company’s share of the net income from suchinvestments is recorded as equity earnings and is classified asOther expense, net in the Consolidated Statements of Income.
Oral CarePersonal CareHousehold Surface CareFabric CarePet NutritionOther
199919981997
23%
31%16%
16%
11%
24%
32%15%
16%
11%
24%
32%14%
16%
12%
Revenue RecognitionSales are recorded at the time products are shipped to tradecustomers. Net sales reflect units shipped at selling list pricesreduced by promotion allowances.
Use of EstimatesThe preparation of financial statements in conformity with gener-ally accepted accounting principles requires management tomake estimates and assumptions that affect the reportedamounts of assets and liabilities and disclosure of contingentgains and losses at the date of the financial statements and thereported amounts of revenues and expenses during the reportingperiod. Actual results could differ from those estimates.
Accounting ChangesIn June 1998, the FASB issued Statement No. 133, “Accountingfor Derivative Instruments and Hedging Activities.” The statementestablishes accounting and reporting standards requiring thatevery derivative instrument be recorded in the balance sheet aseither an asset or liability measured at its fair value. The statementrequires that changes in the derivative’s fair value be recognizedcurrently in earnings unless specific hedge accounting criteria aremet. Statement No. 133 will be effective, prospectively, for theCompany’s financial statements in the year 2001. The statementis not expected to have a material impact on the Company’sfinancial position, results of operations or cash flows.
Cash and Cash EquivalentsThe Company considers all highly liquid investments withmaturity of three months or less when purchased to be cashequivalents. Investments in short-term securities that do notmeet the definition of cash equivalents are classified as mar-ketable securities. Marketable securities are reported at cost,which approximates market.
InventoriesInventories are valued at the lower of cost or market. The first-in, first-out (FIFO) method is used to value most inventories.The remaining inventories are valued using the last-in, first-out(LIFO) method.
Property, Plant and EquipmentLand, buildings, and machinery and equipment are stated at cost.Depreciation is provided, primarily using the straight-line method,over estimated useful lives ranging from 3 to 40 years.
Dollars in Millions Except Per Share Amounts
Notes to Consolidated Financial Statements
Colgate is highly focused onits five core categories.
Brought to you by Global Reports
29
Goodwill and Other IntangiblesIntangible assets principally consist of goodwill, which is amor-tized on the straight-line method, generally over a period of 40years. Other intangible assets, principally non-compete agree-ments and customer lists, are amortized on the straight-linemethod over periods ranging from 5 to 20 years depending ontheir useful lives.
The recoverability of the carrying values of intangible assets isevaluated periodically based on a review of forecasted operatingcash flows and the profitability of the related business. For thethree-year period ended December 31, 1999, there were no mate-rial adjustments to the carrying values of intangible assets result-ing from these evaluations.
AdvertisingAdvertising costs are expensed in the year incurred.
Income TaxesDeferred taxes are recognized for the expected future tax conse-quences of temporary differences between the amounts carriedfor financial reporting and tax purposes. Provision is made cur-rently for taxes payable on remittances of overseas earnings; noprovision is made for taxes on overseas retained earnings that aredeemed to be permanently reinvested.
Translation of Overseas CurrenciesThe assets and liabilities of subsidiaries, other than thoseoperating in highly inflationary environments, are translatedinto U.S. dollars at year-end exchange rates, with resultingtranslation gains and losses accumulated in a separate compo-nent of shareholders’ equity. Income and expense items areconverted into U.S. dollars at average rates of exchangeprevailing during the year.
For subsidiaries operating in highly inflationary environments,inventories, goodwill, and property, plant and equipment aretranslated at the rate of exchange on the date the assets wereacquired, while other assets and liabilities are translated at year-end exchange rates. Translation adjustments for these operationsare included in net income.
Prior to 1999, Mexico was a highly inflationary economy andthe results of the Company’s Mexican operations were measuredusing the U.S. dollar as its functional currency. Effective January 1,1999, the Company ceased to account for its Mexican operationsas highly inflationary as historical inflation levels had fallen sharply.The impact of the change was not material to the Company’searnings.
During 1998, as required by generally accepted accountingprinciples, the Company ceased to account for its Brazilian oper-ations as highly inflationary. The effect of this change was toreduce shareholders’ equity by $98.4, primarily related to therecognition of deferred tax benefits expected to be realized in thefuture. Due to the devaluation of the Brazilian real during 1999,$242.4 was charged to cumulative translation adjustments which
was, in effect, a write-down of our foreign-currency-denominatedassets (primarily goodwill and property, plant and equipment).This will be accompanied by lower amortization and depreciationexpense in future periods.
Financial InstrumentsThe net effective cash payment of the interest rate swap con-tracts combined with the related interest payments on the debtthat they hedge are accounted for as interest expense. Thoseinterest rate instruments that do not qualify as hedge instrumentsfor accounting purposes are marked to market and recorded atfair value.
Gains and losses from foreign exchange contracts that hedgethe Company’s investments in its foreign subsidiaries are shownin the cumulative translation adjustments account included inshareholders’ equity. Gains and losses from contracts that hedgefirm commitments are recorded in the balance sheets as a com-ponent of the related receivable or payable until realized, at whichtime they are recognized in the statements of income. The con-tracts that hedge anticipated sales and purchases do not qualifyas hedges for accounting purposes. Accordingly, the relatedgains and losses are calculated using the current forward ratesand are recorded in the Consolidated Statements of Income asOther expense, net.
Segment InformationThe Company operates in two product segments: Oral, Personaland Household Care, and Pet Nutrition. The operations of theOral, Personal and Household Care segment are managed geo-graphically in four reportable operating segments: North America,Latin America, Europe and Asia/Africa.
Management measures segment profit as operating income,which is defined as income before interest expense and incometaxes. The accounting policies of the operating segments are thesame as those described in the summary of significant account-ing policies. Corporate operations include research and develop-ment costs, unallocated overhead costs, and gains and losses onsales of non-strategic brands and assets. Corporate assetsinclude primarily real estate and benefit plan assets.
The financial and descriptive information on the Company’sgeographic area and industry segment data, appearing in thetables contained in the Results of Operations, is an integral part ofthese financial statements.
3. Acquisitions and DivestituresDuring 1999, 1998 and 1997, the Company made several acquisi-tions totaling $46.4, $22.6 and $20.3, respectively. Individually,none of these acquisitions were significant.
The acquisitions were accounted for as purchases, and,accordingly, the purchase prices were allocated to the net tangi-ble and intangible assets acquired based on estimated fair valuesat the dates the acquisitions were consummated. The results ofoperations of the acquired businesses have been included in the
Dollars in Millions Except Per Share Amounts
Brought to you by Global Reports
30
Consolidated Financial Statements since the respective acquisi-tion dates. The inclusion of pro forma financial data for all acquisi-tions would not have materially affected the financial informationincluded herein.
The aggregate sale price of all 1999, 1998 and 1997 divestitureswas $94.7, $57.4 and $101.4, respectively. In 1999, the U.S. BabyMagic brand and related assets were sold for $90.0, and in 1998,the HandiWipes brand and related assets were sold for $53.0. In1997, the Sterno fuel brand and related assets were sold for $70.0.
4. Long-Term Debt and Credit FacilitiesLong-term debt consists of the following at December 31:
Weighted AverageInterest Rate Maturities 1999 1998
Notes 7.0% 2000-2028 $1,423.5 $1,382.4Commercial paper and
other short-term borrowings, reclassified 5.9 2000 477.3 461.2
ESOP notes, guaranteed by the Company 8.7 2001-2009 366.9 373.6
Payable to banks 6.5 2000-2007 313.7 361.8Capitalized leases .8 3.2
2,582.2 2,582.2Less: current portion of
long-term debt 338.9 281.6
$2,243.3 $2,300.6
Commercial paper and certain other short-term borrowings areclassified as long-term debt as it is the Company’s intent and abil-ity to refinance such obligations on a long-term basis. Scheduledmaturities of debt outstanding at December 31, 1999, excludingshort-term borrowings reclassified, are as follows: 2000—$338.9;2001—$192.5; 2002—$135.0; 2003—$409.8; 2004—$205.1, and$823.6 thereafter. The Company has entered into interest rateswap agreements and foreign exchange contracts related to cer-tain of these debt instruments (see Note 11).
At December 31, 1999, the Company had unused credit facili-ties amounting to $1,527.9. Commitment fees related to creditfacilities are not material. The weighted average interest rate onshort-term borrowings, excluding amounts reclassified, as ofDecember 31, 1999 and 1998, was 7.8% and 6.2%, respectively.
The Company’s long-term debt agreements include variousrestrictive covenants and require the maintenance of certaindefined financial ratios with which the Company is in compliance.
5. Capital Stock and Stock Compensation PlansPreferred StockPreferred Stock consists of 250,000 authorized shares withoutpar value. It is issuable in series, of which one series of 125,000shares, designated $4.25 Preferred Stock, with a stated andredeemable value of $100 per share, has been issued. The $4.25Preferred Stock is redeemable only at the option of the Company.
At December 31, 1999 and 1998, 115,510 and 122,620 shares of$4.25 Preferred Stock, respectively, were outstanding.
Preference StockIn 1988, the Company authorized the issuance of 50,000,000shares of Preference Stock, without par value. The Series BConvertible Preference Stock, which is convertible into eightshares of common stock, ranks junior to all series of the PreferredStock. At December 31, 1999 and 1998, 5,446,442 and 5,598,808shares of Series B Convertible Preference Stock, respectively,were outstanding and issued to the Company’s Employee StockOwnership Plan.
Common StockOn May 5, 1999, the Company’s Board of Directors approved atwo-for-one common stock split effected in the form of a 100%stock dividend. As a result of the split, shareholders received oneadditional share of common stock for each share they held as ofMay 19, 1999, which was distributed June 30, 1999. Par valueremained at $1 per share. The Consolidated Financial Statementsand financial information contained elsewhere in this report havebeen restated to reflect the effect of the common stock split for allperiods presented.
Shareholder Rights PlanUnder the Company’s Shareholder Rights Plan, each share ofthe Company’s common stock carries with it one PreferenceShare Purchase Right (“Rights”). The Rights themselves will atno time have voting power or pay dividends. The Rights becomeexercisable only if a person or group acquires 15% or more ofthe Company’s common stock or announces a tender offer, theconsummation of which would result in ownership by a person orgroup of 15% or more of the common stock. When exercisable,each Right entitles a holder to buy one two-hundredth of a shareof a new series of preference stock at an exercise price of$220.00, subject to adjustment.
If the Company is acquired in a merger or other business com-bination, each Right will entitle a holder to buy, at the Right’s thencurrent exercise price, a number of the acquiring company’scommon shares having a market value of twice such price. Inaddition, if a person or group acquires 15% or more of the Com-pany’s common stock, each Right will entitle its holder (other thansuch person or members of such group) to purchase, at theRight’s then current exercise price, a number of shares of theCompany’s common stock having a market value of twice theRight’s exercise price.
Further, at any time after a person or group acquires 15%or more (but less than 50%) of the Company’s common stock,the Board of Directors may, at its option, exchange part or allof the Rights (other than Rights held by the acquiring person orgroup) for shares of the Company’s common stock on a one-for-one basis.
Dollars in Millions Except Per Share Amounts
Brought to you by Global Reports
31
The Company, at the option of its Board of Directors, mayamend the Rights or redeem the Rights for $.01 at any timebefore the acquisition by a person or group of beneficialownership of 15% or more of its common stock. The Board ofDirectors is also authorized to reduce the 15% threshold to notless than 10%. Unless redeemed earlier, the Rights will expire onOctober 31, 2008.
Stock RepurchasesDuring 1998, the Company entered into a series of forward pur-chase agreements on its common stock. These agreements aresettled on a net basis in shares of the Company’s common stock.To the extent that the market price of the Company’s commonstock on a settlement date is higher/(lower) than the forward pur-chase price, the net differential is received/(paid) by the Company.As of December 31, 1999, agreements were in place coveringapproximately $480.5 of the Company’s common stock (7.7 mil-lion shares) that had forward prices averaging $62.56 per share. Ifthese agreements were settled based on the December 31, 1999market price of the Company’s common stock ($65.00 pershare), the Company would be entitled to receive approximately288,000 shares. During 1999 and 1998, settlements resulted inthe Company receiving 2,322,701 and 642,662 shares, respec-tively, which were recorded as treasury stock.
The Company applies Accounting Principles Board Opinion No.25, “Accounting for Stock Issued to Employees,” and related inter-pretations in accounting for options granted under the Plans.Accordingly, no compensation expense has been recognized.Had compensation expense been determined based on theBlack-Scholes option pricing model value at the grant date forawards in 1999, 1998 and 1997 consistent with the provisions of
Incentive Stock PlanThe Company has a plan which provides for grants of restrictedstock awards for officers and other executives of the Companyand its major subsidiaries. A committee of non-employee mem-bers of the Board of Directors administers the plan. During 1999and 1998, 692,238 and 570,154 shares, respectively, were awardedto employees in accordance with the provisions of the plan.
Stock Option PlansThe Company’s Stock Option Plans (“Plans”) provide for theissuance of non-qualified stock options to officers and keyemployees. Options are granted at prices not less than the fairmarket value on the date of grant. At 1999 year-end, 31,119,432shares of common stock were available for future grants.
The Plans contain an accelerated ownership feature whichprovides for the grant of new options when previously ownedshares of Company stock are used to exercise existing options.The number of new options granted under this feature is equal tothe number of shares of previously owned Company stock usedto exercise the original options and to pay the related requiredU.S. income tax. The new options are granted at a price equal tothe fair market value on the date of the new grant and have thesame expiration date as the original options exercised.
Stock option plan activity is summarized below:
Statement of Financial Accounting Standards No. 123, “Account-ing for Stock-Based Compensation” (SFAS 123), the Company’snet income, basic earnings per common share and diluted earn-ings per common share would have been $891.9, $1.49 per shareand $1.40 per share, respectively, in 1999; $803.5, $1.33 per shareand $1.25 per share, respectively, in 1998; and $716.1, $1.18 pershare and $1.10 per share, respectively, in 1997.
Dollars in Millions Except Per Share Amounts
1999 1998 1997
Weighted Average Weighted Average Weighted AverageShares Exercise Price Shares Exercise Price Shares Exercise Price
Options outstanding, January 1 42,786,246 $28 45,534,784 $23 42,830,396 $16Granted 11,414,328 53 12,537,288 39 15,406,114 37Exercised (14,586,597) 26 (14,917,508) 22 (12,190,554) 16Canceled or expired (417,880) 49 (368,318) 21 (511,172) 19
Options outstanding, December 31 39,196,097 36 42,786,246 28 45,534,784 23
Options exercisable, December 31 23,813,363 $28 26,688,764 $23 29,366,358 $19
The following table summarizes information relating to currently outstanding and exercisable options as of December 31, 1999:
Weighted AverageRange of Remaining Contractual Options Weighted Average Options Weighted AverageExercise Prices Life In Years Outstanding Exercise Price Exercisable Exercise Price
$ 8.04 – $17.17 4 6,271,637 $15 6,271,637 $15$17.53 – $24.95 5 6,888,774 21 6,888,774 21$24.98 – $31.08 8 3,911,523 31 2,238,830 31$31.33 – $43.66 8 8,221,126 36 4,242,264 37$43.67 – $53.02 6 6,581,369 50 4,170,408 49$53.06 – $62.50 8 7,321,668 56 1,450 56
6 39,196,097 $36 23,813,363 $28
Brought to you by Global Reports
32
The weighted average Black-Scholes value of grants issued in1999, 1998 and 1997 was $8.61, $6.24 and $3.93, respectively. TheBlack-Scholes value of each option granted is estimated usingthe Black-Scholes option pricing model with the followingassumptions: option term until exercise ranging from 2 to 7 years,volatility ranging from 19% to 30%, risk-free interest rate rangingfrom 5.0% to 6.2% and an expected dividend yield of 2.5%. TheBlack-Scholes model used to determine the option values shownabove was developed to estimate the fair value of short-termfreely tradable, fully transferable options without vesting restric-tions and was not designed to value reloads, all of which signifi-cantly differ from the Company’s stock option awards. The valueof this model is also limited by the inclusion of highly subjectiveassumptions which greatly affect calculated values.
6. Employee Stock Ownership PlanIn 1989, the Company expanded its Employee Stock OwnershipPlan (“ESOP”) through the introduction of a leveraged ESOP cov-ering certain employees who have met certain eligibility require-ments. The ESOP issued $410.0 of long-term notes due through2009 bearing an average interest rate of 8.7%. The long-termnotes, which are guaranteed by the Company, are reflected in theaccompanying Consolidated Balance Sheets. The ESOP usedthe proceeds of the notes to purchase 6.3 million shares of SeriesB Convertible Preference Stock from the Company. The Stockhas a minimum redemption price of $65 per share and payssemiannual dividends equal to the higher of $2.44 or the currentdividend paid on eight common shares for the comparablesix-month period.
Dividends on these preferred shares, as well as commonshares also held by the ESOP, are paid to the ESOP trust and,together with contributions, are used by the ESOP to repay prin-cipal and interest on the outstanding notes. Preferred shares arereleased for allocation to participants based upon the ratio of thecurrent year’s debt service to the sum of total principal and inter-est payments over the life of the loan. At December 31, 1999,1,628,735 shares were allocated to participant accounts and3,817,707 shares were available for future allocation. Each allo-cated share may be converted by the trustee into eight commonshares but preferred shares generally convert only after theemployee ceases to work for the Company.
Dividends on these preferred shares are deductible for incometax purposes and, accordingly, are reflected net of their tax bene-fit in the Consolidated Statements of Retained Earnings, Compre-hensive Income and Changes in Capital Accounts.
Annual expense related to the leveraged ESOP, determined asinterest incurred on the notes, less employee contributions anddividends received on the shares held by the ESOP, plus thehigher of either principal repayments on the notes or the cost ofshares allocated, was $9.2 in 1999, $2.4 in 1998 and $3.0 in 1997.Similarly, unearned compensation, shown as a reduction in share-holders’ equity, is reduced by the higher of principal payments orthe cost of shares allocated.
Interest incurred on the ESOP’s notes amounted to $32.0 in1999, $32.5 in 1998 and $33.0 in 1997. The Company paid divi-dends on the stock held by the ESOP of $29.1 in 1999, $29.3 in1998 and $29.8 in 1997. Company contributions to the ESOP were$9.3 in 1999, $0 in 1998 and $1.0 in 1997. Employee contributionsto the ESOP were $.6 in 1999, $9.4 in 1998 and $8.2 in 1997.
7. Retirement Plans and Other Retiree BenefitsRetirement PlansThe Company, its U.S. subsidiaries and some of its overseas sub-sidiaries maintain defined benefit retirement plans covering sub-stantially all of their employees. Benefits are based primarily onyears of service and employees’ career earnings. In the Com-pany’s principal U.S. plans, funds are contributed to the trusts inaccordance with regulatory limits to provide for current serviceand for any unfunded projected benefit obligation over a reason-able period. To the extent these requirements are exceeded byplan assets, a contribution may not be made in a particular year.Assets of the plans consist principally of common stocks, guaran-teed investment contracts with insurance companies, invest-ments in real estate funds, and U.S. Government and corporateobligations. Domestic plan assets also include investments in theCompany’s common stock representing 10% and 7% of planassets at December 31, 1999 and 1998, respectively.
Other Retiree BenefitsThe Company and certain of its subsidiaries provide health careand life insurance benefits for retired employees to the extent notprovided by government-sponsored plans. The Company utilizesa portion of its leveraged ESOP, in the form of future retiree contri-butions, to reduce its obligation to provide these postretirementbenefits and offset its current service cost. Postretirement bene-fits otherwise are not currently funded.
Dollars in Millions Except Per Share Amounts
Brought to you by Global Reports
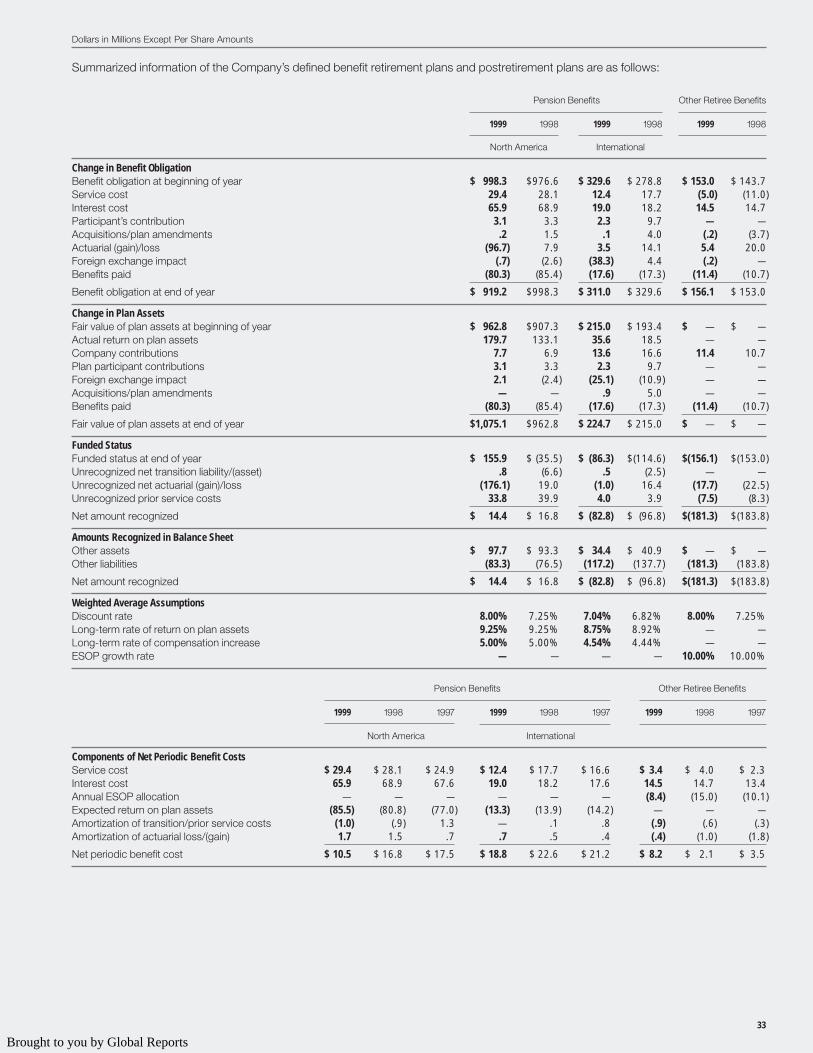
33
Dollars in Millions Except Per Share Amounts
Summarized information of the Company’s defined benefit retirement plans and postretirement plans are as follows:
Pension Benefits Other Retiree Benefits
1999 1998 1999 1998 1999 1998
North America International
Change in Benefit ObligationBenefit obligation at beginning of year $ 998.3 $976.6 $ 329.6 $ 278.8 $ 153.0 $ 143.7Service cost 29.4 28.1 12.4 17.7 (5.0) (11.0)Interest cost 65.9 68.9 19.0 18.2 14.5 14.7Participant’s contribution 3.1 3.3 2.3 9.7 — —Acquisitions/plan amendments .2 1.5 .1 4.0 (.2) (3.7)Actuarial (gain)/loss (96.7) 7.9 3.5 14.1 5.4 20.0Foreign exchange impact (.7) (2.6) (38.3) 4.4 (.2) —Benefits paid (80.3) (85.4) (17.6) (17.3) (11.4) (10.7)
Benefit obligation at end of year $ 919.2 $998.3 $ 311.0 $ 329.6 $ 156.1 $ 153.0
Change in Plan AssetsFair value of plan assets at beginning of year $ 962.8 $907.3 $ 215.0 $ 193.4 $ — $ —Actual return on plan assets 179.7 133.1 35.6 18.5 — —Company contributions 7.7 6.9 13.6 16.6 11.4 10.7Plan participant contributions 3.1 3.3 2.3 9.7 — —Foreign exchange impact 2.1 (2.4) (25.1) (10.9) — —Acquisitions/plan amendments — — .9 5.0 — —Benefits paid (80.3) (85.4) (17.6) (17.3) (11.4) (10.7)
Fair value of plan assets at end of year $1,075.1 $962.8 $ 224.7 $ 215.0 $ — $ —
Funded StatusFunded status at end of year $ 155.9 $ (35.5) $ (86.3) $(114.6) $(156.1) $(153.0)Unrecognized net transition liability/(asset) .8 (6.6) .5 (2.5) — —Unrecognized net actuarial (gain)/loss (176.1) 19.0 (1.0) 16.4 (17.7) (22.5)Unrecognized prior service costs 33.8 39.9 4.0 3.9 (7.5) (8.3)
Net amount recognized $ 14.4 $ 16.8 $ (82.8) $ (96.8) $(181.3) $(183.8)
Amounts Recognized in Balance SheetOther assets $ 97.7 $ 93.3 $ 34.4 $ 40.9 $ — $ —Other liabilities (83.3) (76.5) (117.2) (137.7) (181.3) (183.8)
Net amount recognized $ 14.4 $ 16.8 $ (82.8) $ (96.8) $(181.3) $(183.8)
Weighted Average AssumptionsDiscount rate 8.00% 7.25% 7.04% 6.82% 8.00% 7.25%Long-term rate of return on plan assets 9.25% 9.25% 8.75% 8.92% — —Long-term rate of compensation increase 5.00% 5.00% 4.54% 4.44% — —ESOP growth rate — — — — 10.00% 10.00%
Pension Benefits Other Retiree Benefits
1999 1998 1997 1999 1998 1997 1999 1998 1997
North America International
Components of Net Periodic Benefit CostsService cost $ 29.4 $ 28.1 $ 24.9 $ 12.4 $ 17.7 $ 16.6 $ 3.4 $ 4.0 $ 2.3Interest cost 65.9 68.9 67.6 19.0 18.2 17.6 14.5 14.7 13.4Annual ESOP allocation — — — — — — (8.4) (15.0) (10.1)Expected return on plan assets (85.5) (80.8) (77.0) (13.3) (13.9) (14.2) — — —Amortization of transition/prior service costs (1.0) (.9) 1.3 — .1 .8 (.9) (.6) (.3)Amortization of actuarial loss/(gain) 1.7 1.5 .7 .7 .5 .4 (.4) (1.0) (1.8)
Net periodic benefit cost $ 10.5 $ 16.8 $ 17.5 $ 18.8 $ 22.6 $ 21.2 $ 8.2 $ 2.1 $ 3.5
Brought to you by Global Reports
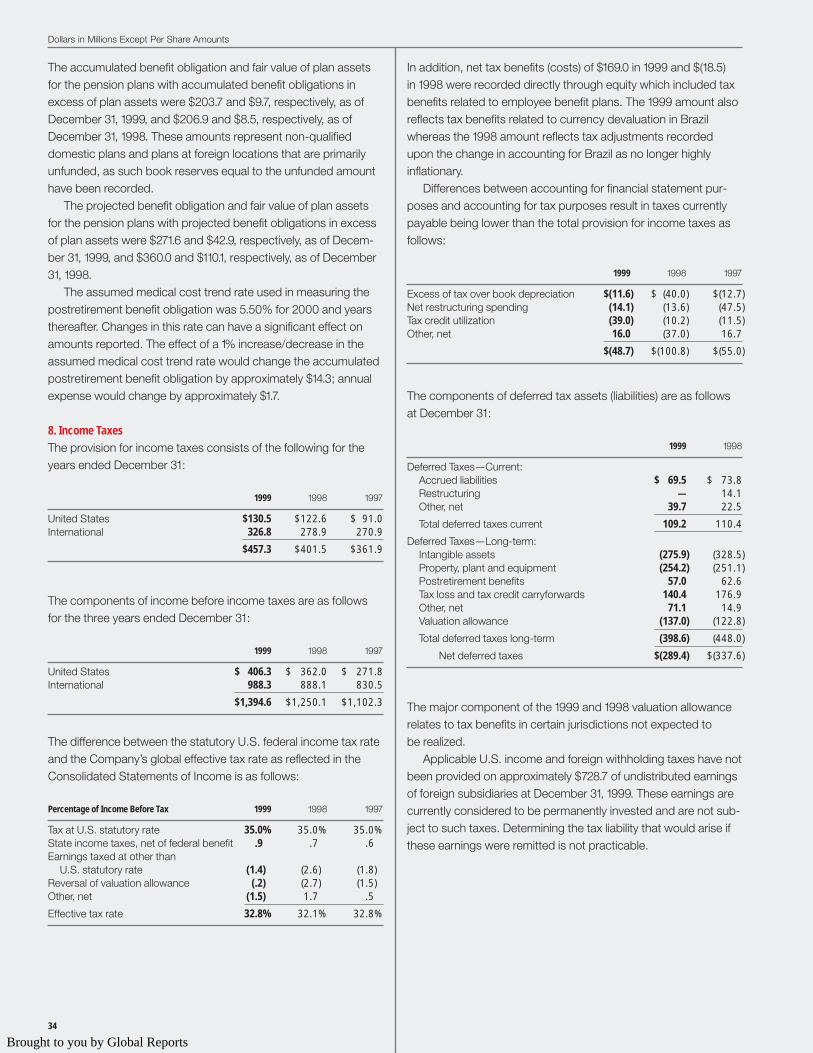
34
The accumulated benefit obligation and fair value of plan assetsfor the pension plans with accumulated benefit obligations inexcess of plan assets were $203.7 and $9.7, respectively, as ofDecember 31, 1999, and $206.9 and $8.5, respectively, as ofDecember 31, 1998. These amounts represent non-qualifieddomestic plans and plans at foreign locations that are primarilyunfunded, as such book reserves equal to the unfunded amounthave been recorded.
The projected benefit obligation and fair value of plan assetsfor the pension plans with projected benefit obligations in excessof plan assets were $271.6 and $42.9, respectively, as of Decem-ber 31, 1999, and $360.0 and $110.1, respectively, as of December31, 1998.
The assumed medical cost trend rate used in measuring thepostretirement benefit obligation was 5.50% for 2000 and yearsthereafter. Changes in this rate can have a significant effect onamounts reported. The effect of a 1% increase/decrease in theassumed medical cost trend rate would change the accumulatedpostretirement benefit obligation by approximately $14.3; annualexpense would change by approximately $1.7.
8. Income TaxesThe provision for income taxes consists of the following for theyears ended December 31:
1999 1998 1997
United States $130.5 $122.6 $ 91.0International 326.8 278.9 270.9
$457.3 $401.5 $361.9
The components of income before income taxes are as followsfor the three years ended December 31:
1999 1998 1997
United States $ 406.3 $ 362.0 $ 271.8International 988.3 888.1 830.5
$1,394.6 $1,250.1 $1,102.3
The difference between the statutory U.S. federal income tax rateand the Company’s global effective tax rate as reflected in theConsolidated Statements of Income is as follows:
Percentage of Income Before Tax 1999 1998 1997
Tax at U.S. statutory rate 35.0% 35.0% 35.0%State income taxes, net of federal benefit .9 .7 .6Earnings taxed at other than
U.S. statutory rate (1.4) (2.6) (1.8)Reversal of valuation allowance (.2) (2.7) (1.5)Other, net (1.5) 1.7 .5
Effective tax rate 32.8% 32.1% 32.8%
In addition, net tax benefits (costs) of $169.0 in 1999 and $(18.5)in 1998 were recorded directly through equity which included taxbenefits related to employee benefit plans. The 1999 amount alsoreflects tax benefits related to currency devaluation in Brazilwhereas the 1998 amount reflects tax adjustments recordedupon the change in accounting for Brazil as no longer highlyinflationary.
Differences between accounting for financial statement pur-poses and accounting for tax purposes result in taxes currentlypayable being lower than the total provision for income taxes asfollows:
1999 1998 1997
Excess of tax over book depreciation $(11.6) $ (40.0) $(12.7)Net restructuring spending (14.1) (13.6) (47.5)Tax credit utilization (39.0) (10.2) (11.5)Other, net 16.0 (37.0) 16.7
$(48.7) $(100.8) $(55.0)
The components of deferred tax assets (liabilities) are as followsat December 31:
1999 1998
Deferred Taxes—Current:Accrued liabilities $ 69.5 $ 73.8Restructuring — 14.1Other, net 39.7 22.5
Total deferred taxes current 109.2 110.4
Deferred Taxes—Long-term:Intangible assets (275.9) (328.5)Property, plant and equipment (254.2) (251.1)Postretirement benefits 57.0 62.6Tax loss and tax credit carryforwards 140.4 176.9Other, net 71.1 14.9Valuation allowance (137.0) (122.8)
Total deferred taxes long-term (398.6) (448.0)
Net deferred taxes $(289.4) $(337.6)
The major component of the 1999 and 1998 valuation allowancerelates to tax benefits in certain jurisdictions not expected tobe realized.
Applicable U.S. income and foreign withholding taxes have notbeen provided on approximately $728.7 of undistributed earningsof foreign subsidiaries at December 31, 1999. These earnings arecurrently considered to be permanently invested and are not sub-ject to such taxes. Determining the tax liability that would arise ifthese earnings were remitted is not practicable.
Dollars in Millions Except Per Share Amounts
Brought to you by Global Reports
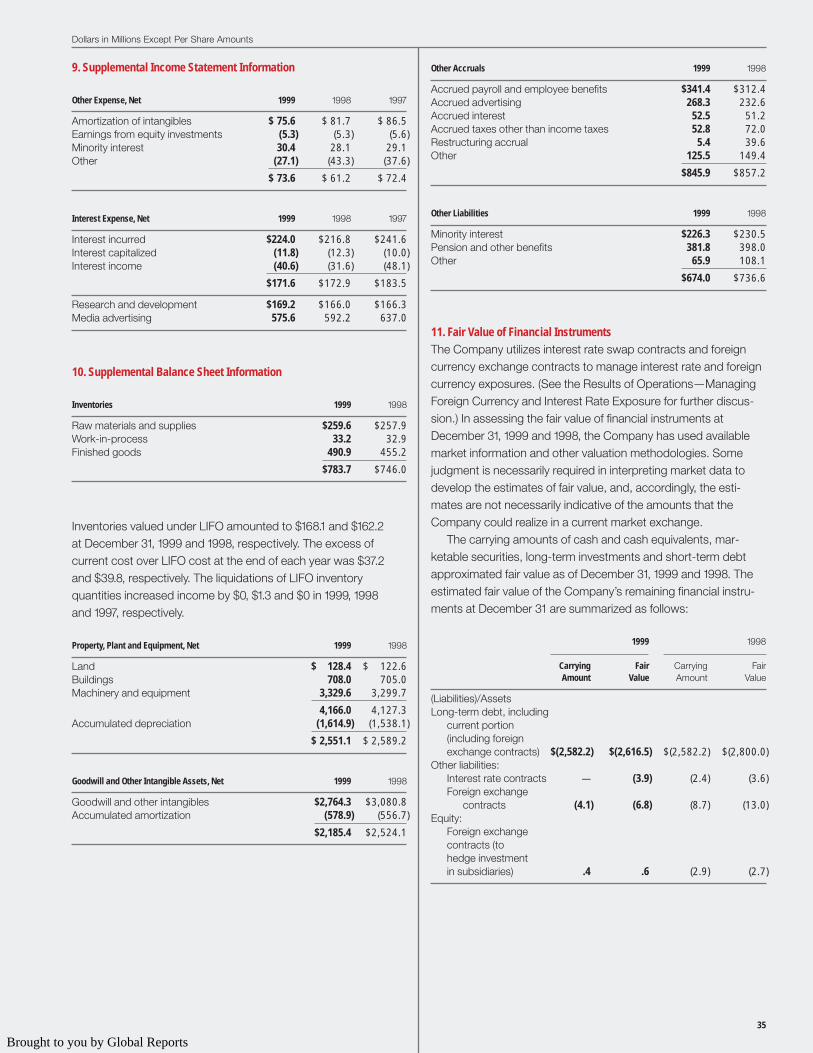
35
9. Supplemental Income Statement Information
Other Expense, Net 1999 1998 1997
Amortization of intangibles $ 75.6 $ 81.7 $ 86.5Earnings from equity investments (5.3) (5.3) (5.6)Minority interest 30.4 28.1 29.1Other (27.1) (43.3) (37.6)
$ 73.6 $ 61.2 $ 72.4
Interest Expense, Net 1999 1998 1997
Interest incurred $224.0 $216.8 $241.6Interest capitalized (11.8) (12.3) (10.0)Interest income (40.6) (31.6) (48.1)
$171.6 $172.9 $183.5
Research and development $169.2 $166.0 $166.3Media advertising 575.6 592.2 637.0
10. Supplemental Balance Sheet Information
Inventories 1999 1998
Raw materials and supplies $259.6 $257.9Work-in-process 33.2 32.9Finished goods 490.9 455.2
$783.7 $746.0
Inventories valued under LIFO amounted to $168.1 and $162.2at December 31, 1999 and 1998, respectively. The excess ofcurrent cost over LIFO cost at the end of each year was $37.2and $39.8, respectively. The liquidations of LIFO inventoryquantities increased income by $0, $1.3 and $0 in 1999, 1998and 1997, respectively.
Property, Plant and Equipment, Net 1999 1998
Land $ 128.4 $ 122.6Buildings 708.0 705.0Machinery and equipment 3,329.6 3,299.7
4,166.0 4,127.3Accumulated depreciation (1,614.9) (1,538.1)
$ 2,551.1 $ 2,589.2
Goodwill and Other Intangible Assets, Net 1999 1998
Goodwill and other intangibles $2,764.3 $3,080.8Accumulated amortization (578.9) (556.7)
$2,185.4 $2,524.1
Other Accruals 1999 1998
Accrued payroll and employee benefits $341.4 $312.4Accrued advertising 268.3 232.6Accrued interest 52.5 51.2Accrued taxes other than income taxes 52.8 72.0Restructuring accrual 5.4 39.6Other 125.5 149.4
$845.9 $857.2
Other Liabilities 1999 1998
Minority interest $226.3 $230.5Pension and other benefits 381.8 398.0Other 65.9 108.1
$674.0 $736.6
11. Fair Value of Financial InstrumentsThe Company utilizes interest rate swap contracts and foreigncurrency exchange contracts to manage interest rate and foreigncurrency exposures. (See the Results of Operations—ManagingForeign Currency and Interest Rate Exposure for further discus-sion.) In assessing the fair value of financial instruments atDecember 31, 1999 and 1998, the Company has used availablemarket information and other valuation methodologies. Somejudgment is necessarily required in interpreting market data todevelop the estimates of fair value, and, accordingly, the esti-mates are not necessarily indicative of the amounts that theCompany could realize in a current market exchange.
The carrying amounts of cash and cash equivalents, mar-ketable securities, long-term investments and short-term debtapproximated fair value as of December 31, 1999 and 1998. Theestimated fair value of the Company’s remaining financial instru-ments at December 31 are summarized as follows:
1999 1998
Carrying Fair Carrying FairAmount Value Amount Value
(Liabilities)/AssetsLong-term debt, including
current portion (including foreign exchange contracts) $(2,582.2) $(2,616.5) $(2,582.2) $(2,800.0)
Other liabilities:Interest rate contracts — (3.9) (2.4) (3.6)Foreign exchange
contracts (4.1) (6.8) (8.7) (13.0)Equity:
Foreign exchange contracts (to hedge investment in subsidiaries) .4 .6 (2.9) (2.7)
Dollars in Millions Except Per Share Amounts
Brought to you by Global Reports
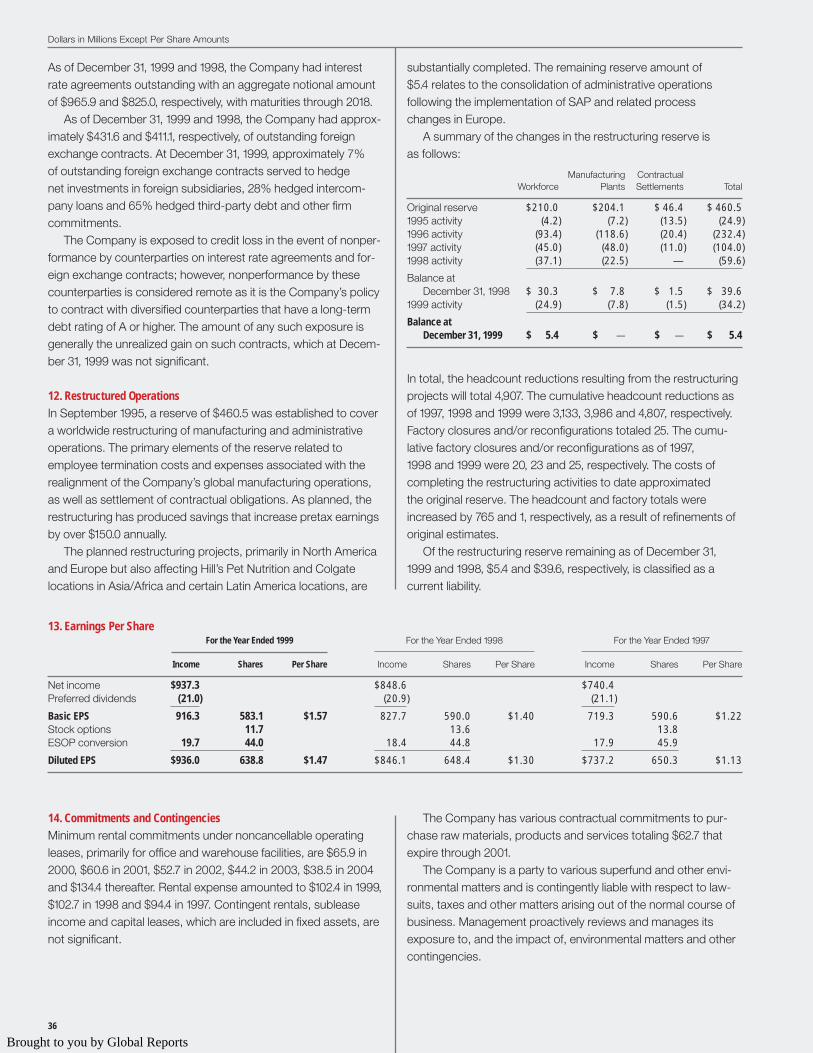
36
As of December 31, 1999 and 1998, the Company had interestrate agreements outstanding with an aggregate notional amountof $965.9 and $825.0, respectively, with maturities through 2018.
As of December 31, 1999 and 1998, the Company had approx-imately $431.6 and $411.1, respectively, of outstanding foreignexchange contracts. At December 31, 1999, approximately 7%of outstanding foreign exchange contracts served to hedgenet investments in foreign subsidiaries, 28% hedged intercom-pany loans and 65% hedged third-party debt and other firmcommitments.
The Company is exposed to credit loss in the event of nonper-formance by counterparties on interest rate agreements and for-eign exchange contracts; however, nonperformance by thesecounterparties is considered remote as it is the Company’s policyto contract with diversified counterparties that have a long-termdebt rating of A or higher. The amount of any such exposure isgenerally the unrealized gain on such contracts, which at Decem-ber 31, 1999 was not significant.
12. Restructured OperationsIn September 1995, a reserve of $460.5 was established to covera worldwide restructuring of manufacturing and administrativeoperations. The primary elements of the reserve related toemployee termination costs and expenses associated with therealignment of the Company’s global manufacturing operations,as well as settlement of contractual obligations. As planned, therestructuring has produced savings that increase pretax earningsby over $150.0 annually.
The planned restructuring projects, primarily in North Americaand Europe but also affecting Hill’s Pet Nutrition and Colgatelocations in Asia/Africa and certain Latin America locations, are
14. Commitments and ContingenciesMinimum rental commitments under noncancellable operatingleases, primarily for office and warehouse facilities, are $65.9 in2000, $60.6 in 2001, $52.7 in 2002, $44.2 in 2003, $38.5 in 2004and $134.4 thereafter. Rental expense amounted to $102.4 in 1999,$102.7 in 1998 and $94.4 in 1997. Contingent rentals, subleaseincome and capital leases, which are included in fixed assets, arenot significant.
The Company has various contractual commitments to pur-chase raw materials, products and services totaling $62.7 thatexpire through 2001.
The Company is a party to various superfund and other envi-ronmental matters and is contingently liable with respect to law-suits, taxes and other matters arising out of the normal course ofbusiness. Management proactively reviews and manages itsexposure to, and the impact of, environmental matters and othercontingencies.
substantially completed. The remaining reserve amount of$5.4 relates to the consolidation of administrative operationsfollowing the implementation of SAP and related processchanges in Europe.
A summary of the changes in the restructuring reserve isas follows:
Manufacturing ContractualWorkforce Plants Settlements Total
Original reserve $210.0 $204.1 $ 46.4 $ 460.51995 activity (4.2) (7.2) (13.5) (24.9)1996 activity (93.4) (118.6) (20.4) (232.4)1997 activity (45.0) (48.0) (11.0) (104.0)1998 activity (37.1) (22.5) — (59.6)
Balance at December 31, 1998 $ 30.3 $ 7.8 $ 1.5 $ 39.6
1999 activity (24.9) (7.8) (1.5) (34.2)
Balance atDecember 31, 1999 $ 5.4 $ — $ — $ 5.4
In total, the headcount reductions resulting from the restructuringprojects will total 4,907. The cumulative headcount reductions asof 1997, 1998 and 1999 were 3,133, 3,986 and 4,807, respectively.Factory closures and/or reconfigurations totaled 25. The cumu-lative factory closures and/or reconfigurations as of 1997,1998 and 1999 were 20, 23 and 25, respectively. The costs ofcompleting the restructuring activities to date approximatedthe original reserve. The headcount and factory totals wereincreased by 765 and 1, respectively, as a result of refinements oforiginal estimates.
Of the restructuring reserve remaining as of December 31,1999 and 1998, $5.4 and $39.6, respectively, is classified as acurrent liability.
Dollars in Millions Except Per Share Amounts
13. Earnings Per ShareFor the Year Ended 1999 For the Year Ended 1998 For the Year Ended 1997
Income Shares Per Share Income Shares Per Share Income Shares Per Share
Net income $937.3 $848.6 $740.4Preferred dividends (21.0) (20.9) (21.1)
Basic EPS 916.3 583.1 $1.57 827.7 590.0 $1.40 719.3 590.6 $1.22Stock options 11.7 13.6 13.8ESOP conversion 19.7 44.0 18.4 44.8 17.9 45.9
Diluted EPS $936.0 638.8 $1.47 $846.1 648.4 $1.30 $737.2 650.3 $1.13
Brought to you by Global Reports
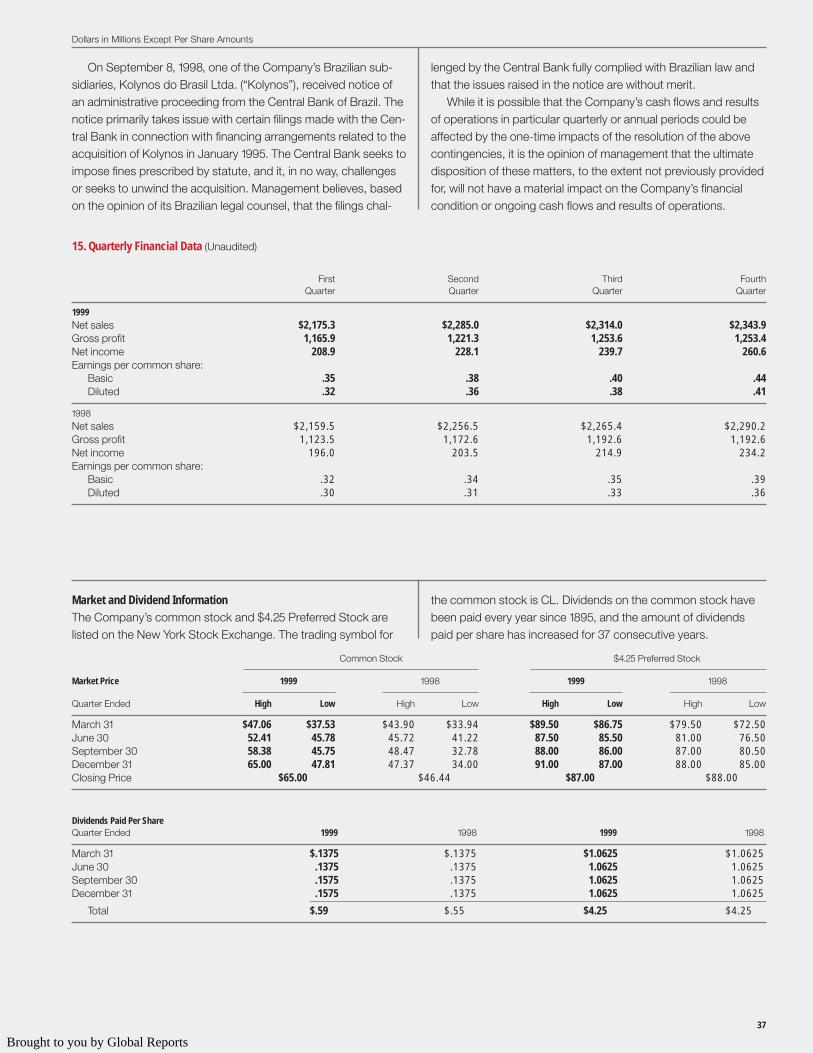
37
On September 8, 1998, one of the Company’s Brazilian sub-sidiaries, Kolynos do Brasil Ltda. (“Kolynos”), received notice ofan administrative proceeding from the Central Bank of Brazil. Thenotice primarily takes issue with certain filings made with the Cen-tral Bank in connection with financing arrangements related to theacquisition of Kolynos in January 1995. The Central Bank seeks toimpose fines prescribed by statute, and it, in no way, challengesor seeks to unwind the acquisition. Management believes, basedon the opinion of its Brazilian legal counsel, that the filings chal-
Market and Dividend InformationThe Company’s common stock and $4.25 Preferred Stock arelisted on the New York Stock Exchange. The trading symbol for
lenged by the Central Bank fully complied with Brazilian law andthat the issues raised in the notice are without merit.
While it is possible that the Company’s cash flows and resultsof operations in particular quarterly or annual periods could beaffected by the one-time impacts of the resolution of the abovecontingencies, it is the opinion of management that the ultimatedisposition of these matters, to the extent not previously providedfor, will not have a material impact on the Company’s financialcondition or ongoing cash flows and results of operations.
the common stock is CL. Dividends on the common stock havebeen paid every year since 1895, and the amount of dividendspaid per share has increased for 37 consecutive years.
Dollars in Millions Except Per Share Amounts
15. Quarterly Financial Data (Unaudited)
First Second Third FourthQuarter Quarter Quarter Quarter
1999Net sales $2,175.3 $2,285.0 $2,314.0 $2,343.9Gross profit 1,165.9 1,221.3 1,253.6 1,253.4Net income 208.9 228.1 239.7 260.6Earnings per common share:
Basic .35 .38 .40 .44Diluted .32 .36 .38 .41
1998Net sales $2,159.5 $2,256.5 $2,265.4 $2,290.2Gross profit 1,123.5 1,172.6 1,192.6 1,192.6Net income 196.0 203.5 214.9 234.2Earnings per common share:
Basic .32 .34 .35 .39Diluted .30 .31 .33 .36
Common Stock $4.25 Preferred Stock
Market Price 1999 1998 1999 1998
Quarter Ended High Low High Low High Low High Low
March 31 $47.06 $37.53 $43.90 $33.94 $89.50 $86.75 $79.50 $72.50June 30 52.41 45.78 45.72 41.22 87.50 85.50 81.00 76.50September 30 58.38 45.75 48.47 32.78 88.00 86.00 87.00 80.50December 31 65.00 47.81 47.37 34.00 91.00 87.00 88.00 85.00Closing Price $65.00 $46.44 $87.00 $88.00
Dividends Paid Per ShareQuarter Ended 1999 1998 1999 1998
March 31 $.1375 $.1375 $1.0625 $1.0625June 30 .1375 .1375 1.0625 1.0625September 30 .1575 .1375 1.0625 1.0625December 31 .1575 .1375 1.0625 1.0625
Total $.59 $.55 $4.25 $4.25
Brought to you by Global Reports
40
ShareholderInformation
Corporate OfficesColgate-Palmolive Company300 Park AvenueNew York, New York 10022-7499(212) 310-2000
Annual Meeting on Tuesday: Note ChangeColgate shareholders are invited to attendour annual meeting. It will be Tuesday, May 9,2000 at 10:00 a.m. in the Broadway Ball-room of the Marriott Marquis Hotel, SixthFloor, Broadway at 45th Street, New York,New York.
Stock ExchangesThe common stock of Colgate-PalmoliveCompany is listed and traded on The New York Stock Exchange under the symbol CL and on other world exchangesincluding those in Amsterdam, Frankfurt, London, Paris and Zurich.
All financial information such as financialresults, dividend news and other informationis available on Colgate’s Internet Site:http://www.colgate.comColgate also offers earnings information,dividend news and other corporateannouncements toll-free at 1-800-850-2654.The information can be read to the callerand can also be received by mail or fax.
Transfer Agent and RegistrarOur transfer agent can assist you with avariety of shareholder services, includingchange of address, transfer of stockto another person, questions aboutdividend checks or Colgate’s DividendReinvestment Plan.
Attn: Colgate-Palmolive CompanyFirst Chicago Trust Company of New Yorka division of EquiServeP.O. Box 2500Jersey City, NJ 07303-2500TOLL-FREE: 1-800-756-8700FAX: (201) 222-4842E-mail: [email protected] address: http://www.equiserve.comHearing Impaired: TDD: (201) 222-4955
Dividend Reinvestment PlanColgate offers an automatic DividendReinvestment Plan for common and $4.25preferred stockholders and a voluntary cashfeature. Any brokers’ commissions or servicecharges for stock purchases under the Planare paid by Colgate-Palmolive. Shareholderscan sign up for this Plan by contacting ourtransfer agent, listed above.
(1) All share and per share amounts have beenrestated to reflect the 1999, 1997 and 1991 two-for-one stock splits.
(2) Income in 1995 includes a net provision for restruc-tured operations of $369.2. (Excluding this charge,earnings per share would have been $.89, basicand $.84, diluted.)
(3) Income in 1994 includes a one-time charge of$5.2 for the sale of a non-core business,Princess House.
(4) Income in 1993 includes a one-time impact ofadopting new mandated accounting standards,effective in the first quarter of 1993, of $358.2.(Excluding this charge, earnings per share wouldhave been $.84, basic and $.79, diluted.)
(5) Income in 1991 includes a net provision for restruc-tured operations of $243.0. (Excluding this charge,earnings per share would have been $.64, basicand $.60, diluted.)
Dollars In Millions Except Per Share Amounts
Continuing Operations Net salesResults of operations:
Net incomePer share, basicPer share, diluted
Depreciation and amortization expense
Financial PositionCurrent ratioProperty, plant and equipment, netCapital expendituresTotal assetsLong-term debtShareholders’ equity
Share and OtherBook value per common shareCash dividends declared and paid per
common shareClosing priceNumber of common shares outstanding
(in millions)Number of shareholders of record:
$4.25 PreferredCommon
Average number of employees
Eleven-Year Financial Summary(1)
Independent Public AccountantsArthur Andersen LLP
Investor Relations/ReportsCopies of annual or interim reports, productbrochures, Form 10-K and other publicationsare available from the Investor RelationsDepartment:
by mail directed to the corporate addressby e-mail, [email protected] calling 1-800-850-2654 or by calling
Investor Relations at (212) 310-3207Investors with other requests:
please write Investor Relations at thecorporate address or call (212) 310-2575Institutional investors:
call Bina Thompson at (212) 310-3072
Other ReportsYou can obtain a copy of Colgate’s Environmen-tal Policy Statement, Code of Conduct, Advertis-ing Placement Policy Statement, ProductSafety Research Policy or our 1999 Report ofLaboratory Research with Animals by writing toConsumer Affairs at Colgate-Palmolive.
Corporate ResponsibilityColgate-Palmolive does business in over 200countries and territories worldwide, affecting thelives of a highly diverse population of employ-ees, consumers, shareholders, businessassociates and friends. We are committed tothe highest standard of ethics, fairness andhumanity in all our activities and operations.All employees are guided by a worldwide Codeof Conduct, which sets forth Colgate policieson important issues such as nondiscriminatoryemployment, involvement in community andeducational programs, care for the environment,employee safety, and our relationship with con-sumers, shareholders and government.
Environmental PolicyColgate-Palmolive is committed to the protec-tion of the environment everywhere. Our com-mitment is an integral part of Colgate’s missionto become the best truly global consumerproducts company. We continue to work ondeveloping innovative environmental solutionsin all areas of our business around the world.The health and safety of our customers, ourpeople and the communities in which we liveand operate is paramount in all that we do.Colgate-Palmolive’s concern has been trans-lated into many varied programs dealing withemployee safety, our products, packaging, facil-ities and business decisions. Extensive workertraining programs, a comprehensive audit pro-gram, and projects such as concentrated clean-ers and detergents, refill packages, recycledand recyclable bottles, and packaging materialsare all part of our commitment behind thisimportant endeavor.
Brought to you by Global Reports
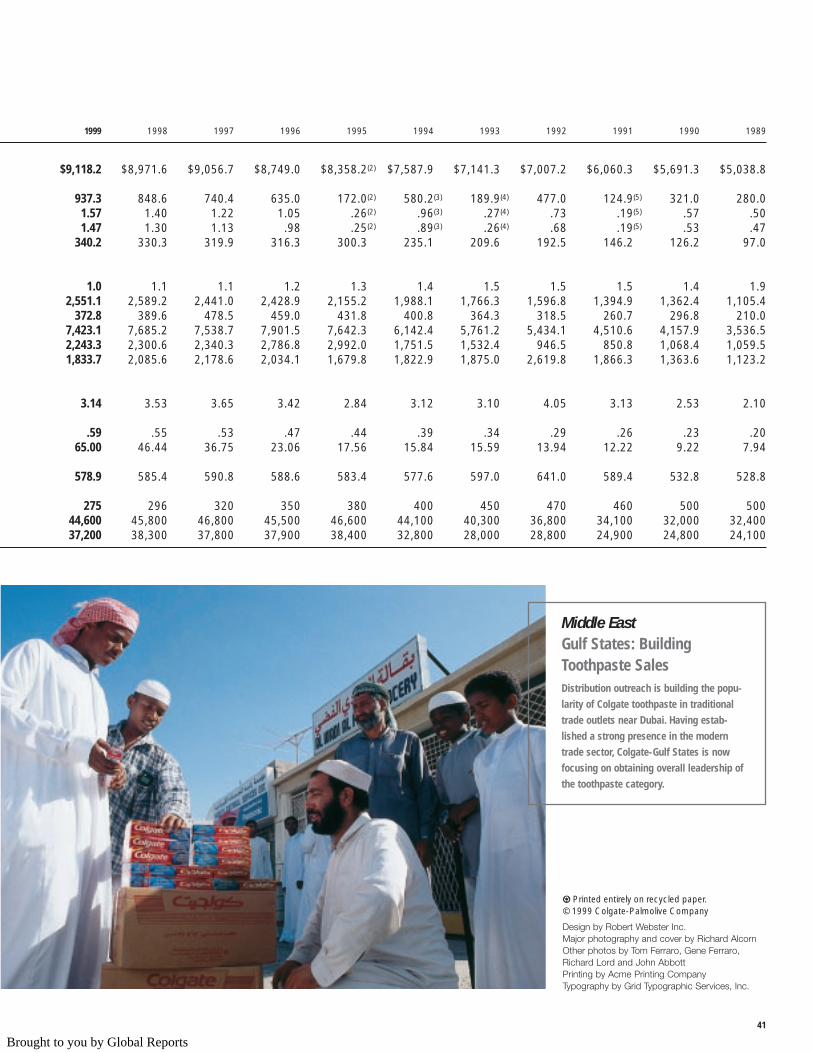
41
E Printed entirely on recycled paper.© 1999 Colgate-Palmolive Company
Design by Robert Webster Inc.Major photography and cover by Richard AlcornOther photos by Tom Ferraro, Gene Ferraro, Richard Lord and John AbbottPrinting by Acme Printing CompanyTypography by Grid Typographic Services, Inc.
Middle EastGulf States: BuildingToothpaste SalesDistribution outreach is building the popu-
larity of Colgate toothpaste in traditional
trade outlets near Dubai. Having estab-
lished a strong presence in the modern
trade sector, Colgate-Gulf States is now
focusing on obtaining overall leadership of
the toothpaste category.
1999 1998 1997 1996 1995 1994 1993 1992 1991 1990 1989
$9,118.2 $8,971.6 $9,056.7 $8,749.0 $8,358.2(2) $7,587.9 $7,141.3 $7,007.2 $6,060.3 $5,691.3 $5,038.8
937.3 848.6 740.4 635.0 172.0(2) 580.2(3) 189.9(4) 477.0 124.9(5) 321.0 280.01.57 1.40 1.22 1.05 .26(2) .96(3) .27(4) .73 .19(5) .57 .501.47 1.30 1.13 .98 .25(2) .89(3) .26(4) .68 .19(5) .53 .47
340.2 330.3 319.9 316.3 300.3 235.1 209.6 192.5 146.2 126.2 97.0
1.0 1.1 1.1 1.2 1.3 1.4 1.5 1.5 1.5 1.4 1.92,551.1 2,589.2 2,441.0 2,428.9 2,155.2 1,988.1 1,766.3 1,596.8 1,394.9 1,362.4 1,105.4
372.8 389.6 478.5 459.0 431.8 400.8 364.3 318.5 260.7 296.8 210.07,423.1 7,685.2 7,538.7 7,901.5 7,642.3 6,142.4 5,761.2 5,434.1 4,510.6 4,157.9 3,536.52,243.3 2,300.6 2,340.3 2,786.8 2,992.0 1,751.5 1,532.4 946.5 850.8 1,068.4 1,059.51,833.7 2,085.6 2,178.6 2,034.1 1,679.8 1,822.9 1,875.0 2,619.8 1,866.3 1,363.6 1,123.2
3.14 3.53 3.65 3.42 2.84 3.12 3.10 4.05 3.13 2.53 2.10
.59 .55 .53 .47 .44 .39 .34 .29 .26 .23 .2065.00 46.44 36.75 23.06 17.56 15.84 15.59 13.94 12.22 9.22 7.94
578.9 585.4 590.8 588.6 583.4 577.6 597.0 641.0 589.4 532.8 528.8
275 296 320 350 380 400 450 470 460 500 50044,600 45,800 46,800 45,500 46,600 44,100 40,300 36,800 34,100 32,000 32,40037,200 38,300 37,800 37,900 38,400 32,800 28,000 28,800 24,900 24,800 24,100
Brought to you by Global Reports