Embed Size (px)
Citation preview

“Building the largest pure silver company in Asia‐Pacific”

DisclaimerThe material in this presentation contains certain forecasts and forward-looking information, includingregarding possible or assumed future performance or potential growth of Silver Mines Limited (“SVL”).Such information is not a guarantee of future performance and involve unknown risks and uncertainties, aswell as other factors, many of which are beyond the control of SVL. Actual results and developments maydiffer materially from those expressed or implied by these forward-looking statements depending on avariety of factors.
No representation or warranty, expressed or implied, is made or given by or on behalf of SVL, any of SVL’sdirectors, or any other person as to the accuracy or completeness or fairness of the information oropinions contained in this presentation and no responsibility or liability is accepted by any of them forsuch information or opinions or for any errors, omissions, misstatements, negligent or otherwise, or for anycommunication written or otherwise, contained or referred to in this presentation.
Accordingly, neither SVL nor any of the SVL directors, officers, employees, advisers, associated personsor subsidiary undertakings shall be liable for any direct, indirect or consequential loss or damage sufferedby any person as a result of relying upon the statement or as a result of any admission in, or anydocument supplied with, this presentation or by any future communications in connection with suchdocuments and any such liabilities are expressly disclaimed.
Nothing in this material should be construed as either an offer to sell or a solicitation of an offer to buy orsell securities.

Silver Mines Limited Strategy
• Development of the only primary silver focussed company of substance in Asia‐Pacific
• Acquisition of complimentary silver assets at cyclical lows
• Buying silver ounces for cents/ounce ‘in the ground’
• Targeted consolidation of silver deposits in New South Wales
• Bottom of the market acquisition of Bowdens (one of the largest undeveloped silver deposits globally)

Silver Mines Limited StructureShares on Issue (post 100:1 consolidation) 108.8m
Placement A$40.5m @ $0.15 270.0m
Total on Issue 378.8.0m
Undiluted Market Capitalisation (based on 15c issue) A$56.8m
Cash after completion A$20.0m
Enterprise Value A$36.8m
Options
May 2017 @ $4.30 0.06m
Oct 2017 @ $0.30 23.4m
May 2018 @ $0.30 7.5m
Advisor Options June 2019 @ $0.30 8.0m
Note: The above table including the Placement, the issuance of May 2018 Options and June 2019 Options and a Share Consolidation are conditional on shareholder approval. Post completion of the above it is proposed that a Share Purchase Plan (“SPP”) is undertaken on the same terms and conditions as the Placement.

Gold/Silver Ratio
0
10
20
30
40
50
60
0
10
20
30
40
50
60
70
80
902007
2008
2009
2010
2011
2012
2013
2014
2015
2016
Silver US$/oz
Gold/Silver Ratio
Gold/Silver Ratio
Silver US$/oz Trading off 7 year lows

New South Wales Silver Consolidation

SVL Resource Inventory (Refer to Appendices 1,2 & 3 for further details)
Deposit name Mt Ag Eq (g/t) Ag Eq (Moz) Status
Bowdens 88.0 64 182 Agreement to purchase
Webbs 1.5 353 17.5 100% owned
Conrads 2.6 206 16.5 100% owned
Total 92.1 73 216 191 Moz Ag Eq attributable
• NSW silver assets ripe for consolidation
• Bottom of the market acquisitions
• Bowdens is the key piece to the puzzle
• Upon completion, only pure silver play of substance in Asia‐Pacific

Title Package

Bowdens Silver Project• The largest undeveloped silver deposit in Australia and one of the largest
globally
• Kingsgate purchased from Silver Standard for A$75 million
• Over A$35 million spent by Kingsgate
• Freehold land mostly purchased (~A$12 million)
• Transaction consolidates 80kms of strike and mineralised Rylstone Volcanics (1,654 km2 = 408,000 acres)
• SVL purchasing for;
• $20m cash ($2.0m deposit paid, balance end June 2016)
• 40m fully paid ordinary shares
• Deferred 40m fully paid ordinary shares and split on EIS submission and Decision to Mine

Bowdens Silver Project• Resource of ~180 Moz of silver
equivalent
• New drilling including resource, metallurgical and sterilisation drilling
• Feasibility Study +80% complete
• Environmental Impact Statement +80% complete
• Flat lying deposit at surface – easy to mine and very low strip ratio
• Classified as “State Significant Development” in NSW

Bowdens Resource (Refer to Appendix 1 for further details)• Kingsgate resource based on 63,000 metres
drilling (65% by Silver Standard, 20% by Kingsgate)
• Eastern flank of resource presents high grade ore from surface and first three years could be pushed to ~80‐90g/t Ag vastly improving economics
• Resource is open at depth
• Infill drilling within inferred envelope could add extra 25 Moz Aq to pit optimisation
30 g/t Ag Cut Mt Ag (g/t) Zn (%) Pb (%) Ag Eq (g/t) AgEq (Moz)
Measured/Indicated 52.0 51.9 0.38 0.29 68.6 115
Inferred 36 41 0.4 0.3 58 68
Total 88.0 47.4 0.39 0.29 64.4 182

Long Section
Deep Zone high grade zone in basement Ordovician shales. Peak assays of:197g/t Ag 5.5% Pb6.52g/t Au 0.3% Cu9.0% Zn

Cross Section

Cross Section

Cross Section

Feasibility• Managed by Ausenco
• MPR Geological (Resources), AMC (Mining), Coffey (Tailings), RW Corkery(Environment), SKM (water) and others
• Halted in mid 2013 with silver price downturn
• Circa A$25 million expenditure (including drilling)
• “Rolls Royce” approach to 4.0 million tonnes per annum development
• Substantial room to cut Capex

FeasibilityAusenco/Kingsgate
Draft Feasibilitymid 2013
Lycopodium Scoping Study Case 8
mid 2006Mining/Process Mtpa ore 4.5 2.5
Strip 1.7 : 1 1.6 : 1
Head Grade g/t Ag 68 77
Head Grade % Zn / %Pb 0.38 / 0.30 0.38 / 0.32
Silver Recovery % 82.4 80.9
Production Silver Moz pa 8.0 5.0
Zn tpa 12,000 8,000
Pb tpa 10,000 5,200
Capex A$m 363.4 139.6
Opex A$/t milled 21.97 35.65
Opex (after credits) US$/oz Ag 7.56 7.28

Exploration Upside• Outstanding regional exploration package
ignored by previous operators (concentrating on Bowdens development)
• ~ 80 kms of strike length of mineralised structures under‐explored
• Potential for:
• Large disseminated deposits hosted in Rylstone Volcanics like Bowdens and Coomber
• High‐grade Ag‐Pb‐Zn‐Cu‐Au deposits in basement Silurian / Ordovician rocks
• High order targets within the exploration licences with identified high grade mineralisation within truckable distances

Bowdens South
Duagh Target
Bowdens NW Target
Bowdens North Target
Bowdens 182Moz Ag Eq
Havilah Targets
Bara Targets
Exploration Upside• More than 30 metal mineral
occurrences within 8kms of Bowdens
• Large scale target areas untested in Rylstone Volcanics including:
• Bowdens North
• Bowdens Northwest,
• Bowdens South and
• Duagh Target.
• Bara targets with high grade Ag‐Pb‐Zn‐Au in historic workings
• Havilah targets with high‐grade Ag‐Pb‐Zn‐Cu‐Au in historic workings and undrilled massive sulphide conductors

Exploration UpsideCoomber Prospect Drill Results
From (metres) To (metres) Intercept (metres) Silver g/t Ag Eq
0 58 58 88.8
0 50 50 42.8
18 100 82 31.2
34 48 14 85.1
16 26 10 73.7
• 40 drill holes for 2645 metres
• Drilling by CRA in early 1990’s, yet to be followed up
• Circa 10kms from Bowdens
• Mineralisation from surface and analogous to Bowdens

ComparativesCompany Attrib. Resource
Moz Ag EqEnterprise Value
US$mEnterprise ValueUS$/oz Ag Eq
MAG Silver 143 778 5.45
Impact Silver 8 37 4.37
Fortuna Silver Mines 160 661 4.14
Pan American Silver 489 1,928 3.94
Aurcana 18 60 3.39
First Majestic Silver 483 1,409 2.92
Coeur Mining 457 1,329 2.91
Excellon Resources 20 51 2.55
Endeavour Silver 158 394 2.50
Great Panther Silver 155 189 1.21
Avino Silver & Gold 56 55 0.98
Silver Standard 1,166 937 0.80
Alexco 111 88 0.79
Americas Silver 124 86 0.70
Silvercorp Metals 428 283 0.66
Santacruz Silver 82 53 0.65
Bear Creek Mining 254 155 0.61
Silver Mines Limited 191 28 0.15

Silver Company Share Price Performance Company Market Cap.
US$mJan 2016US$/share
April 2016US$/share
% Increase
Pan American Silver 2,095.2 6.50 13.83 113
First Majestic Silver 1,396.6 3.56 8.97 152
Coeur Mining 1,039.4 2.48 6.87 177
Silver Standard 984.1 5.66 8.27 46
MAG Silver 924.5 7.09 11.60 64
Fortuna Silver Mines 729.4 2.46 5.65 130
Endeavour Silver 391.6 1.42 3.68 159
Silvercorp Metals 349.8 0.52 2.07 297
Great Panther Silver 202.6 0.55 1.43 159
Bear Creek Mining 175.0 0.42 1.88 348
Arizona Mining 131.0 0.26 0.78 204
Alexco 85.0 0.34 1.10 224
Americas Silver 82.3 0.07 0.24 233
Avino Silver & Gold 51.8 0.98 1.39 42
Excellon Resources 50.8 0.24 0.92 285
Santacruz Silver 42.5 0.07 0.41 513
Impact Silver 36.0 0.08 0.53 562
Aurcana 24.1 0.09 0.28 200
Weighted Average 120

Major Primary Silver MinesMine Country Company Silver Moz pa
Cannington Australia BHP Billiton 24.7
Escobal Guatemala Tahoe Resources 20.3
Fresnillo Mexico Fresnillo 20.1
Dukat Russia Peolymetal International 19.5
Saucito Mexico Fresnillo 15.4
Uchucchacua Peru Buenaventura 12.1
Pirquitas Argentina Silver Standard 8.7
Green Creek United States Hecla Mining 7.8
Palmarejo Mexico Coeur Mining 6.6
Pallancata Peru Hochschild Mining (HM) 6.5
San Hosé Argentina Hochschild Mining/McEwen Mining 6.5
Imiter Morocco Metallurgique d'Imiter 6.0
San Bartotome Bolivia Coeur Mining 5.9
Arcata Peru Hochschild Mining 5.8
Gümüsköy Turkey Eti Gümüs 5.8
BOWDENS TOP 10
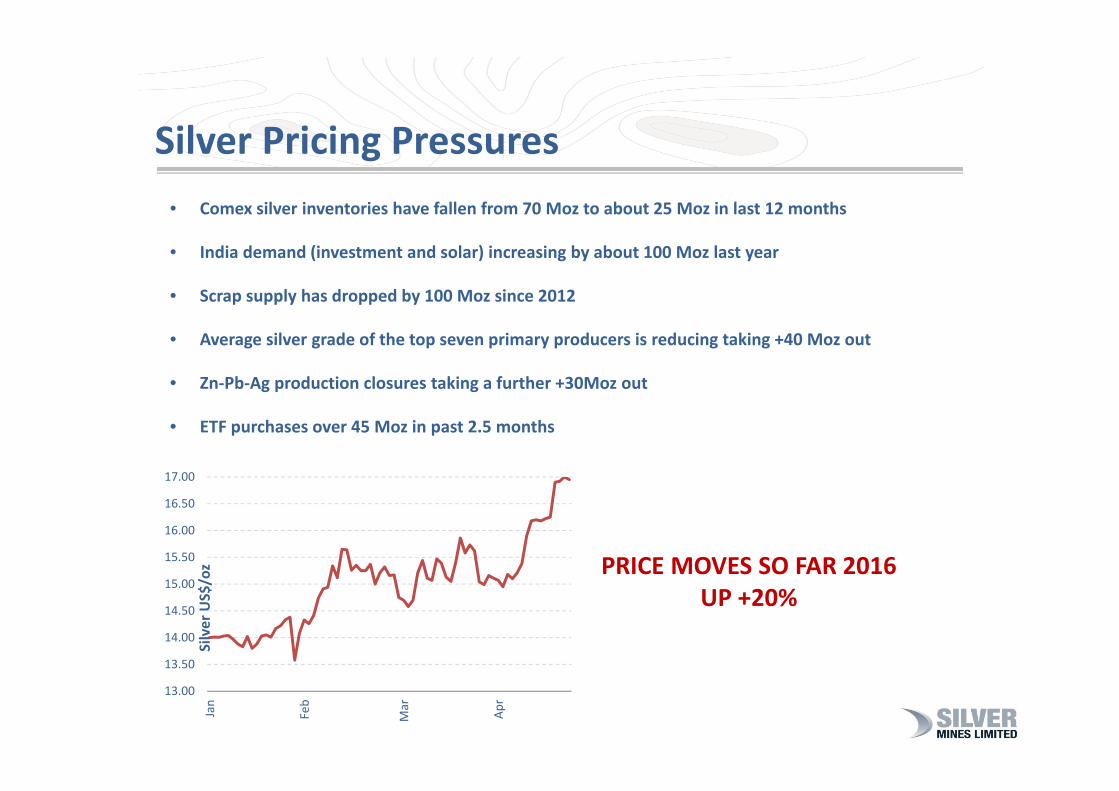
Silver Pricing Pressures• Comex silver inventories have fallen from 70 Moz to about 25 Moz in last 12 months
• India demand (investment and solar) increasing by about 100 Moz last year
• Scrap supply has dropped by 100 Moz since 2012
• Average silver grade of the top seven primary producers is reducing taking +40 Moz out
• Zn‐Pb‐Ag production closures taking a further +30Moz out
• ETF purchases over 45 Moz in past 2.5 months
PRICE MOVES SO FAR 2016UP +20%
13.00
13.50
14.00
14.50
15.00
15.50
16.00
16.50
17.00
Jan
Feb
Mar
Apr
Silver US$/oz

Conclusion
• Management proven strategy of significant shareholder wealth creation
• Targeted regional consolidation with ‘bottom of cycle’ silver acquisitions
• Adding quality silver inventory a priority
• Well advanced on execution of strategy
• Timing ‘sweet spot’ with macroeconomic trends

Appendix 1 – Bowdens ResourceKingsgate mineral resource estimation, October 2012
Table 1: Bowdens Mineral Resource Estimate (30g/t AgEq cut-off), November 2012
Resource
Category
Tonnes
(Million)
Silver
(g/t)
Lead
(%)
Zinc
(%)
Ag Eq
(g/t)
Silver
(Moz)
Ag Eq
(Moz)
Measured 23.6 56.6 0.31 0.41 74.5 43 57
Indicated 28.4 48.0 0.27 0.36 63.6 44 58
Meas + Ind 52.0 51.9 0.29 0.38 68.6 87 115
Inferred 36 41 0.3 0.4 58 47 68
Total 88.0 47.4 0.29 0.39 64.4 134 182
[1] The Company confirms that it is not aware of any new information received since the original disclosure (KCN announcement 18/10/2013) or data that
materially affects the information included in this table. The Company confirms that all material assumptions and technical parameters underpinning the
mineral resource estimates continue to apply and have not materially changed.
[2] Bowdens silver equivalent: Ag Eq (g/t) = Ag(g/t) + 27.5 x Pb(%) +22.8 x Zn (%) calculated from prices of US26.33/oz Ag, US$2206/t Pb, US$2111//t Zn
and NSR metallurgical recoveries of 72% Ag, 75% Pb, and 66% Zn estimated from test work by Kingsgate. NSR or net smelter return metallurgical recovery
is defined as the payable metal recovered after allowing for smelter deductions, which includes deductions for precious metals.
[3] In the Company’s opinion, the silver, lead and zinc included in the metal equivalent calculations have a reasonable potential to be recovered.
Table A1 Bowdens Mineral Resource Estimate completed by MPR Geological Consultants. First reported under JORC Code 2004 in November
2012, and re-reported in October 2013 to be compliant with JORC2012 guidelines. Refer to Kingsgate Consolidated Ltd press-release dated
18th of October, 2013 for full JORC2012 details and tables. Totals may vary due to rounding. Also refer to the Silver Mines Limited
announcement of 3rd March 2016.

Appendix 2 – Conrad Resource EstimateMalachite Resources NL – Conrad resource estimate released 16 December 2008
Table 2: Combined Conrad and King Conrad Lodes
Resource
Category
Tonnes
(Million)
Silver
(g/t)
Copper
(%)
Lead
(%)
Zinc
(%)
Tin
(%)
Ag Eq
(g/t)
Ag Eq
(Moz)
Indicated 0.658 128.8 0.24 1.69 0.68 0.28 254 5.37
Inferred 1.994 97.6 0.19 1.21 0.48 0.21 190.2 12.19
Total 2.652 105.4 0.20 1.33 0.53 0.22 206.1 17.5[1] The Company confirms that it is not aware of any new information received since the original disclosure (MAR announcement 16 December
2008 or data that materially affects the information included in this table. The Company confirms that all material assumptions and technical
parameters underpinning the mineral resource estimates continue to apply and have not materially changed.
[2] The Conrad silver equivalent is calculated based on the parameters below which included spot metal prices as of the time of release in
December 2008 and the assume recoveries as per the table below.
Table A2. Conrad Mineral Resource estimate as released by Malachite Resources NL (ASX:MAR) on 16/12/2008. Based on work compiled by
Hellman & Schofield Pty Ltd, Geological Consultants, Sydney. Totals may vary due to rounding.
Conrad Silver Equivalent CalculatorSmelter
Return (%)
Metal
Price
Unit Effective
price (net
smelter)
A$/1%
metal in
1t ore
Mill
Recovery
Recovered
$/1% metal
in 1t ore
AgEq ratio unit
Ag 80 470 A$/kg 376 3759 90 3383 1.0 g/t
Pb 55 1538 A$/t 846 8.5 90 7.62 22.5 %
Zn 50 1692 A$/t 846 8.5 80 6.77 20.0 %
Cu 65 4769 A$/t 3100 31 80 24.80 73.3 %
Sn 70 17846 A$/t 12492 124.9 55 68.71 203.1 %
[3] In the Company’s opinion, the silver, lead, copper, tin and zinc included in the metal equivalent calculations have a reasonable
potential to be recovered.

Appendix 3 – Webbs Resource EstimateSilver Mines Limited – Webbs resource estimate released 27 February 2012
Table 3. Combined Conrad and King Conrad Lodes
Resource
Category
Tonnes
(Million)
Silver
(g/t)
Copper
(%)
Lead
(%)
Zinc
(%)
Ag Eq
(g/t)
Ag Eq
(Moz)
Measured 0.194 364 0.29 0.75 1.67 470 2.9
Indicated 0.775 245 0.26 0.70 1.49 341 8.5
Inferred 0.522 201 0.27 0.71 1.61 302 5.1
Total 1.49 245 0.27 0.71 1.56 345 16.5
[1] The Company confirms that it is not aware of any new information received since the original disclosure (SVL announcement 27
February 2012) or data that materially affects the information included in this table. The Company confirms that all material assumptions
and technical parameters underpinning the mineral resource estimates continue to apply and have not materially changed.
[2] Webbs Silver equivalent calculation based on equal recoveries of all metals based on silver price of US$17.30 per ounce, copper
price of US$4935 per tonne, lead price of US$1773 per tonne and zinc price of $1871 per tonne as recorded as spot prices on 27 April
2016.
[3] In the Company’s opinion, the silver, lead, copper and zinc included in the metal equivalent calculations have a reasonable potential
to be recovered.
Table A3 Webbs Mineral Resource estimate as released by Silver Mines Ltd (ASX:SVL) on 27/02/2012. Based on work compiled by GeoRes
Pty Ltd. Totals may vary due to rounding.

Competent Persons StatementsBowdens Resource Estimation
The information in this report that relates to the Bowdens Mineral Resources estimation is based on information compiled by Jonathon Abbott who is a full time employee of MPR Geological Consultants Pty
Ltd and a Member of the Australian Institute of Geoscientists (MAIG). Mr Abbott has sufficient experience that is relevant to the style of mineralisation and type of deposit under consideration and to the
activity that he undertaking to qualify as Competent Person as defined in the 2012 edition of the ‘Australasian Code for Reporting Exploration Results, Mineral Resources and Ore Reserves’ (JORC code).
Mr Abbott consents to the inclusion in this report of the matters based on this information in the form and context in which it appears.
Conrad Resource Estimation
The resource estimates quoted for the Conrad deposit were originally estimated for Malachite Resources NL by Mr Simon Tear of Hellman & Schofield Pty Ltd, an international and independent geological
consultancy, under the 2004 JORC Code. The estimates have not been updated to comply with the JORC Code 2012 on the basis that the information has not materially changed since last reported. The
information in this report that relates to the Conrad Mineral Resource Estimates is based on information compiled by Mr Simon Tear who is a director of H&S Consultants Pty Ltd and is a member of the
Australasian Institute of Mining and Metallurgy. Mr Tear has sufficient experience that is relevant to the style of mineralisation and type of deposit under consideration and to the activity that he undertaking
to qualify as Competent Person as defined in the 2012 edition of the ‘Australasian Code for Reporting Exploration Results, Mineral Resources and Ore Reserves’ (JORC code). Mr Tear consents to the
inclusion in this report of the matters based on this information in the form and context in which it appears.
Webbs Resource Estimation
The resource estimates quoted for the Webbs deposit have been estimated for Silver Mines Limited by GeoRes Pty Ltd, an independent resource consultancy under the 2004 JORC Code. This resource
estimation has not been updated since to comply with the JORC Code 2012 on the basis that the information has not materially changed since last reported. The information in this document that relates to
Webbs mineral resource estimations is based on information compiled by Mr Robin Rankin, who is a Member of the Australian Institute of Mining and Metallurgy (MAusIMM) and registered as a Chartered
Professional Geologist (CPGeo). Mr Rankin is Principal Consulting Geologist and operator of the independent geological consultancy of GeoRes Pty Ltd. He has sufficient experience, which is relevant to the
style of mineralisation and type of deposit under consideration and to the activity which he is undertaking to qualify as a Competent Person as defined in the 2012 Edition of the ‘Australian Code for
Reporting of Exploration Results, Minerals Resources and Ore Reserves’ (The JORC Code). Mr Rankin consents to and has provided consent to the inclusion in this report of these matters based on the
documentation in the form and in the context in which it appears.
Bowdens Exploration and Drill Results
The information in this report that relates to the Bowdens drill hole intercepts and exploration potential in the Bowdens area is based on information compiled by Kingsgate Consolidated Ltd and reviewed by
Darren Holden who is a director of Silver Mines Limited and employee of GeoSpy Pty Ltd and a member of the Australasian Institute of Mining and Metallurgy (MAusIMM). Mr Holden has sufficient
experience that is relevant to the style of mineralisation and type of deposit under consideration and to the activity that he is undertaking to qualify as Competent Person as defined in the 2012 edition of the
‘Australasian Code for Reporting Exploration Results, Mineral Resources and Ore Reserves’ (JORC code). Mr Holden consents to the inclusion in this report of the matters based on this information in the
form and context in which it appears.