Embed Size (px)
Citation preview
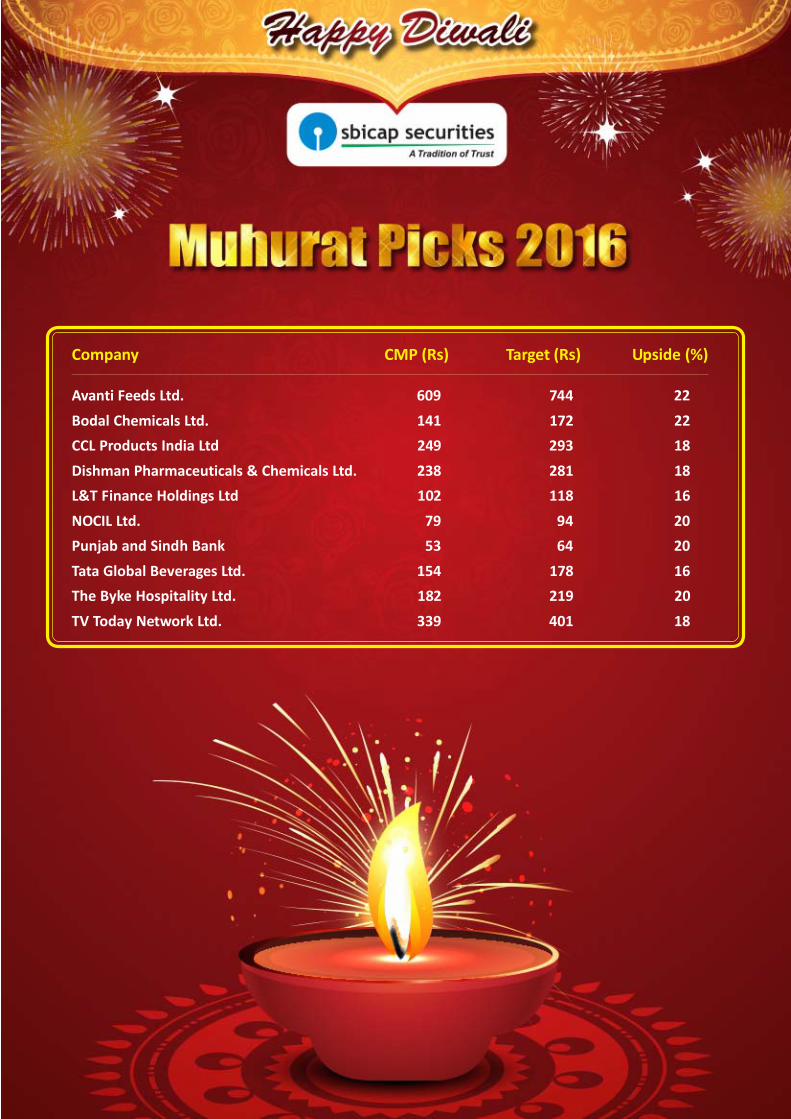
Company CMP (Rs) Target (Rs) Upside (%)
Avanti Feeds Ltd. 609 744 22Bodal Chemicals Ltd. 141 172 22CCL Products India Ltd 249 293 18Dishman Pharmaceuticals & Chemicals Ltd. 238 281 18L&T Finance Holdings Ltd 102 118 16NOCIL Ltd. 79 94 20Punjab and Sindh Bank 53 64 20Tata Global Beverages Ltd. 154 178 16The Byke Hospitality Ltd. 182 219 20TV Today Network Ltd. 339 401 18
SBICAP Securities Limited / 2
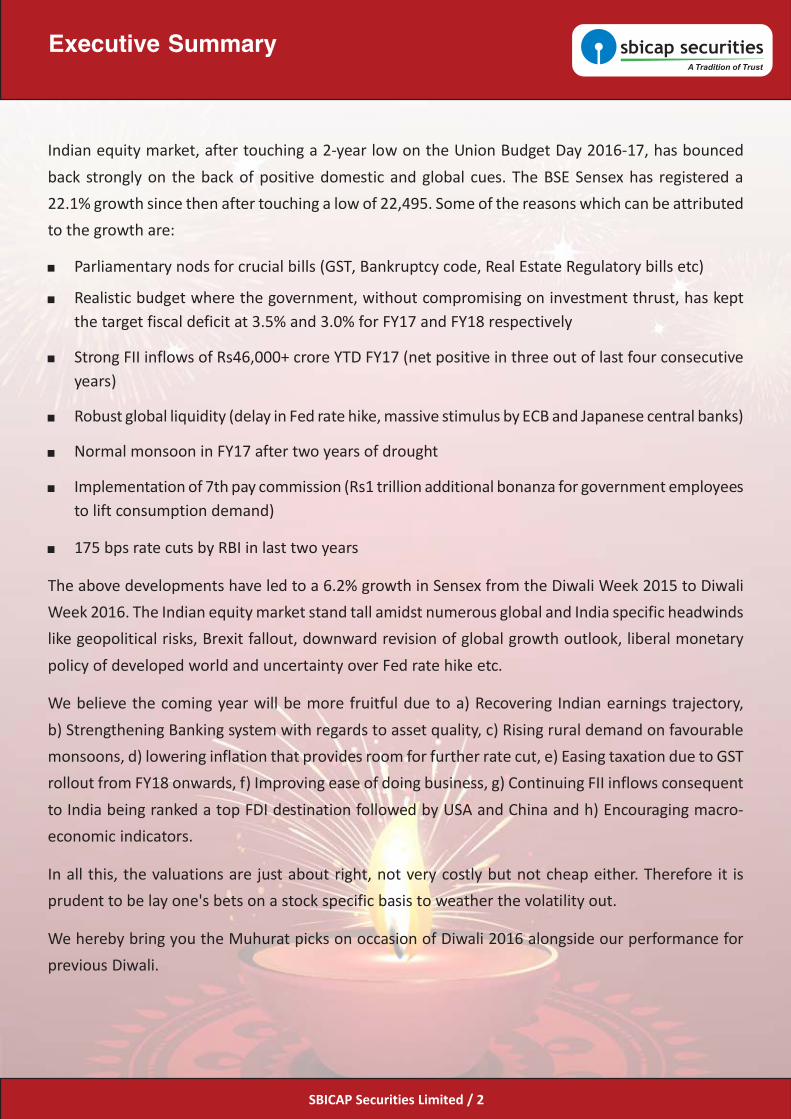
Executive Summary
Indian equity market, after touching a 2-year low on the Union Budget Day 2016-17, has bouncedback strongly on the back of positive domestic and global cues. The BSE Sensex has registered a22.1% growth since then after touching a low of 22,495. Some of the reasons which can be attributedto the growth are:
Parliamentary nods for crucial bills (GST, Bankruptcy code, Real Estate Regulatory bills etc)
Realistic budget where the government, without compromising on investment thrust, has keptthe target fiscal deficit at 3.5% and 3.0% for FY17 and FY18 respectively
Strong FII inflows of Rs46,000+ crore YTD FY17 (net positive in three out of last four consecutiveyears)
Robust global liquidity (delay in Fed rate hike, massive stimulus by ECB and Japanese central banks)
Normal monsoon in FY17 after two years of drought
Implementation of 7th pay commission (Rs1 trillion additional bonanza for government employeesto lift consumption demand)
175 bps rate cuts by RBI in last two years
The above developments have led to a 6.2% growth in Sensex from the Diwali Week 2015 to DiwaliWeek 2016. The Indian equity market stand tall amidst numerous global and India specific headwindslike geopolitical risks, Brexit fallout, downward revision of global growth outlook, liberal monetarypolicy of developed world and uncertainty over Fed rate hike etc.
We believe the coming year will be more fruitful due to a) Recovering Indian earnings trajectory,b) Strengthening Banking system with regards to asset quality, c) Rising rural demand on favourablemonsoons, d) lowering inflation that provides room for further rate cut, e) Easing taxation due to GSTrollout from FY18 onwards, f) Improving ease of doing business, g) Continuing FII inflows consequentto India being ranked a top FDI destination followed by USA and China and h) Encouraging macro-economic indicators.
In all this, the valuations are just about right, not very costly but not cheap either. Therefore it isprudent to be lay one's bets on a stock specific basis to weather the volatility out.
We hereby bring you the Muhurat picks on occasion of Diwali 2016 alongside our performance forprevious Diwali.

SBICAP Securities Limited / 3
Company Reco. Target Targeted CMP Actual Highest PricePrice (Rs) (Rs) Upside(%) (Rs) gain (%) Since Reco. (Rs)
Cadila Healthcare 417 493 18 392 -6 429
Container Corp 1,406 1617 15 1,352 -4 1,544
GNFC 74 90 22 242 227 248
ICICI Bank 263 302 15 278 6 284
Kansai Nerolac 244 288 18 376 54 403
Tata Motors 412 494 20 545 32 599
Wonderla Holidays 335 409 22 407 22 430
Performance of Muhurat Picks - 2015:
Executive Summary
CMP as on 21st October 2016
Performance vis-a-vis other broking houses:
Note: Mid average performance excludes the best and worst performer
31
22
13
3
47
27
15 13
4
22
-
8
16
24
32
40
48
56
Brokerage 1 (7 Stocks)
Brokerage 2 (10 Stocks)
Brokerage 3 (11 Stocks)
Brokerage 4 (5 Stocks)
SSL Performance(7 Stocks)
Average (%) Mid Average (%)

SBICAP Securities Limited / 4
Indians are avid followers of rituals and customs, celebrating various festivals over the year. Amongthem the most revered and spiritual occasion is 'Diwali', One of the holy 'saadhe tin muhurat' accordingto Hindu religion. Religious Indians are strong believers of 'Shagun' and 'Muhurat', which means anauspicious occasion. Traditional business communities in India start their new financial year on the'Muhurat' with 'Laxmi Puja', praying goddess 'Laxmi' and earning her holy blessings for prosperityand wealth.
'Samvat', a well heard word in financial markets is a short form of Sanskrit word 'Samvatsar' whichmeans a year. Vikram Samvat is the beginning of Hindu new year celebrated on 'chaitra shuklapratipada'. The ruler of this samvat is Lord Indra whereas Moon is both, the king and the minister.According to astrologers, 'Plavang' will be moderately conducive on economic front for the country.
Stock exchanges in India arrange for a special trading session on the eve of 'Diwali'. Traders welcomea new year with a traditional ceremony of 'Laxmi Puja'. Older books of account are closed and newbooks are opened with Puja. Customary small trades are placed by traders as 'shagun', a symbolicstart of new session on holy 'Muhurat', believing that the whole session will continue to bring prosperityand create wealth for them.
With this context we bring you, Ten muhurat picks for this muhurat trading session.
"With a hope that you attain success and bliss with every light that is lit during the DIwali."
“Wish You a Very Happy Diwali”
About Muhurat Trading
SBICAP Securities Limited / 5
Key Investment Rationale:Processing segment revenue rising: The Shrimp Processing andExports Unit, certified ISO 22000: 2005 is located in Gopalapuramnear Ravulapalem, East Godavari District Andhra Pradesh. The stateof art technology coupled with quality consciousness, excellentstorage facilities, logistics capabilities, timely deliveries andcommitment to customer satisfaction has made Avanti to be proudof a long list of loyal customers from USA, Europe, Japan, Australia &Middle East. The processing segment is jumped 3x in last three yearsand that is also a high margin business. The Company has a fleet ofinsulated as well as refrigerated vehicles to transport the harvestedshrimp from the farms to the processing plant and the processedgoods to the port of shipment in order to maintain the freshness ofproduct.
Quality control to drive the growth: The company has started takinginitiatives to provide shrimp farming education and further technicalsupport to the farmers in order to boost the quality and volume ofthe shrimps. It would help the company to gain an advantage over itspeers in US market which has started imposing stringent measureson the quality checks of imported shrimps. As a result in FY16, thecompany's export volume increased to 4377 MT versus 3409 MT inthe previous year. Also the shrimp feed sales went up by 8% to 252590MT during the year. In the near future the management envisagesgood volume growth from the export of processed shrimps.
Strong balance sheet with attractive financial numbers: Thecompany has strong balance sheet with almost debt free book inFY16 against of Rs50 crore as on Mar. 2015. The company has beenreporting strong set of numbers with profit growing faster than salesdue to consistent improvement in margin. The quarterly numberssince last few quarters are good with sales and PAT are growing indouble digit.
Valuation :Strong credentials of quality in the niche segment, strong exports volumegrowth and the vertically integrated value chain makes the businessattractive. At the CMP of Rs. 609, the stock is moderately prices at 17xits TTM earnings. We are positive on the stock with the price target ofRs.744.
Avanti Feeds Ltd.
CHART
CMP ( `̀̀̀̀) 609
Target ( `̀̀̀̀) 744
Upside Potential (%) 22
BSE Code: 512573 I NSE Symbol: AVANTIFEED
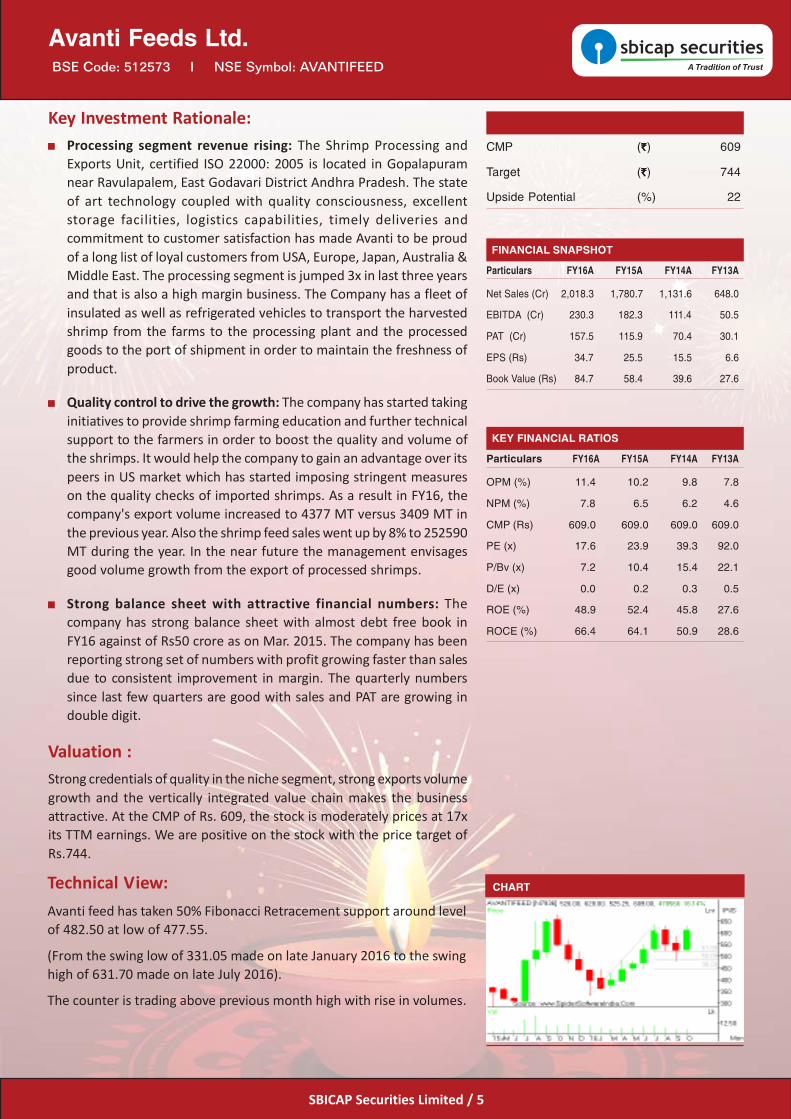
Technical View:Avanti feed has taken 50% Fibonacci Retracement support around levelof 482.50 at low of 477.55.
(From the swing low of 331.05 made on late January 2016 to the swinghigh of 631.70 made on late July 2016).
The counter is trading above previous month high with rise in volumes.
Particulars FY16A FY15A FY14A FY13A
Net Sales (Cr) 2,018.3 1,780.7 1,131.6 648.0
EBITDA (Cr) 230.3 182.3 111.4 50.5
PAT (Cr) 157.5 115.9 70.4 30.1
EPS (Rs) 34.7 25.5 15.5 6.6
Book Value (Rs) 84.7 58.4 39.6 27.6
FINANCIAL SNAPSHOT
Particulars FY16A FY15A FY14A FY13A
OPM (%) 11.4 10.2 9.8 7.8
NPM (%) 7.8 6.5 6.2 4.6
CMP (Rs) 609.0 609.0 609.0 609.0
PE (x) 17.6 23.9 39.3 92.0
P/Bv (x) 7.2 10.4 15.4 22.1
D/E (x) 0.0 0.2 0.3 0.5
ROE (%) 48.9 52.4 45.8 27.6
ROCE (%) 66.4 64.1 50.9 28.6
KEY FINANCIAL RATIOS
SBICAP Securities Limited / 6
Key Investment Rationale:Strong Business Model: Bodal is a manufacturer and supplier of Dye& Dye Intermediaries. It has a unique and integrated product linecovering forward and backward integration to dye intermediates. Thecompany is both forward and backward integrated in terms ofproducing dye intermediates as the company uses 60 percent of theof their own raw material in producing intermediates and 80 percentof their own raw materials in producing dyestuff. About 40 percentof the company revenue is from export medium and remaining fromthe domestic market. Bodal is one of the leading producers of Dyeintermediates & Dyestuff in the world. It is the only company in Indiahaving in-house manufacturing facility starting from Basic Chemicalsto Wide range of Dye Intermediates to Dyestuffs.
New projects to drive growth going ahead: Bodal Agrotech Ltd. afully owned subsidiary has received environment clearance for themanufacturing of several chemicals. It has also finalized to start projectwith total capacity of 18,000 MT for the manufacturing of productnamed LABSA which is majorly used in detergent industry. Theundertaken project would cost upto Rs. 15 crores for the companywith estimated sales turnover of about Rs. 100 crore. The companyhas also acquired a 42 percent stake in Trion Chemicals which hasapprovals for a project falling under specialty chemicals. A joint projectwith total capacity of 12,000 MT has been started with expectedturnover of about Rs. 240 crore at the optimum utilization levels.
Robust financial performance: The company has significantly reducedits debt from as high debt levels of Rs. 343.22 crore in FY14 to currentlevels of Rs. 142.90 crore. The company has started reporting positivenet profit from past three fiscal years majorly due to improvedoperating efficiency which is reflected in its increased bottom line.EBITDA and PAT Margins for the fiscal FY16 stands at impressive levelsof 17.2% and 9.4% as against sub 5% levels during FY13. Return ratioshave also remained on the higher side with ROE and ROCE for FY16at 44.0% and 37.2%.
Valuation:The company is currently trading at an attractive valuation of 15.6x ofits TTM earnings. Going ahead we expect stronger revenue visibility forthe company mainly supported by the high prices of H-acid which istheir major product. Also, the company's diversification into specialitychemicals through its subsidiary Trion chemicals and with its new productLABSA finally expected to start contributing to the revenue would leadto positive growth going ahead. We have positive view on the stock andrecommend a BUY with price target of Rs172.
Bodal Chemicals Ltd.
CHART
BSE Code: 524370 I NSE Symbol: BODALCHEM
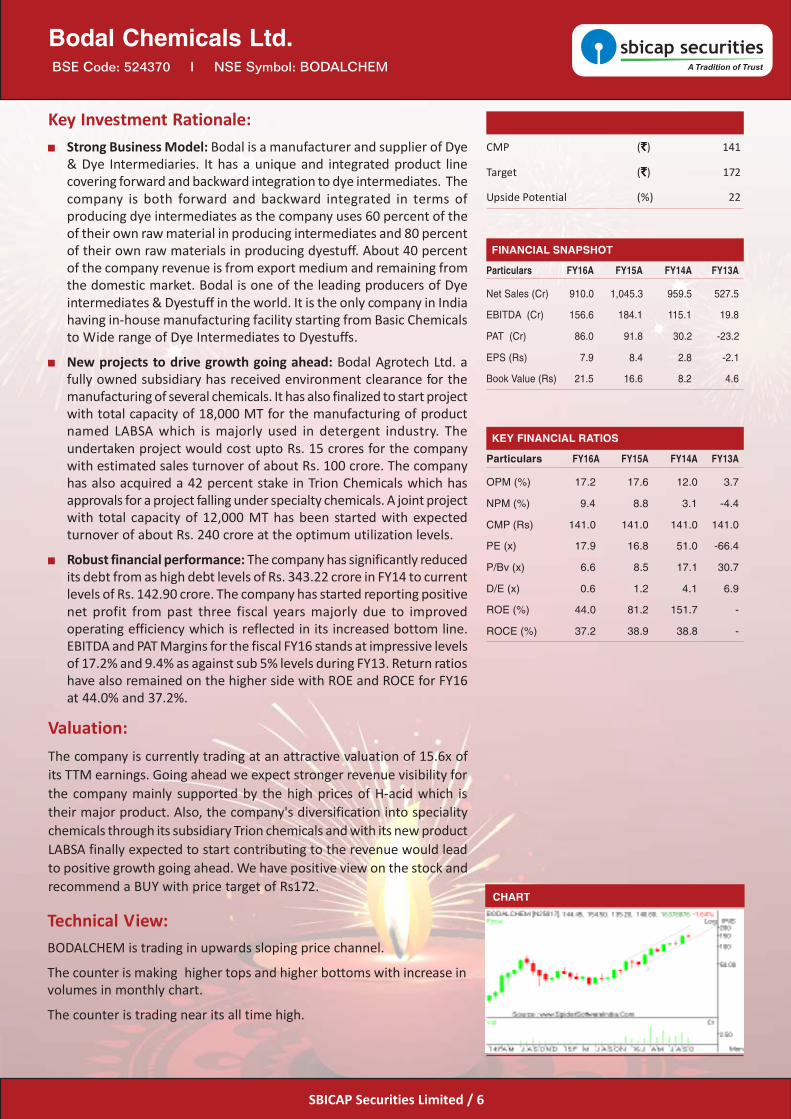
Technical View:BODALCHEM is trading in upwards sloping price channel.
The counter is making higher tops and higher bottoms with increase involumes in monthly chart.
The counter is trading near its all time high.
CMP ( `̀̀̀̀) 141
Target ( `̀̀̀̀) 172
Upside Potential (%) 22
Particulars FY16A FY15A FY14A FY13A
Net Sales (Cr) 910.0 1,045.3 959.5 527.5
EBITDA (Cr) 156.6 184.1 115.1 19.8
PAT (Cr) 86.0 91.8 30.2 -23.2
EPS (Rs) 7.9 8.4 2.8 -2.1
Book Value (Rs) 21.5 16.6 8.2 4.6
FINANCIAL SNAPSHOT
Particulars FY16A FY15A FY14A FY13A
OPM (%) 17.2 17.6 12.0 3.7
NPM (%) 9.4 8.8 3.1 -4.4
CMP (Rs) 141.0 141.0 141.0 141.0
PE (x) 17.9 16.8 51.0 -66.4
P/Bv (x) 6.6 8.5 17.1 30.7
D/E (x) 0.6 1.2 4.1 6.9
ROE (%) 44.0 81.2 151.7 -
ROCE (%) 37.2 38.9 38.8 -
KEY FINANCIAL RATIOS
SBICAP Securities Limited / 7
Key Investment Rationale:Focus on premium coffee segment: In an effort to transform itself asone stop shop for all the types of need and due to the increasingfocus on premium coffee segment, the management has decided toset up a new freeze dried coffee plant of 5000 MT capacity in Indiawhich will get operational by FY18. The domestic capacity of 20,000MT has already reached a 100% utilization level and the Vietnamplant has been operating at a 75% level. The management has put upplans of collaborative capacity expansion of freeze dried and spraydried coffee in Vietnam as well as Switzerland.
The focus on freeze dried coffee helped the company to report 3%growth in revenue per tonne in the last quarter.
Strategies for U.S. market in place: The contribution of U.S. marketto the revenue has reached to 20%. The management has starteddevising new strategies for the market with the local partner takingthe advantage of lack of competitiveness of the Brazilian players aftereconomic turmoil in the country. The clarity over the FSMA regulationcould be expected after assembly elections however; the U.S. marketwould be crucial for the premium products segment of the company.
Strong financial position: The company has reported revenue CAGRof ~21% and PAT CAGR of ~34% over FY11-16. It also expandedoperating margin by 420 bps and net margin by 580 bps over thesame period. Healthy ROCE of 26% and ROE of 23% strengthens thefinancial position of the company.
Valuation:At the CMP of Rs. 249, the stock is available at 28.6x its TTM earnings.Niche expertise, high switching cost of clients, focus on premium productsand bright prospects of retail business maintain our confidence in thebusiness. We recommend the investment in the stock with the targetprice of Rs.293.
CCL Products India Ltd.
CHART
BSE Code: 519600 I NSE Symbol: CCL
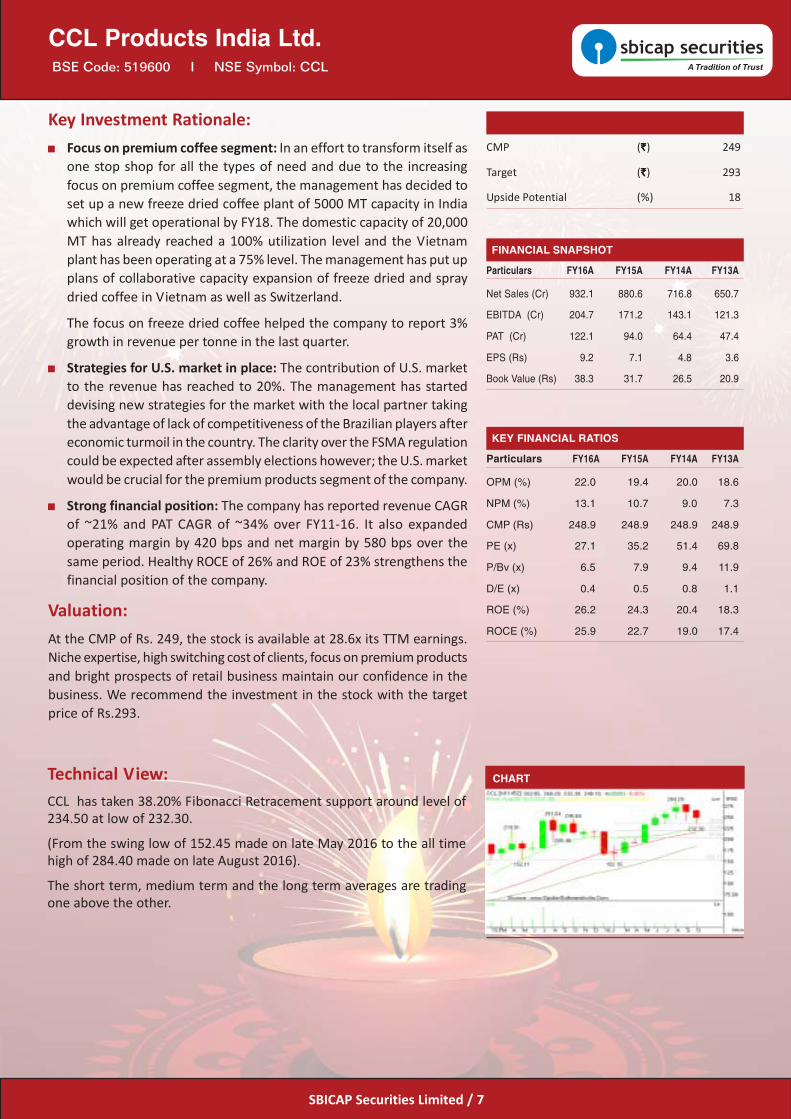
Technical View:CCL has taken 38.20% Fibonacci Retracement support around level of234.50 at low of 232.30.
(From the swing low of 152.45 made on late May 2016 to the all timehigh of 284.40 made on late August 2016).
The short term, medium term and the long term averages are tradingone above the other.
CMP ( `̀̀̀̀) 249
Target ( `̀̀̀̀) 293
Upside Potential (%) 18
Particulars FY16A FY15A FY14A FY13A
Net Sales (Cr) 932.1 880.6 716.8 650.7
EBITDA (Cr) 204.7 171.2 143.1 121.3
PAT (Cr) 122.1 94.0 64.4 47.4
EPS (Rs) 9.2 7.1 4.8 3.6
Book Value (Rs) 38.3 31.7 26.5 20.9
FINANCIAL SNAPSHOT
Particulars FY16A FY15A FY14A FY13A
OPM (%) 22.0 19.4 20.0 18.6
NPM (%) 13.1 10.7 9.0 7.3
CMP (Rs) 248.9 248.9 248.9 248.9
PE (x) 27.1 35.2 51.4 69.8
P/Bv (x) 6.5 7.9 9.4 11.9
D/E (x) 0.4 0.5 0.8 1.1
ROE (%) 26.2 24.3 20.4 18.3
ROCE (%) 25.9 22.7 19.0 17.4
KEY FINANCIAL RATIOS
SBICAP Securities Limited / 8
Key Investment Rationale:Strong business model: The company operates in two major businesssegments namely Contract Research And Manufacturing Services(CRAMS) contributing about 70% of total revenue and the remaining30% contributed by Marketable molecules. It is an integrated playerhaving specialisation in developing processes that are further scalableto commercialisation, through process research, processdevelopment or optimisation. company's subsidiary CARBOGEN
AMICS offers services ranging from chemical development to nichescale commercial manufacture and supply of API's targeting oncologysegments in US and European markets. Company's marketablemolecules division manufactures products from diversified productsegments under three major categories as Speciality Chemicals,Vitamins & Chemicals and Disinfectants. It is a global leader in thespeciality chemicals segment and a leading manufacturer of PhaseTransfer Catalysts.
Strong order book and better capacity utilisation could lead tosustainable sales growth: The company as a group possess strongorder book of more than 150 million dollar for FY17 with CARBOGENAMICS order book standing at around 80million swiss francs which isexpected to be executed till FY17. Also for the domestic markets thecompany possess an order pipeline of USD 40 million for FY17comprising profitable and complex chemistry products from largecorporate. The company is also planning to expand CARBOGEN AMICSdevelopment facility which is currently operating at 95% of itsutilisation for high potent development and small scale production.
Robust Financial Performance: The company has been posting strongset of numbers with net sales and profit growing at a CAGR growth of7 and 24 percent for FY12-16. It has also been posting strong marginwith EBITDA and PAT margin standing at 25.7% and 10.8% for FY16.Return ratios for the company have also remained consistent withROCE and ROE standing at 14 and 13 percent for FY16.
Valuation:The company is currently trading at an attractive valuation of 21.52x ofits TTM earnings as against industry standards of 28.86x with strongrevenue forecast driven mainly by robust growth in CRAMS business alsostrong growth depicted by the marketable molecules division would helpthe company to post strong performance in the forth coming quarters.We have positive view on the stock and recommend a BUY with pricetarget of Rs.281.
Dishman Pharmaceuticals & Chemicals Ltd.
CHART
BSE Code: 532526 I NSE Symbol: DISHMAN
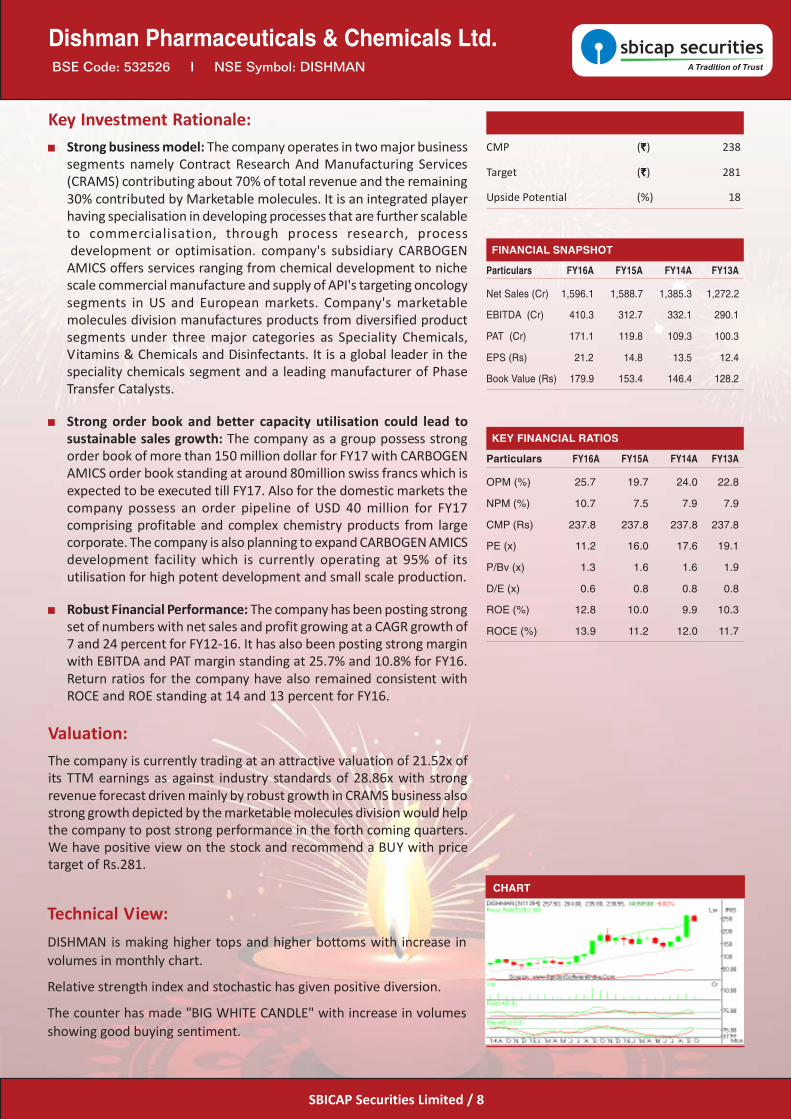
Technical View:DISHMAN is making higher tops and higher bottoms with increase involumes in monthly chart.
Relative strength index and stochastic has given positive diversion.
The counter has made "BIG WHITE CANDLE" with increase in volumesshowing good buying sentiment.
CMP ( `̀̀̀̀) 238
Target ( `̀̀̀̀) 281
Upside Potential (%) 18
Particulars FY16A FY15A FY14A FY13A
Net Sales (Cr) 1,596.1 1,588.7 1,385.3 1,272.2
EBITDA (Cr) 410.3 312.7 332.1 290.1
PAT (Cr) 171.1 119.8 109.3 100.3
EPS (Rs) 21.2 14.8 13.5 12.4
Book Value (Rs) 179.9 153.4 146.4 128.2
FINANCIAL SNAPSHOT
Particulars FY16A FY15A FY14A FY13A
OPM (%) 25.7 19.7 24.0 22.8
NPM (%) 10.7 7.5 7.9 7.9
CMP (Rs) 237.8 237.8 237.8 237.8
PE (x) 11.2 16.0 17.6 19.1
P/Bv (x) 1.3 1.6 1.6 1.9
D/E (x) 0.6 0.8 0.8 0.8
ROE (%) 12.8 10.0 9.9 10.3
ROCE (%) 13.9 11.2 12.0 11.7
KEY FINANCIAL RATIOS

SBICAP Securities Limited / 9
Key Investment Rationale:Larget NBFC by AUM: L&T Finance Holdings Ltd (LTFH) is amongstthe largest NBFC by size with a play on growth engines of India. Theyoffer a diverse range of financial products and services across retail,corporate, housing and infrastructure finance sector. With awidespread reach with 700+ points of presence and in 24 out of 29states, the company has total assets in excess of Rs 50,000 cr with aportfolio of 17 lending products complemented by AMC and WealthManagement.
Leadership position in 4 key businesses: LTFH holds a number twoposition in renewable energy project finance. With 8% and 10%market share, it is positioned in top 3 in tractor finance and top 5 intwo wheeler finance. For Microfinance business, LTFH holds 7thposition based on its asset size.
Improved asset quality: Company has improved its asset quality withGNPA coming down to 4.58% in Q1FY17 from 5.45% in the sameperiod last year. Net NPA also improved to 3.13% from 4.43% in thesame period. As the company has started focusing more on retailfinancing and low yielding assets, the asset quality stands improved.
Valuation:At consolidated level, L&TFH is currently trading at a P/B of 2.5x of itsFY16 book. With improving asset quality due to product mix coupledwith improving ROE justifies stocks performance and rerating. We expectthe company to maintain its growth in FY17 aided by the implementationof 7th pay commission and normal monsoon this year leading to increasein the disposable income of the customer and recommend a BUY with aprice target of Rs 118.
L&T Finance Holdings Ltd.
CHART
BSE Code: 533519 I NSE Symbol: L&TFH
Technical View:L&TFH is trading above upper Expanding Band Bollinger with rise involumes.
The counter is making higher tops and higher bottoms in monthly chart.
Relative Strength Index has given positive diversion.
CMP ( `̀̀̀̀) 102
Target ( `̀̀̀̀) 118
Upside Potential (%) 16
Particulars FY16A FY15A FY14A FY13A
Revenue (Cr) 7288.8 6196.2 5055.9 3943.0
EBITDA (Cr) 5459.6 4694.2 3978.9 3164.4
PAT (Cr) 856.7 854.7 596.9 730.5
EPS (Rs) 4.8 4.8 3.4 4.2
Book Value(Rs) 41.0 36.5 33.2 31.2
FINANCIAL SNAPSHOT
Particulars FY16A FY15A FY14A FY13A
OPM (%) 73.7 74.2 77.1 78.5
NPM (%) 11.8 13.8 11.8 18.5
CMP (Rs) 102.2 102.2 102.2 102.2
PE (x) 21.3 21.3 30.0 24.3
P/Bv (x) 2.5 2.8 3.1 3.3
D/E (x) 0.8 0.8 0.8 NA
ROE (%) 10.1 10.7 9.2 11.6
ROCE (%) 9.7 9.8 10.0 10.2
KEY FINANCIAL RATIOS
SBICAP Securities Limited / 10
Key Investment Rationale:Diversified Portfolio: NOCIL has a diversified portfolio and is a onestop shop for almost all rubber applicable industries. It is one of themost dependable and sought player in Rubber Chemical Industry fromNon China Supply source. The product portfolio includes:Accelerators, Antidegradants, Antioxidants, Pre Vulcanization inhibitorand Post Vulcanization stabilizer.
Expansion by tyre companies: The Tyre segment is largest consumingsegment accounting for 65% of the total business. With most tyrecompanies having started consolidating their operations in & aroundAsia closer to the growth markets, NOCIL will benefit the most fromany additional capacities being put up by these tyre companies inIndia
Strong Financial Performance: Over the last three years, the companyhas grown its revenue at CAGR of ~13.5%. However the operatingmargins and net margins expanded from 4.3% and 4.1% in FY13 to19.5% and 10.9% in FY16. The company has significantly reduced itstotal debt from Rs. 147.3 cr in FY15 to Rs 25.8 cr FY16. It alsoanticipates another round of capex of ~ INR 1.5 bn at Dahej whichwould mainly be funded by internal accruals.
Valuation:At CMP of Rs. 78.55 the stock is trading at 11.4x of September 2016TTM earnings. With higher domestic volumes, better product-mix andcontinual improvements in operational efficiencies, particularly at thenew plant in Dahej, we expect NOCIL to continue with healthy growthand margins going forward. We have positive view on the stock andrecommend a BUY with price target of Rs 94.
NOCIL Ltd.
CHART
BSE Code: 500730 I NSE Symbol: NOCIL
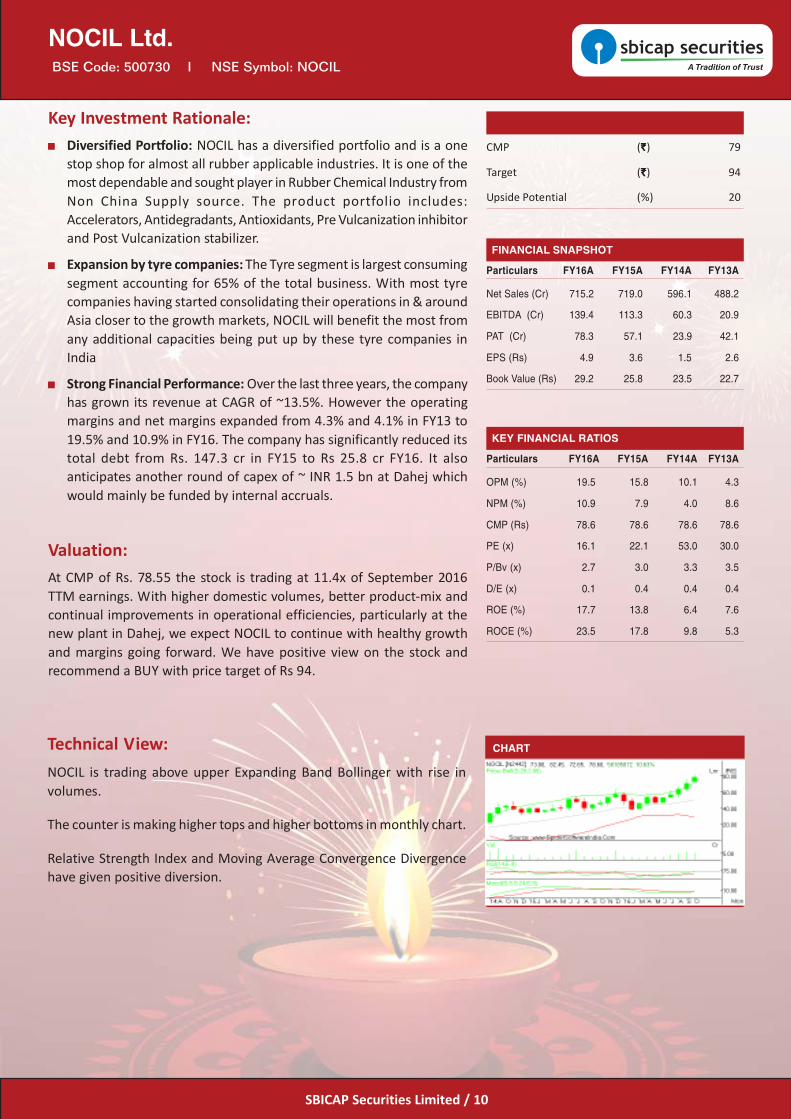
Technical View:NOCIL is trading above upper Expanding Band Bollinger with rise involumes.
The counter is making higher tops and higher bottoms in monthly chart.
Relative Strength Index and Moving Average Convergence Divergencehave given positive diversion.
CMP ( `̀̀̀̀) 79
Target ( `̀̀̀̀) 94
Upside Potential (%) 20
Particulars FY16A FY15A FY14A FY13A
Net Sales (Cr) 715.2 719.0 596.1 488.2
EBITDA (Cr) 139.4 113.3 60.3 20.9
PAT (Cr) 78.3 57.1 23.9 42.1
EPS (Rs) 4.9 3.6 1.5 2.6
Book Value (Rs) 29.2 25.8 23.5 22.7
FINANCIAL SNAPSHOT
Particulars FY16A FY15A FY14A FY13A
OPM (%) 19.5 15.8 10.1 4.3
NPM (%) 10.9 7.9 4.0 8.6
CMP (Rs) 78.6 78.6 78.6 78.6
PE (x) 16.1 22.1 53.0 30.0
P/Bv (x) 2.7 3.0 3.3 3.5
D/E (x) 0.1 0.4 0.4 0.4
ROE (%) 17.7 13.8 6.4 7.6
ROCE (%) 23.5 17.8 9.8 5.3
KEY FINANCIAL RATIOS

SBICAP Securities Limited / 11
Key Investment Rationale:Improving business mix: The loan portfolio rationalization initiativeby the management has started reflecting in the bank performanceover the last three years. Retail lending has been reporting doubledigit growth through FY12-16. 24% growth in retail lending in FY16spiked up the percentage of Retail advances to gross advances to9.93% by the end of FY16. The bank has put MSME segment on anvil.With the addition of 58 new specialized branches, the total specializedMSME branches count has reached 108.
The share of retail segment in the total business has increased to~23% in FY16 from 18.5% in FY12 whereas; share of corporatebusiness shrank to 55% in FY16 from 59.1% in FY12.
Focus on improving asset quality: The bank has been struggling withquality of the advances mainly from priority sector and agriculturesector. The bank has started concentrating on containing NPA throughorganized recovery camps and newly formulated short term schemesfor settlement of NPAs. In FY16, 1366 cases amounting to Rs. 39.28crore were settled and the bank has targeted the recovery of Rs. 946crore in the next fiscal.
Healthy financial performance: The bank has increased its NII at CAGRof 15.87% with NIM expansion of ~50 bps over the last three fiscals.Credit/deposit ratio expanded by 200 bps to 71.8% with CASAexpansion to 22.7% over the same period.
Valuation:At the current price of Rs. 53, the stock is available at 0.38x its bookvalue as at Q1FY17. Credit growth pick up, lucrative opportunities fromMSME segment and expected check on asset quality make us bullish onthe business. We recommend the buying in the stock with price targetof Rs.64.
Punjab and Sindh Bank
CHART
BSE Code: 533295 I NSE Symbol: PSB
Technical View:PSB has shown long term downwards slopping trend line breakout.
The counter is making higher bottoms in monthly chart.
Relative Strength Index and Moving Average Convergence Divergencehave given positive diversion.
CMP ( `̀̀̀̀) 53
Target ( `̀̀̀̀) 64
Upside Potential (%) 20
Particulars FY16A FY15A FY14A FY13A
NII (Cr) 2,175.8 1,679.2 1,620.6 1,641.0
PAT (Cr) 336.0 121.4 300.6 339.1
Loan Book (Cr) 63,916.1 63,870.2 57,239.1 51,430.8
Total Assets (Cr) 102,581.4 97,848.3 94,624.2 80,488.6
GNPA (Cr) 4,229.1 3,082.2 2,553.5 1,536.9
NIM (%) 2.2 1.8 1.9 2.2
FINANCIAL SNAPSHOT
Particulars FY16A FY15A FY14A FY13A
P/BV (x) 0.4 0.4 0.5 0.5
PE (x) 6.4 17.6 7.1 6.3
Div. Yield (%) 16.5 6 22 26.8
ROE (%) 6.8 2.76 7.36 9.18
ROA (%) 0.3 0.1 0.3 0.4
KEY FINANCIAL RATIOS
SBICAP Securities Limited / 12
Key Investment Rationale:Strong Global Portfolio brands: The company carries strong globalportfolio of brands which makes it world's second largest brandedtea player in the world. They have a strong portfolio of brands,including Tata Tea, Tetley, Jemca, Vitax, Eight O'Clock Coffee,Himalayan, Tata Gluco+, Grand Coffee and Joekels. The companycurrently manages a portfolio of 294 blends and is planning to launch~50 unique blends each year globally. Also to serve the growing tastefor green tea the new focus will be to launch a new segment withvaried blends of green tea.
Rapidly expanding Starbucks Coffee Chain: The starbucks coffeechain has been expanding rapidly to reach 82 stores across 7 cities atpresent. Also the acquisition of MAP brand has cleared the path toentry into Australian market in coffee segment.
Strong Financial Performance: The company has reported single digitgrowth in sales over the last 5 years but with high double digit growthand increased contribution by Starbucks, Tetley, Tata Gluco+ andHimalayan brands, we expect growth to improve going forward. Alsoit has strengthened its balance sheet by reducing the debt level to0.13 D/E.
Valuation:At CMP of Rs. 154.05 the stock is trading at 27.3x of June 2016 TTMearnings. With high growth in green tea brand, aggressive expansion ofstarbucks coffee chain and increasing prices of coffee globally, we expectthe company to come with better growth going forward and hence werecommend a BUY with a target price of Rs 178.
Tata Global Beverages Ltd.
CHART
BSE Code: 500800 I NSE Symbol: TATAGLOBAL
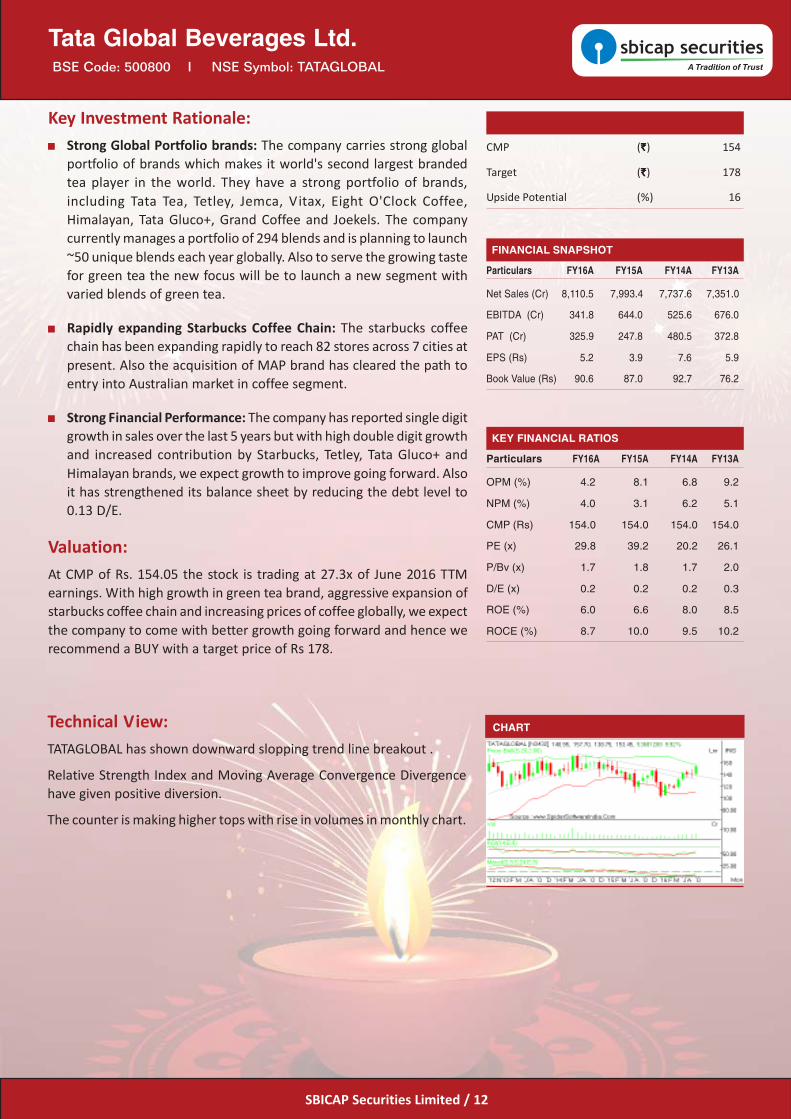
Technical View:TATAGLOBAL has shown downward slopping trend line breakout .
Relative Strength Index and Moving Average Convergence Divergencehave given positive diversion.
The counter is making higher tops with rise in volumes in monthly chart.
CMP ( `̀̀̀̀) 154
Target ( `̀̀̀̀) 178
Upside Potential (%) 16
Particulars FY16A FY15A FY14A FY13A
Net Sales (Cr) 8,110.5 7,993.4 7,737.6 7,351.0
EBITDA (Cr) 341.8 644.0 525.6 676.0
PAT (Cr) 325.9 247.8 480.5 372.8
EPS (Rs) 5.2 3.9 7.6 5.9
Book Value (Rs) 90.6 87.0 92.7 76.2
FINANCIAL SNAPSHOT
Particulars FY16A FY15A FY14A FY13A
OPM (%) 4.2 8.1 6.8 9.2
NPM (%) 4.0 3.1 6.2 5.1
CMP (Rs) 154.0 154.0 154.0 154.0
PE (x) 29.8 39.2 20.2 26.1
P/Bv (x) 1.7 1.8 1.7 2.0
D/E (x) 0.2 0.2 0.2 0.3
ROE (%) 6.0 6.6 8.0 8.5
ROCE (%) 8.7 10.0 9.5 10.2
KEY FINANCIAL RATIOS
SBICAP Securities Limited / 13
Key Investment Rationale:Strategic location of Luxurious resorts: The company currently has 4resorts located strategically in and around Mumbai and Goa. The BykeOld Anchor, Located in South Goa near the Cavelossim Beach, this isa lavish resort with 236 guest rooms spread across 19 acres of land.The Byke Hidden Paradise , Located in North Goa near the Ashwembeach, this is a pretty and charming boutique resort with 29 guestrooms. The Byke Heritage, Situated at the eco friendly hill station ofMatheran, this resort is majestic, offering a well balanced mix ofheritage, luxury and recreation. The Byke Neelkanth, Situated in thepretty hill station of Manali, this boutique hotel of 20 rooms, offersan awe inspiring view of the Rohtang Valley and the Snow clad peaksof Manali.
Set to grow on strong footing in the niche domestic markets: Thecompany currently operates through 8 (owned and leased) propertiesacross the country. The presence at all the major religious holydestinations through the asset light room chartering model and thefocus on vegetarian cuisine segment helps the company to rapidlygain market share in the domestic market. The company has addedtwo new property to take total rooms to 677 in FY16. It has alsoidentified eight new locations to add another 452-500 rooms goingforward through presence in pan India tourist locations.
Strong financial performance and Asset light business model: Thecompany has strong financial as its has very little debt on the bookand thus carries asset light business model due to leasing nature ofbusiness. The quarterly numbers since last many quarters are growingin higher double digit with continuous margin improvement.
Valuation:At the CMP of Rs.182, the stock is priced at 26.3x TTM earnings. Thenascent stage of the company in high growth industry, servicedifferentiation and the addition new properties makes the investmentin the stock lucrative. We are bullish on the stock with the target price ofRs.219.
The Byke Hospitality Ltd.
CHART
BSE Code: 531373 I NSE Symbol: BYKE
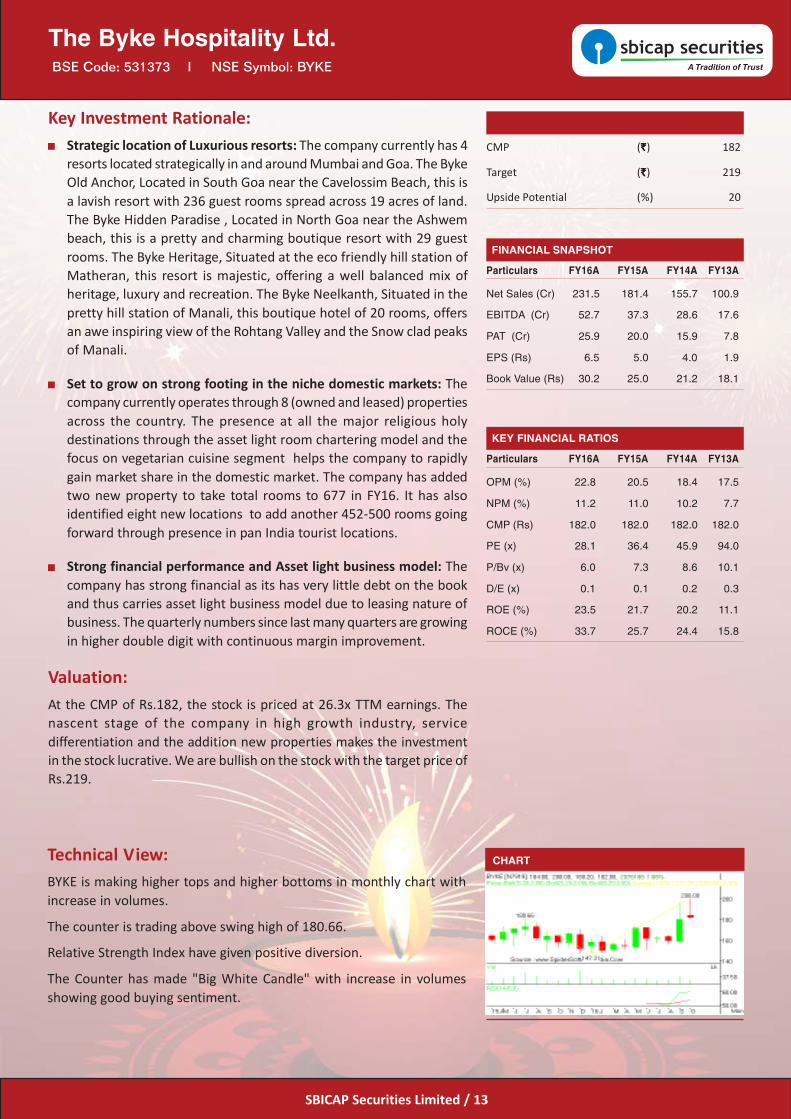
Technical View:BYKE is making higher tops and higher bottoms in monthly chart withincrease in volumes.
The counter is trading above swing high of 180.66.
Relative Strength Index have given positive diversion.
The Counter has made "Big White Candle" with increase in volumesshowing good buying sentiment.
CMP ( `̀̀̀̀) 182
Target ( `̀̀̀̀) 219
Upside Potential (%) 20
Particulars FY16A FY15A FY14A FY13A
Net Sales (Cr) 231.5 181.4 155.7 100.9
EBITDA (Cr) 52.7 37.3 28.6 17.6
PAT (Cr) 25.9 20.0 15.9 7.8
EPS (Rs) 6.5 5.0 4.0 1.9
Book Value (Rs) 30.2 25.0 21.2 18.1
FINANCIAL SNAPSHOT
Particulars FY16A FY15A FY14A FY13A
OPM (%) 22.8 20.5 18.4 17.5
NPM (%) 11.2 11.0 10.2 7.7
CMP (Rs) 182.0 182.0 182.0 182.0
PE (x) 28.1 36.4 45.9 94.0
P/Bv (x) 6.0 7.3 8.6 10.1
D/E (x) 0.1 0.1 0.2 0.3
ROE (%) 23.5 21.7 20.2 11.1
ROCE (%) 33.7 25.7 24.4 15.8
KEY FINANCIAL RATIOS

SBICAP Securities Limited / 14
Key Investment Rationale:Continued robust performance by TV broadcasting segment: TVbroadcasting segment which contributes to ~95% of the revenue hasshown double digit growth in both subscription revenue andadvertisement revenue. The flagship channels, Aaj Tak, Headlinestoday and TEZ continued to win recognition for quality and haveexpanded their market share to 18.4%, 14.4% and 4.2% respectivelyat present. The company has recently launched a new 24 hour Englishnews channel, India Today Television to its portfolio. During the periodof upcoming state assembly elections, the viewership and theadvertisement revenue is poised to grow rapidly. The management'sfocus towards digital and new media and the strategic initiative toinclude more local contents in the print media is set to boost theadvertisement revenue during the period of state assembly elections.
Bright industry outlook: With the digitization process of TVbroadcasting in place and the strong steps taken by the Ministry ofInformation and Broadcasting, the subscription revenue reporting isset to be more transparent and addressable and the growth rate isexpected to grow by more than 16% outpacing the advertisingrevenue growth. Going forward, television advertising in India isexpected to grow at a CAGR of 14% till 2019, to reach INR 29900crore. The penetration of FM radio broadcasting is expected to reach85 cities in the near future.
Strong financials: The company has freed up its balance sheet fromdebt in FY16. The media house grew its revenue at ~13.2% CAGRover FY11-16 and the bottom line increased at CAGR of ~50% overthe same period. ROCE and ROE expanded by over 2300 bps and1500 bps respectively through FY11-16. The company has beenreporting good set of numbers over the last few quarters withexpanded profit margins.
Valuation:At the CMP of Rs. 339, the stock is available at 20x its TTM earnings.Increasing market share of the media house, expected pickup inadvertising revenue and the launch of regional language channelsreinforces our confidence in the company. Comparatively attractive priceprovides buying opportunity with the target of Rs.401.
TV Today Network Ltd.
CHART
BSE Code: 532515 I NSE Symbol: TVTODAY
Technical View:TVTODAY has given a breakout from Symmetrical Triangle (Continuation)pattern in monthly chart.
Relative Strength Index and Stochastic have given positive diversion.
The counter is making higher tops and higher bottoms in monthly chart.
CMP ( `̀̀̀̀) 339
Target ( `̀̀̀̀) 401
Upside Potential (%) 18
Particulars FY16A FY15A FY14A FY13A
Net Sales (Cr) 546.0 476.6 389.4 312.7
EBITDA (Cr) 146.3 131.7 109.3 34.6
PAT (Cr) 94.3 81.0 61.3 12.2
EPS (Rs) 15.8 13.6 10.3 2.0
Book Value (Rs) 89.1 75.4 63.5 54.4
FINANCIAL SNAPSHOT
Particulars FY16A FY15A FY14A FY13A
OPM (%) 26.8 27.6 28.1 11.1
NPM (%) 17.3 17.0 15.7 3.9
CMP (Rs) 339.0 339.0 339.0 339.0
PE (x) 21.4 25.0 33.0 165.6
P/Bv (x) 3.8 4.5 5.3 6.2
D/E (x) - 0.0 0.0 0.2
ROE (%) 19.2 19.6 17.4 3.8
ROCE (%) 29.1 28.3 24.0 5.3
KEY FINANCIAL RATIOS

DISCLOSURES &DISCLAIMERS:Analyst Certification: The views expressed in this research report ("Report") accurately reflect the personal views of the research analysts ("Analysts") employed bySBICAP Securities Limited (SSL) about any and all of the subject issuer(s) or company(ies) or securities. This report has been prepared based upon informationavailable to the public and sources, believed to be reliable. I/We also certify that no part of my/our compensation was, is, or will be directly or indirectly related to thespecific recommendation(s) or view(s) in this report.The Analysts engaged in preparation of this Report or his/her relative:-(a) do not have any financial interests in the subject company mentioned in this Report; (b) do not own 1% or more of the equity securities of the subject companymentioned in the report as of the last dayof the month preceding the publication of the research report; (c) do not have any material conflict of interest at the timeof publication of the Report.The Analysts engaged in preparation of this Report:-(a) have not received any compensation from the subject company in the past twelve months; (b) have not managed or co-managed public offering of securities forthe subject company in the past twelve months; (c)have not received any compensation for investment banking or merchant banking or brokerage services from thesubject company in the past twelve months; (d) have not received any compensation for products orservices other than investment banking or merchant banking orbrokerage services from the subject company in the past twelve months; (e) has not received any compensation or other benefits from the subjectcompany or thirdparty in connection with the Report; (f) has not served as an officer, director or employee of the subject company; (g) is not engaged in market making activity for thesubject company.Name Qualification DesignationAshu Bagri B.Com AVP - Technical AnalystAmit Bagade MBA Technical AnalystRajesh Gupta PGDBM (Finance) AVP - ResearchVijay Ramchandani M.Com (Finance) Research AnalystVaibhav Joshi MMS (Finance) Research AssociateRahul Meshram MSc. (Finance) Research Associate
Other Disclosures :SBICAP Securities Limited ("SSL"),a full service Stock Broking company, is engaged in diversified financial services business including equity broking, DP services,distribution of Mutual Fund, insurance products and other financial products.SSL is a member of National Stock Exchange of India Limited and BSE Limited. SSL is alsoa Depository Participant registered with NSDL & CDSL. SSL is a large broking house catering toretail, HNI and institutional clients. It operates through its branches andauthorized persons spread across the country and the clients are provided online trading through internet and offline tradingthrough branches and call & tradefacility. SSL is a wholly owned subsidiary of SBI Capital Markets Limited ("SBICAP"), which is engaged into investment banking, project advisory and financial servicesactivities and is registered with the Securities and Exchange Board of India as a "Category I" Merchant Banker. SBICAP is a wholly owned subsidiary of State Bank ofIndia. Hence, State Bank of India and all its subsidiaries, including, SBICAP and banking subsidiaries are treated and referred to as Associates of SSL.We hereby declare that our activities were neither suspended nor we have materially defaulted with any stock exchange authority with whom we are registered inlast five years. However SEBI, Exchanges and Depositories have conducted the routine inspection and based on their observations have issued advice letters or leviedminor penalty for certain procedural lapses. We have not been debarred from doing business by any Stock Exchange / SEBI or any other authorities; nor has ourcertificate of registration been cancelled by SEBI at any point of time.SSL or its Associates, may: (a) from time to time, have long or short position in, and buy or sell the securities of the company mentioned in the Report or (b) beengaged in any other in any other transaction involving such securities and earn brokerage or other compensation or act as a market maker in the financial instrumentsof the company discussed herein or act as an advisor or lender/borrower to such company or may have any other potential conflict of interests with respect to anyrecommendation and other related information and opinions.SSLdoes not have actual / beneficial ownership of one per cent or more securities of the subject company, at the end of the month immediately preceding the dateof publication of the Report.However, since Associates of SSL are engaged in the financial services business, they might have in their normal course of businessfinancial interests or actual / beneficial ownership of one per cent or more in various companies including the subject company mentioned herein this Report.SSL or its Associates might have managed or co-managed public offering of securities for the subject company in the past twelve months and might have receivedcompensation from the companies mentioned in the Report during the period preceding twelve months from the date of this Report for services in respect ofmanaging or co-managing public offerings/corporate finance, investment banking or merchant banking, brokerage services or other advisory services in a merger orspecific transaction.Compensation paid to Analysts of SSL is not based on any specific merchant banking, investment banking or brokerage service transaction.SSL or its Associate did not receive any compensation or any benefit from the subject company or third party in connection with preparation of this Report.
SBICAP Securities Limited(CIN): U65999MH2005PLC155485 I Research Analyst Registration No INH000000602
SEBI Registration No.: NSE Capital Market: INB 231052938 | NSE Derivatives: INF 231052938 | BSE Capital Market: INB 011053031Currency Derivatives: INE231052938 | CDSL: IN-DP-CDSL-370-2006 | IRDA/IR2/2014/241
Regd. & Corporate Office: SBICAP Securities Limited, Marathon Futurex, 12th Floor, A & B Wing, Mafatlal Mill Compound,N. M. Joshi Marg, Lower Parel, Mumbai - 400013 I Tel.: 91-22-42273300 / 3301 (Board)
For any information contact us:Toll Free: 1800-22-33-45 I 1800-209-93-45
E-mail: [email protected] I Web: www.sbismart.com

This Report is for the personal information of the authorized recipient(s) and is not for public distribution and should not be reproduced, transmitted or redistributedto any other person or in any form without SSL's prior permission. The information provided in the Report is from publicly available data, which we believe, arereliable. While reasonable endeavors have been made to present reliable data in the Report so far as it relates to current and historical information, but SSL does notguarantee the accuracy or completeness of the data in the Report. Accordingly, SSL or any of its Associates including directors and employees thereof shall not be inany way responsible or liable for any loss or damage that may arise to any person from any inadvertent error in the information contained, views and opinionsexpressed in this Report or in connection with the use of this Report.Please ensure that you have read "Risk Disclosure Document for Capital Market and Derivatives Segments" as prescribed by Securities and Exchange Board of Indiabefore investing in Indian securities market.The projections and forecasts described in this Report should be carefully evaluated as these :1. Are based upon a number of estimates and assumptions and are inherently subject to significant uncertainties and contingencies.2. Can be expected that some of the estimates on which these were based, will not materialize or will vary significantly from actual results, and such variances may
increase over time.3. Are not prepared with a view towards compliance with published guidelines or generally accepted accounting principles. No independent accountants have
expressed an opinion or any other form of assurance on these.4. Should not be regarded, by mere inclusion in this report, as a representation or warranty by or on behalf of SSL the authors of this report, or any other person,
that these or their underlying assumptions will be achieved.This Report is for information purposes only and SSL or its Associates accept no liabilities for any loss or damage of any kind arising out of the use of this report.Though disseminated to recipientssimultaneously, not all recipients may receive this report at the same time. SSL will not treat recipients as clients by virtue of theirreceiving this report.It should not be construed as an offer to sell or solicitation of an offer to buy, purchase or subscribe to any securities this report shall not formthe basis of or be relied upon in connection with any contract or commitment, whatsoever. This report does not solicit any action based on the material containedherein.It does not constitute a personal recommendation and does not take into account the specific investment objectives, financial situation/circumstances and theparticular needs of any specific person who may receive this document. The securities discussed in this Report may not be suitable for all the investors. SSL does notprovide legal, accounting or tax advice to its clients and you should independently evaluate the suitability of this Report and all investors are strongly advised to seekprofessional consultation regarding any potential investment.Certain transactions including those involving futures, options, and other derivatives as well as non-investment grade securities give rise to substantial risk and arenot suitable for all investors. Foreign currency denominated securities are subject to fluctuations in exchange rates that could have an adverse effect on the value orprice of or income derived from the investment.The price, value and income of the investments referred to in this Report may fluctuate and investors may realize losses on any investments. Past performance is nota guide for future performance. Actual results may differ materially from those set forth in projections. SSL has reviewed the Report and, the current or historicalinformation included here is believed to be reliable, the accuracy and completeness of which is not guaranteed. SSL does not have any obligationto update theinformation discussed in this Report.The opinions expressed in this report are subject to change without notice and SSL or its Associates have no obligation to tell the clients when opinions or informationin this report change. This Report has not been approved and will not or may not be reviewed or approved by any statutory or regulatory authority in India, UnitedKingdom or Singapore or by any Stock Exchange in India, United Kingdom or Singapore. This report may not be all inclusive and may not contain all the informationthat the recipient may consider material.The securities described herein may not be eligible for sale in all jurisdictions or to all categories of investors. The countries in which the companies mentioned in thisReport are organized may have restrictions on investments, voting rights or dealings in securities by nationals of other countries. Distributing /taking/sending/dispatching/transmitting this document in certain foreign jurisdictions may be restricted by law, and persons into whose possession this document comes shouldinform themselves about, and observe, any such restrictions. Failure to comply with this restriction may constitute a violation of laws in that jurisdiction.____________________________________________________________________________________________________________________________________________Legal Entity DisclosureSingapore: This Report is distributed in Singapore by SBICAP (Singapore) Limited (Registration No. 201026168R), an Associate of SSL incorporated in Singapore.SBICAP (Singapore) Limited is regulated by the Monetary Authority of Singapore as a holder of a Capital Markets Services License and an Exempt Financial Adviser inSingapore. SBICAP (Singapore) Limited's services are available solely to persons who qualify as Institutional Investors or Accredited Investors (other than individuals)as defined in section 4A(1) of the Securities and Futures Act, Chapter 289 of Singapore (the "SFA") and this Report is not intended to be distributed directly orindirectly to any other class of persons. Persons in Singapore should contact SBICAP (Singapore) Limited in respect of any matters arising from, or in connection withthis report via email at [email protected] by call at +65 6709 8651..United Kingdom: SBICAP (UK) Limited, a fellow subsidiary of SSL, incorporated in United Kingdom is authorised and regulated by the Financial Conduct Authority.This marketing communication is being solely issued to and directed at persons (i) fall within one of the categories of "Investment Professionals" as defined in Article19(5) of the Financial Services and Markets Act 2000 (Financial Promotion) Order 2005, as amended (the "Financial Promotion Order"), (ii) fall within any of thecategories of persons described in Article 49 of the Financial Promotion Order ("High net worth companies, unincorporated associations etc.") or (iii) any otherperson to whom it may otherwise lawfully be made available (together "Relevant Persons") by SSL. The materials are exempt from the general restriction on thecommunication of invitations or inducements to enter into investment activity on the basis that they are only being made to Relevant Persons and have therefore notbeen approved by an authorised person as would otherwise be required by section 21 of the Financial Services and Markets Act 2000 ("FSMA").