Embed Size (px)
Citation preview

Compaction Behavior and Mechanical Properties of UniaxiallyPressed Bi-W Composites
L. PETER MARTIN, ANDREA M. HODGE, and GEOFFREY H. CAMPBELL
Powder metallurgy is a useful route to forming particulate composite materials; however, thedensification of hard and soft powder mixtures is usually inhibited by the more refractory phase.The Bi-W powder compacts were uniaxially pressed at room temperature and the compactionbehavior and mechanical properties were evaluated. Pressing was performed in incrementalsteps from ~1 to 540 MPa. After each step, the pressure was relieved and the thickness andsound-wave transit time were measured in situ (in the die), in order to determine the density andsound-wave velocity in the compact. The data show that the unreinforced Bi powder compactsto ~98 pct density at 540 MPa. The W reinforcement inhibits the densification process, resultingin increased levels of residual porosity. The compaction behavior was evaluated using a mod-ified Heckel equation, while the porosity dependence of the ultrasonically determined elasticmodulus was described by a site percolation approach. Postcompaction sound-wave velocityand Vicker’s hardness measurements show<5 pct anisotropy between the axial (pressing) andradial directions. The mechanical characterization illustrates the competing effects of the Wreinforcement and the associated residual porosity.
DOI: 10.1007/s11661-009-9935-9� The Author(s) 2009. This article is published with open access at Springerlink.com
I. INTRODUCTION
POWDER metallurgy is a useful route to the near-net-shape fabrication of engineering components for avariety of applications. It allows consolidation without amelt-processing step, which can be advantageous forhigh-melting-point materials such as the refractorymetals or ceramics. It is also useful for formingparticulate composites from materials with greatly dif-fering properties, such as oxide-dispersion-strengthenedsteels[1] or, as in the present case, Bi-W materialsfor environmentally friendly ammunition. Room-temperature powder compaction is an important partof this method, whether as a primary consolidationprocess or as a precursor to sintering. Models describingthe behavior of powders during compaction are a usefultool for comparing different materials or preparationprocedures (additives, milling, particle sizes, etc.) andfor estimating porosity based on the compaction con-ditions. The various empirical models are probably themost widely applied method for the evaluation ofcompaction behavior;[2–5] however, it can be difficult to
directly correlate the fitting parameters with the actualphysical characteristics of the materials. In addition,there exist relatively few studies comparing fittingparameters with the measured physical properties,[5,6]
particularly for composite mixtures. Similar commentscan be made with respect to the analysis of thedependence of the mechanical properties on porosity,for which the most widely applied models are alsolargely empirical.[7] In particular, the elastic propertiesare highly dependent upon the microstructure, whichcan be difficult to quantify in a way that is useful asinput to theoretical models. Empirical modeling of boththe compaction and mechanical properties can provideuseful quantitative measures of the compaction behaviorand the poroelastic response and can provide valuableinsight into the processes involved.In the present study, the compaction of composite
mixtures of Bi and W powders is evaluated within thecontext of the modified Heckel equation.[5] As expected,the powder mixtures behave similarly to the matrix (Bi)powder, but require higher applied pressure to reachcomparable density due to a stress shielding effect of thereinforcing phase.[8–13] An experimental configuration isused in which compaction is performed incrementally,and the data are acquired in situ (without removing thecompact from the die) but at zero applied pressure.Longitudinal sound-wave velocity measurements werealso performed in situ, allowing calculation of thestiffness of the compacts in the pressing direction. Thepore-free stiffness is estimated from the compaction datausing a percolation model, and the compositionaldependence compares favorably with the theoreticalbounds proposed by Hashin and Shtrikman.[14]
Postcompaction density and sound-wave velocitymeasurements were also made ex situ (outside the die).
U.S. GOVERNMENT WORK
NOT PROTECTED BY U.S. COPYRIGHT
L. PETER MARTIN, Engineer, formerly with the CondensedMatter and Materials Science Division, Lawrence Livermore NationalLaboratory, is with Tyco Thermal Controls, Menlo Park, CA 94025.ANDREA M. HODGE, formerly Metallurgist, Condensed Matterand Materials Science Division, Lawrence Livermore NationalLaboratory, is Assistant Professor, Aerospace and MechanicalEngineering Department, University of Southern California, LosAngeles, CA 90089. GEOFFREY H. CAMPBELL, ScientificCapability Leader for Ultrafast Materials Science, is with theCondensed Matter and Materials Science Division, Lawrence Liver-more National Laboratory, Livermore, CA 94550. Contact e-mail:[email protected]
Manuscript submitted June 15, 2007.Article published online July 30, 2009
2124—VOLUME 40A, SEPTEMBER 2009 METALLURGICAL AND MATERIALS TRANSACTIONS A

The ex-situ measurements were used to evaluate theisotropy of the powder compacts and to calculate thebulk, shear, and Young’s moduli. These moduli aremodeled using the Mori–Tanaka (MT) effective fieldtheory[15] to evaluate the effect of the W and porosityphases in the Bi matrix. Finally, Vicker’s hardnessmeasurements were performed to estimate the variationin strength with composition. The composition depen-dence of the measured hardness is shown to be quali-tatively similar to that of the yield stress predicted by theHeckel analysis of the compaction data.
II. EXPERIMENTAL
The Bi-W powder metal composites were fabricatedby cold compacting mixtures of commercial Bi and Wpowders (Alfa Aesar 10111 and 10400, respectively, AlfaAesar, Ward Hill, MA). Typical bulk properties for Biand W are given in Table I for reference. The powderswere stored and handled under N2, with an O2 level<200 ppm. Figures 1(a) and (b) show scanning electronmicroscopy (SEM) micrographs of the loose powders. InFigure 1(a), the Bi powder can be seen to exhibit particlesizes ranging from<1 to>30 lm, with a random shapecharacteristic of milling. In Figure 1(b), the W iscomparatively finer, with a more uniform particle size.Figure 1(c) shows particle size analyses for the twopowders.[16] The particle size analyses indicate that theBi powder has a D50 = 10 lm, while the W powder hasa D50 = 5.8 lm. The analysis also shows the W to besomewhat bimodal, with a secondary peak at approx-imately 1.5 lm. An X-ray diffraction analysis wasperformed on the powders to evaluate the phase purity.The major Bi2O3 peak was barely resolved and no otheroxides were detectable. This indicates that the oxidecontent is less than ~5 pct. The powders were mixedfor 3600 seconds (1 hour) in a Nalgene jar (ThermoScientific, Rochester, NY) using a Turbula mixer(Will A. Bachofen, Basel, Switzerland). Nylon spheres12.5 mm in size were used as media to assist the processand could be separated using a coarse sieve. The mixedpowders were then poured into a double-ended stainlesssteel cylindrical die (inner diameter 15.88 mm) andleveled using a straight edge aligned with the top of thedie. The loaded die was removed from the glovebox forcompaction of the powders.
Uniaxial compaction was performed in air using astandard laboratory hydraulic press. The applied forcewas monitored using an Interface 1220-AF load cell
(Interface, Scottsdale, AZ) and 9840 gage. The compac-tion was performed in incremental steps from ~1 to540 MPa. After each step, the pressure was relievedfrom the mold and the thickness of the powder compactwas determined in situ (without removing from the
Table I. Bulk Properties of Bi and W
Property W Bi
Density (g/cm3) 19.3 9.8L-wave velocity (mm/ls) 5.18 2.18C33 (GPa) 518 50S-wave velocity (mm/ls) 2.87 1.10Bulk modulus (GPa) 310 35Shear modulus (GPa) 156 12Poisson’s ratio 0.29 0.35
Fig. 1—(a) SEM micrograph of Bi powder (top), (b) SEM micro-graph of W powder (bottom), and (c) particle size analysis of Bi andW powders.
METALLURGICAL AND MATERIALS TRANSACTIONS A VOLUME 40A, SEPTEMBER 2009—2125

mold). This was done by measuring the distancebetween the opposing ends of the upper and lowerpunches and comparing that distance with the samedimension measured on the empty mold. The 5-MHzlongitudinal sound-wave velocity in the powder compactwas also determined in situ at zero pressure. This wasdone by measuring the time of flight required for thesound waves to transit between the end faces of the twopunches and comparing the measured time with thecorresponding value for the empty mold. The velocitywas calculated as the ratio of the thickness of thecompact and the time required for the sound waves totravel through the compact. Given the known diameterof the mold and the mass of the compact measured atthe end of the process, the apparent density q after eachcompaction step could be calculated without removingthe sample from the mold until the final compaction stepwas completed.
The apparent density q was also determined ex situ(postcompaction) from the mass, diameter, and thick-ness of the compacted pellets measured outside the moldafter the final compaction step. The thickness wasdetermined by averaging multiple measurements madewith a micrometer at the center and around theperimeter of each sample. The full (pore-free) densityof the powder mixtures qo was calculated using a rule ofmixtures:
qo ¼X
n¼1;2fnqn ½1�
where fn and qn are the volume fraction and density,respectively, of phase n. The apparent density q is ex-pressed as a fraction of the full density qo via the frac-tional density qf:
qf ¼qqo
½2�
and the volume fraction of porosity fp is given by
fp ¼ 1� qf ¼ 1� qqo
½3�
The initial pore fraction fpi was determined from thedensity of the compact after the initial application of aslight pressure, ~1 MPa.
Contact ultrasonic measurements were performedex situ using 5-MHz longitudinal and shear-wave contacttransducers made by the Panametrics (Olympus NDT,Waltham, MA) and recorded on an oscilloscope. The ex-situ measurements were made with a gel couplantbetween the transducer and the part. The time of flightrequired for the sound waves to pass through the samplewas determined by the pulse-echo overlap method, andthe sound-wave velocity V was determined from
V ¼ 2l
tpe½4�
where l is the thickness and tpe is the pulse-echo time offlight. The factor of 2 appears because, in this config-uration, the measured time of flight is the time requiredfor the sound waves to travel though the sample twice,i.e., from the transducer to the opposite surface and
back. Vicker’s hardness testing using a 100-g load wasperformed on polished surfaces normal to both the axial(plan view) and radial (cross-sectional view), per thedirections in ASTM E 385-06.
III. RESULTS AND DISCUSSION
A. Compaction Behavior
The open symbols in Figure 2 show the fractionaldensity qf vs the compaction pressure for the differentvolume fractions of W, fW = 0.0, 0.073, 0.23, and 0.39.The compaction was performed incrementally, asdescribed earlier, with measurements performed at zeropressure between compaction increments. Thus, eachseries of points represents a single sample that wascharacterized in situ after each additional increment inpressure. Two sets of data are shown for each fW. Thedata for fW = 0 represent the unreinforced Bi powder,which compacts to an apparent density of qf ~ 0.98 at540 MPa. At all compaction pressures, a higher fWresults in a lower qf, indicating that the W inclusionsinhibit the densification process. Furthermore, at lowcompaction pressures, the effect of the W inclusions ismore pronounced than at high pressures. For example,after compaction at 90 MPa, the fractional densities atfW = 0.0 and 0.39 are qf ~ 0.86 and 0.70, respectively.After compaction to 540 MPa, qf ~ 0.98 and 0.89,respectively, which is a significantly smaller differential.This behavior is consistent with published reports of thecompaction of composite mixtures of Bi and Tapowders, Pb and steel spheres, Pb and alumina powders,and plasticene spheres and glass beads.[9,11,17] In con-trast, materials such as graphite-reinforced Fe; SiC-,
Fig. 2—Fractional density vs compaction pressures for fW = 0.00(s,d), 0.073 (D), 0.23 (h,j), and 0.39 (e). Open symbols representdata from the incremental press-and-measure-technique described inthe text. Filled symbols represent data from samples pressed directlyto the indicated compaction pressures and characterized ex situ afterpressing. Lines represent the best fit of Eq. [8] to the incrementalcompaction data.
2126—VOLUME 40A, SEPTEMBER 2009 METALLURGICAL AND MATERIALS TRANSACTIONS A

steel-, and zirconia-reinforced Al; and W-reinforcedCu exhibit an opposite effect in which inhibited densi-fication becomes more pronounced at higher compac-tion pressures.[2–5,8,10,12,13,18] The difference in behaviorfor these systems may relate to the ductility of the matrixmaterial (Pb, Bi, or plasticene vs Al, Fe, or Cu).
Limited compaction data are also shown by the solidsymbols in Figure 2 for two series of samples (fW = 0.0and 0.23) pressed directly to the indicated compactionpressures and characterized ex situ after pressing. Thisprocess is distinct from the incremental press-and-measure process, in that each series of data representsseveral powder compacts, each of which was takendirectly to the indicated pressure in a single step. Thedata for the two compaction methods compare favor-ably, confirming that the incremental pressure increase-release cycle does not yield significantly differentcompaction behavior from single-step compaction.
A modified Heckel equation[2,5] was fit to the com-paction data in Figure 2 in order to quantify the relativebehavior at different fW. The Heckel equation was firstpublished by Shapiro and later by Konopicky,[19,20] andrelates the compaction process to a reduction in porositythat behaves as a first-order reaction:
�dfpdP¼ Kfp ½5�
where P is the compaction pressure and K is a con-stant analogous to a reaction rate. Later, Heckel inves-tigated a number of metal powders and identified anempirical relationship between K and ro, the yieldstress, in the absence of porosity:[2,4,5,21]
K ¼ 1
3ro½6�
The term 3ro is known as the yield pressure (some-times as the Heckel yield pressure). An empirical cor-relation has been made between 3ro and the measuredhardness and Young’s modulus for a wide range ofmaterials.[6] The classic Heckel equation is derived bysubstituting Eq. [6] into Eq. [5] and integrating. Theresultant relation predicts a linear dependence of ln(1/fp) on the compaction pressure P and has been widelyapplied to a variety of materials. However, it has beenobserved that a pronounced curvature often occursoutside the central portion of the compaction dia-gram.[2,5] Several approaches have been taken towardmodification of the Heckel equation, to improve thecapability to fit a broader range of experimental data.One of the more effective approaches has been toaddress the pressure dependence of ro.
[5,22] The pres-sure dependence of ro arises from the increasing con-straint caused by neighboring particles as thecompaction decreases, fp. This can be done in a varietyof ways, one of which is to replace ro in Eq. [6] by[5]
r ¼ ro þ k1P ½7�
where r is the pressure-dependent yield stress and k1 isa function of the Poisson’s ratio m. Substituting Eq. [6]and Eq. [7] into Eq. [5] and integrating yields the mod-ified Heckel equation:
ln1
fp
� �¼ ln
1
fpo
� �þ 1
3k1ln 1þ k1P
ro
� �½8�
where fpo represents some initial-state pore fraction. Inthe original derivation, the term fpo was postulated torepresent the pour density of the powder. Later, theterm ln(1/fpo) was redefined to be the sum of a termrelating to the pour density and an offset term relating tothe additional compaction associated with particlerearrangement.[2] In that case, the pressure-dependentpart of the Heckel relation is only intended to be valid atpore fractions below which particle rearrangement doesnot occur to any significant extent, and where thecompact behaves as a coherent body capable of sup-porting enough of the applied stress to cause deforma-tion of the particles.Particle rearrangement (sliding, restacking, etc.) is
generally accepted to be the primary densificationmechanism during the first stage of compaction, inwhich significant densification occurs with negligibleapplied pressure.[2,5,19] At the completion of the firststage of compaction, no further free movement of theparticles is possible and the powder compact now beginsto support (i.e., resist) the applied stress. Additionalcompaction occurs with the development of significantstress in the compact and proceeds via plastic deforma-tion, or brittle fracture, of the particles.[5,23] It is thislatter process that is described by the Heckel equation,particularly for the case of plastic, rather than brittle,materials. The current method of determining fpi fromthe density of the compact after application of a lightpressure is consistent with the idea that fpo correspondsto the pore fraction reached at the minimum pressurerequired to form a coherent compact.[21] Thus, in thisinvestigation, fpo was taken to be equal to the fpidescribed earlier. It should be noted that, due to theeffects of particle size and shape distributions, a sharptransition from particle motion to plastic deformation isnot expected;[23] therefore, the pressure at which fpi wasdetermined (~1 MPa) is somewhat arbitrary. However,it provides a repeatable initial value that should be morerelevant to the process than ex-situ measurements suchas the pour or tap density.Eq. [8] was fit to the incremental compaction data
from Figure 2 using a least squares regression analysisto determine optimal values for k1 and ro. The inputvalues for fpi were determined experimentally, asdescribed earlier. The results are plotted as the solidlines in Figure 2. Clearly, Eq. [8] accurately describes thecompaction behavior over the full range of pressuresand compositions. The fitting parameters and fpi used togenerate the curves are given in Table II. There, ro isreported to be ~15.1 MPa for fW = 0, and increaseswith increasing fW. A similar effect was reported forTa-reinforced Bi,[17] where the compaction was per-formed over the range 140 to 550 MPa in the single-stepprocess used to produce the data for the filled symbols inFigure 2. There does not appear to be any significantpublished work evaluating the correlation between theyield strength determined from mechanical testing andthe yield parameters determined from Eq. [8]. However,the calculated ro values compare favorably with the
METALLURGICAL AND MATERIALS TRANSACTIONS A VOLUME 40A, SEPTEMBER 2009—2127

yield strengths determined from the compression testingof polycrystalline Bi at different temperatures and strainrates.[24] In Reference 24, room-temperature yieldoccurred between ~13 and 24 MPa, depending on thestrain rate (2 9 10�4 to 2 9 10�2, respectively). Thus,the calculated ro for Bi appears to be in an appropriaterange to provide a representative estimate of the yieldstrength.
In Reference 17, Eq. [8] was fit to the limited single-step compaction data (filled symbols) for fW = 0 (pureBi) shown in Figure 2. In that case, however, the fpi usedin the current study was not experimentally accessible,and a value based on the pour density of the powder wasused, f pour
pi ¼ 0:66; which was considerably higher than
the fpi ~ 0.46 measured by the current technique. Theresult of that analysis, as well as a second analysis ofthe current data using fpi ¼ f pour
pi ¼ 0:66; are shown at
the bottom of Table II. For the current data, shifting fpifrom ~0.46 to 0.66 reduces the calculated ro from ~15.1to ~9.2 MPa, which is comparable to that from theearlier work, 8.66 MPa. Conversely, applying the cur-rent experimentally determined fpi ~ 0.46 to the datafrom Reference 17 yields ro = 12.8 MPa. Thus, most ofthe discrepancy between the ro values calculated hereand those in Reference 17 results from the selection ofthe value for fpi. In addition, there is probably somerefinement of the calculation gained by the broaderrange of pressures used for the current investigation, inparticular, the pressures<100 MPa in which qf changesrapidly with pressure, which provides a more complete‘‘view’’ of the compaction process. This analysis high-lights the importance of properly identifying the initialstate of the powder compact before applying this type ofmodel to the compaction process.
It has been proposed that the values for k1 listed inTable II can be correlated with the Poisson’s ratio (m)via[5]
k1 ¼2m2
ð1� mÞ ½9�
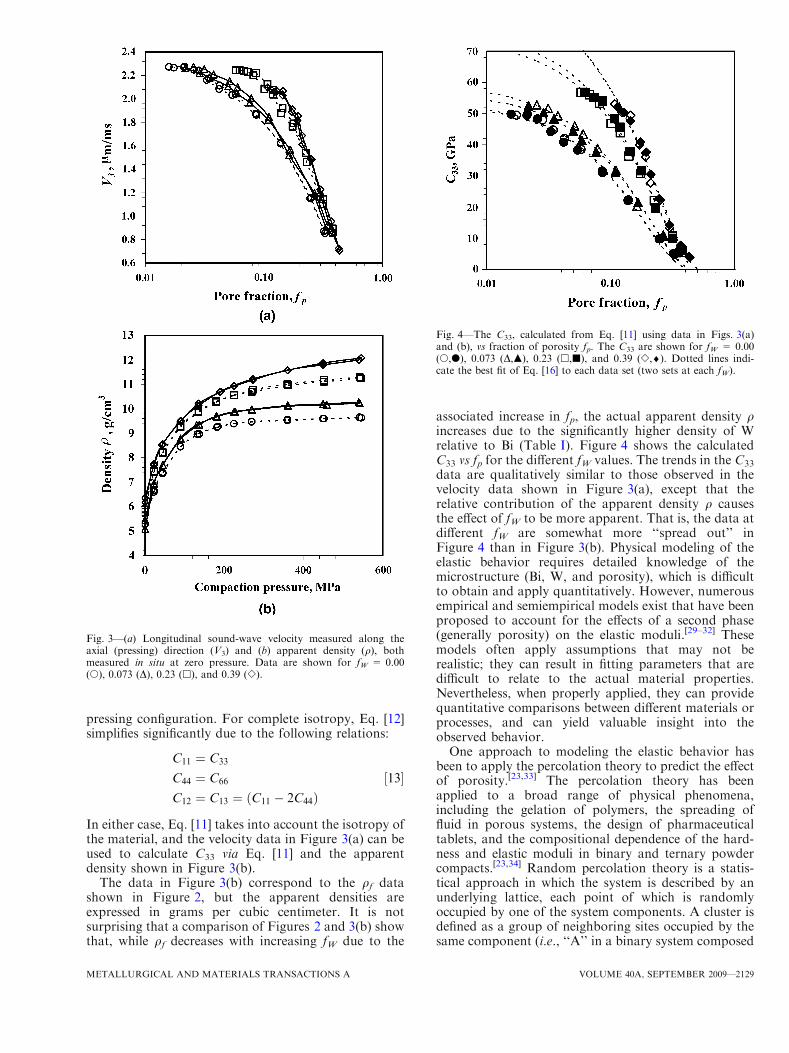
The values for m calculated using Eq. [9] are listed inTable II for the different fW. The range of values (0.279to 0.380) is reasonable for metallic materials and isqualitatively consistent with the behavior observed inReference 17. However, the observed trend of increasingm with increasing fW is not consistent with the acceptedvalues of m for Bi and W reported in Table I: 0.346 and0.285, respectively. The behavior appears to indicatethat Eq. [9] is not valid for these materials, probablybecause it neglects the effects of elastic strain in the die,the pressure dependence of m, and any potential anisot-ropy in the powder compact.Figure 3(a) shows the longitudinal wave velocity,
designated as V3, measured in situ along the compactiondirection vs the volume fraction of porosity fp deter-mined via Eq. [3]. The data show a monotonic increasein V3 with decreasing fp for all compositions. Further, atconstant fp, the data show increasing V3 with increasingfW. This behavior results from the competing effects ofthe increased stiffness associated with the W reinforce-ment, and from the reduced stiffness caused by theresultant residual porosity. Ultrasonic sound-wavevelocity has been widely applied to the characterizationof porous powder compacts,[25–28] because it is intrinsi-cally related to the elastic moduli (stiffness) and densityby the well-known relation
C ¼ V2q ½10�
where C is the elastic stiffness and V is the velocity ofsound. The particular modulus described by Eq. [10]depends on the mode and, for anisotropic materials,the direction of the propagation of the sound waves. Ifwe designate a coordinate system for our cylindricalsamples in which the x3 axis is in the axial (pressing)direction and the two orthogonal directions, x1 and x2,are in the radial (transverse) plane, then Eq. [10]becomes
C33 ¼ V23q ½11�
In Eq. [11], C33 represents the principal axial compo-nent of the elastic stiffness tensor Cij, which relatesstress and strain through Hooke’s law:
r11
r22
r33
s23s31s12
2
6666664
3
7777775¼
C11 C12 C13 0 0 0C12 C11 C13 0 0 0C13 C13 C33 0 0 00 0 0 C44 0 00 0 0 0 C44 00 0 0 0 0 C66
2
6666664
3
7777775
e11e22e33c23c31c12
2
6666664
3
7777775
½12�
where C66 = 1/2 (C11 � C12) and r, s, e, and c repre-sent the normal and shear stresses and the normaland shear strains, respectively. The Cij matrix inEq. [12] is expressed for the case of transverse iso-tropy in order to reflect the symmetry of the uniaxial
Table II. Fitting Parameters k1 and ro Used to Fit
Equation [8] to Compaction Data from Figure 2; Also Shown
Are Experimentally Determined fpi and Poisson’s Ratio (m)Predicted by Equation [9]
fW fpi* k1 ro m
0.00 0.459 0.211 15.3 0.2760.00 0.462 0.207 14.9 0.2740.073 0.481 0.211 18.2 0.2910.073 0.481 0.242 16.7 0.2930.23 0.518 0.360 21.9 0.3780.23 0.509 0.329 23.3 0.3630.39 0.544 0.450 31.9 0.3750.39 0.531 0.469 32.8 0.3810.00a 0.660 0.233 8.66 0.2880.00b 0.460 0.218 12.8 0.2800.00c 0.660 0.246 9.22 0.2940.00c 0.660 0.240 9.24 0.292
*Experimentally determined.aFrom Ref. 16, using experimentally determined fpi.bFrom Ref. 16, using fpi = pour density.cCurrent data, using fpi = pour density.
2128—VOLUME 40A, SEPTEMBER 2009 METALLURGICAL AND MATERIALS TRANSACTIONS A
pressing configuration. For complete isotropy, Eq. [12]simplifies significantly due to the following relations:
C11 ¼ C33
C44 ¼ C66
C12 ¼ C13 ¼ ðC11 � 2C44Þ½13�
In either case, Eq. [11] takes into account the isotropy ofthe material, and the velocity data in Figure 3(a) can beused to calculate C33 via Eq. [11] and the apparentdensity shown in Figure 3(b).
The data in Figure 3(b) correspond to the qf datashown in Figure 2, but the apparent densities areexpressed in grams per cubic centimeter. It is notsurprising that a comparison of Figures 2 and 3(b) showthat, while qf decreases with increasing fW due to the
associated increase in fp, the actual apparent density qincreases due to the significantly higher density of Wrelative to Bi (Table I). Figure 4 shows the calculatedC33 vs fp for the different fW values. The trends in the C33
data are qualitatively similar to those observed in thevelocity data shown in Figure 3(a), except that therelative contribution of the apparent density q causesthe effect of fW to be more apparent. That is, the data atdifferent fW are somewhat more ‘‘spread out’’ inFigure 4 than in Figure 3(b). Physical modeling of theelastic behavior requires detailed knowledge of themicrostructure (Bi, W, and porosity), which is difficultto obtain and apply quantitatively. However, numerousempirical and semiempirical models exist that have beenproposed to account for the effects of a second phase(generally porosity) on the elastic moduli.[29–32] Thesemodels often apply assumptions that may not berealistic; they can result in fitting parameters that aredifficult to relate to the actual material properties.Nevertheless, when properly applied, they can providequantitative comparisons between different materials orprocesses, and can yield valuable insight into theobserved behavior.One approach to modeling the elastic behavior has
been to apply the percolation theory to predict the effectof porosity.[23,33] The percolation theory has beenapplied to a broad range of physical phenomena,including the gelation of polymers, the spreading offluid in porous systems, the design of pharmaceuticaltablets, and the compositional dependence of the hard-ness and elastic moduli in binary and ternary powdercompacts.[23,34] Random percolation theory is a statis-tical approach in which the system is described by anunderlying lattice, each point of which is randomlyoccupied by one of the system components. A cluster isdefined as a group of neighboring sites occupied by thesame component (i.e., ‘‘A’’ in a binary system composed
Fig. 3—(a) Longitudinal sound-wave velocity measured along theaxial (pressing) direction (V3) and (b) apparent density (q), bothmeasured in situ at zero pressure. Data are shown for fW = 0.00(s), 0.073 (D), 0.23 (h), and 0.39 (e).
Fig. 4—The C33, calculated from Eq. [11] using data in Figs. 3(a)and (b), vs fraction of porosity fp. The C33 are shown for fW = 0.00(s,d), 0.073 (D,m), 0.23 (h,j), and 0.39 (e,¤). Dotted lines indi-cate the best fit of Eq. [16] to each data set (two sets at each fW).
METALLURGICAL AND MATERIALS TRANSACTIONS A VOLUME 40A, SEPTEMBER 2009—2129

of phases A and B). The point at which a cluster justpercolates a system is known as the percolation thresh-old. The theory relates the apparent value of a propertyX to the site occupation (or bond) probability F by
X ¼ XoUb ½14�
where Xo is the value of the property for the matrixphase alone and b is the critical exponent describing thechange of X with F.[33] Theoretically, the value of b isdependent solely on the fractal dimension of the process,with a three-dimensional structure of round spheresyielding b ~ 2.1.[32,33,35] However, it has been reportedthat there can be significant experimental deviationsfrom this predicted value, thus giving a ‘‘characteristic’’rather than a ‘‘critical’’ exponent.[35–37] These deviationsmay result from any of the following: the finite size ofthe system (the theory treats an infinitely large sys-tem[38]), application of an inappropriate lattice model(discrete lattice, continuum, etc.), application of aninappropriate percolation type (random site, randombond, etc.), anisomorphous particle shape, or anisot-ropy in the powder compact.[35]
The compaction of powders, and the concurrentreduction in porosity, can be treated as a site percolationphenomenon.[23] The probability that a site is occupiedcan then be related to the fractional density by
U ¼qf � qcr
1� qcr
½15�
where qcr is the percolation threshold. This has beenassociated with the tap density for a variety of pow-ders,[23,39] but is most appropriately described as thefractional density at which (during compaction) parti-cle rearrangement ceases and further densification oc-curs by the buildup of a significant compressionalforce.[23,38] Treating the powder compact as a binarysystem consisting of porosity and an apparent matrixof the Bi and W powder and, recalling Eq. [3],Eq. [14], and Eq. [15], then yield the following relation:
X ¼ Xofp;cr � fp
fp;cr
� �b
½16�
where fp,cr is taken to be the experimentally determinedfpi discussed previously. Van Veen et al. followed asimilar approach to estimate the pore-free elastic moduliin pressed compacts of NaCl and starch.[35] Taking Xand Xo to be C33 and C33,o, respectively, Eq. [16] was fitto the data shown in Figure 4, in which the dotted linesshow the best fit for each fW. The fitting parameters usedin Eq. [16], C33,o and b, are shown in Table III for eachof the compositions. The calculated values for b fallclose to the theoretically predicted value of 2.1 andappear to exhibit a decreasing trend with increasing fW.The origin of this trend is not clear at present, but maybe due to the asphericity of the initial powders. Incontrast, the predicted C33,o values show an increasewith fW, which is an expected consequence of theincreased stiffness associated with the W reinforcement.
The values of C33,o are shown vs fW in Figure 5. Alsoshown are the theoretical bounds for a two-phase
medium proposed by Hashin and Shtrikman.[14] Theupper (HS-U) and lower (HS-L) Hashin–Shtrikmanbounds are calculated from
BL ¼ BBi þfW
1BW�BBi
þ 3fBi3BBiþ4GBi
½17�
BU ¼ BW þfBi
1BBi�BW
þ 3fW3BWþ4GW
½18�
GL ¼ GBi þfW
1GW�GBi
þ 6fBiðBBiþ2GBiÞ5GBið3BBiþ4GBiÞ
½19�
GU ¼ G2 þfBi
1GBi�GW
þ 6fWðBWþ2GWÞ5GWð3BWþ4GWÞ
½20�
where B and G are the bulk and shear moduli, respec-tively, and the subscripts U and L refer to the upper
Table III. Fitting Parameters C33,o and b Used to Fit
Equation [16] to C33 Data from Fig. 4; Also Shown Are
Experimentally Determined fpi
fW fpi* C33,o b
0.00 0.459 54.1 2.410.00 0.462 53.7 2.450.073 0.481 56.9 2.260.073 0.481 59.6 2.350.23 0.518 77.4 2.160.23 0.509 74.3 2.070.39 0.544 91.6 2.270.39 0.531 89.9 2.09
*Experimentally determined.
Fig. 5—Predicted pore-free modulus, C33,o (j), determined from fit-ting Eq. [16] to the data in Fig. 4, vs fW. Dotted lines represent theupper (HS-U) and lower (HS-L) Hashin–Shtrikman bounds calcu-lated from Eqs. [17] through [21]. Also shown are the experimentallydetermined C33 measured in situ (X) and ex situ (s).
2130—VOLUME 40A, SEPTEMBER 2009 METALLURGICAL AND MATERIALS TRANSACTIONS A

and lower bound, respectively. The B and G for the Biand W were taken from Table I. The upper- andlower-bound bulk and shear moduli are, in turn,related to C33 by
C33 ¼4
3Gþ B ½21�
The predicted C33,o values fall very close to the lower(HS-L) bound. As a point of interest, it has been shownthat for B, the lower HS bound is an exact solution forthe case of hard spherical particles in a soft matrix.[40]
The analysis implies that the predicted values of C33,o
fall within an appropriate range to provide an estimateof the pore-free modulus for Bi-W composites preparedby the present methodology. It should be noted thatcalculation of the bounds assumes the homogeneousmixing of the inclusion phase, as well as overall isotropyin the composite. These issues will be discussed in moredetail later in this article.
B. Postcompaction Characterization
The density and axial sound-wave velocity V3 werealso measured ex situ after compaction to the maximumpressure of 540 MPa. The ex-situ values of V3 generallyagree with the in-situ measurements to £0.5 pct. Theex-situ V3 and q were used to calculate C33 via Eq. [11]and the results are plotted vs fW in Figure 5 as C33,ex.The ex-situ values compare favorably with those mea-sured in situ, as shown in the figure, agreeing in mostcases to £1.0 pct. As expected, as fW increases, themeasured C33 falls increasingly below the predictedvalue of C33,o due to the increase in fp (Figure 2). Opticalmicroscopy, measurements of the sound-wave velocityvs direction, and Vicker’s hardness testing were per-formed in order to facilitate further discussion of themechanical properties and to quantify the anisotropy inthe compacts.
Figure 6 shows optical micrographs for fW = 0,0.073, 0.23, and 0.39 after compaction to 540 MPa.Two sets of images are shown, corresponding to twodifferent directions within the microstructure. The‘‘axial view’’ looks along the x3 direction, and thusthe pressing direction is into the plane of the image.The ‘‘radial view’’ looks along the x1-x2 plane, andthus the pressing direction is top to bottom in theimage. At fW = 0, the images show a dense micro-structure with a broad particle size distribution consis-tent with the particle size analysis from Figure 1. Thereis some visible heterogeneity in the microstructure, inthat the average grain size in the axial image appearslarger than in the radial image. Thus, when themicrostructure is viewed along the pressing directionaway from the die walls, the grains appear larger thanwhen viewed normal to the pressing direction. Theimplication is that the microstructure is compressedmore in the axial direction than in the radial direction,with the caveat that angularity and possible asymmetryof the Bi particles could influence particle settling andarrangement. This trend persists throughout the rangeof fW and may lead to some anisotropy in the
mechanical properties. At fW = 0.073, the microstruc-ture still appears dense, with the W reinforcementclearly visible as the slightly darker phase residing onthe Bi particle boundaries. There is some evidence ofsmall, isolated pores, particularly in areas where the Whas agglomerated. At fW = 0.23, the residual porosityis clearly evident (it appears black in the image), andthe network of W particles on the Bi particle bound-aries has become more developed. It appears that the‘‘width’’ of the W phase between the Bi particles hasincreased relative to that at fW = 0.073, and the Wphase appears to be near percolation. At fW = 0.39,the size of the W regions has increased dramatically,leading to significantly more entrained porosity. Inaddition, the W is clearly percolated, particularly in theradial image. As this W network develops, it becomescapable of supporting more of the applied stress and,therefore, less of the stress is transferred to the Bimatrix.That the microstructure appears slightly different
when viewed from the axial and radial directions raisesthe possibility that the mechanical properties in thecompacts may be anisotropic. It is well known thatuniaxial pressing can lead to significant stress gradientsduring compaction. It is also known, however, that, asthe compaction pressure becomes much greater than theyield stress of the powder, the radial pressureapproaches the axial pressure.[5] In order to quantifythe state of isotropy in the compacts, the longitudinaland shear sound-wave velocities were measured as afunction of the direction. Recalling the coordinatesystem in which the x3 axis is in the axial (pressing)direction and the two orthogonal directions, x1 and x2,are in the radial (transverse) plane, there are fiveprincipal (i.e., on-axis) sound-wave velocities that canbe measured: longitudinal wave propagating in the axialand radial directions (V3 and V1), shear wave propa-gating in the axial direction (V31), shear wave propa-gating in the radial direction and polarized in the x1-x2plane (V12), and shear wave propagating in the radialdirection and polarized in the x3 direction (V13). Thefirst subscript indicates the propagation direction andthe second subscript indicates the polarization direction(where applicable) for the shear waves. In a transverselyisotropic solid, all of the nonzero stiffness componentsexcept C13 can be determined from four of the velocitiesby[41,42]
C11 ¼ qV21; C33 ¼ qV2
3 ½22�
Caxial44 ¼ qV2
31
C66 ¼1
2C11 � C12ð Þ ¼ qV2
12
The determination of C13 requires off-axis measure-ments and is not relevant to the current discussion.From Eq. [13] and Eq. [22], it is also apparent that, inthe case of isotropy, all components of the Cij matrix canbe determined from just two sound-wave velocities,longitudinal (V3) and shear (V31).
METALLURGICAL AND MATERIALS TRANSACTIONS A VOLUME 40A, SEPTEMBER 2009—2131

Fig. 6—Optical images of composite microstructures looking along both axial and radial directions. For axial view (a) through (d), the pressingdirection is into the page. For radial view (e) through (h), the pressing direction is top to bottom. Images are for (a) and (e) fW = 0.00, (b) and(f) 0.073, (c) and (g) 0.23, and (d) and (h) 0.39. Scale bar shown in the first image is valid for all images.
2132—VOLUME 40A, SEPTEMBER 2009 METALLURGICAL AND MATERIALS TRANSACTIONS A

A comparison of Eq. [12], Eq. [13], and Eq. [22]implies certain relations that may be used to quantifythe isotropy of the material,[41] namely:
C33
C11
¼ V3
V1
� �2
½23�
2C44
C11 � C12¼ V31
V12
� �2
½24�
Eq. [23] and Eq. [24] provide a measure of thelongitudinal (compressive) and shear anisotropy, withC33 = C11 and 2C44 = (C11 � C12) indicating isotropy.These parameters are plotted vs fW in Figure 7, in whichvalues of ‘‘1.00’’ correspond to complete isotropy. Thedeviation from isotropy is <5 pct for both parameters.The implication is that, for this material system, theassumption of isotropy will introduce an error of £5 pctwhen relating the sound speeds to the elastic moduli.This assumption of isotropy is convenient for furtheranalysis of the engineering elastic moduli within thecontext of the MT effective field model.
The so-called engineering elastic moduli can berelated to the longitudinal and shear-wave velocity inisotropic materials by the following well-known rela-tions:
G ¼ qV2S ½25�
E ¼ qV2S
3V2L � 4V2
S
V2L � V2
S
½26�
B ¼ q V2L �
4
3V2
S
� �½27�
where E is the Young’s modulus and VL and VS arethe longitudinal (V1 = V2 = V3) and shear-wave
(i.e., V12 = V13 = V31 = V23 = …) velocities,respectively. Figures 8(a) and (b) show these ultrason-ically determined moduli, along with C33, plottedvs fW. The fp is given for each composition by thelabels next to the symbols for the shear modulus G.Again, the overall behavior of the elastic modulishows the competing effects of stiffening associatedwith increased fW and softening associated with fp.The elastic moduli shown in Figures 8(a) and (b)were evaluated within the context of the MT effectivefield model.[15,43,44] The MT model has been appliedto the estimation of the elastic properties of varioustwo-phase composites.[43,45,46] The approach approxi-mates the effective elastic properties by assuming thatan inclusion is subject to a uniform effective stressfield. The model can be used to treat the case ofporosity in a solid matrix by taking the moduli ofthe inclusion to be zero. For randomly oriented,spheroidal voids, the MT model yields the followingrelations for the bulk and shear moduli:[43,44]
B ¼ Bo
1þ pðSijklÞfW½28�
G ¼ Go
1þ qðSijklÞfW½29�
where Bo and Go are the bulk and shear moduli of thematrix, respectively, in the absence of any inclusionphase. The terms p(Sijkl) and q(Sijkl) are functions ofthe components of the Eshelby stress tensor, Sijkl.
[47,48]
The Eshelby stress tensor was introduced as part of aclosed-form solution to the strain field within an elasticellipsoidal inclusion in an elastic matrix subject toa uniform strain at infinity. The terms of Sijkl are,in turn, dependent upon the aspect ratio a of theinclusion via the secondary function g(a). For oblatespheroids:
gðaÞ ¼ acos�1ðaÞ � að1� a2Þ1=2h i
ð1� a2Þ3=2½30�
Treatment of the present three-phase composites (Bi, W,and porosity) was performed as follows. The pore-freemoduli (B and G) were calculated at each fW using Eqs.[28] through [30], and the moduli for Bi and W fromTable I, by assuming a = 1 for the W inclusions. Thisaspect ratio corresponds to spherical inclusions, which isqualitatively consistent with the morphology of the Wparticles seen during microscopy. Then, in a second step,each fW was treated as an effective matrix with elasticmoduli equal to the calculated pore-free moduli, and theporosity was treated as a second phase with moduliequal to zero. The aspect ratio of the porosity was thenthe only adjustable parameter available to fit the modelto the data. After a few iterations by trial and error,a = 0.1 was found to give a suitable fit over most of thecomposition range. The results are shown as the dottedlines in Figures 8(a) and (b). The deviation of the datafrom the model predictions at fW = 0.39 is probablyrelated to the percolation of the W powder. Note that
Fig. 7—Anisotropy parameters given by Eqs. [23] and [24] are plot-ted vs fW. Complete isotropy corresponds to a value of 1.00, and isindicated by the solid line for reference purposes.
METALLURGICAL AND MATERIALS TRANSACTIONS A VOLUME 40A, SEPTEMBER 2009—2133
the reported aspect ratio is not meant to be exact, butrather to show qualitative behavior. That is, the analysisis not meant to imply that the pores are actually oblatespheroids with a single, well-defined aspect ratio.Rather, it is meant to qualitatively describe the behaviorof the entire system of porosity as having an effect onthe elastic moduli, which is equivalent to the isomor-phous (a = 0.1) spheroids.
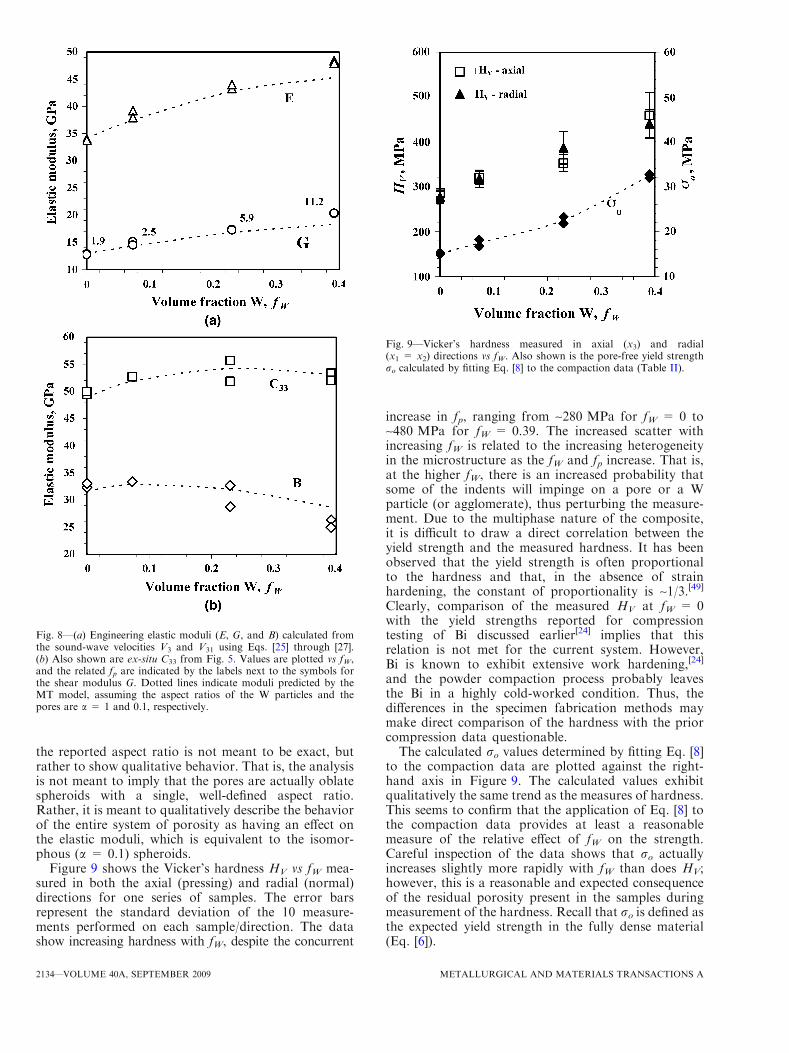
Figure 9 shows the Vicker’s hardness HV vs fW mea-sured in both the axial (pressing) and radial (normal)directions for one series of samples. The error barsrepresent the standard deviation of the 10 measure-ments performed on each sample/direction. The datashow increasing hardness with fW, despite the concurrent
increase in fp, ranging from ~280 MPa for fW = 0 to~480 MPa for fW = 0.39. The increased scatter withincreasing fW is related to the increasing heterogeneityin the microstructure as the fW and fp increase. That is,at the higher fW, there is an increased probability thatsome of the indents will impinge on a pore or a Wparticle (or agglomerate), thus perturbing the measure-ment. Due to the multiphase nature of the composite,it is difficult to draw a direct correlation between theyield strength and the measured hardness. It has beenobserved that the yield strength is often proportionalto the hardness and that, in the absence of strainhardening, the constant of proportionality is ~1/3.[49]Clearly, comparison of the measured HV at fW = 0with the yield strengths reported for compressiontesting of Bi discussed earlier[24] implies that thisrelation is not met for the current system. However,Bi is known to exhibit extensive work hardening,[24]
and the powder compaction process probably leavesthe Bi in a highly cold-worked condition. Thus, thedifferences in the specimen fabrication methods maymake direct comparison of the hardness with the priorcompression data questionable.The calculated ro values determined by fitting Eq. [8]
to the compaction data are plotted against the right-hand axis in Figure 9. The calculated values exhibitqualitatively the same trend as the measures of hardness.This seems to confirm that the application of Eq. [8] tothe compaction data provides at least a reasonablemeasure of the relative effect of fW on the strength.Careful inspection of the data shows that ro actuallyincreases slightly more rapidly with fW than does HV;however, this is a reasonable and expected consequenceof the residual porosity present in the samples duringmeasurement of the hardness. Recall that ro is defined asthe expected yield strength in the fully dense material(Eq. [6]).
Fig. 8—(a) Engineering elastic moduli (E, G, and B) calculated fromthe sound-wave velocities V3 and V31 using Eqs. [25] through [27].(b) Also shown are ex-situ C33 from Fig. 5. Values are plotted vs fW,and the related fp are indicated by the labels next to the symbols forthe shear modulus G. Dotted lines indicate moduli predicted by theMT model, assuming the aspect ratios of the W particles and thepores are a = 1 and 0.1, respectively.
Fig. 9—Vicker’s hardness measured in axial (x3) and radial(x1 = x2) directions vs fW. Also shown is the pore-free yield strengthro calculated by fitting Eq. [8] to the compaction data (Table II).
2134—VOLUME 40A, SEPTEMBER 2009 METALLURGICAL AND MATERIALS TRANSACTIONS A

IV. CONCLUSIONS
This investigation examines the compaction behaviorof composite mixtures of Bi and W powders via in-situmeasurement of the thickness and sound-wave transittime during incremental compaction. The compactionbehavior is evaluated using a modified Heckel equation,and the ultrasonically determined moduli are analyzedwithin the context of a site percolation model. Post-compaction analysis of the microstructure, sound-wavevelocity, and Vicker’s hardness was performed in orderto further understand the mechanical properties and theeffects of different fractions of W reinforcement andresidual porosity (fW and fp). The results of theinvestigation can be summarized as follows.
1. The unreinforced Bi powder compacts to ~98 pctdensity at 540 MPa. The W powder inhibits thedensification process, and this effect is most promi-nent at lower compaction pressures.
2. The modified Heckel equation describes the com-paction behavior accurately. The fitting parameters(particularly ro) are sensitive to how the initialporosity is defined. The predicted yield strength ro
for fW = 0 is consistent with reported compressiontesting of pure Bi, and increases with fW.
3. A percolation model describes the behavior of theelastic modulus C33 relative to the pore fractionfrom fp > 0.4 to fp < 0.02. The predicted pore-freeC33,o fall within the theoretical bounds predicted byHashin and Shtrikman.
4. While the microstructure shows some slight evi-dence of anisotropy between the axial and radialdirections, a comparison of the ultrasonic velocitiesand Vicker’s hardness shows the anisotropy to be<5 pct.
5. The engineering elastic moduli (G, B, and E) werecalculated from the sound-wave velocities based onthe assumption of complete isotropy. The effects offW and fp on these elastic moduli were evaluatedusing the MT effective field model.
6. The measured Vicker’s hardness increases with fW.No direct correlation can be made between the HV
and the yield strength at this time; however, HV
and the ro predicted from the Heckel equationexhibit qualitatively the same behavior.
ACKNOWLEDGMENTS
This work was performed under the auspices of theUnited States Department of Energy by the LawrenceLivermore National Laboratory (LLNL), under Con-tract No. DE-AC52-07NA27344. Project No. 06-SI-005 was funded by the Laboratory Directed Researchand Development Program at the LLNL.
OPEN ACCESS
This article is distributed under the terms ofthe Creative Commons Attribution Noncommercial
License which permits any noncommercial use,distribution, and reproduction in any medium, pro-vided the original author(s) and source are credited.
REFERENCES
1. G.R. Odette, M.J. Alinger, and B.D. Wirth: Annu. Rev. Mater.Res., 2008, vol. 38, pp. 471–503.
2. R.W. Heckel: Trans. TMS-AIME, 1961, vol. 221, pp. 1001–08.3. V.P. Bondarenko, S.S Dzhamarov, and A.A Baidenko: Powder
Metall. Met. Ceram., 1974, vol. 13, pp. 12–15.4. I. Shapiro: Adv. Powder. Metall., 1995, vol. 1, pp. 2.97–2.114.5. P.J. Denny: Powder Metall., 2002, vol. 127, pp. 162–72.6. R.J. Roberts and R.C. Rowe: Chem. Eng. Sci., 1987, vol. 42,
pp. 903–11.7. A.R. Boccaccini and Z. Fan: Ceram. Int., 1997, vol. 23, pp. 239–
45.8. A.H. Tavakoli, A. Simchi, and S.S.S. Reihani: Comput. Sci.
Technol., 2005, vol. 65, pp. 2094–2104.9. C.-Y. Huang and G.S. Daehn: Acta Mater., 1996, vol. 44,
pp. 1035–45.10. F.F. Lange, L. Atteraas, F. Zok, and J.R. Porter: Acta Metall.
Mater., 1991, vol. 39, pp. 209–19.11. C.D. Turner and M.F. Ashby: Acta Mater., 1996, vol. 44,
pp. 4521–30.12. K.T. Kim, J.H. Cho, and J.S. Kim: J. Eng. Mater. Technol., 2000,
vol. 122, pp. 119–28.13. A.G. Yurshenko, L.I. Pugina, and N.I. Shcherban: Powder Metall.
Met. Ceram., 1969, vol. 8, pp. 355–58.14. Z. Hashin and S. Shtrikman: J. Mech. Phys. Solids, 1963, vol. 11,
pp. 127–40.15. T. Mori and K. Tanaka: Acta Metall., 1973, vol. 21, pp. 571–74.16. Performed via X-ray sedigraph per ASTM C-958-92.17. L.P. Martin, A.M. Hodge, and G.H. Campbell: Scripta Mater.,
2007, vol. 57, pp. 229–32.18. K.T. Kim, S.C. Lee, and H.S. Ryu: Mater. Sci. Eng., A, 2003,
vol. A340, pp. 41–48.19. I. Shapiro and I.M. Kolthoff: J. Phys. Colloid Chem., 1947, vol. 51,
pp. 483–93.20. K. Konopicky: Radex-Rundschau, 1948, vol. 3, pp. 141–48.21. R.W. Heckel: Trans. TMS-AIME, 1961, vol. 221, pp. 671–75.22. M. Kuentz and H. Leuenberger: J. Pharm. Sci., 1999, vol. 88,
pp. 174–79.23. R. Leu and H. Leuenberger: Int. J. Pharm., 1993, vol. 90, pp. 213–
19.24. G.C. Das and M.B. Bever: Metall. Trans. A, 1978, vol. 9A,
pp. 1875–81.25. L.P. Martin, D. Dadon, and M. Rosen: J. Am. Ceram. Soc., 1996,
vol. 79, pp. 1281–89.26. E.P. Papadakis and B.W. Peterson: Mater. Eval., 1979, vol. 37,
pp. 76–80.27. D.J. Roth, D.B. Stang, S.M. Swickard, M.R. DeGuire, and
L.E. Dolhert: Mater. Eval., 1991, vol. 49, pp. 883–88.28. O. Yeheskel, M. Shokhat, M. Ratzker, and M.P. Dariel: J. Mater.
Sci., 2001, vol. 36, pp. 1219–25.29. R.M. Spriggs: J. Am. Ceram. Soc., 1961, vol. 44, pp. 628–29.30. K.K. Phani and S.K. Niyogi: J. Mater. Sci., 1987, vol. 22, pp. 257–
63.31. R.L. Coble and W.D. Kingery: J. Am. Ceram. Soc., 1956, vol. 39,
pp. 377–85.32. J. Kovacik: J. Mater. Sci. Lett., 1999, vol. 18, pp. 1007–10.33. D. Stauffer: Introduction to Percolation Theory, Taylor and
Francis, London, 1985.34. I. Carabello, M. Fernandez-Arevalo, M. Milan, A.M. Rabasco,
and H. Leuenberger: Int. J. Pharm., 1996, vol. 139, pp. 177–86.35. B. van Veen, K. van der Voort Maarschalk, G.K. Bolhuis, and
H.W. Frijlink: Powder Technol., 2004, vol. 139, pp. 156–64.36. C.-W. Nan and D.M Smith: Mater. Sci. Eng., 1991, vol. B10,
pp. L1–L3.37. J. Kovacik: J. Mater. Sci. Lett., 2001, vol. 20, pp. 1953–55.38. H. Leuenberger and L. Ineichen: Eur. J. Pharm. Biopharm., 1997,
vol. 44, pp. 269–72.
METALLURGICAL AND MATERIALS TRANSACTIONS A VOLUME 40A, SEPTEMBER 2009—2135

39. L.E. Holman and H. Leuenberger: Powder Technol., 1991, vol. 64,pp. 233–47.
40. Z. Hashin: J. Appl.Mech., Trans. ASME, 1962, vol. 29, pp. 143–50.41. M.L. Hentschel and N.W. Page: J. Mater. Sci., 2007, vol. 42,
pp. 1269–78.42. I. Song, M. Suh, Y.-K. Woo, and T. Hao: Eng. Geol., 2004,
vol. 72, pp. 293–308.43. Y.H. Zhao, G.P. Tandon, and G.J. Weng: Acta Mech., 1989,
vol. 76, pp. 105–30.44. G.P. Tandon and G.J. Weng: Compos. Sci. Technol., 1986, vol. 27,
pp. 111–32.
45. H. Ledbetter, M. Dunn, S. Kim, and R. Fields: in Review ofQuantitative NDE, D.O. Thompson and D.E. Chimenti, eds.,Plenum Press, New York, NY, 1995, vol. 14, pp. 1633–39.
46. J.B. Walsh, W.F. Brace, and A.W. England: J. Am. Ceram. Soc.,1965, vol. 48, pp. 605–08.
47. T.T. Wu: Int. J. Solids Struct., 1966, vol. 2, pp. 1–8.48. J.D. Eshelby: Proc. R. Soc. London, Ser. A, 1959, vol. 252,
pp. 561–69.49. J.R. Cahoon, W.H. Broughton, and A.R. Kutzak: Metall. Trans.,
1971, vol. 2, pp. 1979–83.
2136—VOLUME 40A, SEPTEMBER 2009 METALLURGICAL AND MATERIALS TRANSACTIONS A