Embed Size (px)
Citation preview

Twitter Mood Predicts the Stock
Market
Xiao-Jun Zeng
School of Computer Science
University of Manchester
1
Outline
• Introduction and Motivation
• Approach
• Framework
• Twitter mood model and analysis
• Causality analysis of mood vs. DJIA prices
• Non-linear models for mood-based stock prediction
• Experiment
• Conclusion and future research

2
Introduction and Motivation
• Common sense often says that stock markets are
driven by “fear and greed”—that is, by psychological as
well as financial factors
• Behavioural finance and economics theory have
established that investors’ behaviour can be shaped by
whether they feel optimistic (bullish) or pessimistic
(bearish) about future market values
• Psychological research tells us that human decisions
(including financial decisions) are significantly driven
by emotion and mood
=> Conclusion: Sentiment and mood has significant
impact to investors’ behaviour and stock move
3
Introduction and Motivation
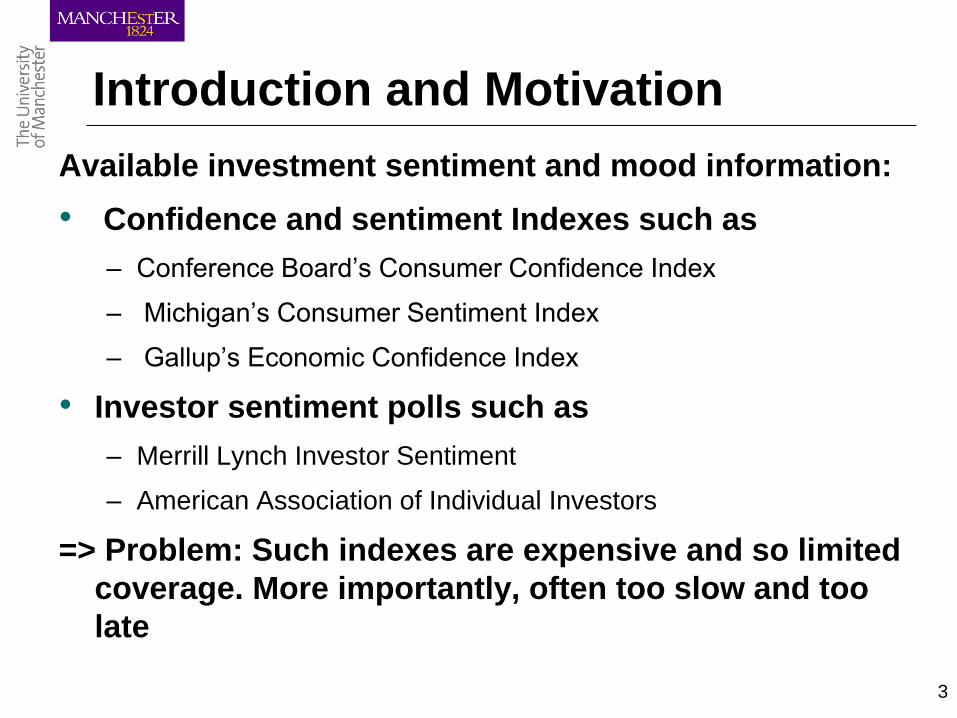
Available investment sentiment and mood information:
• Confidence and sentiment Indexes such as
– Conference Board’s Consumer Confidence Index
– Michigan’s Consumer Sentiment Index
– Gallup’s Economic Confidence Index
• Investor sentiment polls such as
– Merrill Lynch Investor Sentiment
– American Association of Individual Investors
=> Problem: Such indexes are expensive and so limited
coverage. More importantly, often too slow and too
late

4
Introduction and Motivation
• Recent research suggests that mining social media data
(blogs, Twitter feeds, etc) can provide valuable
information to predict changes in various economic and
commercial sentiment indicators
• There are a number of social media mining tools having
been developed
=> Motivation: Perhaps social media data such as
Twitter can provide more comprehensive and real-
time information about market sentiment and mood
for stock price prediction.

5
Approach – Framework: Methodology
3 phases of methodology
6
Twitter mood model and analysis
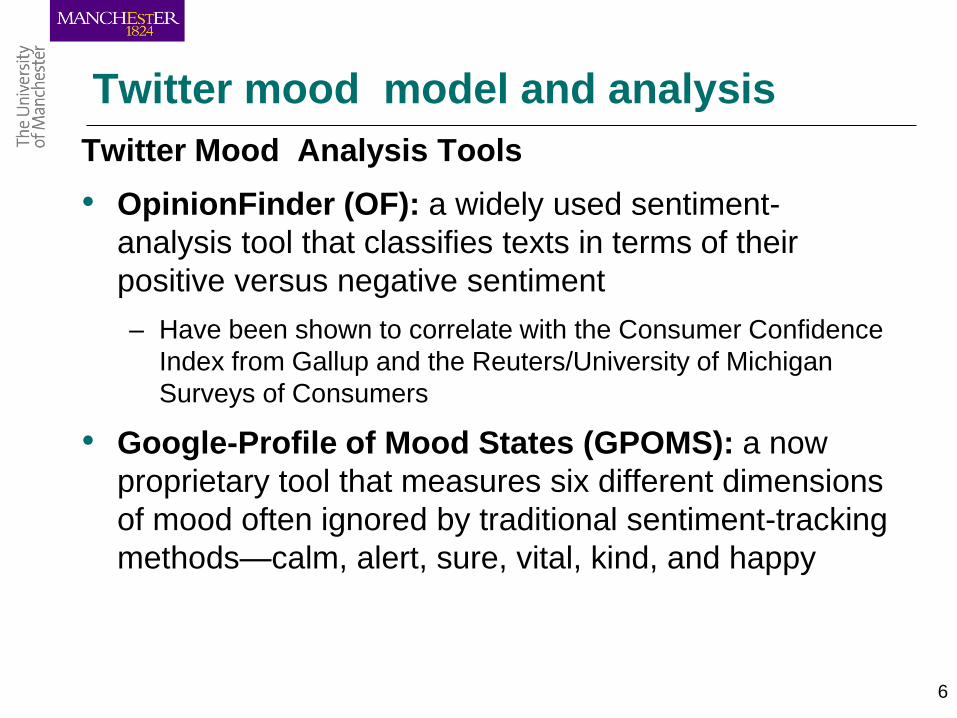
Twitter Mood Analysis Tools
• OpinionFinder (OF): a widely used sentiment-
analysis tool that classifies texts in terms of their
positive versus negative sentiment
– Have been shown to correlate with the Consumer Confidence
Index from Gallup and the Reuters/University of Michigan
Surveys of Consumers
• Google-Profile of Mood States (GPOMS): a now
proprietary tool that measures six different dimensions
of mood often ignored by traditional sentiment-tracking
methods—calm, alert, sure, vital, kind, and happy

7
Twitter mood model and analysis
Twitter Mood Analysis Tools
• OpinionFinder (OF): a widely used sentiment-
analysis tool that classifies texts in terms of their
positive versus negative sentiment
– Have been shown to correlate with the Consumer Confidence
Index from Gallup and the Reuters/University of Michigan
Surveys of Consumers
• Google-Profile of Mood States (GPOMS): a now
proprietary tool that measures six different dimensions
of mood often ignored by traditional sentiment-tracking
methods—calm, alert, sure, vital, kind, and happy
8
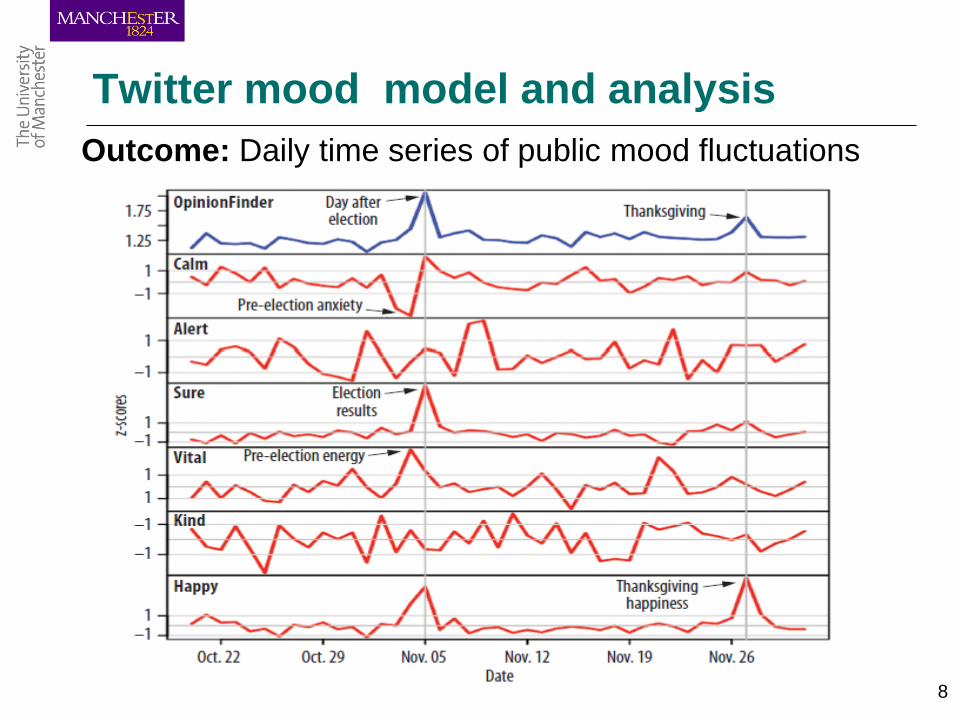
Twitter mood model and analysis
Outcome: Daily time series of public mood fluctuations

9
Causality analysis of mood vs. DJIA prices
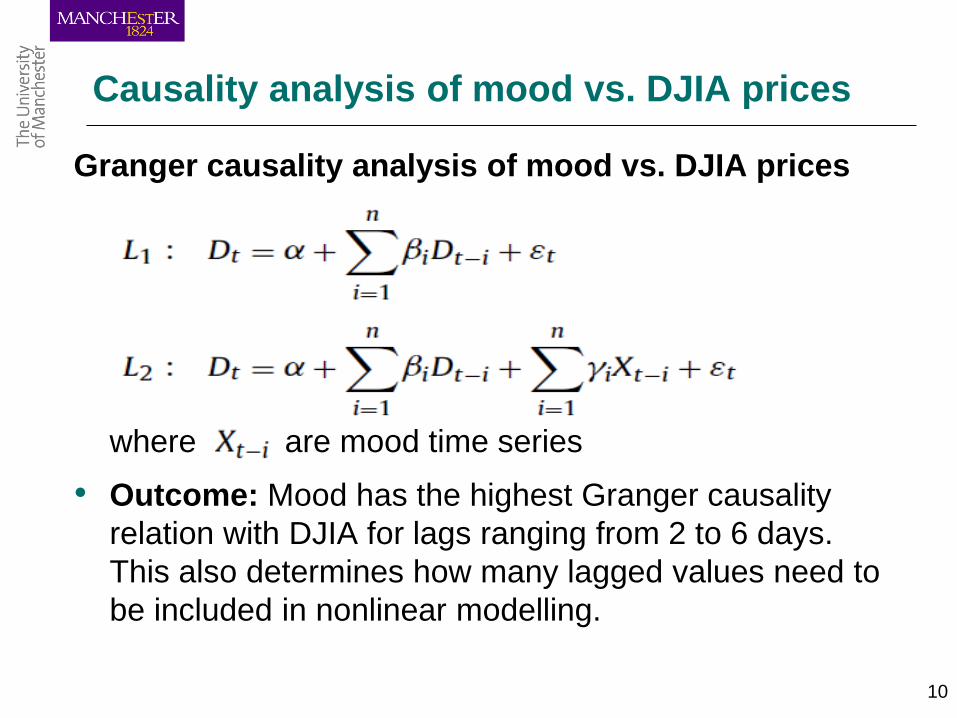
Granger causality analysis of mood vs. DJIA prices
• A time series Xt is said to Granger-cause Yt if it can be
shown, usually through a series of t-tests and F-
tests on lagged values of Xt (and with lagged values
of Yt also included), that those Xt values provide
statistically significant information about future values
of Yt.
• DJIA time series, denoted Yt= which is
the daily changes (between day t and t−1) in stock
market value.
10
Causality analysis of mood vs. DJIA prices
Granger causality analysis of mood vs. DJIA prices
where are mood time series
• Outcome: Mood has the highest Granger causality
relation with DJIA for lags ranging from 2 to 6 days.
This also determines how many lagged values need to
be included in nonlinear modelling.
11
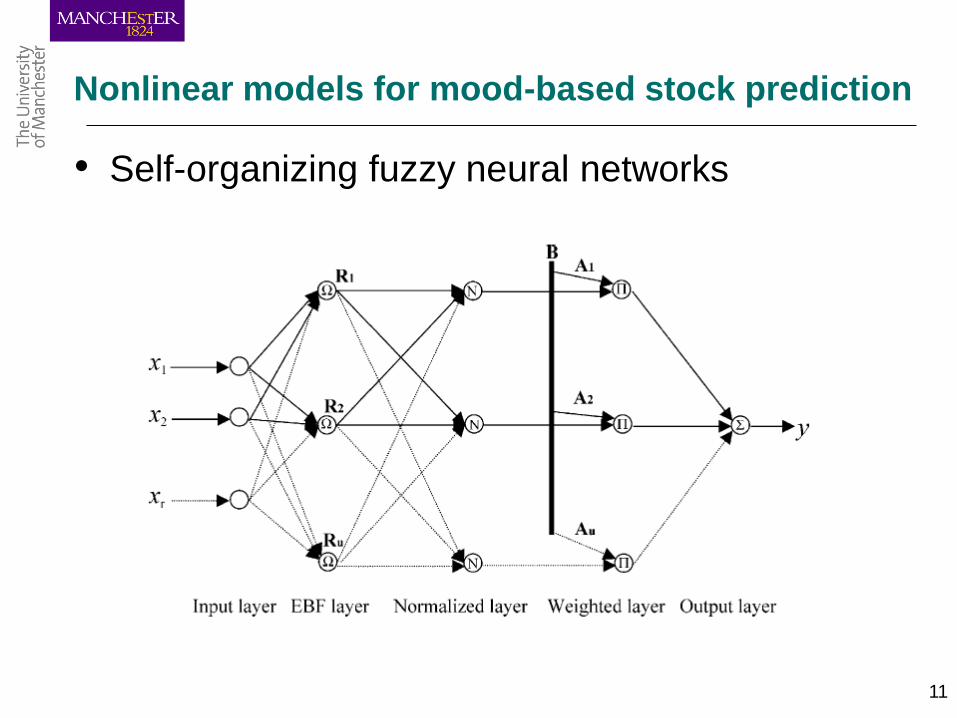
Nonlinear models for mood-based stock prediction
• Self-organizing fuzzy neural networks

12
Nonlinear models for mood-based stock prediction
• Self-organizing fuzzy neural networks
• This can be regarded as the normalised radial
basis function (RBF) networks but
– No hole for the no training data areas
– More transparent and interpretable

13
Nonlinear models for mood-based stock prediction
• Self-organizing learning algorithm:
– An evolving learning algorithm which will automatically
determine the number of neurons or basis functions and learn
model parameters
– Convergence to real systems has been proved if there are
enough training data
– High accuracy in comparing many other methods
– Have been successfully applied to electrical load forecasting,
exchange rate forecasting, and function approximation

14
Nonlinear models for mood-based stock prediction
• Self-organizing learning algorithm - Main Steps:
– Start from a network with one neuron
– Adding a neural (or basis function) when the
existing model is not complicated enough to catch
up the nonlinear behaviour
– Merger neurons if they are highly similar to avoid
overfitting
– Pruning a neuron if it makes little contribution to
the forecasting accuracy
– Recursive least square parameter learning to catch
the time varying factor

15
Experiment
Experiment Data
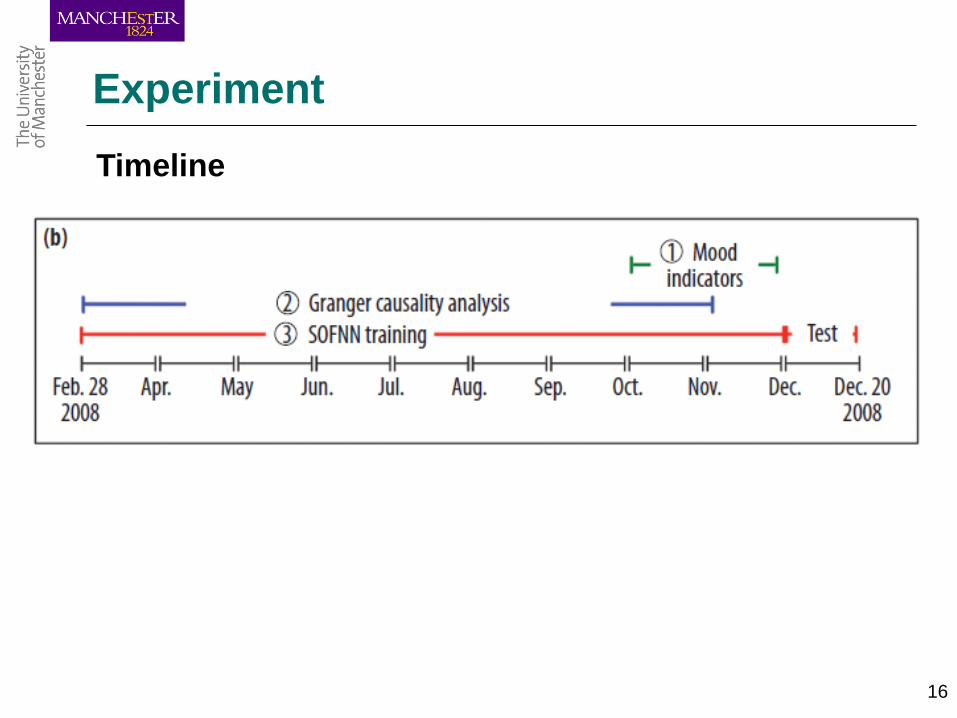
• Twitter Data:a collection of public tweets that was
recorded from February 28 to December 19th, 2008
(9,853,498 tweets posted by approximately 2.7M
users). For each tweet these records provide a tweet
identifier, the date–time of the submission (GMT+0), its
submission type, and the text content of the Tweet
which is by design limited to 140 characters
• DJIA closing values between February 28 to December
19th, 2008
16
Experiment
Timeline

17
Experiment
Experiment Setting
• Forecasting period – n=3 days ahead:
– To predict the DJIA value on day t, the input attributes of our
SOFNN include combinations of DJIA values and raw mood
values of the past n days. We choose n−3 since the results
from causal analysis indicate that past n−3 the Granger causal
relation between Calm and DJIA decreases significantly
• Input variables:
– Different combinations of six dimension Mood variables and
DJIA values with the last 3 days
• Forecasting testing period:
– December1 to December19, 2008
18
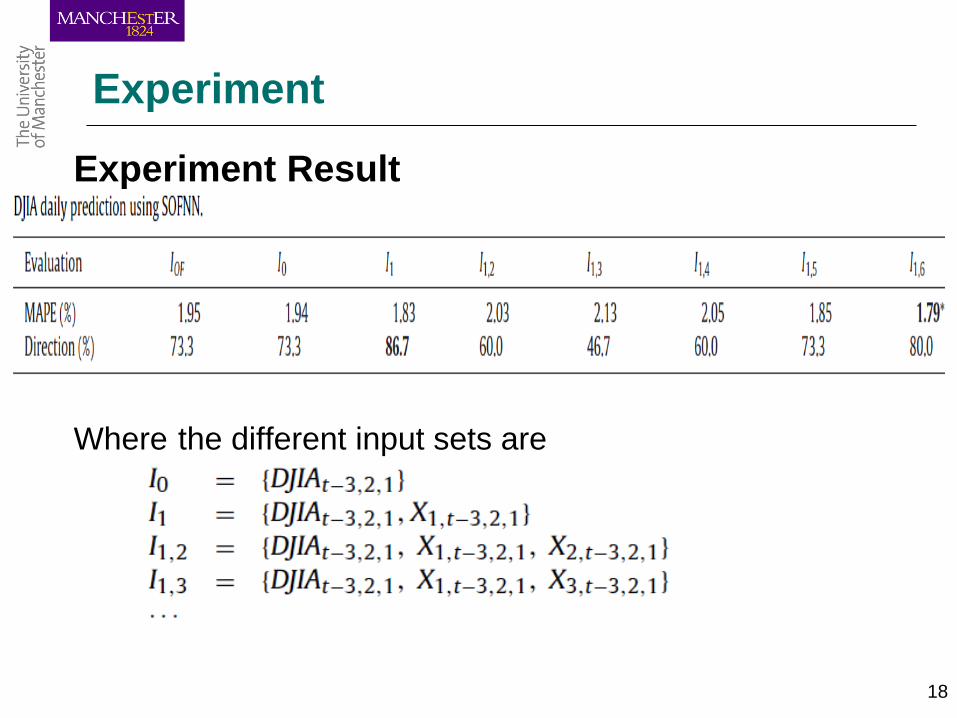
Experiment
Experiment Result
Where the different input sets are
19
Conclusion and future research
Conclusion: Although more technical improvements are
needed and much more experiments are required, our
research and some following works suggest:
– Social media data (blogs, Twitter feeds, etc) include
some useful mood and sentiment information
related to stock market
– Including such mood and sentiment information can
improve the accuracy of stock prediction
20
Conclusion and future research
Future work: More comprehensive prediction system
combines:
• Online news mining from web data and social media
data, as big news are often accumulated from many
small news and such online mining will provide the
early indicators for the current unpredictable news;
• Online social media data mining to get early mood and
sentiment indicators
• Historical stock price data and fundamental financial
data
to further improve the accuracy of stock forecasting.


![Artificial Intelligence · Artificial Intelligence 2016-2017 Introduction [5] Artificial Brain: can machines think? Artificial Intelligence 2016-2017 Introduction [6] ... Deep Blue](https://img.pdfslide.us/doc/110x75/5f0538917e708231d411e192/artificial-intelligence-artificial-intelligence-2016-2017-introduction-5-artificial.jpg)