Embed Size (px)
Citation preview

cancers
Article
Comorbidity Risk Score in Association with CancerIncidence: Results from a Cancer Screenee Cohort
Tung Hoang , Jeonghee Lee and Jeongseon Kim *
Department of Cancer Biomedical Science, National Cancer Center Graduate School of Cancer Science and Policy,Goyang 10408, Korea; [email protected] (T.H.); [email protected] (J.L.)* Correspondence: [email protected]; Tel.: +82-31-920-2570
Received: 12 June 2020; Accepted: 7 July 2020; Published: 8 July 2020�����������������
Abstract: The combined effects of comorbidities can cause cancer incidence, while the effects ofindividual conditions, alone, might not. This study was conducted to investigate the joint impact ofcomorbidities on cancer incidence. The dietary score for energy-adjusted intake was calculated byapplying a Gaussian graphical model and was then categorized into tertiles representing light, normal,and heavy eating behaviors. The risk point for cancer, according to the statuses of blood pressure, totalcholesterol, fasting glucose, and glomerular filtration rate was computed from a Cox proportionalhazard model adjusted for demographics and eating behavior. The comorbidity risk score was definedas the sum of the risk points for four comorbidity markers. We finally quantified the hazard ratios(HRs) and 95% confidence intervals (CIs) for the association between the strata of the comorbidity riskscore and cancer incidence. A total of 13,644 subjects were recruited from the Cancer Screenee Cohortfrom 2007–2014. The comorbidity risk score was associated with cancer incidence in a dose-dependentmanner (HR = 2.15, 95% CI = 1.39, 3.31 for those scoring 16–30 vs. those scoring 0–8, P-trend < 0.001).Subgroup analysis still showed significant dose-dependent relationships (HR = 2.39, 95% CI = 1.18,4.84 for males and HR = 1.99, 95% CI = 1.11, 3.59 for females, P-trend < 0.05). In summary, therewas a dose-dependent impact of comorbidities on cancer incidence; Highlights: Previous studieshave generally reported that hypertension, hypercholesterolemia, diabetes, and chronic kidneydisease might predispose patients to cancer. Combining these chronic diseases into a single score,this study found a dose-dependent association between the data-driven comorbidity risk score andcancer incidence.
Keywords: comorbidity risk score; dietary score; cancer incidence; Gaussian graphical model
1. Introduction
Cancer has been a global health issue over the past few decades. According to GLOBOCAN,there were an estimated 18.1 million new cancer cases and 9.6 million cancer-related deaths in 2018 [1].In addition to cancer, other noncommunicable diseases, including cardiovascular disease (CVD),chronic respiratory diseases, and diabetes, are leading causes of death worldwide [2,3]. Althoughcancer and these chronic conditions are known to share common risk factors, certain comorbiditiesmight independently contribute to the development of cancer [4]. To date, several studies havefound a large number of risk factors for cancer. The International Agency for Research on Cancer,which classified these carcinogens into different groups based on their relationship with cancer risk,did not consider comorbidity to be a risk factor for cancer [5]. Additionally, the cancer preventionprogram mostly focuses on lifestyle risk factors such as nutrition and physical activity [4].
Previous studies have generally investigated the association between separate chronic diseasesor disease markers and the risk of cancer [6–15]. For example, hypertension was found to beassociated with an increased risk of kidney cancer [6–8], possibly due to the downregulation of the
Cancers 2020, 12, 1834; doi:10.3390/cancers12071834 www.mdpi.com/journal/cancers

Cancers 2020, 12, 1834 2 of 22
angiotensin-converting enzyme [9]. Several meta-analyses have consistently reported a higher cancerrisk among those with diabetes mellitus [10–12]. Furthermore, there is also an elevated risk of canceramong those with high cholesterol levels and chronic kidney disease [13–15].
However, comorbidities may jointly impact the risk of cancer, and research on this topic remainslimited. Tu et al. recently reported the chronic disease risk score, which summarizes eight differentchronic diseases and disease markers to elucidate the contribution of comorbidities to the risk ofcancer [4]. In that large population-based prospective study of 405,878 Taiwanese participants, subjectswith the highest comorbidity score were associated with 121% of the risk of incident cancer (hazardratio (HR) = 2.21, 95% confidence interval (CI) = 1.77, 2.75) [4]. Although dietary behavior wasfound to play an important role in the development of several chronic diseases and cancer [16–20],only the assessment of fruit and vegetable intake was included in the study by Tu et al. [4] In this study,we assessed dietary behavior through whole diet consumption instead of a single food item approach.The partial correlation among food groups was accounted for in the data-driven dietary network.
Given that lifestyle factors and disease structure differ by country, and that dietary behavior mayaffect cancer incidence, this study aims to evaluate the associations between the joint influence ofcomorbidities and cancer incidence among the Korean population.
2. Materials and Methods
2.1. Study Population
The details of the Cancer Screenee Cohort are described elsewhere [21]. Between October 2007and July 2014, a total of 13,644 subjects completed the written consent form and volunteered to provideinformation on their medical history, clinical test results, and dietary consumption (Figure 1). Thosewith missing data on dietary intake or with unrealistic data for energy intake (<500 or >4000 kcal)were excluded. Among the 8597 individuals identified at baseline, 612 subjects who were previouslydiagnosed with cancer and 2342 subjects who had missing values regarding demographics andcomorbidities were additionally excluded. Because cancer has a long latency, it was possible fora tumor to be present but clinically undetected at the time of participation in the study. Hence,we excluded subjects diagnosed with cancer within 1 year to minimize reverse causality. As a result,a total of 5606 subjects were included in the final analysis. The Institutional Review Board of theNational Cancer Center approved this study protocol (number NCCNCS-07-077).
2.2. Variable definition
Cancer incidence was identified via diagnosis and classified according to the InternationalClassification of Diseases-10 codes. Time to cancer incidence was defined as the interval between thedate of study enrollment and the date of receiving a new diagnosis of cancer. The censoring date wasdefined as the last follow-up date (31 December 2016) or the date of death from a noncancer cause.
Regarding comorbidities, we selected blood pressure, total cholesterol, fasting glucose,and the glomerular filtration rate (GFR), together with self-reported hypertension and diabetes.The Joint National Committee guidelines recommended dividing blood pressure (mmHg) intonormal (<120/80, not receiving therapy and not previously diagnosed with hypertension),prehypertension (120–139/80–89, not receiving therapy and not previously diagnosed withhypertension), and hypertension (≥140/90, receiving therapy or previously diagnosed withhypertension) [22]. Total cholesterol (mg/dL) was divided into low (<180, not taking drugs andnot previously diagnosed with dyslipidemia), normal (180–200, not taking drugs and not previouslydiagnosed with dyslipidemia), and elevated (>200, taking drugs or previously diagnosed withdyslipidemia) [23]. Fasting glucose (mg/dL) was classified as normal (<110, no underlying treatmentand not previously diagnosed with diabetes) or prediabetes and diabetes (≥110, underlying treatmentor previously diagnosed with diabetes). The GFR, which was calculated by using the Modification ofDiet in Renal Disease equation [24], was categorized into ≥90, 60–89, and <60 mL/min/1.73 m2.

Cancers 2020, 12, 1834 3 of 22
Cancers 2020, 12, x 3 of 25
Figure 1. Flowchart of the subject recruitment process.
The covariates included age (years), sex (male and female), marital status (married, cohabitant and others), education (<high school, high school graduate, and ≥college), monthly income (<2 million, 2–4 million, and ≥4 million South Korean won (KRW)), smoking (never, past, and current), drinking (never, past, and current), physical activity (yes and no), body mass index (BMI) (<23, 23–24.9, and ≥25 kg/m2), and eating behavior (light, normal, and heavy). Details of these co-factors of medical history are summarized in Tables A1–A2.
2.3. Statistical Analysis
Figure A1 shows how the dietary intake score was calculated. Briefly, we applied a Gaussian graphical model (GGM) to identify the dietary network, which was composed of 16 food groups as nodes and their pairwise partial correlations as edges. The network structure was estimated using the extended Bayesian information criteria (EBIC) model selection set at 0.5 [25,26]. The eigenvector centrality of the GGM-identified network was computed as the weight of the nodes [27], and the dietary intake score was defined as the sum of the amount consumed in each food group with their respective weights. The dietary intake score therefore indicates the total energy-adjusted intake—in grams/day—for the whole diet of the 16 food groups; therefore, a higher dietary intake score represented a higher amount of dietary consumption (g/day) after adjusting for the weights of the 16 food groups. The dietary intake score was then categorized into low, medium, and high tertiles, which correspond to light, normal, and heavy eating behaviors, respectively.
We computed the comorbidity risk score following the procedure in Sullivan et al. [28], which was developed based on the Heart Framingham Study. Briefly, we used a Cox regression model to obtain the coefficient of cancer incidence related to each chronic condition, adjusting for age and other demographic variables. Then, the risk point corresponding to each chronic condition was obtained by dividing the above-calculated regression coefficients for comorbidities by the coefficient for a one-year increase in age. The comorbidity score for each individual was defined as
Figure 1. Flowchart of the subject recruitment process.
The covariates included age (years), sex (male and female), marital status (married, cohabitantand others), education (<high school, high school graduate, and ≥college), monthly income (<2 million,2–4 million, and ≥4 million South Korean won (KRW)), smoking (never, past, and current), drinking(never, past, and current), physical activity (yes and no), body mass index (BMI) (<23, 23–24.9,and ≥25 kg/m2), and eating behavior (light, normal, and heavy). Details of these co-factors of medicalhistory are summarized in Tables A1 and A2.
2.3. Statistical Analysis
Figure A1 shows how the dietary intake score was calculated. Briefly, we applied a Gaussiangraphical model (GGM) to identify the dietary network, which was composed of 16 food groups asnodes and their pairwise partial correlations as edges. The network structure was estimated usingthe extended Bayesian information criteria (EBIC) model selection set at 0.5 [25,26]. The eigenvectorcentrality of the GGM-identified network was computed as the weight of the nodes [27], and thedietary intake score was defined as the sum of the amount consumed in each food group with theirrespective weights. The dietary intake score therefore indicates the total energy-adjusted intake—ingrams/day—for the whole diet of the 16 food groups; therefore, a higher dietary intake score representeda higher amount of dietary consumption (g/day) after adjusting for the weights of the 16 food groups.The dietary intake score was then categorized into low, medium, and high tertiles, which correspondto light, normal, and heavy eating behaviors, respectively.
We computed the comorbidity risk score following the procedure in Sullivan et al. [28], which wasdeveloped based on the Heart Framingham Study. Briefly, we used a Cox regression model to obtainthe coefficient of cancer incidence related to each chronic condition, adjusting for age and otherdemographic variables. Then, the risk point corresponding to each chronic condition was obtained by
Cancers 2020, 12, 1834 4 of 22
dividing the above-calculated regression coefficients for comorbidities by the coefficient for a one-yearincrease in age. The comorbidity score for each individual was defined as the sum of the four riskpoints for four chronic conditions. The differences between the cancer and noncancer groups andamong groups with different comorbidity scores according to anthropometric factors and the 16 foodgroups were explored using chi-square tests for categorical variables and t-tests and ANOVA forcontinuous variables. The determination of the time to cancer incidence according to the comorbidityrisk score was made via Kaplan–Meier estimates. The association between the comorbidity risk scoreand cancer incidence was finally investigated using the Cox proportional hazards model. We assignedthe mean values of the comorbidity risk score to test the linear trend across the strata.
Given that a previous study did not support the association between total cholesterol and cancerrisk [29], we excluded total cholesterol from the comorbidity risk score in the sensitivity analysis.We also performed the analysis while considering all the participants, regardless of the time to cancerdiagnosis, and compared the results with our main findings.
3. Results
3.1. Dietary Scores of Study Participants
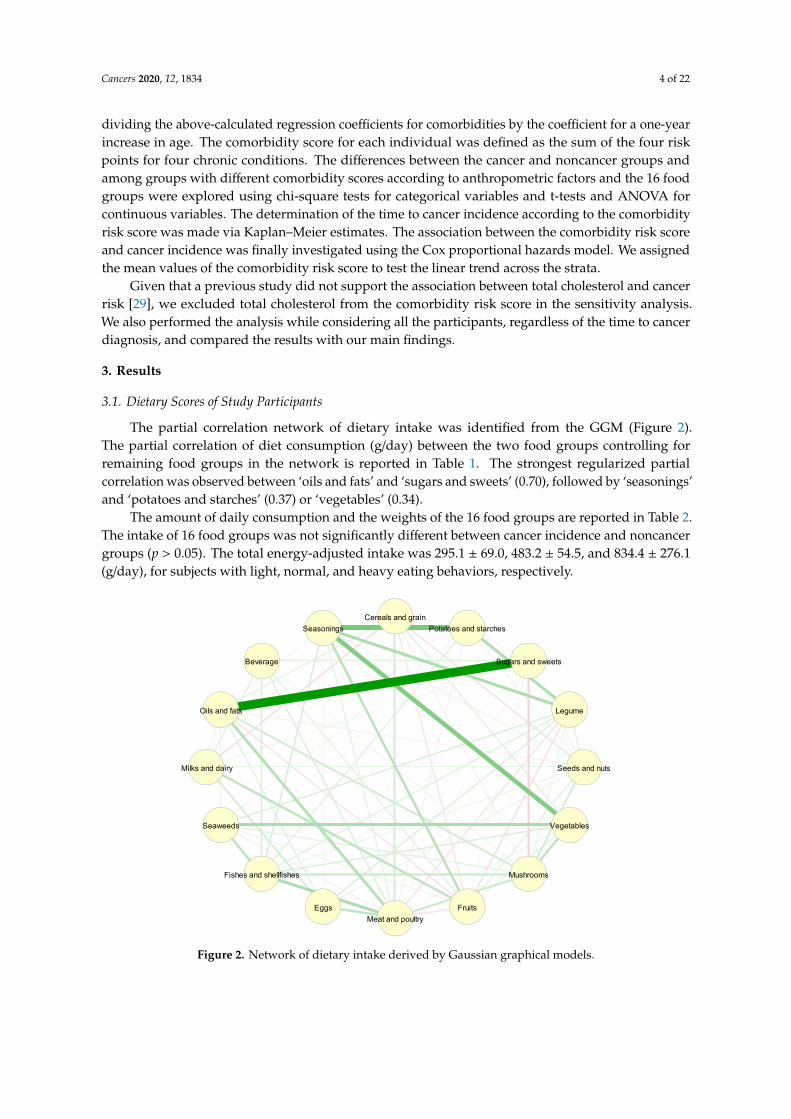
The partial correlation network of dietary intake was identified from the GGM (Figure 2).The partial correlation of diet consumption (g/day) between the two food groups controlling forremaining food groups in the network is reported in Table 1. The strongest regularized partialcorrelation was observed between ‘oils and fats’ and ‘sugars and sweets’ (0.70), followed by ‘seasonings’and ‘potatoes and starches’ (0.37) or ‘vegetables’ (0.34).
The amount of daily consumption and the weights of the 16 food groups are reported in Table 2.The intake of 16 food groups was not significantly different between cancer incidence and noncancergroups (p > 0.05). The total energy-adjusted intake was 295.1 ± 69.0, 483.2 ± 54.5, and 834.4 ± 276.1(g/day), for subjects with light, normal, and heavy eating behaviors, respectively.
Cancers 2020, 12, x 4 of 25
the sum of the four risk points for four chronic conditions. The differences between the cancer and noncancer groups and among groups with different comorbidity scores according to anthropometric factors and the 16 food groups were explored using chi-square tests for categorical variables and t-tests and ANOVA for continuous variables. The determination of the time to cancer incidence according to the comorbidity risk score was made via Kaplan–Meier estimates. The association between the comorbidity risk score and cancer incidence was finally investigated using the Cox proportional hazards model. We assigned the mean values of the comorbidity risk score to test the linear trend across the strata.
Given that a previous study did not support the association between total cholesterol and cancer risk [29], we excluded total cholesterol from the comorbidity risk score in the sensitivity analysis. We also performed the analysis while considering all the participants, regardless of the time to cancer diagnosis, and compared the results with our main findings.
3. Results
3.1. Dietary Scores of Study Participants
The partial correlation network of dietary intake was identified from the GGM (Figure 2). The partial correlation of diet consumption (g/day) between the two food groups controlling for remaining food groups in the network is reported in Table 1. The strongest regularized partial correlation was observed between ‘oils and fats’ and ‘sugars and sweets’ (0.70), followed by ‘seasonings’ and ‘potatoes and starches’ (0.37) or ‘vegetables’ (0.34).
The amount of daily consumption and the weights of the 16 food groups are reported in Table 2. The intake of 16 food groups was not significantly different between cancer incidence and noncancer groups (p > 0.05). The total energy-adjusted intake was 295.1 ± 69.0, 483.2 ± 54.5, and 834.4 ± 276.1 (g/day), for subjects with light, normal, and heavy eating behaviors, respectively.
Figure 2. Network of dietary intake derived by Gaussian graphical models.
Cereals and grainPotatoes and starches
Sugars and sweets
Legume
Seeds and nuts
Vegetables
Mushrooms
FruitsMeat and poultry
Eggs
Fishes and shellfishes
Seaweeds
Milks and dairy
Oils and fats
Beverage
Seasonings
Figure 2. Network of dietary intake derived by Gaussian graphical models.

Cancers 2020, 12, 1834 5 of 22
Table 1. Adjacency matrix for partial correlation of dietary intake of 16 food groups.
Cerealsand Grains
Potatoesand Starches
Sugarsand Sweets Legumes Seeds
and Nuts Vegetables Mushrooms Fruits Meatand Poultry Eggs Fish
and Shellfish Seaweed Milkand Dairy
Oilsand Fats Beverages Seasonings
Cereals and grains
Potatoes and starches
Sugars and sweets 0.05
Legumes 0.22
Seeds and nuts −0.08 0.05 0.05 0.08
Vegetables 0.08
Mushrooms −0.05 −0.12 0.07 0.12 0.18
Fruits −0.07 0.04 −0.08 0.08 0.08
Meat and poultry 0.11 −0.05 −0.04 −0.07 0.05 0.15
Eggs −0.07 0.09 0.06 0.17
Fish and shellfish 0.08 0.09 0.06 0.10 0.15 0.23
Seaweed 0.04 0.10 0.23 0.07 0.06 −0.06 0.19
Milk and dairy −0.09 0.05 0.07 0.18 0.12
Oils and fats 0.07 0.70 −0.05 0.12 −0.08 0.20 0.08 −0.05 −0.04
Beverages 0.08 0.05 0.08 0.10 0.10 0.08
Seasonings 0.37 0.23 0.06 0.34 0.19 0.07 0.04 0.11 0.05
Table 2. Dietary intake of study population and eigenvector centrality of 16 food groups.
Food Group Daily Intake (g/day) Eigenvector CentralityTotal (N = 5,606) Cancer (N = 176) Noncancer (N = 5430) p-Value
Cereals and grains 582.77 ± 213.71 564.0 ± 188.5 583.4 ± 214.5 0.18 0.09
Potatoes and starches 44.49 ± 43.74 43.1 ± 45.9 44.5 ± 43.7 0.68 0.68
Sugars and sweets 5.02 ± 5.24 4.6 ± 5.2 5.0 ± 5.2 0.27 0.51
Legumes 59.84 ± 67.42 57.4 ± 54.2 59.9 ± 67.8 0.55 0.59
Seeds and nuts 5.52 ± 9.98 4.8 ± 12.7 5.5 ± 9.9 0.42 0.32
Vegetables 312.12 ± 204.07 322.4 ± 209.2 311.8 ± 203.9 0.50 0.76
Mushrooms 9.05 ± 13.48 10.3 ± 16.4 9.0 ± 13.4 0.29 0.50
Fruits 220.65 ± 255.47 225.4 ± 246.1 220.5 ± 255.8 0.80 0.27
Meat and poultry 58.62 ± 51.63 55.8 ± 50.3 58.7 ± 51.7 0.46 0.48

Cancers 2020, 12, 1834 6 of 22
Table 2. Cont.
Food Group Daily Intake (g/day) Eigenvector CentralityTotal (N = 5,606) Cancer (N = 176) Noncancer (N = 5430) p-Value
Eggs 17.33 ± 18.04 17.0 ± 18.3 17.3 ± 18.0 0.82 0.30
Fish and shellfish 39.99 ± 34.98 40.0 ± 35.2 40.0 ± 35.0 >0.99 0.70
Seaweed 2.25 ± 2.37 2.4 ± 2.4 2.2 ± 2.4 0.53 0.45Milk and dairy 108.63 ± 137.91 101.7 ± 139.0 108.9 ± 137.9 0.50 0.13
Oils and fats 3.83 ± 3.81 3.5 ± 3.6 3.8 ± 3.8 0.19 0.61
Beverages 75.15 ± 110.42 86.2 ± 126.4 74.8 ± 109.9 0.24 0.25
Seasonings 17.42 ± 14.80 17.2 ± 13.7 17.4 ± 14.8 0.81 1.00
Data for daily intake are presented as mean (standard deviation). p-values were obtained by performing a t-test.

Cancers 2020, 12, 1834 7 of 22
Nodes reflect food groups, and edges reflect the conditional dependencies between food groups.Green lines show positive partial correlations, and red lines show negative partial correlations.The thickness of the edges represents the strength of correlations.
3.2. Comorbidity risk scores of study participants
Table 3 presents the associations between individual comorbidities and cancer incidence.A borderline increased incidence of cancer was observed in those with hypertension (adjustedHR = 1.53, 95% CI = 1.02, 2.29). The significant associations in the model fully adjusted for all possiblecovariates were observed for hypertension (HR = 1.56, 95% CI = 1.02, 2.39) and normal total cholesterol(HR = 1.51, 95% CI = 1.03, 2.19). The comorbidity risk scores were highest in subjects with a GFR≥90 mL/min/1.73 m2 (score = 9). Intermediate risk scores were assigned to those with hypertension(score = 8) and normal cholesterol (score = 8), followed by low cholesterol (score = 5) and prediabetesand diabetes (score = 5). Subjects with elevated blood pressure and GFR 60–89 mL/min/1.73 m2 wereat low risk (score = 2).
3.3. Baseline Characteristics of the Study Participants
During the median follow-up time of 5.34 years (interquartile range (IQR) = 4.03–6.45, total 29,145person-years), 176 patients were newly diagnosed with cancer. Cancer subjects were observed to besignificantly older than noncancer participants, with age at baseline in the two groups of 55.8± 8.7 yearsand 52.5 ± 8.2, respectively (p < 0.001). Except employment status (p = 0.02), other demographiccharacteristics and GGM-identified dietary scores were not significantly different between the cancerand noncancer groups (Table 4). In contrast, most of the factors, including age, sex, education,employment, tobacco smoking, alcohol consumption, and BMI, were unequally distributed amonggroups stratified by comorbidity risk scores (p < 0.001).
3.4. Comorbidity and Cancer Incidence
Figure 3 shows the Kaplan–Meier estimates for the cancer-free probability for different strata ofcomorbidity risk scores. The median times to cancer incidence were 5.42 years (IQR = 4.24, 6.53), 5.44years (IQR = 4.12, 6.45), 5.34 years (IQR = 3.87, 6.44), and 4.38 years (IQR = 3.23, 6.15) for scores of 0–8,9–10, 11–15, and 16–30, respectively.
The association between the comorbidity risk score and cancer incidence is detailed in Table 5.Compared with participants scoring 0–8, those whose scores were 16–30 had a 127% increased risk(HR = 2.27, 95% CI = 1.49, 3.46) of cancer in the crude model. A significantly positive association wasstill observed in the fully adjusted model, with HR = 2.15, 95% CI = 1.39, 3.31. The linear trend testsuggested that there might be a dose-dependent statistical association between the comorbidity riskscore and cancer incidence (p < 0.001).
In the subgroup analysis by sex, the cancer incidence was higher among subjects who scored16–30 than among those who scored 0–8, with HRs (95% CIs) of 2.39 (1.18, 4.84) for males and 1.99(1.11, 3.59) for females. There was also the dose-dependent relationship in the sex-specific analysis(p = 0.01 for both males and females).

Cancers 2020, 12, 1834 8 of 22
Table 3. Comorbidity biomarkers and the risk of cancer incidence.
Comorbidity Biomarkers Population(N = 5606)
Incidence(N = 176)
AdjustedHR (95% Confidence
Interval (CI)) a
Fully AdjustedHR (95% CI) b Risk Point c
Blood pressure (mmHg)Normal 1662 38 1 (ref) 1 (ref) 0Elevated 2225 59 1.07 (0.71, 1.61) 1.12 (0.74, 1.70) 2
Hypertension 1719 79 1.53 (1.02, 2.29) 1.56 (1.02, 2.39) 8
Total cholesterol (mg/dL)Low 1492 47 1.23 (0.86, 1.77) 1.31 (0.91, 1.88) 5
Normal 1141 42 1.39 (0.96, 2.01) 1.51 (1.03, 2.19) 8Elevated 2793 87 1 (ref) 1 (ref) 0
Fasting glucose (mmol/L)Normal 5029 147 1 (ref) 1 (ref) 0
Prediabetes and diabetes 577 29 1.40 (0.93, 2.09) 1.32 (0.87, 2.00) 5
Glomerular filtration rate (mL/min/1.73 m2)<60 268 13 1 (ref) 1 (ref) 0
60–89 4459 142 0.99 (0.55, 1.78) 1.11 (0.62, 2.02) 2≥90 739 21 1.41 (0.69, 2.89) 1.65 (0.80, 3.43) 9
a Adjusted for age; b Adjusted for age, sex, marital status, education, employment, monthly income, smoking, drinking, physical activity, body mass index, dietary score, and other chronicdiseases; c Calculated by dividing the coefficient of each level of comorbidity biomarkers by the coefficient of age in the fully adjusted model.

Cancers 2020, 12, 1834 9 of 22
Table 4. Baseline characteristics of the study population.
Cancer Status Comorbidity Risk Score
Cancer(N = 176)
Noncancer(N = 5430) p-Value Score 0–8
(N = 2114)Score 9–10(N = 1621)
Score 11–15(N = 1098)
Score 16–30(N = 773) p-Value
Age (years) 55.8 (8.7) 52.5 (8.2) <0.001 51.6 (8.1) 52.8 (8.3) 53.3 (8.6) 53.7 (8.0) <0.001<50 44 (25.0%) 2051 (37.8%) <0.001 880 (41.6) 589 (36.3) 395 (36.0) 231 (29.9) <0.001
50–54 41 (23.3%) 1272 (23.4%) 518 (24.5) 377 (23.3) 229 (20.9) 189 (24.5)55–59 23 (13.1%) 933 (17.2%) 332 (15.7) 291 (18.0) 182 (16.6) 151 (19.5)≥60 68 (38.6%) 1174 (21.6%) 384 (18.2) 364 (22.5) 292 (26.6) 202 (26.1)
SexFemale 105 (59.7%) 3420 (63.0%) 0.41 1553 (73.5) 1030 (63.5) 579 (52.7) 363 (47.0) <0.001Male 71 (11.9%) 2010 (37.0%) 561 (26.5) 591 (36.5) 519 (47.3) 410 (53.0)
Marital statusMarried, cohabitant 155 (88.1%) 4675 (86.1%) 0.53 1822 (86.2) 1386 (85.5) 953 (86.8) 669 (86.5) 0.79
Others 21 (11.9%) 755 (13.9%) 292 (13.8) 235 (14.5) 145 (13.2) 104 (13.5)
Education<High school 27 (15.3%) 718 (13.2%) 0.37 239 (11.3) 218 (13.4) 141 (12.8) 147 (19.0) <0.001
High school graduate 58 (33.0%) 2059 (37.9%) 796 (37.7) 626 (38.6) 416 (37.9) 279 (36.1)≥ College 91 (51.7%) 2653 (48.9%) 1079 (51.0) 777 (47.9) 541 (49.3) 347 (44.9)
EmploymentEmployed 153 (86.9%) 4994 (92.0%) 0.02 1980 (93.7) 1503 (92.7) 973 (88.6) 691 (89.4) <0.001
Unemployed 23 (13.1%) 436 (8.0%) 134 (6.3) 118 (7.3) 125 (11.4) 82 (10.6)
Monthly income (South Korean won (KRW))<2 million 45 (25.6%) 1182 (21.8%) 0.48 426 (20.2) 352 (21.7) 264 (24.0) 185 (23.9) 0.132–4 million 69 (39.2%) 2207 (40.6%) 860 (40.7) 668 (41.2) 436 (39.7) 312 (40.4)≥4 million 62 (35.2%) 2041 (37.6%) 828 (39.2) 601 (37.1) 398 (36.2) 276 (35.7)
SmokingNever 115 (65.3%) 3600 (66.3%) 0.97 1571 (74.3) 1085 (66.9) 635 (57.8) 424 (54.9) <0.001Past 39 (22.2%) 1166 (21.5%)
Current 22 (12.5%) 664 (12.2%) 321 (15.2) 346 (21.3) 313 (28.5) 225 (29.1)
DrinkingNever 68 (38.6%) 2117 (39.0%) 0.80 909 (43.0) 634 (39.1) 392 (35.7) 250 (32.3) <0.001Past 14 (8.0%) 362 (6.7%) 131 (6.2) 113 (7.0) 78 (7.1) 54 (7.0)
Current 94 (53.4%) 2951 (54.3%) 1074 (50.8) 874 (53.9) 628 (57.2) 469 (60.7)
Physical activityNo 71 (40.3%) 2405 (44.3%) 0.34 936 (44.3) 726 (44.8) 472 (43.0) 342 (44.2) 0.83Yes 105 (59.7%) 3025 (55.7%) 1178 (55.7) 895 (55.2) 626 (57.0) 431 (55.8)
Body mass index (kg/m2)<23 69 (39.2%) 2448 (45.1%) 0.14 1131 (53.5) 707 (43.6) 404 (36.8) 275 (35.6) <0.001
23–24.9 46 (26.1%) 1455 (26.8%) 526 (24.9) 431 (26.6) 328 (29.9) 216 (27.9)≥25 61 (34.7%) 1527 (28.1%) 457 (21.6) 483 (29.8) 366 (33.3) 282 (36.5)
Dietary score(g/day) 542.8 (285.3) 537.4 (279.1) 0.80 532.8 (275.9) 536.0 (276.1) 551.3 (301.3) 534.5 (261.5) 0.33Light eating 58 (33.0%) 1811 (33.3%) 0.53 741 (35.1) 529 (32.6) 352 (32.1) 247 (32.0) 0.25
Normal eating 65 (36.9%) 1803 (33.2%) 704 (33.3) 537 (33.1) 356 (32.4) 271 (35.1)Heavy eating 53 (30.1%) 1816 (33.5%) 669 (31.6) 555 (34.2) 390 (35.5) 255 (33.0)
Data are presented as counts (percentages) for categorical variables and means (standard deviations) for continuous variables. p-values were obtained by performing chi-square tests forcategorical variables and t-tests or an ANOVA for continuous variables.

Cancers 2020, 12, 1834 10 of 22Cancers 2020, 12, x 11 of 25
Figure 3. Kaplan–Meier estimates of cancer-free probability by comorbidity risk scores.
The association between the comorbidity risk score and cancer incidence is detailed in Table 5. Compared with participants scoring 0–8, those whose scores were 16–30 had a 127% increased risk (HR = 2.27, 95% CI = 1.49, 3.46) of cancer in the crude model. A significantly positive association was still observed in the fully adjusted model, with HR = 2.15, 95% CI = 1.39, 3.31. The linear trend test suggested that there might be a dose-dependent statistical association between the comorbidity risk score and cancer incidence (p < 0.001).
In the subgroup analysis by sex, the cancer incidence was higher among subjects who scored 16–30 than among those who scored 0–8, with HRs (95% CIs) of 2.39 (1.18, 4.84) for males and 1.99 (1.11, 3.59) for females. There was also the dose-dependent relationship in the sex-specific analysis (p = 0.01 for both males and females).
Table 5. Comorbidity scores and the risk of cancer incidence.
Population (N = 5,606)
Incidence (N = 176)
Crude HR (95% CI)
Adjusted HR (95% CI) a
Fully Adjusted HR (95% CI) b
All subjects Score 0–8 2114 53 1 (ref) 1 (ref) 1 (ref)
Score 9–10 1,621 51 1.28 (0.87, 1.88) 1.22 (0.83, 1.79) 1.23 (0.84, 1.82)
Score 11–15 1,098 35 1.32 (0.86, 2.02) 1.23 (0.79, 1.90) 1.24 (0.80, 1.93)
Score 16–30 773 37 2.27 (1.49, 3.46) 2.12 (1.37, 3.27) 2.15 (1.39, 3.31) P-trend <0.001 <0.001 <0.001 Males c
Score 0–8 561 13 1 (ref) 1 (ref) 1 (ref)
Score 9–10 591 20 1.48 (0.74, 2.98) 1.30 (0.64, 2.64) 1.32 (0.65, 2.68)
Figure 3. Kaplan–Meier estimates of cancer-free probability by comorbidity risk scores.
3.5. Sensitivity Analysis
After excluding total cholesterol from the comorbidity risk score, a GFR ≥90 mL/min/1.73 m2 wasthe most substantial contributor to the comorbidity risk score (score = 10), followed by hypertension(score = 8), prediabetes and diabetes (score = 5), elevated blood pressure (score = 2), and GFR60–89 mL/min/1.73 m2 (score = 2) (Table A3). Kaplan–Meier estimates are presented (Figure A2) andsubjects who scored 9–10 and 11–23 were at significantly higher risks of incident cancer than thosewho scored 0–2, with HRs (95% CIs) of 1.64 (1.03, 2.59) and 2.12 (1.27, 3.55), respectively (Table A4).The significant finding was observed in males who scored 3–8, 9–10, or 11–23 despite the large standarderrors, but not in females (Table A4).
In the sensitivity analysis of participants regardless of a time to cancer diagnosis, a GFR≥90 mL/min/1.73 m2 was still the primary contributor to the comorbidity risk score (score = 9),followed by hypertension (score = 7), normal total cholesterol (score = 6), prediabetes and diabetes(score = 2), GFR 60–89 mL/min/1.73 m2 (score = 2), and elevated blood pressure (score = 1) (Table A5).Kaplan–Meier estimates are presented (Figure A3), and compared to subjects who scored 0–4; thosewho scored 11–24 were at a significantly higher risk of incident cancer, with HR = 1.81 and 95%CI = 1.23, 2.67 (Table A6). A significant finding was observed in females who scored 11–24 (HR = 1.79,95% CI = 1.10, 2.93), but not in males (Table A6).

Cancers 2020, 12, 1834 11 of 22
Table 5. Comorbidity scores and the risk of cancer incidence.
Population(N = 5606)
Incidence(N = 176)
CrudeHR (95% CI)
AdjustedHR (95% CI) a
Fully AdjustedHR (95% CI) b
All subjectsScore 0–8 2114 53 1 (ref) 1 (ref) 1 (ref)
Score 9–10 1621 51 1.28 (0.87, 1.88) 1.22 (0.83, 1.79) 1.23 (0.84, 1.82)Score 11–15 1098 35 1.32 (0.86, 2.02) 1.23 (0.79, 1.90) 1.24 (0.80, 1.93)Score 16–30 773 37 2.27 (1.49, 3.46) 2.12 (1.37, 3.27) 2.15 (1.39, 3.31)
P-trend <0.001 <0.001 <0.001
Males c
Score 0–8 561 13 1 (ref) 1 (ref) 1 (ref)Score 9–10 591 20 1.48 (0.74, 2.98) 1.30 (0.64, 2.64) 1.32 (0.65, 2.68)
Score 11–15 519 17 1.47 (0.71, 3.02) 1.24 (0.59, 2.57) 1.25 (0.60, 2.60)Score 16–30 410 21 2.67 (1.34, 5.34) 2.32 (1.15, 4.70) 2.39 (1.18, 4.84)
P-trend 0.001 0.01 0.01
Females c
Score 0–8 1553 40 1 (ref) 1 (ref) 1 (ref)Score 9–10 1030 31 1.20 (0.75, 1.92) 1.17 (0.73, 1.87) 1.17 (0.73, 1.88)
Score 11–15 579 18 1.26 (0.72, 2.21) 1.20 (0.69, 2.10) 1.20 (0.69, 2.11)Score 16–30 363 16 2.04 (1.14, 3.65) 1.99 (1.11, 3.58) 1.99 (1.11, 3.59)
P-trend 0.01 0.01 0.01a Adjusted for age, sex, education, employment, income, smoking, drinking, and body mass index; b Additionallyadjusted for marital status, physical activity, and eating behavior; c Not adjusted for sex in the adjusted and fullyadjusted models.
4. Discussion
In this prospective cohort study, we found nonsignificant associations between comorbiditymarkers, including blood pressure, fasting glucose, and the GFR, and cancer incidence. However,after combining the simultaneous effect of the four comorbidities into one risk score, the risk ofincident cancer was 115% higher among subjects who scored 16–30 than among those who scored 0–8.Sex-specific subgroup analyses also showed significant associations. The relationship was observed tobe dose-dependent.
Although categories of blood pressure (p < 0.001), fasting glucose (p < 0.001), and chronic kidneydisease (p = 0.01) were significantly different among total cholesterol groups (Table A7), a furtheranalysis of excluding total cholesterol from the comorbidity risk score was performed. The comorbidityrisk score for each category was, therefore, lower than those in the main analysis (Tables 5 and A4).The small number of cases among males who scored 0–2 might result in the large 95% CIs. Furthermore,nonsignificant associations were observed for the subgroup analysis of females. Thus, consideringtotal cholesterol with other chronic conditions was necessary to detect the simultaneously significanteffect of comorbidities on sex-specific cancer incidence.
In the sensitivity analysis of participants regardless of time to cancer diagnosis, compared tofindings from the main analysis, the point estimates and their 95% CIs for the association betweenindividual comorbidities and cancer incidence tended to be closer to null (Tables 3 and A5). The riskpoint according to the chronic conditions of blood pressure, total cholesterol, and fasting glucose,therefore, tended to increase after excluding subjects with cancer diagnosis within 1 year (Tables 3and A5). Additionally, while males whose comorbidity risk scores were in the highest category had asignificantly higher risk of cancer (HR = 2.39, 95% CI = 1.18, 4.84, Table 5), the association was notobserved when including early cases in the analysis (HR = 1.79, 95% CI = 0.92, 3.52, Table A6). Thesechanges can be partially explained by the reverse causality effect of subjects with undetected tumorsat baseline [30,31]. Thus, excluding early cases from our analysis minimized the underestimate ofeffect associations.
Regarding the dietary score, this study applied the GGM, which has been widely used in researchon genetics, psychology, and climate. Iqbal et al. also used the GGM to identify major dietary patterns

Cancers 2020, 12, 1834 12 of 22
and investigate their associations with type 2 diabetes, cardiovascular disease, and cancer [32]. However,the quantitative measurement of the dietary score using centrality indices of nodes in the networkhas still not been performed. Other data-derived methods, such as principal component analysisand reduced rank regression, have been manipulated for data dimension reduction purposes [33].However, the GGM is considered a novel approach to describe the partial correlations between foodgroups [32].
Several dietary scores have been developed to elucidate the role of dietary intake in the etiology ofcancer [34,35]. Recently, Lassale et al. systematically reviewed the available dietary indices, which wereused to investigate the association of diet with depression; these included the Mediterranean diet,the healthy eating index, dietary approaches to stop hypertension, and the dietary inflammatoryindex [36]. Although different approaches might be associated in the same direction with a healthoutcome, the posteriori scores of the factor analysis method were reported to be better than the prioriscores of common methods in the evaluation of coronary heart disease risk [37].
In terms of the comorbidity risk score, the Charlson comorbidity index and the Elixhauser scoreare commonly used to determine the severity of health conditions [38,39]. The Charlson comorbidityindex was originally developed with 19 conditions, based on general internal medicine service claimsand the mortality rate of 607 patients over one month [40]. The Elixhauser comorbidity index consists of30 conditions based on the International Classification of Diseases diagnosis codes and was developedto predict hospital resource use and in-hospital mortality [41]. However, data on some rare conditionsmight not be available for our dataset from the general healthy population; thus, we developed thedata-driven approach with a risk score algorithm. The comorbidity risk score derived from the Coxmodel has been widely applied in several studies to predict the risk of hepatocellular carcinoma in theUS, Taiwanese, Japanese, Chinese, and Korean populations [42].
Despite its strengths, this study has several limitations. First, we used data from a cancer screeningprogram of the National Cancer Center; thus, this might not represent the whole general Koreanpopulation. Second, macro- and micronutrients were not involved in our dietary score assessmentmodels. As nutrients generally did not have the same unit, we were unable to combine all the nutrientsin a single dietary score. Because food intake was considered the covariate and we focused on theeffects of comorbidities, the daily amount of food consumed was used to reflect the dietary statusof individuals. Third, the number of incident cases was limited due to the short follow-up duration,which resulted in larger 95% CIs for the sex-specific subgroups than for the entire study population.Additionally, we were not able to perform subgroup analyses by cancer type. Last, the history ofchronic diseases and drugs currently being taken were obtained by subject self-report only and not frommedical records. However, the information was obtained via several separate but related questions tominimize recall bias. Regarding medical history, subjects were asked about their names, their durationof taking drugs in years and months, and their frequency of taking drugs. Additionally, subjectswere asked about the year when a chronic disease was first diagnosed and whether the disease hadbeen treated or not. These self-reported data were combined with blood test results to classify thecomorbidity status.
The evidence for the association between high cholesterol and cancer incidence is controversial.In addition, cholesterol was reported to activate oncogenic Hedgehog signaling and mTORC1,which might result in the differentiation and proliferation of cells, tumor formation, and metastasis [43].Furthermore, abnormal cholesterol levels could impact the structure of lipid rafts, which is known tobe a vital structure involved in cancer signaling [43]. Epidemiological studies also support positiveassociations between cholesterol levels and breast, prostate, and colorectal cancers [44]. However, lowcholesterol was reported to be associated with a higher risk of cancer in Korean, Japanese, Taiwanese,and Caucasian populations [4,23]. In contrast, Kim et al. performed a meta-analysis of approximately65,000 individuals from randomized controlled trials, and no beneficial effect of cholesterol-loweringmedications on cancer prevention was found (pooled relative risk 0.97, 95% CI = 0.92, 1.02) [45].Subgroup analysis by cancer type, statin type, and country showed nonsignificant associations [45].
Cancers 2020, 12, 1834 13 of 22
Nevertheless, our study showed a significant relationship between total cholesterol and overallcancer incidence.
Meta-analyses reported an approximately 30% increased risk of colorectal cancer among thepopulation with diabetes mellitus [46,47]. The Korean Multicenter Cancer Cohort study conductedfrom 1993 to 2005 with a median follow-up of 12 years found that the joint consideration of fastingglucose and a history of diabetes mellitus was not significantly associated with colorectal cancer(HR = 1.54, 95% CI = 0.97, 2.43) [48], which was consistent with our findings. However, an increasedrisk of colorectal cancer was observed in diabetes patients when the duration of the follow-up wasmore than five years (HR = 1.61, 95% CI = 1.02, 2.56) [48].
Evidence from a recent comprehensive meta-analysis showed significant associations betweenblood pressure and the risks of kidney, colorectal, and breast cancers, but not the risks of cancer ofthe stomach, gallbladder, pancreas, lung, cervix, prostate, bladder, and brain [49]. Because of thelimited number of cancer cases, we did not perform a subgroup analysis by cancer type. However,we still found a significant association between hypertension and total cancer incidence. Despite thenonsignificant association, the difference between the point estimates of the coefficient for the effect ofelevated blood pressure and the coefficient for a one-year increase in age was substantial, and elevatedblood pressure still contributed to the risk score.
In the current study, the highest comorbidity risk score was assigned to those who had a normalGFR ≥90 mL/min/1.73 m2. Several studies have suggested that a high GFR is associated with anincreased risk of cancer [4]. This could be explained by patients whose kidney function was mildly ormoderately impaired, as a decrease in the GFR is more likely to develop due to other kidney-relateddiseases and not cancer. Similarly, although we did not observe a significant association between theGFR and cancer incidence in our study, a high GFR was assigned a high-risk score.
5. Conclusions
In summary, the current study found that comorbidities had a joint dose-dependent impact oncancer incidence. These findings may be helpful for the development of cancer prevention programstargeting the management of comorbidities. Further population-based prospective studies withsubstantial follow-up periods are needed to confirm the association among different cancer subtypes.
Author Contributions: Conceptualization, J.K., T.H., J.L.; methodology, J.K., T.H., J.L.; validation, J.K.; formalanalysis, T.H.; data curation, J.K., J.L.; writing—original draft preparation, T.H.; writing—review and editing, J.K.,T.H., J.L.; visualization, T.H.; supervision, J.K.; project administration, J.K. All authors have read and agreed to thepublished version of the manuscript.
Funding: This study was supported by a grant from the National Cancer Center Korea (1910330). The fundershad no role in the design, analysis, or in writing this article.
Conflicts of Interest: The authors declare no conflict of interest.
Appendix A
Table A1. Description of demographics and medical history information used in the study.
Variable Question/Variable Description
Age Continuous (years)
Sex 1, male; 2, female
Marital status 1, single; 2, married; 3, separated; 4, bereavement; 5, cohabitant; 6, divorced; 7, other
Education0, uneducated; 1, drop out of elementary school; 2, elementary school graduate; 3,secondary school graduate; 4, high school graduate; 5, technical institution graduate; 6,drop out of university; 7, university graduate; 8, graduate school; 10, unknown
Employment1, management; 2, specialist; 3, technician; 4, officer; 5, service worker; 6, sales worker;7, agriculture, forestry and fishing worker; 8, skill worker; 9, devices and machineryoperation; 10, labor worker; 11, military; 12, housewife; 13, unemployment; 14, other
Monthly income 1, ≤1 million KRW; 2, 1–2 million KRW; 3, 3–4 million KRW; 4, 4–7 million KRW; 5, ≥7million KRW; 6, other; 9, unknown

Cancers 2020, 12, 1834 14 of 22
Table A1. Cont.
Variable Question/Variable Description
Smoking 1, currently smoking; 2, smoked in the past and has stopped within 1 year; 3, smokedin the past and has stopped over 1 year; 4, never
Drinking 1, currently drinking; 2, drank in the past; 3, never
Physical activity 1, yes; 2, no
Height Continuous (cm)
Weight Continuous (kg)
History of hypertensionHave you ever been diagnosed with hypertension? When was your hypertensionfirstly diagnosed? Are you currently undergoing treatment for hypertension? Haveyou ever been treated for hypertension?
Use of anti-hypertensive drugs
Do you remember the name of the anti-hypertensive drug that you use? How manyyears have you been taking anti-hypertensive drugs? How many months have youbeen taking anti-hypertensive drugs? How often have you been taking theanti-hypertensive drugs?
History of dyslipidemiaHave you ever been diagnosed with dyslipidemia? When was your dyslipidemiafirstly diagnosed? Are you currently undergoing treatment for dyslipidemia? Haveyou ever been treated for dyslipidemia?
Use of anti-dyslipidemia drugs
Do you remember the name of the anti-dyslipidemia drug that you use? How manyyears have you been taking anti-dyslipidemia drugs? How many months have youbeen taking anti-dyslipidemia drugs? How often have you been taking theanti-dyslipidemia drugs?
History of diabetes mellitusHave you ever been diagnosed with diabetes mellitus? When was your diabetesmellius firstly diagnosed? Are you currently undergoing treatment for diabetesmellitus? Have you ever been treated for diabetes mellitus?
Use of anti-diabetes drugsDo you remember the name of the anti-diabetes drug that you use? How many yearshave you been taking anti-diabetes drugs? How many months have you been takinganti-diabetes drugs? How often have you been taking the anti-diabetes drugs?
Table A2. Food groups used to construct the network of dietary intake.
Food Group (N = 16) Food Items Included in the Food-Frequency Questionnaire (N = 106)
Cereals and grainPotatoes and starchesSugars and sweetsLegumeSeeds and nutsVegetablesMushroomsFruitsMeat and poultryEggsFishes and shellfishesSeaweedsMilks and dairyOils and fatsBeverageSeasonings
Cooked rice, cooked rice with soy beans, cooked rice with other cereals, cooked riceand cooked rice with soy beans almolst same, cooked rice and cooked rice with othercereals almost same, ramen, wheat noodles with soup, chajangmyeon/ jambbong,buckwheat vermicelli/ buckwheat noodle, dumping/dumping with soup, rice cake(plain rod shape)/ rice cake with soup, rice cake, cereals and corn flakes, loaf bread/sandwich/ toast, jam/ honey/ butter/ margarine(when with put on bread), bread withsmall red bean, other bread, cakes/ chocopie, pizza/ hamburger, parched cereal powder,cookie/ cracker/ snack, candy/ chocolate, nuts, legumes (including beans, excludingcooked rice with bean), soup and stew with soybean paste/ soybean paste, eggs/ quaileggs, tofu (including tofu in soups and stews), starch jelly, potato (including fried,steamed boiled potatoes), sweet potatoes, starch vermicelli, kimchi and Koreancabbage, kkakduki/ small radish kimchi, kimchi and radish with water, other kimchi,Korean style pickles, radish/ salted radish, Korean cabbages/ Korean cabbage soup,spinach, lettuce, perilla leaf, vegetable wrap/ vegetable salad, other green vegetables,deokduck/ doraji, bean sprouts, bracken/ sweet potato stalk/ stem of taro, oystermushroom, other mushrooms, pepper leaves/ chamnamul/ asterscaber, crown daisy/leek/ water dropwort, cucumber, carot/ carrot juice, onion, green pepper, immaturepumpkin, mature pumpkin/ pumpkin juice, pork (belly), roasted pork, braised pork,ham/ sausage, edible viscera, steak/ roasted beef, dog meat, fried chicken/ chicken stew,beef soup, beef soup with vegetables, sushi, mackerel/ Pacific saury/ Spanish mackerel,hair tail, eel, yellow croaker/ sea bream/ flat fish, Alaska Pollack, cuttlefish/ octopus,dried anchovy, canned tuna, salted-fermented fish, clam/whelk, oyster, crab, shrimp,fish paste/ crab flavored, dried laver, kelp/ sea mustard, milk, yogurt, ice cream, cheese,soybean milk, coffee, coffee sugar, coffee cream, green tea, carbonated drinks, otherdrinks, strawberry, muskmelon/ melon, watermelon, peach/ plum, banana, hard/ driedpersimmon, tangerine, pear/ pear juice, apple/ apple juice, orange/ orange juice, grape/grape juice, and tomato/ cherry tomato/ tomato juice
The daily weight intake (g/day) of food items were estimated according to the consumption frequency (never orrarely, once a month, 2–3 times per month, once or twice a week, 3–4 times per week, 5–6 times per week, once a day,twice a day, and 3 times per day) and the portion size (small, medium, and large).

Cancers 2020, 12, 1834 15 of 22
Table A3. Comorbidity biomarkers and the risk of cancer incidence after removing total cholesterol from comorbidity risk score.
Comorbidity Biomarkers Population(N = 5606) Incidence(N = 176) Adjusted HR (95% CI) a Fully adjusted HR(95% CI) b Risk Point c
Blood pressure (mmHg)Normal 1662 38 1 (ref) 1 (ref) 0Elevated 2225 59 1.07 (0.71, 1.62) 1.11 (0.73, 1.68) 2
Hypertension 1719 79 1.53 (1.02, 2.29) 1.52 (0.99, 2.33) 8
Fasting glucose (mmol/L)Normal 5029 147 1 (ref) 1 (ref) 0
Prediabetes and diabetes 577 29 1.40 (0.93, 2.09) 1.30 (0.86, 1.97) 5
Glomerular filtration rate (mL/min/1.73 m2)<60 268 13 1 (ref) 1 (ref) 0
60–89 4459 142 0.99 (0.55, 1.78) 1.10 (0.61, 1.98) 2≥90 739 21 1.41 (0.69, 2.89) 1.63 (0.79, 3.38) 10
a Adjusted for age; b Additionally adjusted for age, sex, marital status, education, employment, monthly income, smoking, drinking, physical activity, body mass index, eating behavior,and other chronic diseases; c Calculated by dividing the coefficient of each level of comorbidity biomarkers by the coefficient of age in the fully adjusted model.
Table A4. Comorbidity scores and the risk of cancer incidence after removing total cholesterol from comorbidity risk score.
Population(N = 5,606)
Incidence(N = 176)
Crude HR(95% CI)
Adjusted HR(95% CI) a
Fully adjusted HR(95% CI) b
All subjectsScore 0–2 1421 31 1 (ref) 1 (ref) 1 (ref)Score 3–8 1881 53 1.32 (0.85, 2.06) 1.25 (0.80, 1.96) 1.27 (0.81, 1.99)
Score 9–10 1511 58 1.89 (1.22, 2.93) 1.61 (1.02, 2.55) 1.64 (1.03, 2.59)Score 11–23 793 34 2.46 (1.51, 4.00) 2.10 (1.25–3.51) 2.12 (1.27, 3.55)
P-trend <0.001 0.001 0.001
Males c
Score 0–2 308 2 1 (ref) 1 (ref) 1 (ref)Score 3–8 662 20 4.62 (1.08, 19.8) 4.55 (1.05, 19.6) 4.73 (1.10, 20.5)
Score 9–10 680 28 6.64 (1.58, 27.9) 5.44 (1.27, 23.3) 5.69 (1.33, 24.4)Score 11–23 431 21 9.33 (2.19, 39.8) 7.81 (1.80, 33.9) 8.06 (1.85, 35.1)
P-trend 0.01 0.02 0.02

Cancers 2020, 12, 1834 16 of 22
Table A4. Cont.
Population(N = 5,606)
Incidence(N = 176)
Crude HR(95% CI)
Adjusted HR(95% CI) a
Fully adjusted HR(95% CI) b
Females c
Score 0–2 1113 29 1 (ref) 1 (ref) 1 (ref)Score 3–8 1219 33 1.08 (0.66, 1.78) 1.01 (0.61, 1.68) 1.03 (0.62, 1.70)
Score 9–10 831 30 1.52 (0.91, 2.54) 1.35 (0.79, 2.30) 1.36 (0.80, 2.33)Score 11–23 362 13 1.76 (0.91, 3.39) 1.52 (0.78, 2.99) 1.52 (0.77, 3.00)
P-trend 0.03 0.11 0.11a Adjusted for age, sex, education, employment, income, smoking, drinking, and body mass index; b Additionally adjusted for marital status, physical activity, and eating behavior; c Notadjusted for sex in adjusted and fully adjusted models.
Table A5. Comorbidity biomarkers and the risk of cancer incidence in subjects regardless of time to cancer diagnosis.
Comorbidity Biomarkers Population(N = 5643)
Incidence(N = 213)
Adjusted HR(95% CI) a
Fully Adjusted HR(95% CI) b Risk Point c
Blood pressure (mmHg)Normal 1673 49 1 (ref) 1 (ref) 0Elevated 2237 71 1.00 (0.69, 1.44) 1.04 (0.71, 1.50) 1
Hypertension 1733 93 1.41 (0.98, 2.02) 1.45 (0.99, 2.13) 7
Total cholesterol (mg/dL)Low 1498 53 1.10 (0.79–1.53) 1.17 (0.83, 1.63) 3
Normal 1149 50 1.30 (0.93, 1.82) 1.42 (1.01, 1.99) 6Elevated 2996 110 1 (ref) 1 (ref) 0
Fasting glucose (mmol/L)Normal 5065 183 1 (ref) 1 (ref) 0
Prediabetes and diabetes 578 30 1.16 (0.79, 1.72) 1.11 (0.75, 1.67) 2
Glomerular filtration rate (mL/min/1.73 m2)<60 270 15 1 (ref) 1 (ref) 0
60–89 4629 172 1.02 (0.59, 1.75) 1.14 (0.66, 1.97) 2≥90 744 26 1.37 (0.71, 2.64) 1.59 (0.81, 3.10) 9
a Adjusted for age; b Adjusted for age, sex, marital status, education, employment, monthly income, smoking, drinking, physical activity, body mass index, eating behavior, and otherchronic diseases; c Calculated by dividing the coefficient of each level of comorbidity biomarkers by the coefficient of age in the fully adjusted model.

Cancers 2020, 12, 1834 17 of 22
Table A6. Comorbidity scores and the risk of cancer incidence in subjects regardless of time to cancer diagnosis.
Population(N = 5643)
Incidence(N = 176)
CrudeHR(95% CI)
AdjustedHR(95% CI) a
Fully adjustedHR(95% CI) b
All subjectsScore 0–4 1634 48 1 (ref) 1 (ref) 1 (ref)Score 5–8 1365 42 1.00 (0.66, 1.51) 1.11 (0.73, 1.69) 1.12 (0.74, 1.70)Score 9–10 1378 60 1.53 (1.05, 2.23) 1.43 (0.97, 2.10) 1.44 (0.98, 2.12)Score 11–24 1266 63 1.83 (1.26, 2.67) 1.79 (1.22, 2.64) 1.81 (1.23, 2.67)P-trend <0.001 0.002 0.001
Males c
Score 0–4 463 12 1 (ref) 1 (ref) 1 (ref)Score 5–8 407 10 0.94 (0.41, 2.18) 0.89 (0.39, 2.07) 0.90 (0.39, 2.09)Score 9–10 548 26 1.91 (0.96, 3.78) 1.59 (0.79, 3.21) 1.62 (0.81, 3.27)Score 11–24 673 33 2.10 (1.09, 4.07) 1.78 (0.91, 3.49) 1.79 (0.92, 3.52)P-trend 0.01 0.04 0.04
Females c
Score 0–4 1171 36 1 (ref) 1 (ref) 1 (ref)Score 5–8 958 32 1.02 (0.63, 1.64) 1.15 (0.70, 1.87) 1.15 (0.70, 1.88)Score 9–10 830 34 1.38 (0.86, 2.20) 1.27 (0.79, 2.03) 1.28 (0.80, 2.05)Score 11–24 593 30 1.78 (1.09, 2.89) 1.78 (1.09, 2.90) 1.79 (1.10, 2.93)P-trend 0.01 0.02 0.02
a Adjusted for age, sex, education, employment, income, smoking, drinking, and body mass index; b Additionally adjusted for marital status, physical activity, and eating behavior; c Donot adjust for sex in adjusted and fully adjusted models.
Table A7. Distribution of total cholesterol groups according to blood pressure, fasting glucose, and glomerular filtration rate categories.
Total Cholesterol (mg/dL) p-Value
Low (N = 1492) Normal (N = 1141) High (N = 2973)
Blood pressure (mmHg)
Normal 548 (36.7%) 360 (31.6%) 754 (25.4%) <0.001
Elevated 572 (38.3%) 480 (42.1%) 1173 (39.5%)
Hypertension 372 (24.9%) 301 (26.2%) 1046 (35.2%)
Fasting glucose (mmol/L)

Cancers 2020, 12, 1834 18 of 22
Table A7. Cont.
Total Cholesterol (mg/dL) p-Value
Low (N = 1492) Normal (N = 1141) High (N = 2973)
Normal 1365 (91.5%) 1049 (91.9%) 2615 (88.0%) <0.001
Prediabetes and diabetes 127 (8.5%) 92 (8.1%) 358 (12.0%)
Glomerular filtration rate (mL/min/1.73 m2)
<60 66 (4.4%) 50 (4.4%) 152 (5.1%) 0.01
60–89 1188 (79.6%) 948 (83.1%) 2463 (82.8%)
≥90 238 (16.0%) 143 (12.5%) 358 (12.0%)
Data are presented as counts (percentages). p-values were obtained from chi-square tests.

Cancers 2020, 12, 1834 19 of 22
Cancers 2020, 12, x 21 of 25
Table A7. Distribution of total cholesterol groups according to blood pressure, fasting glucose, and glomerular filtration rate categories.
Total Cholesterol (mg/dL) p-Value Low (N = 1,492) Normal (N = 1,141) High (N = 2,973)
Blood pressure (mmHg) Normal 548 (36.7%) 360 (31.6%) 754 (25.4%) <0.001 Elevated 572 (38.3%) 480 (42.1%) 1173 (39.5%)
Hypertension 372 (24.9%) 301 (26.2%) 1046 (35.2%) Fasting glucose (mmol/L)
Normal 1365 (91.5%) 1049 (91.9%) 2615 (88.0%) <0.001 Prediabetes and diabetes 127 (8.5%) 92 (8.1%) 358 (12.0%) Glomerular filtration rate (mL/min/1.73 m2)
<60 66 (4.4%) 50 (4.4%) 152 (5.1%) 0.01 60–89 1188 (79.6%) 948 (83.1%) 2463 (82.8%) ≥90 238 (16.0%) 143 (12.5%) 358 (12.0%)
Data are presented as counts (percentages). p-values were obtained from chi-square tests.
Figure A1. Process for identification of dietary intake score.
Figure A1. Process for identification of dietary intake score.Cancers 2020, 12, x 22 of 25
Figure A2. Kaplan–Meier estimates of cancer-free probability by comorbidity risk scores after removing total cholesterol from comorbidity risk score.
Figure A3. Kaplan–Meier estimates of cancer-free probability by comorbidity risk scores in subjects regardless of time to cancer diagnosis.
Figure A2. Kaplan–Meier estimates of cancer-free probability by comorbidity risk scores after removingtotal cholesterol from comorbidity risk score.

Cancers 2020, 12, 1834 20 of 22
Cancers 2020, 12, x 22 of 25
Figure A2. Kaplan–Meier estimates of cancer-free probability by comorbidity risk scores after removing total cholesterol from comorbidity risk score.
Figure A3. Kaplan–Meier estimates of cancer-free probability by comorbidity risk scores in subjects regardless of time to cancer diagnosis.
Figure A3. Kaplan–Meier estimates of cancer-free probability by comorbidity risk scores in subjectsregardless of time to cancer diagnosis.
References
1. Bray, F.; Ferlay, J.; Soerjomataram, I.; Siegel, R.L.; Torre, L.A.; Jemal, A. Global cancer statistics 2018:GLOBOCAN estimates of incidence and mortality worldwide for 36 cancers in 185 countries. CA CancerJ. Clin. 2018, 68, 394–424. [CrossRef] [PubMed]
2. Wang, H.; Naghavi, M.; Allen, C.; Barber, R.M.; A Bhutta, Z.; Carter, A.; Casey, D.C.; Charlson, F.J.; Chen, A.Z.;Coates, M.M.; et al. Global, regional, and national life expectancy, all-cause mortality, and cause-specificmortality for 249 causes of death, 1980–2015: A systematic analysis for the Global Burden of DiseaseStudy 2015. Lancet 2016, 388, 1459–1544. [CrossRef]
3. Boutayeb, A.; Boutayeb, S.; Boutayeb, W. Multi-morbidity of non communicable diseases and equity in WHOEastern Mediterranean countries. Int. J. Equity Health 2013, 12, 60. [CrossRef]
4. Tu, H.; Wen, C.P.; Tsai, S.P.; Chow, W.H.; Wen, C.; Ye, Y.; Zhao, H.; Tsai, M.K.; Huang, M.; Dinney, C.P.; et al.Cancer risk associated with chronic diseases and disease markers: Prospective cohort study. BMJ 2018,360, k134. [CrossRef] [PubMed]
5. WHO-IARC. IARC Monographs on the Identification of Carcinogenic Hazards to Humans. Availableonline: https://publications.iarc.fr/Book-And-Report-Series/Iarc-Monographs-On-The-Identification-Of-Carcinogenic-Hazards-To-Humans (accessed on 4 July 2019).
6. Chow, W.H.; Dong, L.M.; Devesa, S.S. Epidemiology and risk factors for kidney cancer. Nat. Rev. Urol. 2010,7, 245–257. [CrossRef] [PubMed]
7. Corrao, G.; Scotti, L.; Bagnardi, V.; Sega, R. Hypertension, antihypertensive therapy and renal-cell cancer:A meta-analysis. Curr. Drug Saf. 2007, 2, 125–133. [CrossRef] [PubMed]
8. Hidayat, K.; Du, X.; Zou, S.Y.; Shi, B.M. Blood pressure and kidney cancer risk: Meta-analysis of prospectivestudies. J. Hypertens. 2017, 35, 1333–1344. [CrossRef]
9. Sobczuk, P.; Szczylik, C.; Porta, C.; Czarnecka, A.M. Renin angiotensin system deregulation as renal cancerrisk factor. Oncol. Lett. 2017, 14, 5059–5068. [CrossRef] [PubMed]

Cancers 2020, 12, 1834 21 of 22
10. Sona, M.F.; Myung, S.K.; Park, K.; Jargalsaikhan, G. Type 1 diabetes mellitus and risk of cancer: A meta-analysisof observational studies. Jpn. J. Clin. Oncol. 2018, 48, 426–433. [CrossRef] [PubMed]
11. Li, H.; Qian, J. Association of diabetes mellitus with thyroid cancer risk: A meta-analysis of cohort studies.Med. Baltim. 2017, 96, e8230. [CrossRef]
12. Xu, Y.; Huo, R.; Chen, X.; Yu, X. Diabetes mellitus and the risk of bladder cancer: A PRISMA-compliantmeta-analysis of cohort studies. Med. Baltim. 2017, 96, e8588. [CrossRef] [PubMed]
13. Lowrance, W.T.; Ordonez, J.; Udaltsova, N.; Russo, P.; Go, A.S. CKD and the risk of incident cancer. J. Am.Soc. Nephrol. 2014, 25, 2327–2334. [CrossRef] [PubMed]
14. Strohmaier, S.; Edlinger, M.; Manjer, J.; Stocks, T.; Bjorge, T.; Borena, W.; Haggstrom, C.; Engeland, A.;Nagel, G.; Almquist, M.; et al. Total serum cholesterol and cancer incidence in the Metabolic syndrome andCancer Project (Me-Can). PLoS ONE 2013, 8, e54242. [CrossRef]
15. Kitahara, C.M.; Berrington de Gonzalez, A.; Freedman, N.D.; Huxley, R.; Mok, Y.; Jee, S.H.; Samet, J.M.Total cholesterol and cancer risk in a large prospective study in Korea. J. Clin. Oncol. 2011, 29, 1592–1598.[CrossRef] [PubMed]
16. Julibert, A.; Bibiloni, M.D.M.; Mateos, D.; Angullo, E.; Tur, J.A. Dietary fat intake and metabolic syndrome inolder adults. Nutrients 2019, 11, 1901. [CrossRef]
17. Xiao, Y.; Xia, J.; Li, L.; Ke, Y.; Cheng, J.; Xie, Y.; Chu, W.; Cheung, P.; Kim, J.H.; Colditz, G.A.; et al.Associations between dietary patterns and the risk of breast cancer: A systematic review and meta-analysisof observational studies. Breast Cancer Res. 2019, 21, 16. [CrossRef]
18. Kaluza, J.; Larsson, S.C.; Linden, A.; Wolk, A. Consumption of unprocessed and processed red meat and therisk of chronic obstructive pulmonary disease: A prospective cohort study of men. Am. J. Epidemiol. 2016,184, 829–836. [CrossRef]
19. Feng, Y.L.; Shu, L.; Zheng, P.F.; Zhang, X.Y.; Si, C.J.; Yu, X.L.; Gao, W.; Zhang, L. Dietary patterns andcolorectal cancer risk: A meta-analysis. Eur. J. Cancer Prev. 2017, 26, 201–211. [CrossRef]
20. Chiuve, S.E.; Fung, T.T.; Rimm, E.B.; Hu, F.B.; McCullough, M.L.; Wang, M.; Stampfer, M.J.; Willett, W.C.Alternative dietary indices both strongly predict risk of chronic disease. J. Nutr. 2012, 142, 1009–1018.[CrossRef]
21. Kim, J. Cancer screenee cohort study of the National Cancer Center in South Korea. Epidemiol. Health 2014,36, e2014013. [CrossRef]
22. Whelton, P.K.; Carey, R.M.; Aronow, W.S.; Casey, D.E., Jr.; Collins, K.J.; DennisonHimmelfarb, C.; DePalma, S.M.; Gidding, S.; Jamerson, K.A.; Jones, D.W.; et al. 2017ACC/AHA/AAPA/ABC/ACPM/AGS/APhA/ASH/ASPC/NMA/PCNA Guideline for the Prevention, Detection,Evaluation, and Management of High Blood Pressure in Adults: Executive Summary: A Report of the AmericanCollege of Cardiology/American Heart Association Task Force on Clinical Practice Guidelines. Hypertension 2018,71, 1269–1324. [CrossRef]
23. Wu, B.; Teng, L.; He, D.; Yu, D.D.; Jiang, F. Dose-response relation between serum total cholesterol levels andoverall cancer risk: Evidence from 12 prospective studies involving 1,926,275 participants. Int. J. Food Sci.Nutr. 2019, 70, 432–441. [CrossRef] [PubMed]
24. Florkowski, C.M.; Chew-Harris, J.S. Methods of estimating GFR-different equations including CKD-EPI.Clin. Biochem. Rev. 2011, 32, 75–79.
25. Friedman, J.; Hastie, T.; Tibshirani, R. Package ‘Glasso’: Graphical Lasso: Estimation of Gaussian GraphicalModels; 2019. Version 1.11. Available online: https://cran.r-project.org/web/packages/glasso/glasso.pdf(accessed on 12 December 2019).
26. Chen, J.; Chen, Z. Extended Bayesian information criteria for model selection with large model spaces.Biometrika 2008, 95, 759–771. [CrossRef]
27. Negre, C.F.A.; Morzan, U.N.; Hendrickson, H.P.; Pal, R.; Lisi, G.P.; Loria, J.P.; Rivalta, I.; Ho, J.; Batista, V.S.Eigenvector centrality for characterization of protein allosteric pathways. Proc. Natl. Acad. Sci. USA 2018,115, E12201–E12208. [CrossRef] [PubMed]
28. Sullivan, L.M.; Massaro, J.M.; D’Agostino, R.B., Sr. Presentation of multivariate data for clinical use:The Framingham Study risk score functions. Stat. Med. 2004, 23, 1631–1660. [CrossRef] [PubMed]
29. Kritchevsky, S.B.; Kritchevsky, D. Serum cholesterol and cancer risk: An epidemiologic perspective.Annu. Rev. Nutr. 1992, 12, 391–416. [CrossRef]

Cancers 2020, 12, 1834 22 of 22
30. Song, N.; Huang, D.; Jang, D.; Kim, M.J.; Jeong, S.Y.; Shin, A.; Park, J.W. Optimal body mass index cut-off
point for predicting colorectal cancer survival in an Asian population: A National Health InformationDatabase Analysis. Cancers 2020, 12, 830. [CrossRef]
31. Shafique, K.; McLoone, P.; Qureshi, K.; Leung, H.; Hart, C.; Morrison, D.S. Cholesterol and the risk ofgrade-specific prostate cancer incidence: Evidence from two large prospective cohort studies with up to 37years’ follow up. BMC Cancer 2012, 12, 25. [CrossRef]
32. Iqbal, K.; Schwingshackl, L.; Floegel, A.; Schwedhelm, C.; Stelmach-Mardas, M.; Wittenbecher, C.; Galbete, C.;Knuppel, S.; Schulze, M.B.; Boeing, H. Gaussian graphical models identified food intake networks and riskof type 2 diabetes, CVD, and cancer in the EPIC-Potsdam study. Eur. J. Nutr. 2019, 58, 1673–1686. [CrossRef]
33. Naja, F.; Itani, L.; Hwalla, N.; Sibai, A.M.; Kharroubi, S.A. Identification of dietary patterns associated withelevated blood pressure among Lebanese men: A comparison of principal component analysis with reducedrank regression and partial least square methods. PLoS ONE 2019, 14, e0220942. [CrossRef]
34. Lee, S.; Quiambao, A.L.; Lee, J.; Ro, J.; Lee, E.S.; Jung, S.Y.; Sung, M.K.; Kim, J. Dietary inflammatory indexand risk of breast cancer Based on hormone receptor status: A case-control study in Korea. Nutrients 2019,11, 1949. [CrossRef] [PubMed]
35. Schwingshackl, L.; Schwedhelm, C.; Galbete, C.; Hoffmann, G. Adherence to Mediterranean diet and risk ofcancer: An updated systematic review and meta-analysis. Nutrients 2017, 9, 1063. [CrossRef] [PubMed]
36. Lassale, C.; Batty, G.D.; Baghdadli, A.; Jacka, F.; Sanchez-Villegas, A.; Kivimaki, M.; Akbaraly, T. Healthydietary indices and risk of depressive outcomes: A systematic review and meta-analysis of observationalstudies. Mol. Psychiatry 2019, 24, 965–986. [CrossRef] [PubMed]
37. Menotti, A.; Puddu, P.E. Comparison of four dietary scores as determinants of coronary heart diseasemortality. Sci. Rep. 2018, 8, 15001. [CrossRef]
38. Molto, A.; Dougados, M. Comorbidity indices. Clin. Exp. Rheumatol. 2014, 32, 131–134.39. Austin, S.R.; Wong, Y.N.; Uzzo, R.G.; Beck, J.R.; Egleston, B.L. Why summary comorbidity measures such as
the Charlson comorbidity index and Elixhauser score work. Med. Care 2015, 53, 65–72. [CrossRef]40. Charlson, M.E.; Pompei, P.; Ales, K.L.; MacKenzie, C.R. A new method of classifying prognostic comorbidity
in longitudinal studies: Development and validation. J. Chronic Dis. 1987, 40, 373–383. [CrossRef]41. Elixhauser, A.; Steiner, C.; Harris, D.R.; Coffey, R.M. Comorbidity measures for use with administrative data.
Med. Care 1998, 36, 8–27. [CrossRef]42. Li, T.C.; Li, C.I.; Liu, C.S.; Lin, W.Y.; Lin, C.H.; Yang, S.Y.; Lin, C.C. Risk score system for the prediction of
hepatocellular carcinoma in patients with type 2 diabetes: Taiwan Diabetes Study. Semin. Oncol. 2018, 45,264–274. [CrossRef]
43. Ding, X.; Zhang, W.; Li, S.; Yang, H. The role of cholesterol metabolism in cancer. Am. J. Cancer Res. 2019, 9,219–227.
44. Murai, T. Cholesterol lowering: Role in cancer prevention and treatment. Biol. Chem. 2015, 396, 1–11.[CrossRef] [PubMed]
45. Kim, M.K.; Myung, S.K.; Tran, B.T.; Park, B. Statins and risk of cancer: A meta-analysis of randomized,double-blind, placebo-controlled trials. Indian J. Cancer 2017, 54, 470–477. [CrossRef]
46. Luo, S.; Li, J.Y.; Zhao, L.N.; Yu, T.; Zhong, W.; Xia, Z.S.; Shan, T.D.; Ouyang, H.; Yang, H.S.; Chen, Q.K. Diabetesmellitus increases the risk of colorectal neoplasia: An updated meta-analysis. Clin. Res. Hepatol. Gastroenterol.2016, 40, 110–123. [CrossRef] [PubMed]
47. Deng, L.; Gui, Z.; Zhao, L.; Wang, J.; Shen, L. Diabetes mellitus and the incidence of colorectal cancer:An updated systematic review and meta-analysis. Dig. Dis. Sci. 2012, 57, 1576–1585. [CrossRef]
48. Park, H.; Cho, S.; Woo, H.; Park, S.K.; Shin, H.R.; Chang, S.H.; Yoo, K.Y.; Shin, A. Fasting glucose and riskof colorectal cancer in the Korean Multi-center Cancer Cohort. PLoS ONE 2017, 12, e0188465. [CrossRef][PubMed]
49. Seretis, A.; Cividini, S.; Markozannes, G.; Tseretopoulou, X.; Lopez, D.S.; Ntzani, E.E.; Tsilidis, K.K.Association between blood pressure and risk of cancer development: A systematic review and meta-analysisof observational studies. Sci. Rep. 2019, 9, 8565. [CrossRef] [PubMed]
© 2020 by the authors. Licensee MDPI, Basel, Switzerland. This article is an open accessarticle distributed under the terms and conditions of the Creative Commons Attribution(CC BY) license (http://creativecommons.org/licenses/by/4.0/).