Embed Size (px)
DESCRIPTION
Wifi hack software tutorial
Citation preview

CommView®
Tutorial Packet Sniffing Is Fun!
Copyright © 1998-2008 TamoSoft. All Rights Reserved.

About This Tutorial This informal tutorial was created to address the frequently asked questions posed by users who are either new to network analyzing tools or those professionals who haven't had experience with the packet analyzer that we're going to describe: CommView by TamoSoft. If you are looking for the formal, detailed help documentation – it's included with the product; just click F1. This tutorial is not intended to cover all aspects of the product's functionality. Rather, it's a brief walk-through that will familiarize you with CommView. While CommView is probably the most user-friendly packet analyzer on the market, getting acquainted with it still takes some time. The good news is the learning curve is short; so let's get started. What's a Packet Analyzer Anyway? It only sounds scary
A packet analyzer is a program (or sometimes, a device) that monitors the data traveling between computers on a network. A packet analyzer is also commonly referred to as a network analyzer, packet decoder, network monitor, protocol decoder, or, more frequently, as a packet sniffer. When you plug the cable into your computer's network adapter or dial up your Internet Service Provider, you join a network, which allows your computer to "talk" to many other computers, be it the Web server of your favorite search engine, your friend's PC running an instant messenger such as ICQ, or a mail server that stores your e-mail. Just like people, computers need to "talk" to exchange information. That's what your computer does almost every second that you are online. The last time that happened was only a few seconds ago, when you downloaded this page from our Web server. Again, just like people use different languages and dialects to exchange information, computers converse using "protocols," which are mutually agreed standards that allow computers to "understand" each other. The problem is that computer conversations usually look like random binary data. That's why you need a packet analyzer: It decodes network traffic, makes sense of it, and performs many other interesting functions. Well, it's time to look at CommView. Download it if you haven't done so already, run the installation on your Windows 2000/XP/2003/Vista/2008 system (32- or 64-bit), and let's get started. CommView: Click & Go! Starting a Packet Capture for the First Time Ok, CommView has been launched and you see the application window in front of you. All you need to do to start your first packet capture is to select the adapter you want to monitor from the drop-down list. You may have one or several adapters. If you're on a corporate LAN, you typically have only one adapter, and if you're at home, one of the adapters may connect you to the cable modem, another one to the second PC, and the dial-up adapter (it's a virtual adapter) may be used to connect to the Internet via the telephone line using an ADSL or old analog modem.
Made your choice? Good, let's click Start Capture; you won't have a difficulty finding it on the program's toolbar:
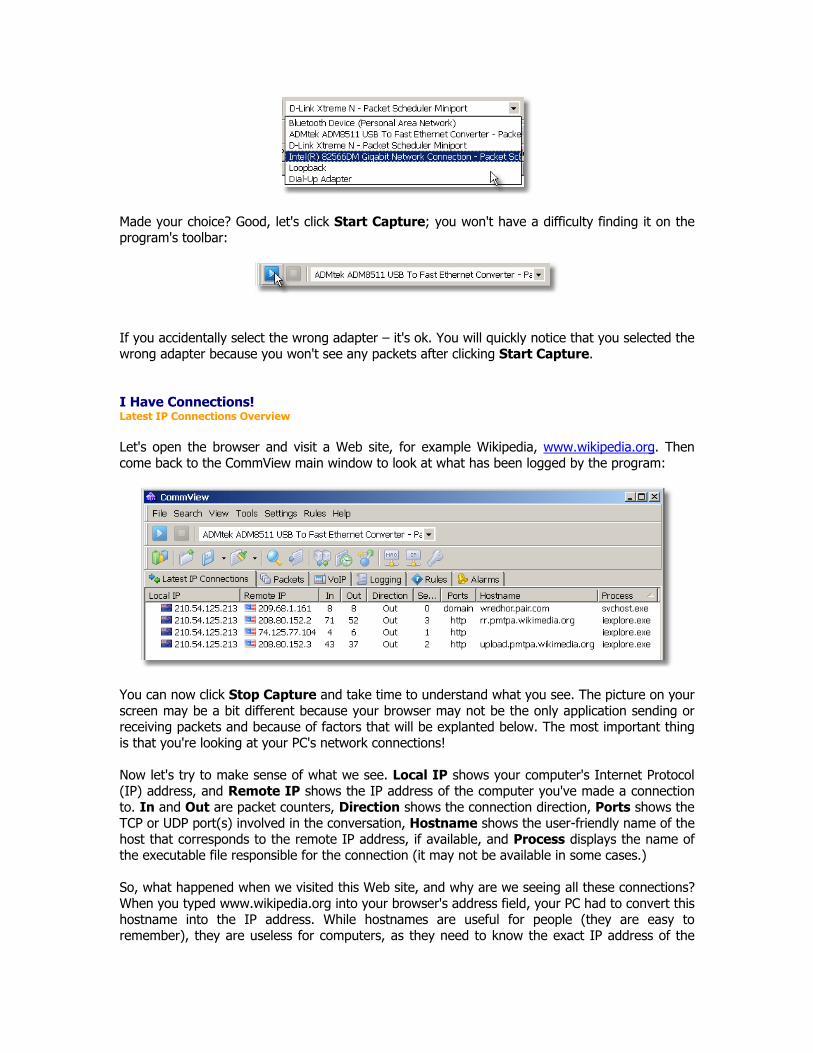
If you accidentally select the wrong adapter – it's ok. You will quickly notice that you selected the wrong adapter because you won't see any packets after clicking Start Capture. I Have Connections! Latest IP Connections Overview Let's open the browser and visit a Web site, for example Wikipedia, www.wikipedia.org. Then come back to the CommView main window to look at what has been logged by the program:
You can now click Stop Capture and take time to understand what you see. The picture on your screen may be a bit different because your browser may not be the only application sending or receiving packets and because of factors that will be explanted below. The most important thing is that you're looking at your PC's network connections! Now let's try to make sense of what we see. Local IP shows your computer's Internet Protocol (IP) address, and Remote IP shows the IP address of the computer you've made a connection to. In and Out are packet counters, Direction shows the connection direction, Ports shows the TCP or UDP port(s) involved in the conversation, Hostname shows the user-friendly name of the host that corresponds to the remote IP address, if available, and Process displays the name of the executable file responsible for the connection (it may not be available in some cases.) So, what happened when we visited this Web site, and why are we seeing all these connections? When you typed www.wikipedia.org into your browser's address field, your PC had to convert this hostname into the IP address. While hostnames are useful for people (they are easy to remember), they are useless for computers, as they need to know the exact IP address of the

other computer to establish a connection. That's why your PC contacted a Domain Name System (DNS) server (wredhor.pair.com in our example, yours will be different) to find out the IP address that corresponds to www.wikipedia.org. How do we know that? Because the Ports column shows domain for this connection, which is a port name used for DNS queries. Now that our PC has learned the IP address for www.wikipedia.org, it immediately establishes a connection with that Web server and downloads the main page that you can see in your Web browser. Http in the Ports column is what tells us that this was a HyperText Transfer Protocol (HTTP) connection. These two connections may be followed by a few others, but we can talk about that later. For now, we've learned that the Latest IP Connections tab displays a snapshot of the current connections. Notice that the IP addresses are accompanied by country flags. This cool feature is called "geolocation." It helps you identify the geographic location of the IP addresses. In our case, as the flags suggest, we're contacting the US-based Wikipedia server from a New Zealand-based PC. If you're not very good at flags, CommView can use country names and two-letter country codes instead; just open the Options window to configure this the way you like it. Making Things Easier Using Aliases and Friendly Port Names Let's face it: Numeric IP addresses are hard to remember. Luckily, you don't have to remember them. Right-click on any of the lines in the Latest IP Connections table and select Create Alias => Using Local IP.
This will bring up a window where you can assign an easy-to-remember alias to any IP address shown by CommView:

Enter any alias name (we chose MyAddress). Close this dialog and…
See, the data looks much more understandable, especially if you're monitoring a LAN segment with dozens of computers. When looking at the connection list, we see that the first connection was a DNS query while the second and fourth ones were HTTP sessions with Wikipedia. Just what we expected? Well, not quite…what's that connection to 74.125.77.104? Why did my PC make it? Let's try to find out. Some Data Mining Finding Out More About Current Connections The reality is that your computer makes more connections than you expect. Common sense tells you that loading a Web page entails just one HTTP session, but that's not always so. First, remember DNS queries? These add at least one connection. If your first DNS server was slow to reply or down, there will be another connection to the second DNS server. Second, many Web sites store Web pages and pictures on two different servers, so when you load a page with graphics, several severs are contacted. There are thousands of reasons why your PC may connect to other computers. Most of these connections are quite legitimate, but it's not uncommon to see an application that sends out sensitive data unbeknownst to you. That might

be a spyware or adware program, or even a commercial product that has certain unadvertised functions. That might be even a Trojan horse that allows someone to control your computer. Well, before getting too scared, we should remember that we have the right tool in our hands. Not a single network packet will enter or leave your computer unnoticed by CommView. In our example, we need to find who is behind the IP address, 74.125.77.104, and why our computer made a connection to it. We can, of course, look at exactly what has been sent using the Packets tab, but we'll do that later on. For now, right-click on the IP address in question and select SmartWhois:
SmartWhois by TamoSoft is a useful network information utility that allows you to find all the available information about an IP address, hostname, or domain, including country, state or province, city, name of the network provider, administrator and technical support contact information. If you haven't tried it, you can download the evaluation version. SmartWhois has many useful features, but in this particular situation we need only one of them: Finding out who owns that IP address. Once you've clicked SmartWhois, you will see the application window with the following information about the IP address in question:

Google? But why Google? We were accessing the Wikipedia Web site! Right. But let's think for a second…your copy of Internet Explorer might be equipped with a nifty little utility called Google Toolbar. And Google Toolbar connects to the Google server to check the popularity rank of the page being visited. We've found the answer. Naturally, your mileage may vary. You may be using a different browser, you may have visited a different Web site for our experiment, you may have a dozen of other network-related applications running in the background, so your Latest IP Connections tab may look different, but we hope that the basic principle is clear: With CommView, you always have the full picture of your network connections, and this is very useful information. Packets, Packets, Packets… Looking at the Captured Packets Now that we've learned about the first tab of the CommView main window, let's move to the second one, Packets. This three-pane tab allows you to see every single packet that passes through your network adapter in any direction. The packet list shows packet summaries and lets you browse the packet list, the data window displays the packet contents, and the decoder tree does just what the name suggests – it decodes packet headers to display every detail. These panes can be aligned in three different ways using this little tool bar:
We didn't include the decoder tree in the illustrations below to make them more compact, but you can always play with the decoder using your copy of CommView. The data being sent across a network is "packetized," i.e. broken down into multiple packets that are each sent individually across the network and then reassembled on the other side. In our example, loading the main page of the Wikipedia Web site involved one packet from our PC to the Web server (the browser had to request the page), and several packets from the Web server to our PC (the Web server had to send the requested page, but since the Web page is about 10,000 bytes in size and the typical packet size is 1,500 bytes, it had to be broken down into about 7 packets). Now, let's select one of the HTTP packets:
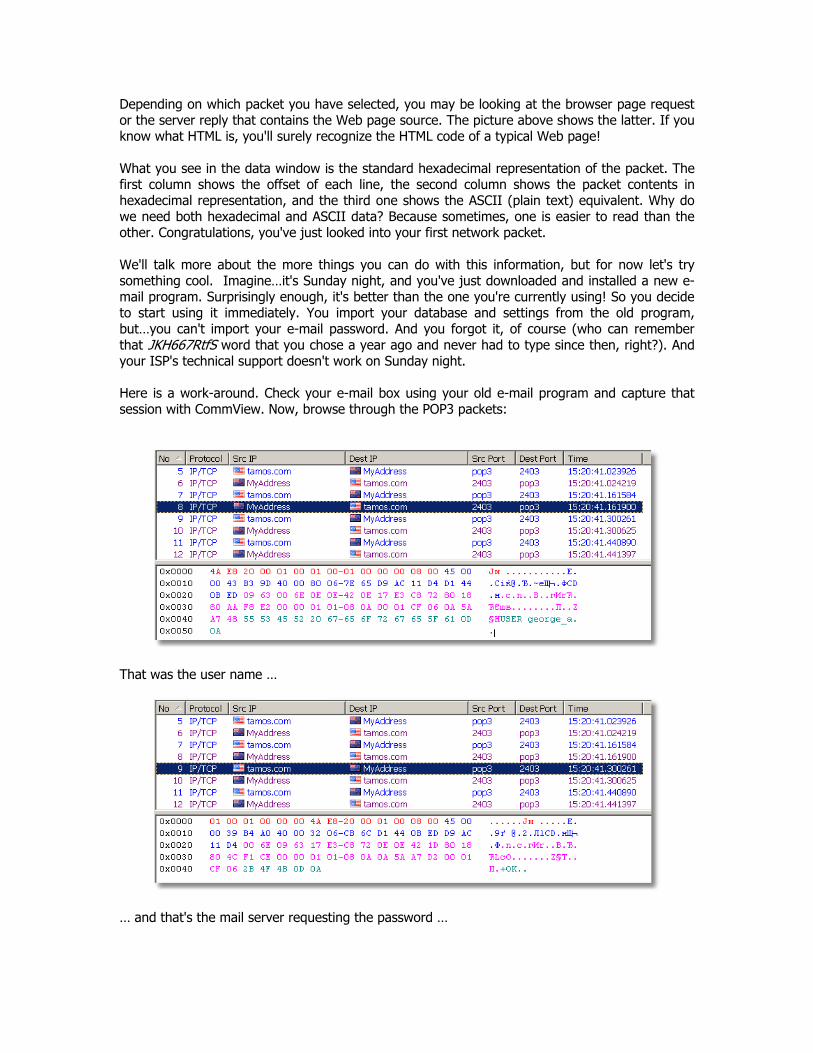
Depending on which packet you have selected, you may be looking at the browser page request or the server reply that contains the Web page source. The picture above shows the latter. If you know what HTML is, you'll surely recognize the HTML code of a typical Web page! What you see in the data window is the standard hexadecimal representation of the packet. The first column shows the offset of each line, the second column shows the packet contents in hexadecimal representation, and the third one shows the ASCII (plain text) equivalent. Why do we need both hexadecimal and ASCII data? Because sometimes, one is easier to read than the other. Congratulations, you've just looked into your first network packet. We'll talk more about the more things you can do with this information, but for now let's try something cool. Imagine…it's Sunday night, and you've just downloaded and installed a new e-mail program. Surprisingly enough, it's better than the one you're currently using! So you decide to start using it immediately. You import your database and settings from the old program, but…you can't import your e-mail password. And you forgot it, of course (who can remember that JKH667RtfS word that you chose a year ago and never had to type since then, right?). And your ISP's technical support doesn't work on Sunday night. Here is a work-around. Check your e-mail box using your old e-mail program and capture that session with CommView. Now, browse through the POP3 packets:
That was the user name …
… and that's the mail server requesting the password …

… and here is the password we were looking for! By the way, if you need to look at the packets related to a particular connection listed on the Latest IP Connections tab, you can do so by simply double-clicking on the line representing that connection. Let's Take a Look at This Session TCP Data Streams We can see the data broken into multiple packets, but is it possible to reassemble TCP sessions? Yes, with CommView this is possible. Select the first packet in a session (for example, the one where the browser requests a page from the Web server), right-click on it, and select Reconstruct TCP Session or simply double-click on the selected line:
There we go, the "conversation" between our PC and the Wikipedia Web server is in front of us, the page request is in blue, and the server's reply is in red:

If you scroll down that window, you will see the full HTML source code of the page that was loaded in the browser. Ok, that was the ASCII (plain text) representation of this session. But the browser doesn't display plain text; it displays nice-looking HTML pages, right? Right, and we can do the same with CommView. Just select HTML in the Display type drop-down list, and the data will be shown as a Web page:

This is fine, but why no pictures? Because pictures are usually transferred in a different TCP session, and sometimes from a different server. By clicking on the >>> button you can navigate to the next TCP session and find pictures (or totally different TCP session, your computer might have already made several connections):

In this example, we used CommView to reconstruct HTTP sessions, but you can use this tool to look at the TCP streams of any nature, be it a POP3 session between your e-mail client and server or FTP download. If you are a networking professional and you'd like to see the TCP session flow as a "ladder" diagram, switch to the Session Analysis tab:

Alarm! An Alarm Function Primer In addition to passive monitoring, CommView can notify you about important network events. That's what the Alarm tab is for. Switch to this tab, check the Enable alarms box, and click Add.
You will see a large alarm setup window with many check boxes and buttons, but don't get scared; we'll do something very basic for starters. Suppose that we want to be notified every

time someone pings our PC or we ping someone's PC. For that, we'll create a new alarm named Ping Alarm that will be triggered once an incoming ICMP packet is received.
CommView has a built-in language that allows you to use a formula to specify an alarm event or capturing rule. The explanation of this language is beyond the scope of this manual, but you can find a detailed description in the Advanced Rules chapter of the help file. For now, just use a "pre-canned" formula: ipproto=icmp and dir=in In human language, this means that we're interested in any incoming ICMP packets (because ping uses the ICMP protocol). In the Even occurrences frame we can specify how many times we want CommView to alert us before deactivating the alarm. We chose ten. Finally, we should choose a method by which CommView will notify us. How about a pop-up window? Good, we're checking the Display message box and entering the following text: Ouch, someone from %SIP% is pinging me! What's "%SIP%"? This will be replaced by the actual IP address of the computer that pinged you (SIP = Source IP Address). You don't necessarily have to use such a placeholder, but it's nice to know who is pinging you. The Alarms chapter of the help file will tell you more about the syntax of alarm messages. We'll also check the Pronounce message box to receive an audible alarm. Ok, we're all set. Click OK to close the alarm setup box, and we're ready for the test. Don't forget to start capturing and go to a Web site that allows you to ping an IP address, for example, this

one: http://www.all-nettools.com/toolbox. Enter your IP address in the Ping tool field, and click "Go!" In a few seconds CommView will notify you about this incoming ping packet:
Additionally, your computer's text-to-speech engine will actually pronounce, "Look at the screen" using your headset or PC speaker with a pleasant (ok, ok, not so pleasant) robotic voice. A pop-up window and audible alarm are only two of the possible ways of notification. You can have CommView send an e-mail message to your box, launch an application, and so on. How Is My Connection Doing? Watching Network Utilization It's time to look at the Statistics window, which gives you a wealth of statistical information on the network status. You can invoke this window by clicking this tool bar button: . Then select the General tab to check how your network connection is doing.

These graphs show you real-time information on packets and bytes transferred over your network. Why is this important for many users? If you are on a LAN, these are important indicators of your LAN segment health. If the network utilization in your segment is too high, it's a good reason to investigate the situation, find traffic hogs, or upgrade your hardware. If you have a broadband connection at home, these graphs will let you see the actual data transfer rate and compare it to the officially advertised numbers. You can also check download speeds or monitor traffic volume, although if you need an application especially designed for traffic accounting, you may want to check out CommTraffic by TamoSoft. The Protocols My Network Speaks Protocol Charts Curious about what applications use up your bandwidth? Switch to the IP Sub-protocols tab and take a look:
This pie chart lets you quickly identify the protocols "spoken" on your network. Too much SMTP traffic? Your PC or other computers in your LAN segment send a high volume of e-mail correspondence. Too much FTP traffic? Perhaps because of many software downloads. While the chart displays only the most popular protocols by default, you can always click Customize and enter a new protocol and port number, for example, to have information on a popular peer-to-peer client or chat program.

Who Is Talking on My LAN? Identifying Traffic Hogs Now that we've learned about the protocols, we may want to learn about the top talkers by looking at the Hosts (By MAC) tab. If your computer is not a part of a LAN, you won't see much useful information in this table, but if you monitor a LAN segment being connected to the monitoring port of a switch (or a good old hub), you can quickly identify traffic hogs or the stations responsible for "broadcast storms."
As you probably know, a network analyzer puts your card in so-called "promiscuous mode," which allows you to capture not only the packets addressed to your machine, but also all other packets being sent or received in your LAN segment. Note that some of the entries in the first column are MAC addresses, while others are user-friendly names. Remember how we assigned aliases to IP addresses in one of the previous chapters? You can do the same with MAC addresses, just right-click on any of them and select Aliases to assign or edit an alias. Another way of looking at the nodes that are active in your LAN segment is through the Matrix tab. This tab is a peer map that displays the traffic flow between different hosts. Using the matrix, you can immediately see who is talking to whom:

Raise Your Voice Using the VoIP Analysis Module Those network engineers who deal with the deployment and management of IP telephony networks know how instrumental a network analyzer may be for troubleshooting and monitoring VoIP. CommView comes to rescue with its VoIP analysis engine for SIP and H.323 protocols. VoIP analysis is a topic that goes far beyond the scope of this brief manual, but we thought it important to mention this functionality.

Using CommView, you can analyze signaling sessions and RTP streams in real time, watch the charts and diagrams to understand the quality problems that may affect your VoIP network (packet loss, jitter, or sequence errors), monitor MoS and R-factor for every call, and even listed to the actual calls. Yes, CommView can record and play back them for you. Focusing on the Essentials Using Advanced Filters Exploring the network traffic may be difficult if the useful pieces of information are buried under countless unimportant connections and packets. If you are trying to focus on, say, troubleshooting an e-mail session, you probably don't want CommView to capture and display a few thousand packets related to a whole different FTP download that is going on simultaneously, probably not even on your own PC. The good news is that a good network analyzer allows you to use capturing rules (often called "filters"). By applying rules, you can filter out unimportant packets to focus on the essential ones. The Rules tab is the place where you can mange your capturing rules, and the Advanced Rules tab allows you to create very flexible formula-based filters:

You are free to use other types of rules (Ports, Text, etc.), but the Advanced rules offer much more flexibility, so we'll use this type of rule in our example. To create a new rule, you need to first enter an arbitrary name in the Name field and then select the rule type: Capture or Ignore. The former will make CommView display only those packets that match your formula, while the latter will make CommView display all the captured packets except those ones that match your formula. Finally, you need to enter a formula describing your packet. Suppose that we want to capture HTTP traffic only. As we mentioned above, the Advanced Rules chapter of the help file provides detailed information on the formulae syntax. In this example, we're going to use an intuitively understandable formula to save time: ipproto=tcp and (sport=80 or dport=80) In human language, this means that we're interested in TCP packets going to or coming from port 80, i.e. the port used for HTTP connections. Now click Add/Edit and we're done! CommView will display only HTTP packets until you disable this rule by clicking on the check box next to its name. It’s as simple as that. Oh…and you can save rules to a file and load them from a file by using the Rules menu on the main window. Moving On We hope that this tutorial helped you to better understand this great tool that you have purchased or are planning to purchase. This tutorial is by no means a comprehensive manual. We just wanted to show that packet sniffing is fun, especially with CommView! As you learn more about its functionality, network analysis and protocol decoding tasks will become easier to deal with. If you are into wireless networking, be sure not to miss out on the special wireless edition of this product, CommView for WiFi.

Visit us today at www.tamos.com for more information, excellent technical support, instant online ordering, and more!