Embed Size (px)
Citation preview
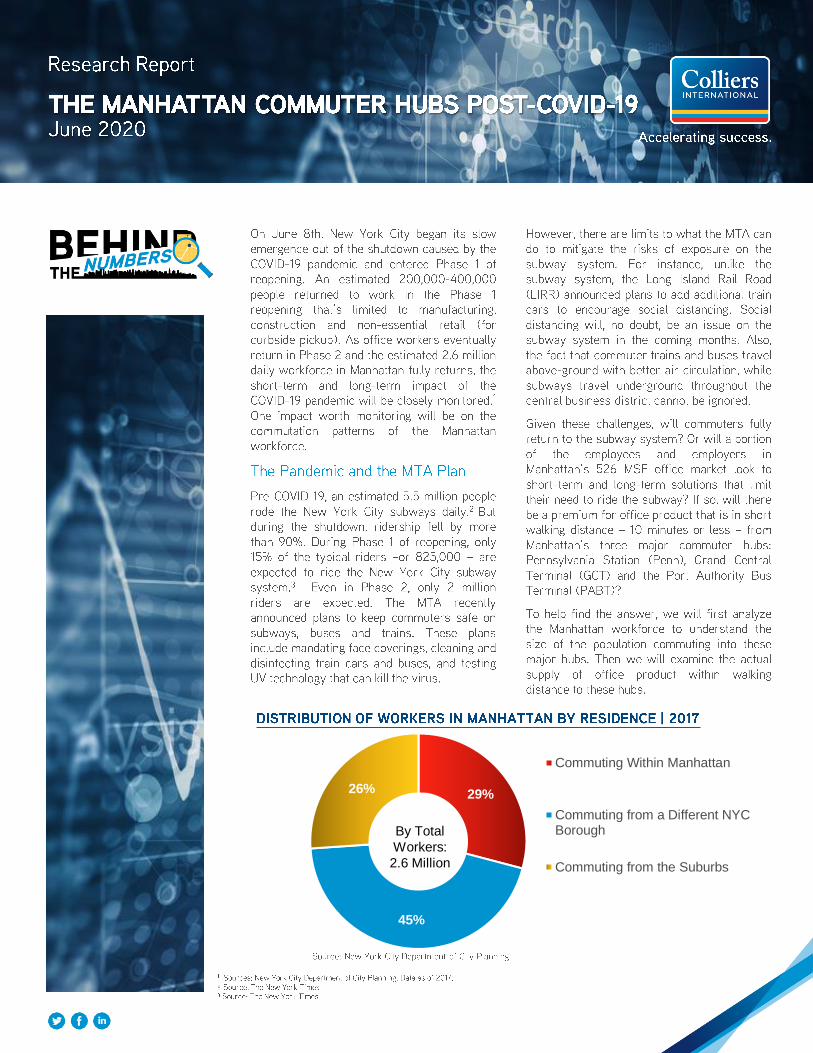
29%
45%
26%
Commuting Within Manhattan
Commuting from a Different NYCBorough
Commuting from the Suburbs
By Total
Workers:
2.6 Million
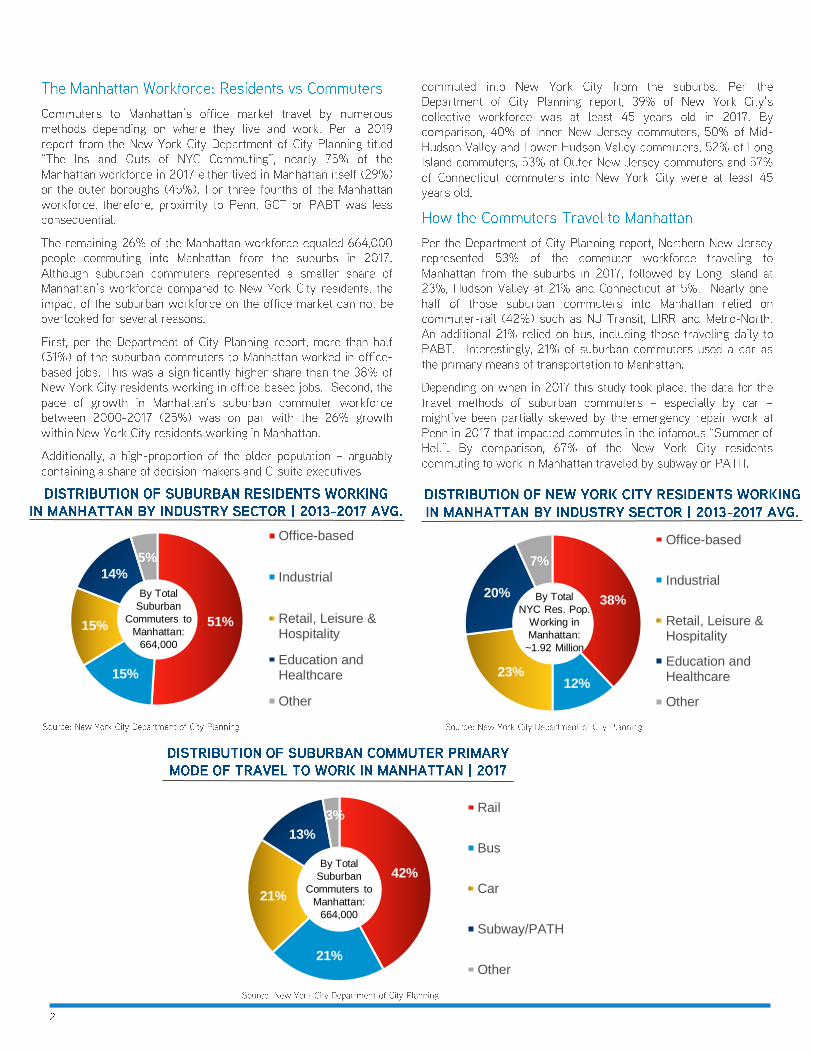
51%
15%
15%
14%
5%
Office-based
Industrial
Retail, Leisure &Hospitality
Education andHealthcare
Other
By Total
Suburban
Commuters to
Manhattan:
664,000
38%
12%23%
20%
7%
Office-based
Industrial
Retail, Leisure &Hospitality
Education andHealthcare
Other
By Total
NYC Res. Pop.
Working in
Manhattan:
~1.92 Million
42%
21%
21%
13%
3%Rail
Bus
Car
Subway/PATH
Other
By Total
Suburban
Commuters to
Manhattan:
664,000
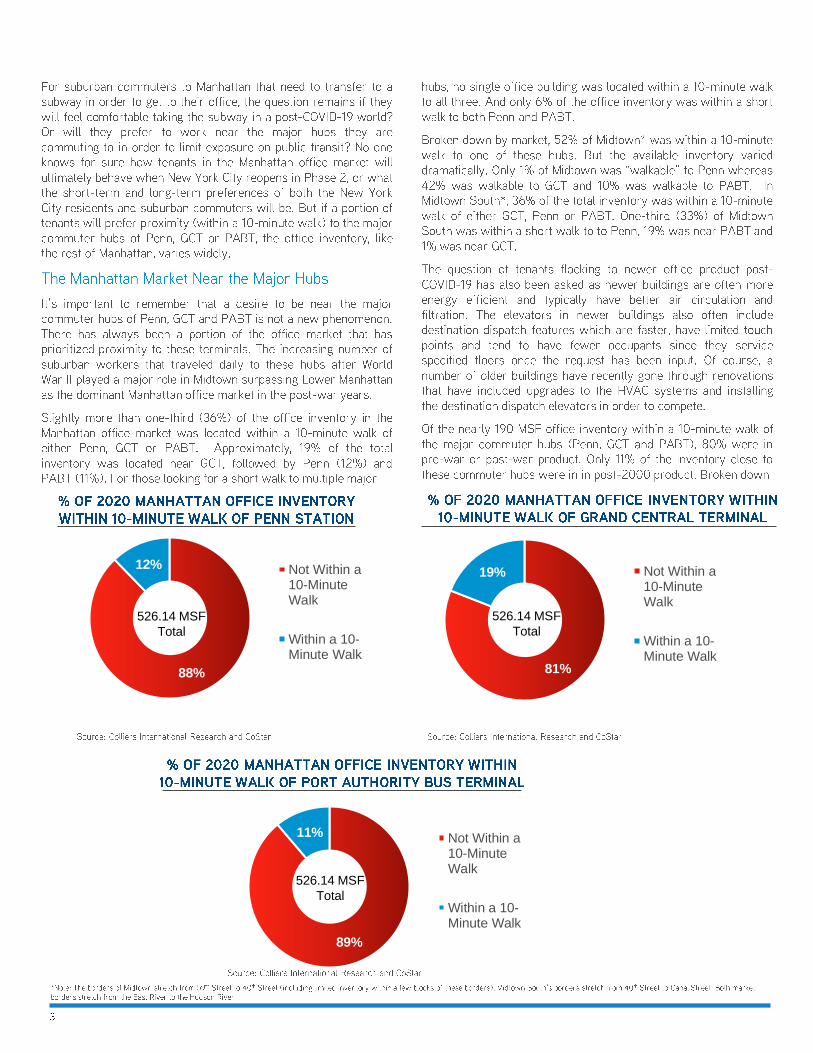
88%
12% Not Within a10-MinuteWalk
Within a 10-Minute Walk
526.14 MSF
Total
81%
19% Not Within a10-MinuteWalk
Within a 10-Minute Walk
526.14 MSF
Total
89%
11% Not Within a10-MinuteWalk
Within a 10-Minute Walk
526.14 MSF
Total
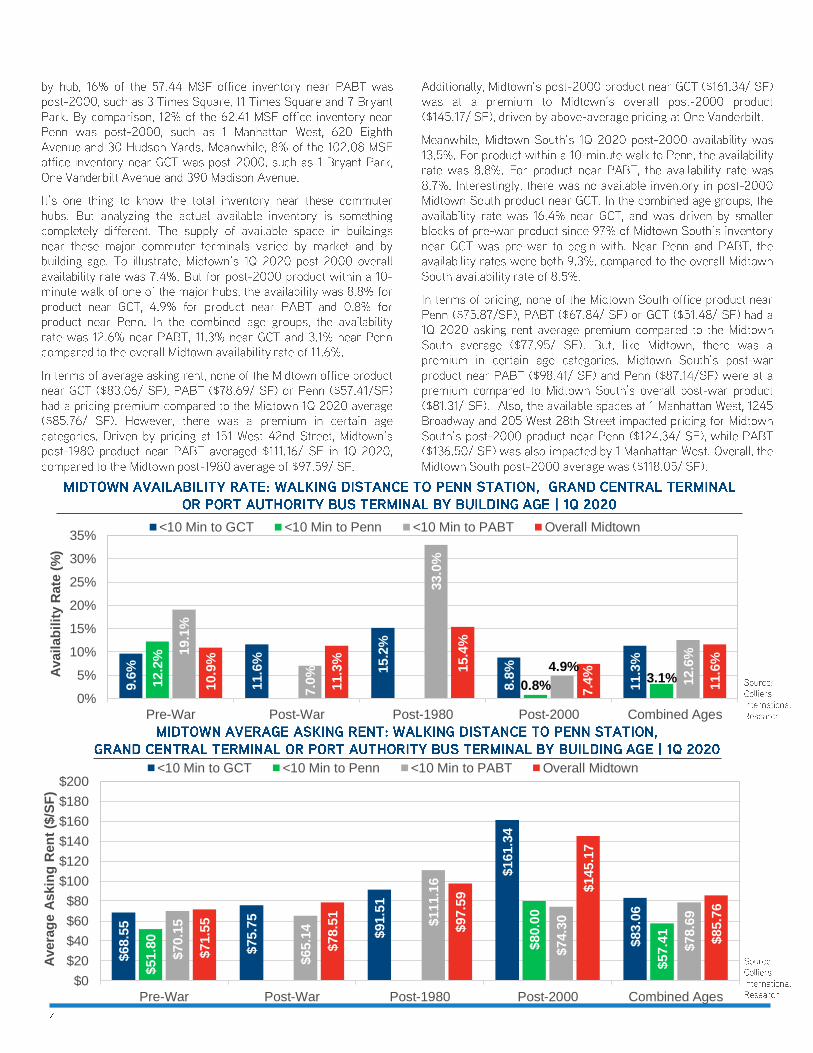
9.6
%
11.6
%
15.2
%
8.8
%
11.3
%
12.2
%
0.8%3.1%
19.1
%
7.0
%
33.0
%
4.9%
12.6
%
10.9
%
11.3
%
15.4
%
7.4
%
11.6
%
0%
5%
10%
15%
20%
25%
30%
35%
Pre-War Post-War Post-1980 Post-2000 Combined Ages
Avail
ab
ilit
y R
ate
(%
)
<10 Min to GCT <10 Min to Penn <10 Min to PABT Overall Midtown
$68.5
5
$75.7
5
$91.5
1
$161.3
4
$83.0
6
$51.8
0
$80.0
0
$57.4
1
$70.1
5
$65.1
4 $111.1
6
$74.3
0
$78.6
9
$71.5
5
$78.5
1
$97.5
9 $145.1
7
$85.7
6
$0
$20
$40
$60
$80
$100
$120
$140
$160
$180
$200
Pre-War Post-War Post-1980 Post-2000 Combined Ages
Avera
ge A
skin
g R
en
t ($
/SF
)
<10 Min to GCT <10 Min to Penn <10 Min to PABT Overall Midtown
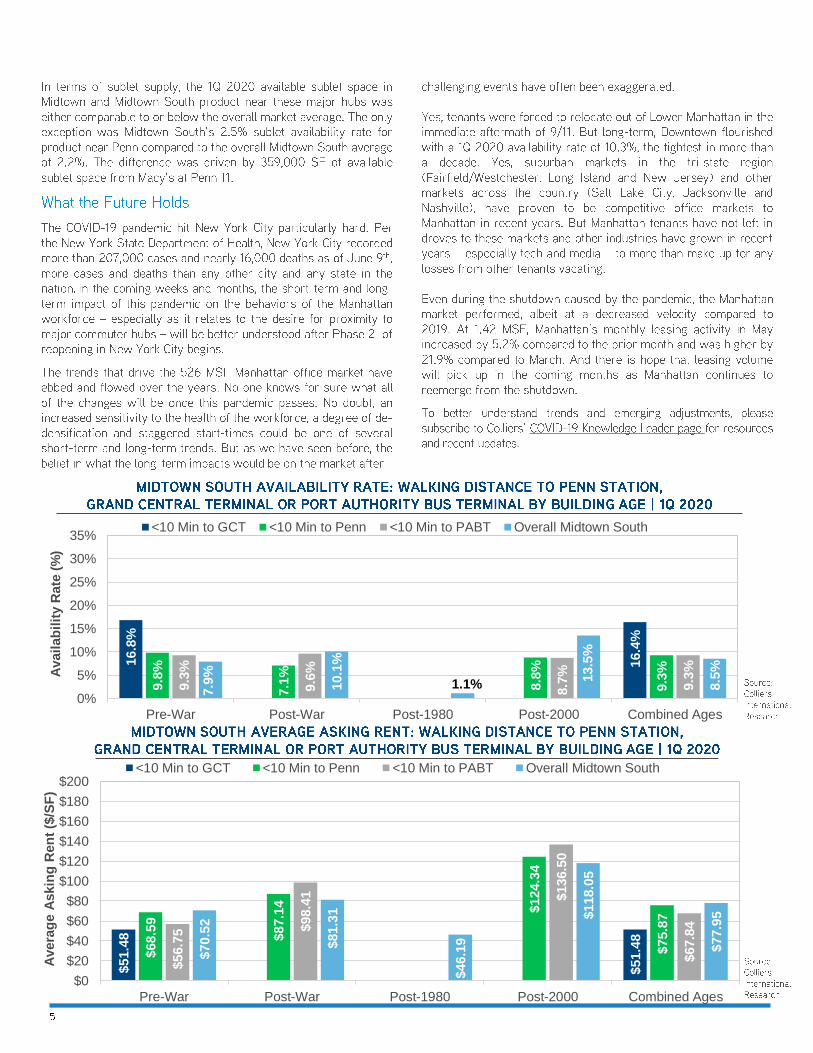
16.8
%
16.4
%
9.8
%
7.1
%
8.8
%
9.3
%
9.3
%
9.6
%
8.7
%
9.3
%
7.9
%
10.1
%
1.1%
13.5
%
8.5
%
0%
5%
10%
15%
20%
25%
30%
35%
Pre-War Post-War Post-1980 Post-2000 Combined Ages
Avail
ab
ilit
y R
ate
(%
)
<10 Min to GCT <10 Min to Penn <10 Min to PABT Overall Midtown South
$51.4
8
$51.4
8
$68.5
9
$87.1
4
$124.3
4
$75.8
7
$56.7
5 $98.4
1
$136.5
0
$67.8
4
$70.5
2
$81.3
1
$46.1
9
$118.0
5
$77.9
5
$0
$20
$40
$60
$80
$100
$120
$140
$160
$180
$200
Pre-War Post-War Post-1980 Post-2000 Combined Ages
Avera
ge A
skin
g R
en
t ($
/SF
)
<10 Min to GCT <10 Min to Penn <10 Min to PABT Overall Midtown South
$3.0billion in annual revenue
$33billion in assets under management
Colliers’ statistical sample set for Manhattan totals 526 MSF and includes all commercial office properties with at least 25,000 SF of office space, from 59th Street to the Battery and river to river. Colliers’ availability rate includes only office space scheduled for tenant build-out within 12 months. In tracking leasing activity, Colliers includes all lease types: renewals, expansions, relocations, and the occasional sale-leaseback.
Copyright © 2020 Colliers International.
In the midst of the COVID-19 outbreak, information and data is emerging at a quick and uneven rate. The information contained herein has been obtained from sources deemed reliable at the time the report was written. While every reasonable effort has beenmade to ensure its accuracy, we cannot guarantee it. No responsibility is assumed for any inaccuracies. Readers are encouraged to consult their professional advisors prior to acting on any of the material contained in this report.