Embed Size (px)
Citation preview
The Neighborhoods of Manhattan Community District 3A Demographic Perspective
TM
Presentation for the New York University Langone Medical CenterCommunity Service Plan Coordinating Council
September 16, 2014Joseph Salvo
Peter LoboPOPULATION DIVISION
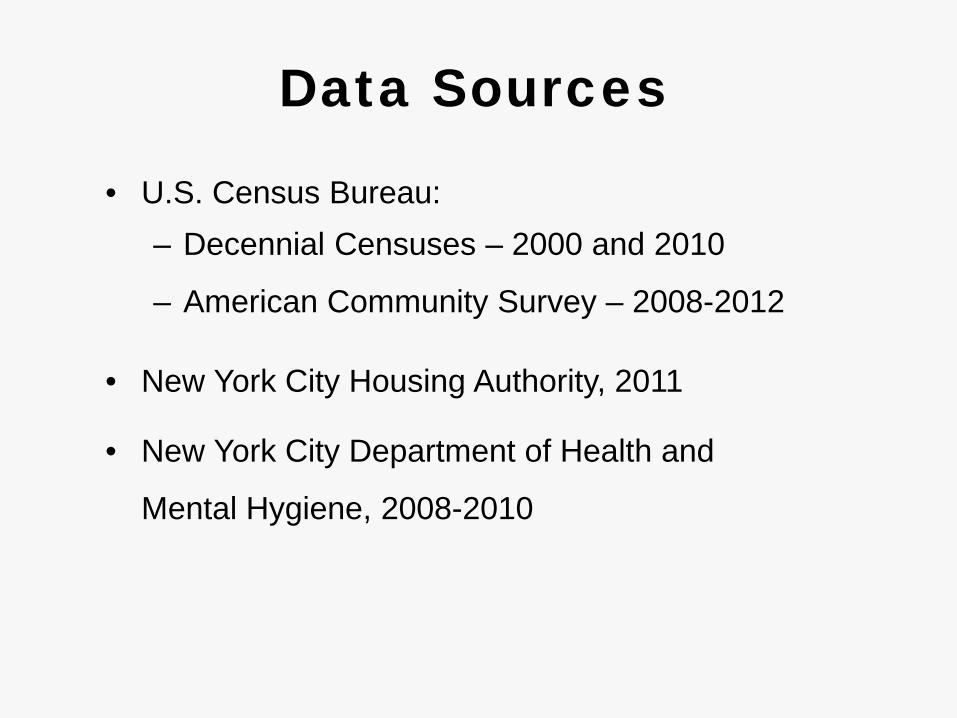
Data Sources
• U.S. Census Bureau:– Decennial Censuses – 2000 and 2010
– American Community Survey – 2008-2012
• New York City Housing Authority, 2011
• New York City Department of Health and
Mental Hygiene, 2008-2010
Source: Population Division-New York City Department of City Planning
Manhattan
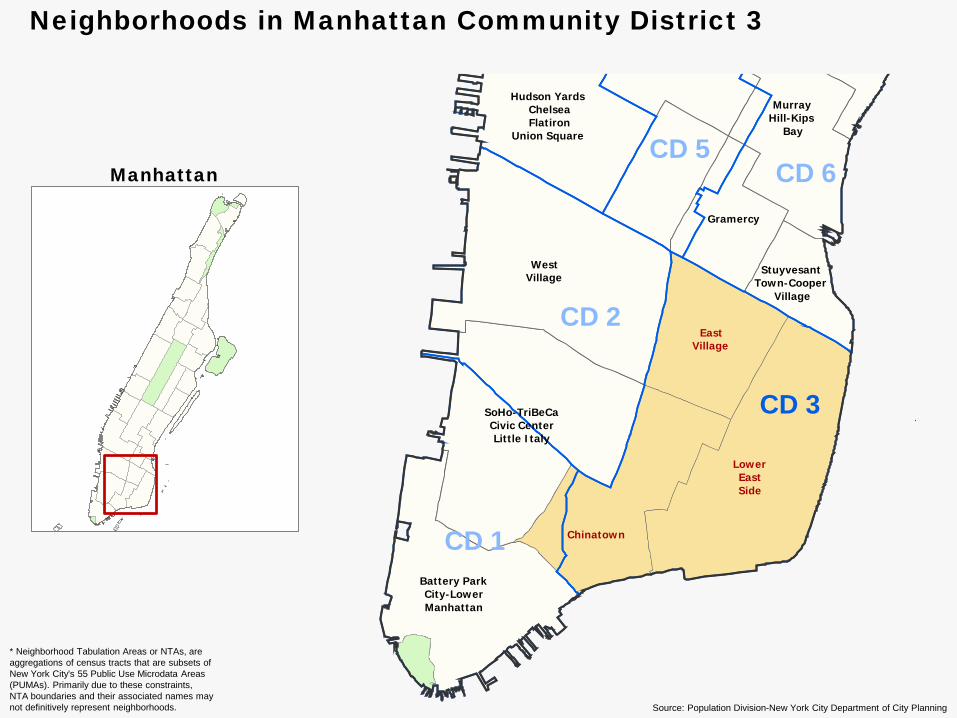
* Neighborhood Tabulation Areas or NTAs, are aggregations of census tracts that are subsets of New York City's 55 Public Use Microdata Areas (PUMAs). Primarily due to these constraints, NTA boundaries and their associated names may not definitively represent neighborhoods.
CD 1
CD 3
Hudson YardsChelseaFlatiron
Union Square
Gramercy
StuyvesantTown-Cooper
Village
Battery ParkCity-LowerManhattan
Midtown-MidtownSouthTurtle
Bay-EastMidtown
MurrayHill-Kips
Bay
SoHo-TriBeCaCivic CenterLittle Italy
WestVillage
CD 2East
Village
Chinatown
LowerEastSide
CD 4
CD 5CD 6
Neighborhoods in Manhattan Community District 3
STANTON STREET
BARUCH
DRIVE
EAST BROADWAY
WILLIAMSBURGBR APPROACH
PRINCESTREET
CHERRY
STREET
PELLSTREET
SPRINGSTREET
EAST 2 STREET
BLEECKERSTREET
DIVISION STREETC
ATH
ER
INE
STR
EE
T
RIVINGTON STREET
PEDESTRIAN
OVERPASSBROOKLYN BRIDGE
AVEN
UE D
MA
NH
ATTAN
BRID
GE
EAST 3 STREET
EAST HOUSTON STREET
PARK ROW
BAR
UC
HPL
ACE
AVEN
UE B
NO
RFO
LKST
REE
T
AVEN
UE A
AVEN
UE C
PIK
E S
TRE
ET
FDR
DR
IVE
EXIT
4 S
OU
THBO
UN
D
WILLIAMSBURG BRIDGE
NASS
AUST
REET
LINE
EAST RIVER ESPLANADE
BOW
ERY
BROOKLYN BRDG
PED AND BIKE PATH
OLIVE
R
STREET
WATER STREETUNNAMED
STREET
FDR
DR
IVE
SB
EN
TRA
NC
EG
RA
ND
ST
DOYERS
STREET
BIAL
YST
OK
ER P
LAC
E
PITT
STR
EET
NY MARBLE
CEMETERY
BOUNDARY
MO
TTST
REE
T
PIK
ES
LIP
LEW
IS S
TREE
T
LUD
LOW
STR
EET
HOGANPLACE
STUYVESANT
STREET
BAXT
ERST
REE
T
E 6
STR-
E RI
VER
PAR
K PE
D O
VPS
PE
AR
L S
TRE
ET
FDR DRIVE NB
EN BROOKLYN
BRDG
MARBLECEMETERYBOUNDARY
HO
UST
ON
/ESS
EXST
REE
T LI
NE
ESSE
X ST
REE
TALLE
N S
TREE
T
WORTH STREET
EAST
10
STR
EET
PED
ESTR
IAN
OVP
S
6 AV
ENU
E LI
NE
LAFA
YETT
ECO
URT
1 AVE
NUE
DELANCEY STREET
2 AVE
NUE
3 AVE
NUE
WILLIAMSBURG BR
BIKE AND PED PTH
EAST 6 STREET
RU
TGE
RS
STR
EE
T
CONNECTOR
BRO
OKLYN
BRID
GE
APPRO
ACH
DISTRICT
BOUNDARY
ATTO
RN
EY
STR
EET
MA
RK
ET
SLIP
EAST 7 STREET
SOUTH STREET
EXTR
APL
ACE
JEFFE
RS
ON
ST
RE
ET
FDR
DR
IVE
SB
EN
TRA
NC
EE
14
ST
OR
CH
ARD
STR
EET
EAST 11 STREET
1990
CT
BOUNDARY
MU
LBER
RY
STR
EET
GO
UV
ER
NE
UR
SLIP
EA
ST
GO
UV
ER
NE
UR
SLIP W
ES
T
EAST 9 STREET
EAST 8STREET
F D R DRIVE
MA
NH
ATTA
N
BR
IDG
E
BIK
E PAT
H
MA
NH
ATTAN
BR APPR
OA
CH
CAN
NO
NST
REE
T
EAST 12 STREET
EAST
RIV
ERSH
OR
ELIN
EW
EST
2000
CB
BOU
ND
ARY
FREE
MAN
ALL
EY
CO
LUM
BIA
STR
EET
GRAND STREET
BIKEPATH
BROOME STREET
RID
GE
STR
EET
MOSCOSTREET
CENT
RE S
TREE
T
CLIN
TON
STR
EE
T
HESTER STREET
HENRY STREET
EAST 5WALK
TARA
S
SHEV
CHEN
KO P
LACE
MA
RK
ET S
TR
EE
T
CANAL STREET
SZO
LD P
LACE
BAYARD STREET
JAMAICA LINE
WALKERSTREET
SUFF
OLK
STR
EET
ASTORPLACE
EAST 1 STREET
EAST 4 WALK
GO
UV
ER
NE
UR
STR
EE
T
MO
NT
GO
ME
RY
STR
EE
T
MANHATTANBRIDGE LINE
JAC
KS
ON
STR
EE
T
4 AV
EN
UE
JAM
ES
STR
EE
T
ME
CH
ANIC
S
ALLEY
LILLIAN
WALD DRIVE
LEX
ING
TON
AVE
NU
E L
INE
WHITESTREET
SAM
UEL
DIC
KSTE
INPL
AZA
CO
OP
ER
SQ
UA
RE
ST JA
MESPLA
CE
HAMILL
PLACE
MONROE
STREETBROOKLYN
BRIDGE EXIT RAMP
FDR
DR
IVE
EXIT
5 N
OR
THBO
UN
D
MADISONSTREET
ABR
AHAM
KAZA
NST
REE
T
EAST 14 STREET14 STREET/CANARSIE LINE
2010 CB
BO
UN
DA
RY
CT
BOU
ND
ARY
SHER
IFF
STR
EET
MA
NG
INST
REE
T
ALLEY
RU
TGE
RS
SLIP
ELD
RID
GE
STR
EET
EAST 10 STREET
CH
RYS
TIE
STR
EET
FOR
SYTH
STR
EET
ELIZ
ABET
HST
REE
T
CARDINAL
HAYES
PLACE
AVENUE
OF THE
FINEST
EAST 4 STREET
EAST 13 STREET
ST MARKS PLACE
EAST 5 STREETP
ED
ES
TRIA
N PATH
FDR
DR
IVE
NB
EN
E H
OU
STO
N S
T
La Guardia
Two BridgesUra (Site 7)
Vladeck IIVladeck
Rutgers
Baruch
LavanburgHomes
Seward ParkExtension
45 AllenStreet
Lower EastSide IInfill Wald
StantonStreet
Gompers
Jacob RIIS
Governor Alfred E. Smith
Lower EastSide II
East 4ThStreetRehab
BracettiPlaza
Lower EastSide III
Lower EastSide Rehab(Group 5)
Plaza IIPlaza I
FirstHouses
MeltzerTower
Hernandez
Seward ParkExtension
Jacob RIIS
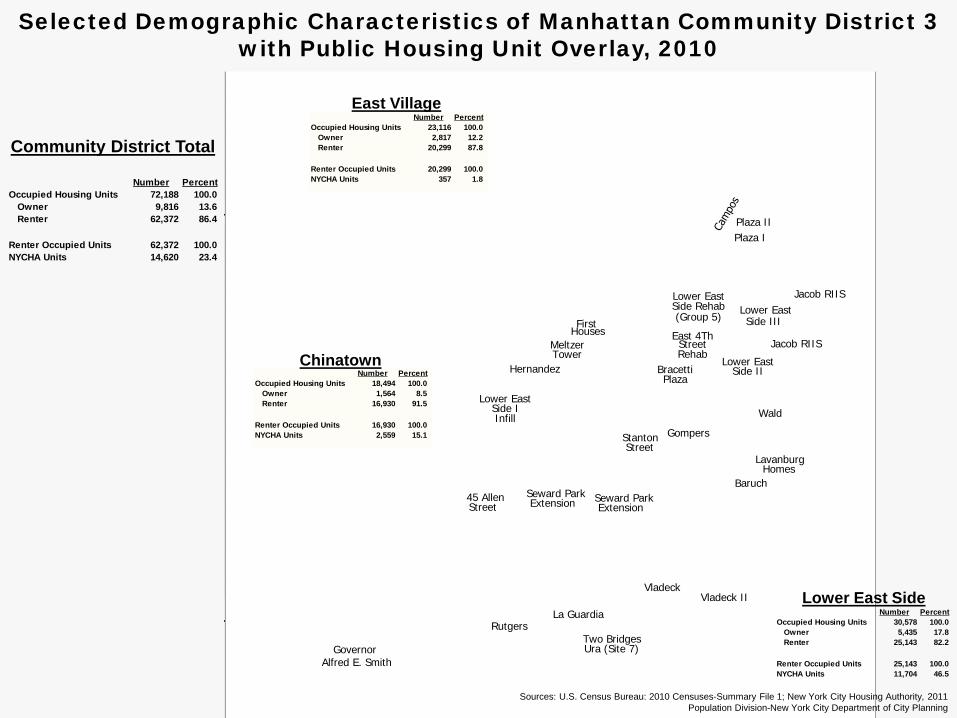
Number PercentOccupied Housing Units 23,116 100.0
Owner 2,817 12.2Renter 20,299 87.8
Renter Occupied Units 20,299 100.0NYCHA Units 357 1.8
Number PercentOccupied Housing Units 18,494 100.0
Owner 1,564 8.5Renter 16,930 91.5
Renter Occupied Units 16,930 100.0NYCHA Units 2,559 15.1
Number PercentOccupied Housing Units 30,578 100.0
Owner 5,435 17.8Renter 25,143 82.2
Renter Occupied Units 25,143 100.0NYCHA Units 11,704 46.5
Number PercentOccupied Housing Units 72,188 100.0
Owner 9,816 13.6Renter 62,372 86.4
Renter Occupied Units 62,372 100.0NYCHA Units 14,620 23.4
Community District Total
Lower East Side
Chinatown
East Village
Selected Demographic Characteristics of Manhattan Community District 3with Public Housing Unit Overlay, 2010
Sources: U.S. Census Bureau: 2010 Censuses-Summary File 1; New York City Housing Authority, 2011Population Division-New York City Department of City Planning

Percent Percent Average MedianTotal Sex Median Under 65 Years Household Household Poverty
Population Ratio Age 18 Years and over Size Income Rate
New York City 8,175,133 90 35.5 21.6 12.1 2.57 $51,865 26.8 Manhattan 1,585,873 88 36.4 14.8 13.5 1.99 $68,370 19.9
Manhattan CD 3 164,937 92 36.4 13.4 14.4 2.15 $41,596 25.7 East Village 44,136 96 31.3 5.5 9.1 1.67 $67,861 16.3 Lower East Side 72,957 85 39.1 18.1 16.4 2.32 $30,817 28.3 Chinatown 47,844 101 39.4 13.6 16.1 2.46 $33,712 29.7
Income and Poverty
Selected Demographic Characteristics Manhattan Community District 3, 2010 and 2008-2012
Sources: U.S. Census Bureau, 2010 Census-Summary File 1; 2008-2012 American Community Survey-Summary FilePopulation Division-New York City Department of City Planning
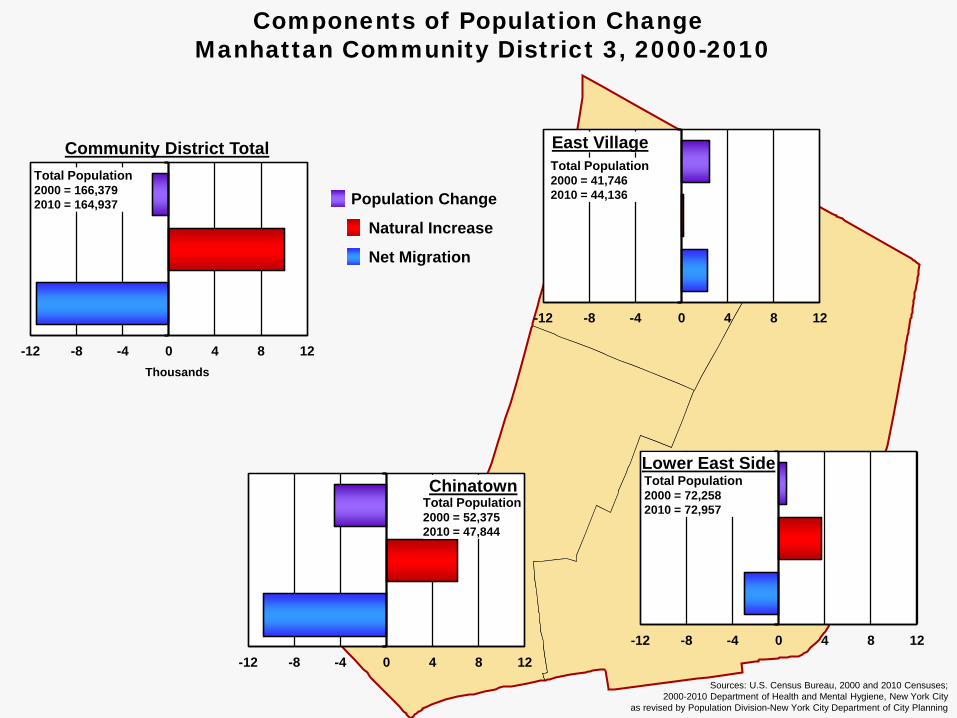
-12 -8 -4 0 4 8 12
-12 -8 -4 0 4 8 12
Components of Population ChangeManhattan Community District 3, 2000-2010
Community District Total
Thousands
-12 -8 -4 0 4 8 12
East Village
Lower East Side
-12 -8 -4 0 4 8 12Sources: U.S. Census Bureau, 2000 and 2010 Censuses;
2000‐2010 Department of Health and Mental Hygiene, New York City as revised by Population Division-New York City Department of City Planning
Total Population 2000 = 166,379 2010 = 164,937
Total Population2000 = 41,7462010 = 44,136
Total Population2000 = 72,2582010 = 72,957 Total Population
2000 = 52,3752010 = 47,844
Chinatown
Population Change
Natural Increase
Net Migration
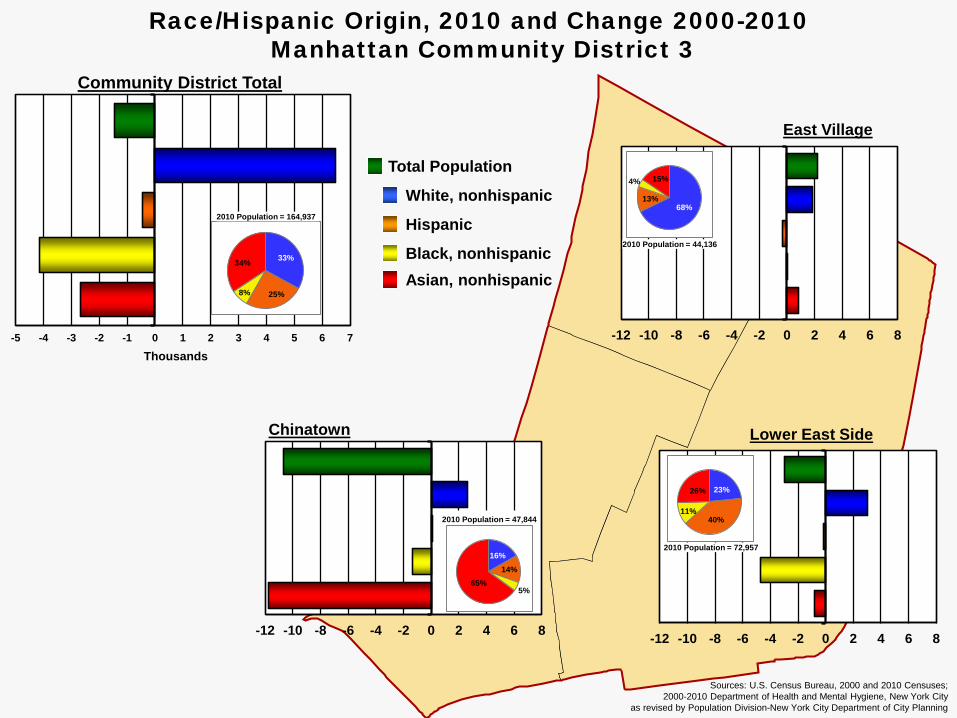
-5 -4 -3 -2 -1 0 1 2 3 4 5 6 7
Race/Hispanic Origin, 2010 and Change 2000-2010Manhattan Community District 3
-12 -10 -8 -6 -4 -2 0 2 4 6 8
-12 -10 -8 -6 -4 -2 0 2 4 6 8
-12 -10 -8 -6 -4 -2 0 2 4 6 8
Sources: U.S. Census Bureau, 2000 and 2010 Censuses; 2000‐2010 Department of Health and Mental Hygiene, New York City
as revised by Population Division-New York City Department of City Planning
Thousands
Community District Total
Chinatown
33%
25%8%
34%
68%13%
4% 15%
East Village
2010 Population = 164,937
2010 Population = 44,136
2010 Population = 72,957
2010 Population = 47,844
16%14%
5%65%
23%
40%11%
26%
Lower East Side
Black, nonhispanicAsian, nonhispanic
Total Population
White, nonhispanic
Hispanic
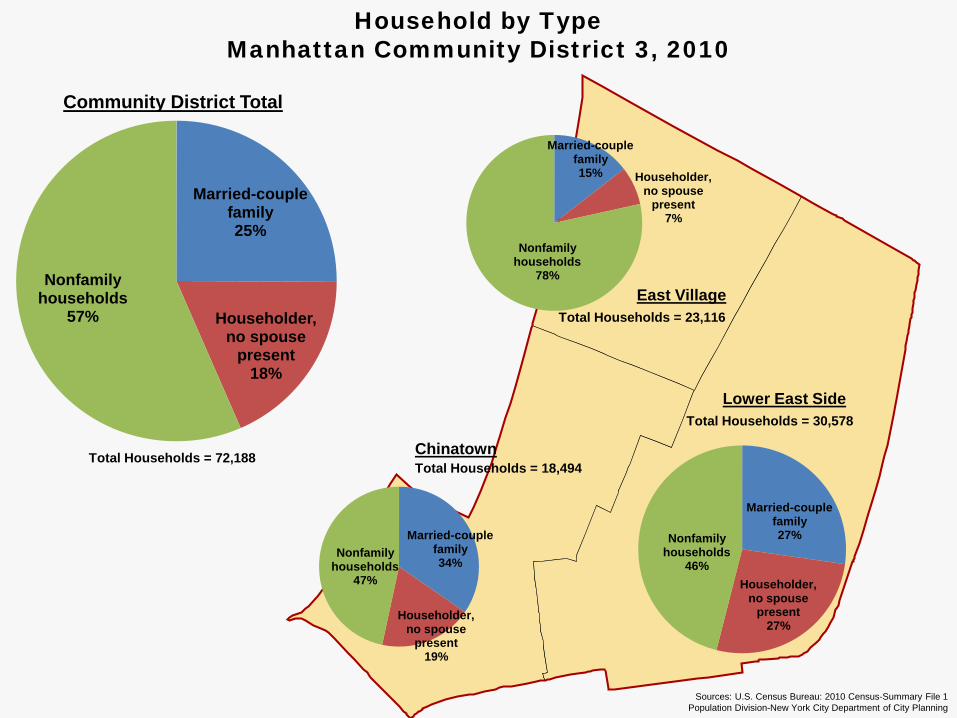
Household by TypeManhattan Community District 3, 2010
Sources: U.S. Census Bureau: 2010 Census-Summary File 1Population Division-New York City Department of City Planning
Married-couple family25%
Householder, no spouse
present18%
Nonfamily households
57%
Community District Total
Total Households = 72,188
Married-couple family15% Householder,
no spouse present
7%
Nonfamily households
78%
East VillageTotal Households = 23,116
Married-couple family27%
Householder, no spouse
present27%
Nonfamily households
46%
Lower East SideTotal Households = 30,578
Married-couple family34%
Householder, no spouse
present19%
Nonfamily households
47%
ChinatownTotal Households = 18,494
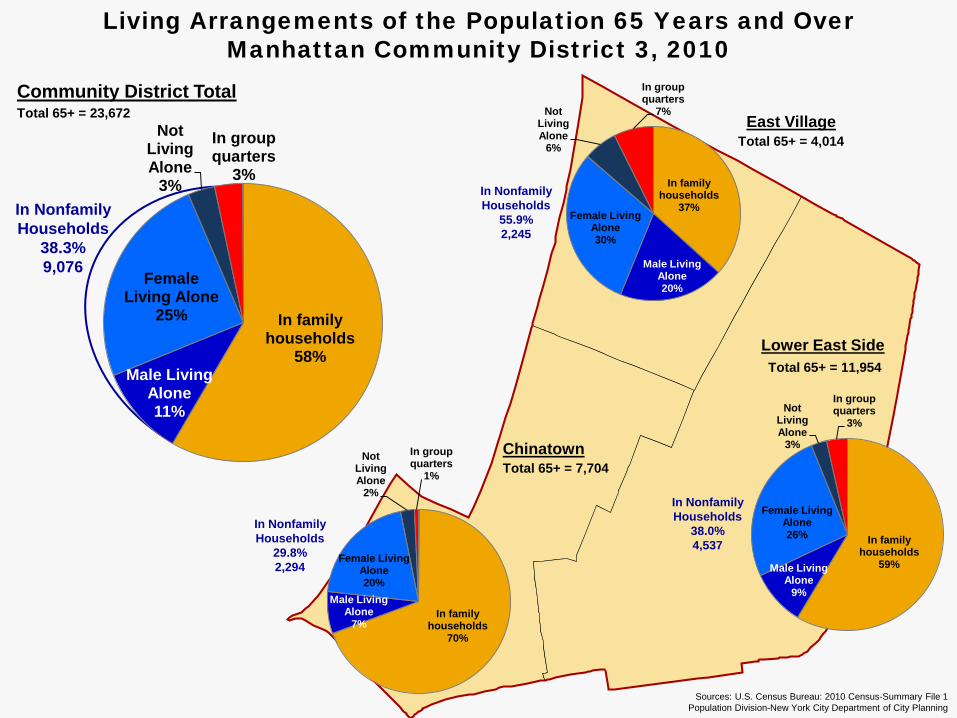
In family households
58%Male Living
Alone11%
Female Living Alone
25%
NotLivingAlone
3%
In groupquarters
3%
In family households
70%
Male Living Alone
7%
Female Living Alone20%
NotLivingAlone
2%
In groupquarters
1%
In family households
59%Male Living Alone
9%
Female Living Alone26%
NotLivingAlone
3%
In groupquarters
3%
Community District TotalTotal 65+ = 23,672
ChinatownTotal 65+ = 7,704
East VillageTotal 65+ = 4,014
Living Arrangements of the Population 65 Years and OverManhattan Community District 3, 2010
Sources: U.S. Census Bureau: 2010 Census-Summary File 1Population Division-New York City Department of City Planning
In Nonfamily Households
38.3%9,076
In family households
37%
Male Living Alone20%
Female Living Alone30%
NotLivingAlone
6%
In groupquarters
7%
In Nonfamily Households
55.9%2,245
In Nonfamily Households
38.0%4,537
In Nonfamily Households
29.8%2,294
Lower East SideTotal 65+ = 11,954
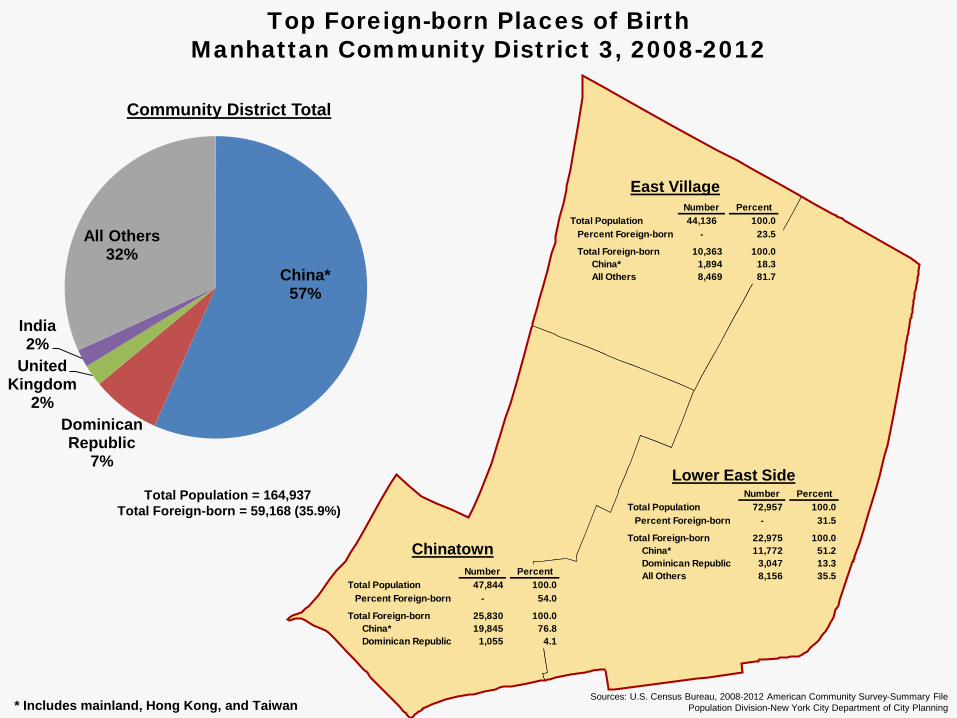
China*57%
Dominican Republic
7%
United Kingdom
2%
India2%
All Others32%
Community District Total
Total Foreign-born = 59,168 (35.9%)
East Village
Lower East Side
Sources: U.S. Census Bureau, 2008-2012 American Community Survey-Summary FilePopulation Division-New York City Department of City Planning* Includes mainland, Hong Kong, and Taiwan
Top Foreign-born Places of BirthManhattan Community District 3, 2008-2012
Number PercentTotal Population 47,844 100.0
Percent Foreign-born - 54.0
Total Foreign-born 25,830 100.0China* 19,845 76.8Dominican Republic 1,055 4.1
Chinatown
Number PercentTotal Population 44,136 100.0
Percent Foreign-born - 23.5
Total Foreign-born 10,363 100.0China* 1,894 18.3All Others 8,469 81.7
Number PercentTotal Population 72,957 100.0
Percent Foreign-born - 31.5
Total Foreign-born 22,975 100.0China* 11,772 51.2Dominican Republic 3,047 13.3All Others 8,156 35.5
Total Population = 164,937
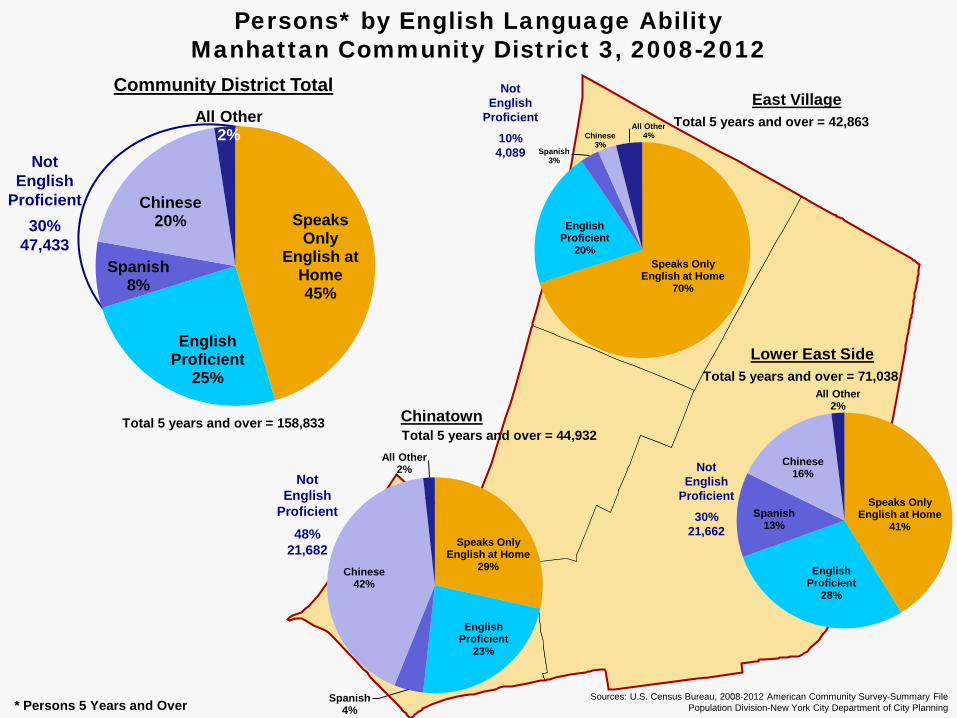
Persons* by English Language AbilityManhattan Community District 3, 2008-2012
Sources: U.S. Census Bureau, 2008-2012 American Community Survey-Summary FilePopulation Division-New York City Department of City Planning
Speaks Only English at Home
70%
English Proficient
20%
Spanish3%
Chinese3%
All Other4%
NotEnglish
Proficient
10%4,089
Speaks Only
English at Home45%
English Proficient
25%
Spanish8%
Chinese20%
All Other2%
Community District Total
Total 5 years and over = 158,833
NotEnglish
Proficient30%
47,433
East VillageTotal 5 years and over = 42,863
Speaks Only English at Home
29%
English Proficient
23%
Spanish4%
Chinese42%
All Other2%
NotEnglish
Proficient48%
21,682
ChinatownTotal 5 years and over = 44,932
Speaks Only English at Home
41%
English Proficient
28%
Spanish13%
Chinese16%
All Other2%
NotEnglish
Proficient
30%21,662
Lower East SideTotal 5 years and over = 71,038
* Persons 5 Years and Over
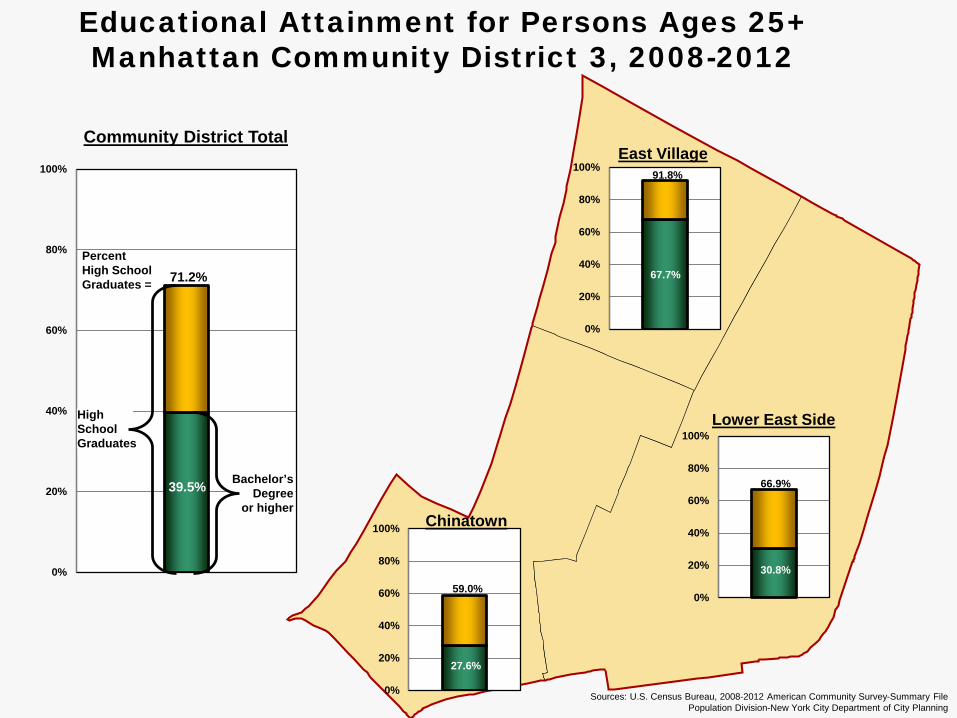
0%
20%
40%
60%
80%
100%
59.0%
Educational Attainment for Persons Ages 25+Manhattan Community District 3, 2008-2012
East Village
Chinatown
Lower East Side
Sources: U.S. Census Bureau, 2008-2012 American Community Survey-Summary FilePopulation Division-New York City Department of City Planning
0%
20%
40%
60%
80%
100%91.8%
0%
20%
40%
60%
80%
100%
66.9%
67.7%
27.6%
30.8%0%
20%
40%
60%
80%
100%
PercentHigh School Graduates =
Community District Total
71.2%
39.5% Bachelor’s Degree
or higher
High School Graduates
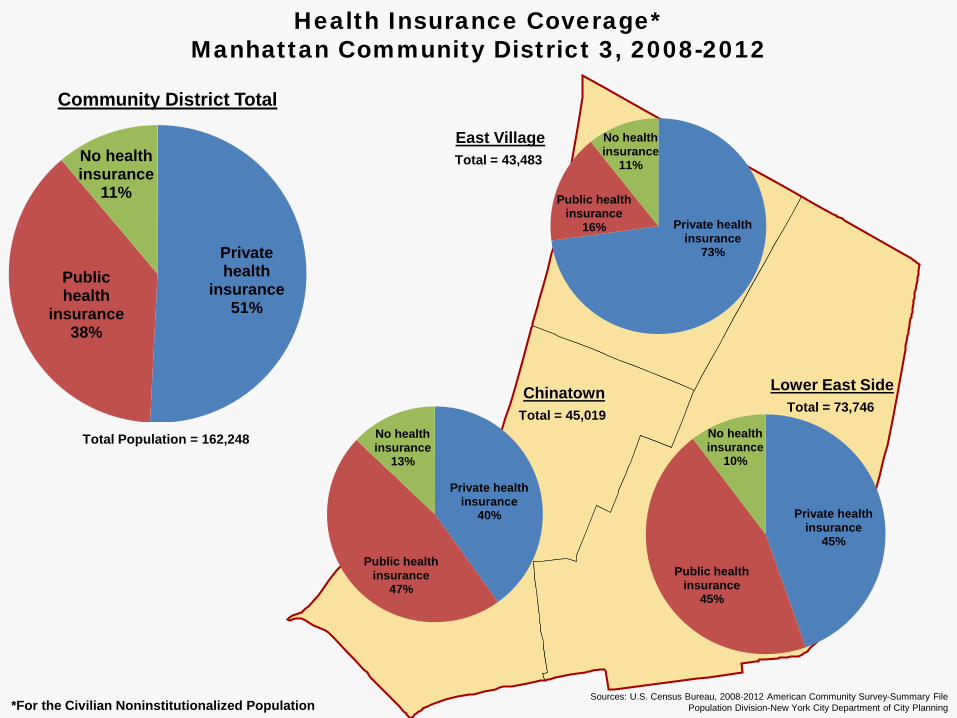
Private health insurance
45%
Public health insurance
45%
No health insurance
10%
Lower East SideTotal = 73,746
Private health
insurance51%
Public health
insurance38%
No health insurance
11%
Community District Total
Total Population = 162,248
Health Insurance Coverage*Manhattan Community District 3, 2008-2012
Sources: U.S. Census Bureau, 2008-2012 American Community Survey-Summary FilePopulation Division-New York City Department of City Planning
Private health insurance
73%
Public health insurance
16%
No health insurance
11%
East VillageTotal = 43,483
*For the Civilian Noninstitutionalized Population
Private health insurance
40%
Public health insurance
47%
No health insurance
13%
ChinatownTotal = 45,019
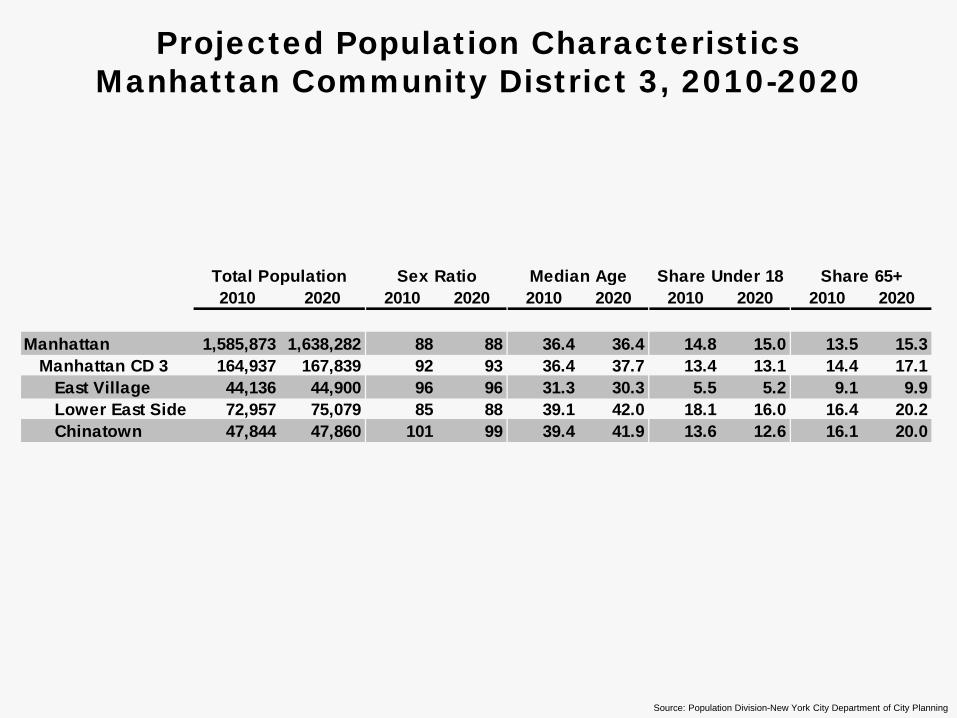
Projected Population CharacteristicsManhattan Community District 3, 2010-2020
Source: Population Division-New York City Department of City Planning
2010 2020 2010 2020 2010 2020 2010 2020 2010 2020
Manhattan 1,585,873 1,638,282 88 88 36.4 36.4 14.8 15.0 13.5 15.3Manhattan CD 3 164,937 167,839 92 93 36.4 37.7 13.4 13.1 14.4 17.1
East Village 44,136 44,900 96 96 31.3 30.3 5.5 5.2 9.1 9.9Lower East Side 72,957 75,079 85 88 39.1 42.0 18.1 16.0 16.4 20.2Chinatown 47,844 47,860 101 99 39.4 41.9 13.6 12.6 16.1 20.0
Total Population Share 65+Share Under 18Sex Ratio Median Age
Data Links
• DCP Population Division Web site: www.nyc.gov/population
• New York City Census FactFinder: www.nyc.gov/cff
• Census Bureau Web site: www.census.gov