Embed Size (px)
Citation preview
U.S. Department of Justice
Office of Justice Programs
National Institute of Justice
Community Policing and”The New Immigrants“:
Latinos in Chicago
r e s e a r c h r e p o r t
COMMUNITY ORIENTED POLICING SERVICES U.S. DEPARTMENT OF JUSTICE
U.S. Department of JusticeOffice of Justice Programs810 Seventh Street N.W.Washington, DC 20531
John AshcroftAttorney General
Deborah J. DanielsAssistant Attorney General
Sarah V. HartDirector, National Institute of Justice
Office of Justice Programs National Institute of JusticeWorld Wide Web Site World Wide Web Site http://www.ojp.usdoj.gov http://www.ojp.usdoj.gov/nij
Cover photographs copyright © 1998 Digitalstock, and background photo © 1994 PhotoDisc, Inc.
Community Policing and”The New Immigrants“:
Latinos in ChicagoWesley G. Skogan, Lynn Steiner, Jill DuBois,
J. Erik Gudell, and Aimee Fagan
Institute for Policy ResearchNorthwestern University
July 2002NCJ 189908

Sarah V. HartDirector
This program was supported under award number 94–IJ–CX–0046 by the National Institute of Justice, with funds transferred from the Office of Community Oriented Policing Services, U.S. Department of Justice.
Findings and conclusions of the research reported here are those of theauthors and do not reflect the official position or policies of the U.S.Department of Justice.
The National Institute of Justice is a component of the Office of JusticePrograms, which also includes the Bureau of Justice Assistance, the Bureau ofJustice Statistics, the Office of Juvenile Justice and Delinquency Prevention,and the Office for Victims of Crime.
iii
Contents
Summary . . . . . . . . . . . . . . . . . . . . . . . . . . . . . . . . . . . . . . . . . . . . 1
Population Trends . . . . . . . . . . . . . . . . . . . . . . . . . . . . . . . . . . . . . 2A look at the Nation. . . . . . . . . . . . . . . . . . . . . . . . . . . . . . . . . 3A look at Chicago. . . . . . . . . . . . . . . . . . . . . . . . . . . . . . . . . . . 3
Characteristics of Latinos in Chicago . . . . . . . . . . . . . . . . . . . . . . 4
The CAPS Program . . . . . . . . . . . . . . . . . . . . . . . . . . . . . . . . . . . . 5
Problems in Chicago’s Latino Neighborhoods . . . . . . . . . . . . . . . . 7Results from evaluation surveys . . . . . . . . . . . . . . . . . . . . . . . . . 7Results from city service records . . . . . . . . . . . . . . . . . . . . . . . 10Results from official crime reports . . . . . . . . . . . . . . . . . . . . . . 11
Latinos’ Responses to the CAPS Initiative . . . . . . . . . . . . . . . . . 12Integrating Latinos into CAPS . . . . . . . . . . . . . . . . . . . . . . . . 12Awareness of CAPS among Latinos. . . . . . . . . . . . . . . . . . . . . 14Participation of Latinos in CAPS . . . . . . . . . . . . . . . . . . . . . . 16Perceptions of the quality of policing among Latinos. . . . . . . . 17
Conclusion . . . . . . . . . . . . . . . . . . . . . . . . . . . . . . . . . . . . . . . . . . 20
Suggested Reading . . . . . . . . . . . . . . . . . . . . . . . . . . . . . . . . . . . . 22
Notes . . . . . . . . . . . . . . . . . . . . . . . . . . . . . . . . . . . . . . . . . . . . . . 23

Latinos in Chicago
SummaryThe influx of immigrants and the corresponding changes in the racialand ethnic composition of the Nation’s population have placed sig-nificant demands on the infrastructure of the Nation’s public servicesector, particularly the criminal justice system. This is evident inChicago, where shifting population patterns are dictating how policeinitiatives are being implemented.
The Chicago Alternative Policing Strategy, known as CAPS, wasinstituted on an experimental basis in a few police districts in April1993. The initiative was designed to improve police effectiveness byidentifying and prioritizing problems and working with the communi-ty to solve the problems. When CAPS became a citywide effort inspring 1995, law enforcement looked for ways to incorporate the city’sdiverse population in the initiative. An evaluation of the CAPS pro-gram—performed by Northwestern University and supported by theNational Institute of Justice, the Illinois Criminal Justice InformationAuthority, and private organizations—began before CAPS was initiat-ed citywide and continues to monitor its progress. From the evalua-tion, it has become clear that not all residents are reporting the samebenefits from the CAPS program.
This NIJ Research Report, the third in a series of four reports on com-munity policing in Chicago, summarizes key findings from the evalua-tion to determine the extent to which CAPS has involved and/orbenefited different population groups and highlights the experiencesof Chicago’s “new immigrants,” particularly its burgeoning Latinopopulation.1 As summarized below, the evaluation found that despiteaggressive efforts, CAPS experienced difficulties integrating Latinosinto the program. More specifically, the evaluation found that—
● Latinos are one of Chicago’s most troubled populations, and theyhave reaped comparatively fewer benefits than those enjoyed inmany other city neighborhoods, such as declining crime rates andgenerally improving conditions.
● Awareness of CAPS was generally high, due in part to the city’saggressive marketing campaign. However, English-speaking Latinos
1

Community Policing and ”The New Immigrants“
2
were far more aware of the program than Spanish-speaking Latinosand depended less on television and radio to learn about the pro-gram. In fact, television did not prove to be an effective vehicle forencouraging involvement in CAPS.
● Community involvement in CAPS was closely related to the vio-lent crime rate in a particular neighborhood. Despite Latinos’ gen-eral perception that their neighborhoods were particularly problemprone, their attendance at neighborhood beat meetings was rela-tively low. Such modest involvement by the Latino communityhas been one of the program’s shortcomings.
● Chicago residents generally perceived that the quality of policingimproved during the 1990s. Perceived levels of police corruptionand misconduct remained stable. In contrast to the view of Chi-cago’s white residents, however, Latinos and blacks were stillskeptical about the quality of policing in their neighborhoods atthe end of the decade.
Before examining these results in more detail, this report describesnational and local population trends and characteristics of Chicago’sLatino residents in an attempt to put the implications of this evalua-tion into clearer perspective. Because the changing composition ofChicago’s population is representative of nationwide trends, thesefindings may be relevant to a wider audience. The report then brieflydescribes the CAPS program and discusses the crime problems ofChicago’s Latino neighborhoods before noting how Chicago’s Latinosview and have participated in CAPS.
Population TrendsAn examination of the Nation’s and Chicago’s population trendsshows the implications of this evaluation. Because Chicago’s large anddiverse population is consistent with nationwide population patterns,other jurisdictions may use the results of this evaluation when plan-ning and implementing similar community policing initiatives.
Latinos in Chicago
A look at the Nation
Between 1990 and 1998, the Hispanic population in the UnitedStates grew by an estimated 35 percent and the Asian populationgrew by 41 percent. Currently, the U.S. population is approximately12 percent Hispanic and 4 percent Asian. These groups—youngerand with larger families—are projected to account for more than halfof the Nation’s population growth over the next 50 years. The U.S.Census Bureau projects that by 2050, the U.S. population will be 25percent Hispanic and 8 percent Asian; non-Hispanic whites will con-stitute a bare majority, at 52 percent.
More difficult to project is the impact that immigration could have onthese figures. About 9 percent of the U.S. population is foreign born,and the bulk of immigrants now arriving come from Spanish-speakingand Asian nations. As the growth of the white and black populationsslows, the traditional concepts of “majority” and “minority” willchange continually.
A look at Chicago
Chicago mirrors these national trends. Long an entrepôt, Chicago isthe third most popular destination city for new immigrants. Since the1990 census, the city has become home to tens of thousands of newlydocumented immigrants from Mexico alone, and large numbers ofundocumented immigrants. Smaller numbers of immigrants also havearrived from the Middle East, the Philippines, and Poland. The city’sChinatown neighborhood is expanding in several directions, andrefugees from Southeast Asia are forming new communities of theirown. Members of each group arrive with established views of how torelate to the police—and government in general—and find themselvesaccommodating these views to a new environment and America’sbig-city problems.
3
Community Policing and ”The New Immigrants“
4
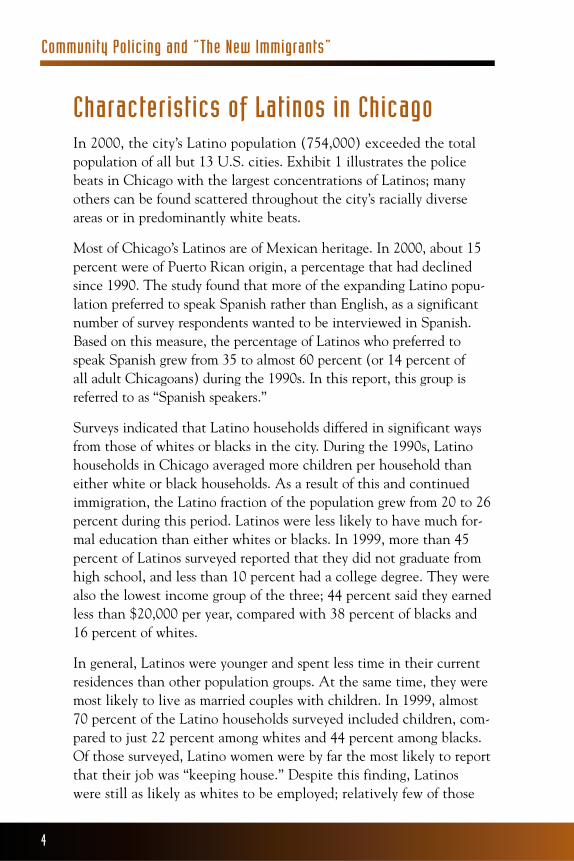
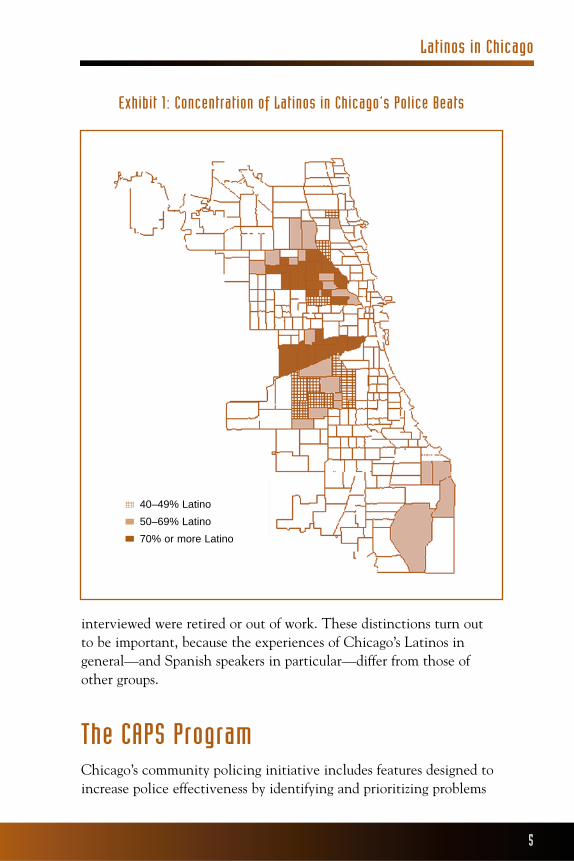
Characteristics of Latinos in ChicagoIn 2000, the city’s Latino population (754,000) exceeded the totalpopulation of all but 13 U.S. cities. Exhibit 1 illustrates the policebeats in Chicago with the largest concentrations of Latinos; manyothers can be found scattered throughout the city’s racially diverseareas or in predominantly white beats.
Most of Chicago’s Latinos are of Mexican heritage. In 2000, about 15percent were of Puerto Rican origin, a percentage that had declinedsince 1990. The study found that more of the expanding Latino popu-lation preferred to speak Spanish rather than English, as a significantnumber of survey respondents wanted to be interviewed in Spanish.Based on this measure, the percentage of Latinos who preferred tospeak Spanish grew from 35 to almost 60 percent (or 14 percent of all adult Chicagoans) during the 1990s. In this report, this group isreferred to as “Spanish speakers.”
Surveys indicated that Latino households differed in significant waysfrom those of whites or blacks in the city. During the 1990s, Latinohouseholds in Chicago averaged more children per household thaneither white or black households. As a result of this and continuedimmigration, the Latino fraction of the population grew from 20 to 26percent during this period. Latinos were less likely to have much for-mal education than either whites or blacks. In 1999, more than 45percent of Latinos surveyed reported that they did not graduate fromhigh school, and less than 10 percent had a college degree. They werealso the lowest income group of the three; 44 percent said they earnedless than $20,000 per year, compared with 38 percent of blacks and16 percent of whites.
In general, Latinos were younger and spent less time in their currentresidences than other population groups. At the same time, they weremost likely to live as married couples with children. In 1999, almost70 percent of the Latino households surveyed included children, com-pared to just 22 percent among whites and 44 percent among blacks.Of those surveyed, Latino women were by far the most likely to reportthat their job was “keeping house.” Despite this finding, Latinos were still as likely as whites to be employed; relatively few of those
Latinos in Chicago
interviewed were retired or out of work. These distinctions turn out to be important, because the experiences of Chicago’s Latinos in general—and Spanish speakers in particular—differ from those ofother groups.
The CAPS ProgramChicago’s community policing initiative includes features designed toincrease police effectiveness by identifying and prioritizing problems
5
Exhibit 1: Concentration of Latinos in Chicago’s Police Beats
40–49% Latino
50–69% Latino
70% or more Latino
Community Policing and ”The New Immigrants“
6
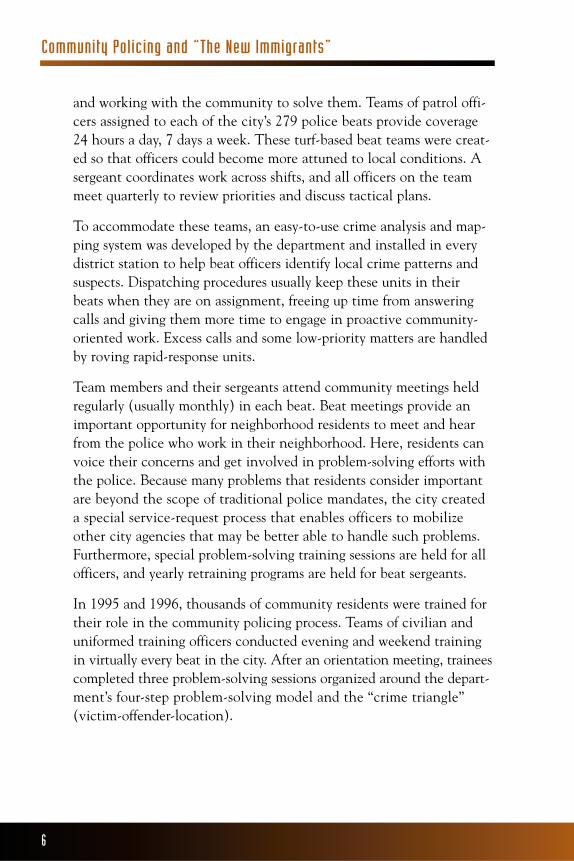
and working with the community to solve them. Teams of patrol offi-cers assigned to each of the city’s 279 police beats provide coverage24 hours a day, 7 days a week. These turf-based beat teams were creat-ed so that officers could become more attuned to local conditions. Asergeant coordinates work across shifts, and all officers on the teammeet quarterly to review priorities and discuss tactical plans.
To accommodate these teams, an easy-to-use crime analysis and map-ping system was developed by the department and installed in everydistrict station to help beat officers identify local crime patterns andsuspects. Dispatching procedures usually keep these units in theirbeats when they are on assignment, freeing up time from answeringcalls and giving them more time to engage in proactive community-oriented work. Excess calls and some low-priority matters are handledby roving rapid-response units.
Team members and their sergeants attend community meetings heldregularly (usually monthly) in each beat. Beat meetings provide animportant opportunity for neighborhood residents to meet and hearfrom the police who work in their neighborhood. Here, residents canvoice their concerns and get involved in problem-solving efforts withthe police. Because many problems that residents consider importantare beyond the scope of traditional police mandates, the city createda special service-request process that enables officers to mobilizeother city agencies that may be better able to handle such problems.Furthermore, special problem-solving training sessions are held for allofficers, and yearly retraining programs are held for beat sergeants.
In 1995 and 1996, thousands of community residents were trained fortheir role in the community policing process. Teams of civilian anduniformed training officers conducted evening and weekend trainingin virtually every beat in the city. After an orientation meeting, traineescompleted three problem-solving sessions organized around the depart-ment’s four-step problem-solving model and the “crime triangle”(victim-offender-location).
Latinos in Chicago
7
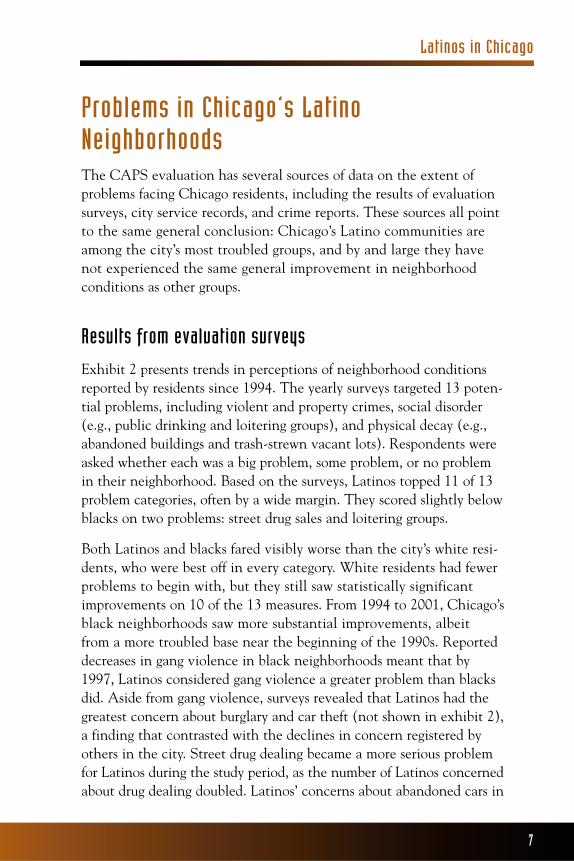
Problems in Chicago’s LatinoNeighborhoodsThe CAPS evaluation has several sources of data on the extent ofproblems facing Chicago residents, including the results of evaluationsurveys, city service records, and crime reports. These sources all pointto the same general conclusion: Chicago’s Latino communities areamong the city’s most troubled groups, and by and large they havenot experienced the same general improvement in neighborhoodconditions as other groups.
Results from evaluation surveys
Exhibit 2 presents trends in perceptions of neighborhood conditionsreported by residents since 1994. The yearly surveys targeted 13 poten-tial problems, including violent and property crimes, social disorder(e.g., public drinking and loitering groups), and physical decay (e.g.,abandoned buildings and trash-strewn vacant lots). Respondents wereasked whether each was a big problem, some problem, or no problemin their neighborhood. Based on the surveys, Latinos topped 11 of 13problem categories, often by a wide margin. They scored slightly belowblacks on two problems: street drug sales and loitering groups.
Both Latinos and blacks fared visibly worse than the city’s white resi-dents, who were best off in every category. White residents had fewerproblems to begin with, but they still saw statistically significantimprovements on 10 of the 13 measures. From 1994 to 2001, Chicago’sblack neighborhoods saw more substantial improvements, albeit from a more troubled base near the beginning of the 1990s. Reporteddecreases in gang violence in black neighborhoods meant that by1997, Latinos considered gang violence a greater problem than blacksdid. Aside from gang violence, surveys revealed that Latinos had thegreatest concern about burglary and car theft (not shown in exhibit 2),a finding that contrasted with the declines in concern registered byothers in the city. Street drug dealing became a more serious problemfor Latinos during the study period, as the number of Latinos concernedabout drug dealing doubled. Latinos’ concerns about abandoned cars in

Community Policing and ”The New Immigrants“
8
their neighborhood also grew throughout the evaluation, and they didnot share in perceived improvements in the maintenance of order inand around the city’s schools. For the most part, Latinos surveyed sawthe severity of problems as stable or increasing as the decade continued.
Exhibit 2: Trends in Perceptions of Neighborhood Problems
Street drug dealingGang violence
Per
cent
rat
ing
cond
ition
a b
ig p
robl
em
Per
cent
rat
ing
cond
ition
a b
ig p
robl
em
Per
cent
rat
ing
cond
ition
a b
ig p
robl
em
Per
cent
rat
ing
cond
ition
a b
ig p
robl
em
Per
cent
rat
ing
cond
ition
a b
ig p
robl
em
Per
cent
rat
ing
cond
ition
a b
ig p
robl
em
Burglary
Abandoned cars
School disruption
Graffiti
1994
1995
1996
1997
1998
1999
0
10
20
30
40
50
1994
1995
1996
1997
1998
1999
Blacks LatinosWhites
0
10
20
30
40
50
0
10
20
30
40
50
0
10
20
30
40
50
0
10
20
30
40
50
0
10
20
30
40
50
2001
2001
Blacks LatinosWhites
Blacks LatinosWhites Blacks LatinosWhites
Blacks LatinosWhites Blacks LatinosWhites
1994
1995
1996
1997
1998
1999
1994
1995
1996
1997
1998
1999
2001
2001
1994
1995
1996
1997
1998
1999
1994
1995
1996
1997
1998
1999
2001
2001
Note: No survey data were collected in 2000.

Latinos in Chicago
9
Language. Language played an important role in resident perceptionsof the extent of neighborhood problems. The Latino community wasdeeply divided on this variable. Spanish speakers were much morelikely than others to report that conditions were bad. On every meas-ure, Spanish speakers rated neighborhood problems as more seriousthan English-speaking Latinos and blacks.
Exhibit 3 illustrates the magnitude of some of these differences acrossrace and language. The differences depicted between English andSpanish speakers are typical: On 8 of 13 survey questions (only fourare presented in exhibit 3), the latter were at least twice as likely toperceive that problems in their neighborhood were serious. Whitesalways reported the most favorable conditions. The responses of blackswere varied, but in each case their level of concern was far lower thanthat of Spanish-speaking Latinos.
Graffiti. Graffiti is a fact of life in many neighborhoods. Chicagoansread graffiti as a sign that gangs are moving into their area or growingmore confident of their control over the neighborhood. Graffiti is
Street drug dealing Graffiti Gang violence Burglary
Per
cent
rat
ing
a bi
g pr
oble
m in
199
8–99
0
10
20
30
40
50
60Whites Latinos in English
Latinos in SpanishBlacks
Note: Data are from 1998 and 1999 surveys that were combined to increase the number of Latino respondents with different language preferences.
Exhibit 3: Perceptions of Neighborhood Problems by Race and Language
Community Policing and ”The New Immigrants“
10
believed to be infectious; where it appears and is not quickly erased,its presence will rapidly stimulate still more graffiti. Yet it did not gounnoticed in Chicago as graffiti was the subject of a surprising numberof beat meetings. In 1994, graffiti was perceived to be the greatestproblem among Latino respondents. The city’s white residents alsoconsidered it one of the biggest problems in their neighborhoods,albeit at a significantly lower level. As exhibit 2 showed, the onlyimprovement perceived by Latinos over time was in the level of graffiti, although concern increased slightly in 2001.
Graffiti presented an important test of the effectiveness of the cityservice component of CAPS. The city’s antigraffiti program involvesrapid cleanup strategies and a city ordinance that bans the sale ofspray paint. Rapid cleanups are a direct response to the contagion the-ory. Perhaps the most visible element of the city’s graffiti eliminationprogram is teams of “graffiti blasters” armed with high-pressure sodasprayers. Paint and supplies also are available for community groupsthat organize cleanup efforts.
Results from city service records
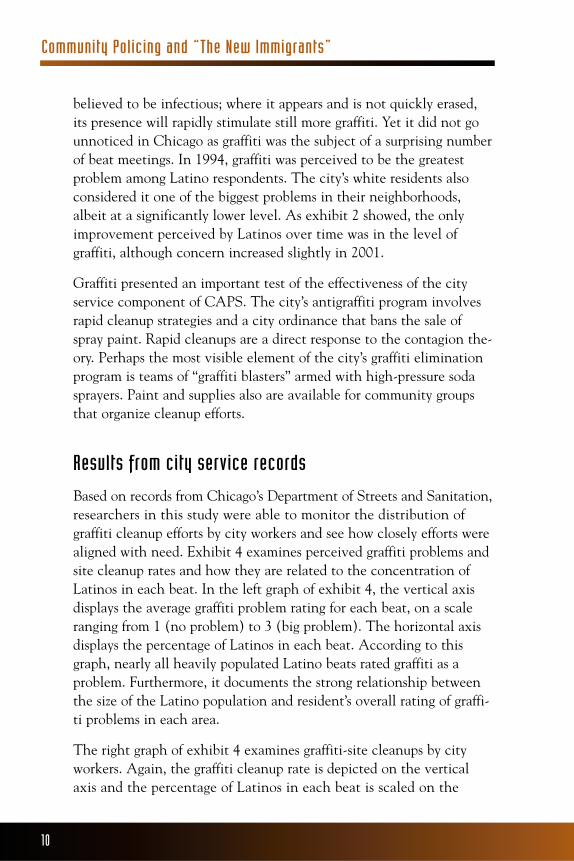
Based on records from Chicago’s Department of Streets and Sanitation,researchers in this study were able to monitor the distribution of graffiti cleanup efforts by city workers and see how closely efforts werealigned with need. Exhibit 4 examines perceived graffiti problems andsite cleanup rates and how they are related to the concentration ofLatinos in each beat. In the left graph of exhibit 4, the vertical axisdisplays the average graffiti problem rating for each beat, on a scaleranging from 1 (no problem) to 3 (big problem). The horizontal axisdisplays the percentage of Latinos in each beat. According to thisgraph, nearly all heavily populated Latino beats rated graffiti as aproblem. Furthermore, it documents the strong relationship betweenthe size of the Latino population and resident’s overall rating of graffi-ti problems in each area.
The right graph of exhibit 4 examines graffiti-site cleanups by cityworkers. Again, the graffiti cleanup rate is depicted on the verticalaxis and the percentage of Latinos in each beat is scaled on the

Latinos in Chicago
horizontal axis. This relationship is less dramatic than that shown inthe left panel because many beats with relatively low concentrationsof Latinos had relatively frequent cleanups. Although this is consis-tent with the general decline in graffiti problems perceived by allmajor groups, it is clear that most heavily populated Latino beats arenear the top of the service scale.
Results from official crime reports
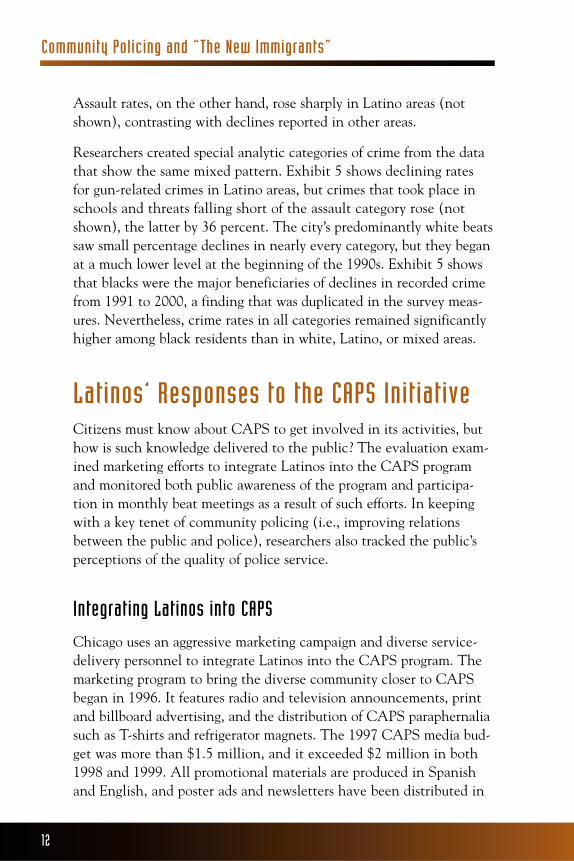
Regardless of how they are measured, crime trends in Chicago presenta mixed and not always favorable picture of conditions in the city’sLatino neighborhoods. To some degree, the official crime reports con-tradict the perceptions of Latinos, as reported in the evaluation survey.Based on 10 years of official crime reports, the city’s heavily populatedLatino beats fell in the middle on many measures (see exhibit 5).2
Official figures for rape and auto theft were down in these areas, alongwith robbery and burglary (not shown in exhibit 5). Homicide rateswere stable in Latino communities but did not decline as elsewhere.
11
Exhibit 4: Graffiti and Chicago‘s Latino Community
Graffiti problems
City
: Gra
ffiti
site
cle
anup
rat
e 19
97–9
8(p
er 1
0,00
0 re
side
nts)
Site cleanups
1.0
1.2
1.4
1.6
1.8
2.0
2.2
2.4
2.6
0 20 40 60 80 1001
2
3
4
5
6
7
8
9
0 20 40 60 80 100Sur
vey:
Ave
rage
gra
ffiti
prob
lem
in th
e be
at
(1 =
non
e; 3
= b
ig)
Percentage of Latinos per beat Percentage of Latinos per beat
Note: Data for 199 beats with at least 15 survey respondents, 1997–99
Note: Data for all 270 residential beats based on 179,000 site cleanups
2.8
3.0
Community Policing and ”The New Immigrants“
12
Assault rates, on the other hand, rose sharply in Latino areas (notshown), contrasting with declines reported in other areas.
Researchers created special analytic categories of crime from the datathat show the same mixed pattern. Exhibit 5 shows declining ratesfor gun-related crimes in Latino areas, but crimes that took place inschools and threats falling short of the assault category rose (notshown), the latter by 36 percent. The city’s predominantly white beatssaw small percentage declines in nearly every category, but they beganat a much lower level at the beginning of the 1990s. Exhibit 5 showsthat blacks were the major beneficiaries of declines in recorded crimefrom 1991 to 2000, a finding that was duplicated in the survey meas-ures. Nevertheless, crime rates in all categories remained significantlyhigher among black residents than in white, Latino, or mixed areas.
Latinos’ Responses to the CAPS InitiativeCitizens must know about CAPS to get involved in its activities, buthow is such knowledge delivered to the public? The evaluation exam-ined marketing efforts to integrate Latinos into the CAPS programand monitored both public awareness of the program and participa-tion in monthly beat meetings as a result of such efforts. In keepingwith a key tenet of community policing (i.e., improving relationsbetween the public and police), researchers also tracked the public’sperceptions of the quality of police service.
Integrating Latinos into CAPS
Chicago uses an aggressive marketing campaign and diverse service-delivery personnel to integrate Latinos into the CAPS program. Themarketing program to bring the diverse community closer to CAPSbegan in 1996. It features radio and television announcements, printand billboard advertising, and the distribution of CAPS paraphernaliasuch as T-shirts and refrigerator magnets. The 1997 CAPS media bud-get was more than $1.5 million, and it exceeded $2 million in both1998 and 1999. All promotional materials are produced in Spanishand English, and poster ads and newsletters have been distributed in

Exhibit 5: Trends in Recorded Crime Rates
Latinos in Chicago
Korean, Chinese, and Polish. Spanish ads are aired on appropriateradio and cable television stations. Civilian CAPS outreach workersregularly attend festivals, parades, marches, rallies, and assemblies dur-ing the summer to distribute fliers and promotional items. Spanishand English materials also are distributed through schools, churches,and supermarkets in heavily populated Latino areas. Promotionalmaterials come stapled to pizza delivery boxes and have been mailedalong with bills from cable television systems, cellular telephone com-panies, and the city’s water department.
13
Gun crimeHomicide
Crim
e ra
te (
per
100,
000
resi
dent
s)C
rime
rate
(pe
r 10
0,00
0 re
side
nts)
Crim
e ra
te (
per
100,
000
resi
dent
s)C
rime
rate
(pe
r 10
0,00
0 re
side
nts)
Rape Auto theft
1991
1992
1993
1994
1995
1996
1997
1998
0
10
20
30
40
50
60
Blacks LatinosWhitesDiverse areas
1991
1992
1993
1994
1995
1996
1997
1998
1991
1992
1993
1994
1995
1996
1997
1998
1991
1992
1993
1994
1995
1996
1997
1998
0
500
1,000
1,500
2,000
2,500
3,000
0
500
1,000
1,500
2,000
2,500
0
50
100
150
200
Note: Data collection began in 1991 and is based on individual crime incidents geocoded to a consistent set of beat boundaries.
1999
2000
1999
2000
1999
2000
1999
2000
70 3,500
250
Blacks LatinosWhitesDiverse areas
Blacks LatinosWhitesDiverse areas
Blacks LatinosWhitesDiverse areas
Community Policing and ”The New Immigrants“
14
In addition to marketing, the city’s emergency communications systemis staffed to handle foreign-language calls, and the police departmentemploys approximately 800 Spanish-speaking officers. Beat meetingsheld in predominantly Latino areas routinely are conducted in bothlanguages. The department’s cadet diversity training also includesrole-playing exercises that address language issues. Despite theseefforts, the integration of Chicago’s Latino residents into CAPS hasbeen difficult.
Awareness of CAPS among Latinos
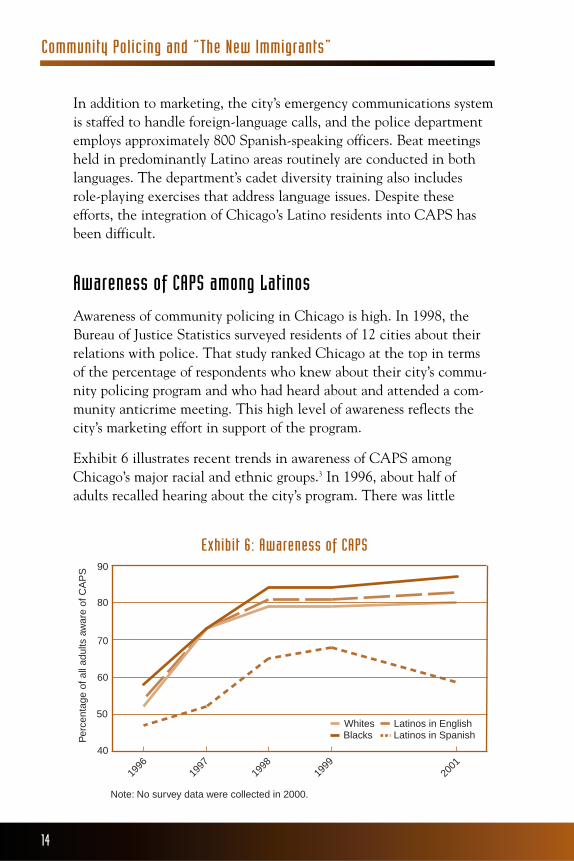
Awareness of community policing in Chicago is high. In 1998, theBureau of Justice Statistics surveyed residents of 12 cities about theirrelations with police. That study ranked Chicago at the top in termsof the percentage of respondents who knew about their city’s commu-nity policing program and who had heard about and attended a com-munity anticrime meeting. This high level of awareness reflects thecity’s marketing effort in support of the program.
Exhibit 6 illustrates recent trends in awareness of CAPS amongChicago’s major racial and ethnic groups.3 In 1996, about half ofadults recalled hearing about the city’s program. There was little
Exhibit 6: Awareness of CAPS
Per
cent
age
of a
ll ad
ults
aw
are
of C
AP
S
1996
1997
1998
1999
BlacksWhites Latinos in English
Latinos in Spanish
2001
Note: No survey data were collected in 2000.
40
50
60
70
80
90

Latinos in Chicago
difference between whites, blacks, and Latinos in this regard. As aware-ness rose, however, a visible gap opened between Spanish-speakingLatinos and others. It became noticeable during the course of the eval-uation when Latinos of Mexican heritage preferred a Spanish-languageinterview. By 2001, CAPS recognition among most population groupshovered around 80 percent. The notable exception, however, was theSpanish-speaking Latino population, who as a group fell behind byabout 19 percentage points from 1996 to 2000. By 2001, blacks weremost aware (by a slim margin) of the CAPS program. Thus, althoughthe city’s marketing campaign increased levels of awareness dramati-cally, differences in market penetration accounted for a noticeablesplit among language groups in terms of program awareness.
Exhibit 7 details how respondents recalled hearing about the pro-gram, based on surveys taken from 1997 to 1999. Survey respondentsdescribed up to 5 sources of awareness, which were coded by interview-ers into 1 of 14 categories. Exhibit 7 presents data on 6 sources thatwere mentioned by at least 10 percent of those responding. Less fre-quent sources of information included billboards; posters in the rapidtransit system; police car logos; booths at neighborhood festivals,marches, or rallies; announcements at church; and materials broughthome from school. Compared with other groups, Chicago’s Latinos
15
Exhibit 7: Major Sources of CAPS Awareness by Race, by Percentage
Television 50 44 51 62 55 68
Heard from someone else 27 25 32 23 28 17
Fliers, brochures, or newsletters 18 18 19 15 17 13
City or local newspapers 17 28 10 8 8 7
Posters 13 16 12 9 12 6
Radio 12 14 9 16 11 21
Latinos Latinos LatinosSources of Total Whites Blacks Total in English in SpanishAwareness (n = 6,594) (n = 2,783) (n = 2,221) (n = 1,103) (n = 583) (n = 520)
Note: Values are percentages based on respondents in combined 1997–99 citywide surveyswho had heard of CAPS; weighted estimates.
Community Policing and ”The New Immigrants“
16
depended heavily on television and radio for their knowledge of policematters. This was especially true for Spanish speakers, more than 60percent of whom relied on television and more than 20 percent onradio. Newspapers were ineffective at reaching Latinos compared withwhites, and there appeared to be less informal conversation aboutCAPS within the Spanish-speaking community (only 17 percent ofSpanish-speaking respondents said they heard about it from someoneelse). Differences in how various groups heard about CAPS are signifi-cant because awareness is linked to actual program involvement.
Participation of Latinos in CAPS
The manner in which people heard about the program and its efficacyat getting them to attend beat meetings can be explored statistically.Because different groups of people heard about the program in differentways, the analysis involved first controlling for important individualcharacteristics related to program awareness and turnout. The listincluded age, income, sex, home ownership, education, length of resi-dence, and language preference, among others. Taking these factorsinto account, Latinos who heard about the program on television wereless likely to attend than most other groups. Those who heard aboutthe program from someone else or who received a newsletter or flierwere more likely to attend. These findings are provisional because onlyrandomized experiments can yield unambiguous findings about theeffects of media exposure, but they suggest that the dependence ofChicago’s Latinos on television did not mobilize them in support of CAPS.
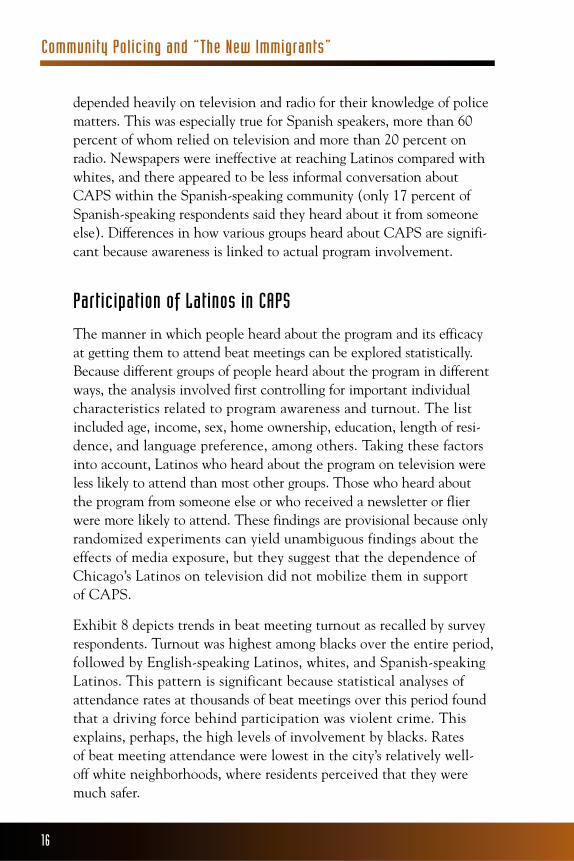
Exhibit 8 depicts trends in beat meeting turnout as recalled by surveyrespondents. Turnout was highest among blacks over the entire period,followed by English-speaking Latinos, whites, and Spanish-speakingLatinos. This pattern is significant because statistical analyses ofattendance rates at thousands of beat meetings over this period foundthat a driving force behind participation was violent crime. Thisexplains, perhaps, the high levels of involvement by blacks. Rates of beat meeting attendance were lowest in the city’s relatively well-off white neighborhoods, where residents perceived that they weremuch safer.
Latinos in Chicago
As noted earlier, Chicago’s Latinos view their neighborhoods asdecidedly problem prone, yet their level of awareness of and involve-ment in community policing is limited, principally because of linguis-tic disadvantage. The city has attempted to respond to this issue. Inaddition to the widespread availability of CAPS promotional materi-als in Spanish, translators usually are available at beat meetings heldin predominantly Latino areas. Furthermore, those police districtshave a large proportion of the department’s Spanish-speaking officers.Police emergency and city-service dispatchers have the capacity tohandle Spanish calls. Despite these factors, the limited involvementof Latinos in Chicago’s program remains noticeable, especially in lightof the problems they face.
Perceptions of the quality of policing among Latinos
Results from experimental districts. Although surveys point to highlevels of CAPS recognition among Chicagoans, they also documentan enormous gulf between racial and ethnic minorities and white resi-dents in their views of the quality of police service and the demeanorof police toward citizens. In surveys conducted in the city’s experi-mental districts before CAPS began, Latinos were found to be nearly
17
Per
cent
age
of a
ll ad
ults
who
atte
nd b
eat m
eetin
gs
1996
1997
1998
1999
2001
Note: No survey data were collected in 2000.
5
10
15
20
25
BlacksWhites Latinos in English
Latinos in Spanish
Exhibit 8: Attendance at Beat Meetings
Community Policing and ”The New Immigrants“
18
3 times more likely than whites to think that police working in theirneighborhood were impolite and 2.5 times more likely to think thatpolice were unfair, unhelpful, and not concerned about their prob-lems. Latinos were more negative than blacks on two of these fourmeasures.4 A 1998 survey found that 40 percent of Latinos thoughtthat police in their area were “too tough on people they stop,” com-pared with 10 percent of whites and 33 percent of blacks.
Results from the citywide evaluation. The CAPS citywide evalua-tion surveys asked respondents to assess the quality of service deliv-ered by police working in their neighborhood. Questions asked howeffectively police responded to crime, street disorder, and victims’needs; how polite, fair, concerned, and helpful they were when dealingwith area residents; and how effectively they worked with residents on problems that concern the community. Another set of questionsprobed the extent to which communities perceived police corruptionand misconduct toward residents.
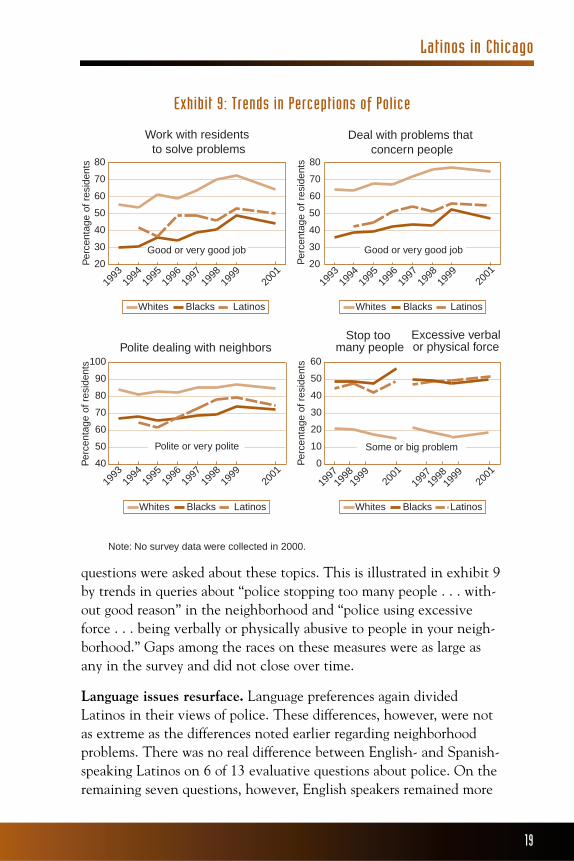
In the main, Chicagoans perceived improvements in the quality ofpolice service during the 1990s and stable levels of police corruptionand misconduct. Trends depicted in exhibit 9 illustrate typical pat-terns of change in opinion between 1993 and 2001. Exhibit 9 showsgains among all groups in their perceptions of police cooperation withthe community. This is illustrated by the graphs at the top of exhibit9 that chart responses to questions about whether police were doing agood job “working together with residents . . . to solve local problems”and “dealing with the problems that really concern people in [the]neighborhood.” Among Latinos, perceptions of the quality of policeservice improved by about 10 percentage points between 1993 and2001. There is, however, plenty of room for improvement because a gap as much as 20 percentage points still exists between the per-centage of Latinos and the percentage of whites who rate policefavorably on these measures.
Questions about police demeanor—represented in exhibit 9 by re-sponses to a question about how politely police deal with people inthe neighborhood—typically gathered more positive reviews duringthe reporting period. Finally, popular assessments of the extent ofpolice misconduct or corruption changed little during the 3 years
Latinos in Chicago
19
questions were asked about these topics. This is illustrated in exhibit 9by trends in queries about “police stopping too many people . . . with-out good reason” in the neighborhood and “police using excessiveforce . . . being verbally or physically abusive to people in your neigh-borhood.” Gaps among the races on these measures were as large asany in the survey and did not close over time.
Language issues resurface. Language preferences again dividedLatinos in their views of police. These differences, however, were notas extreme as the differences noted earlier regarding neighborhoodproblems. There was no real difference between English- and Spanish-speaking Latinos on 6 of 13 evaluative questions about police. On theremaining seven questions, however, English speakers remained more
Exhibit 9: Trends in Perceptions of Police
20
30
40
50
60
70
80
1994
1993
1995
1996
1997
1998
1999
1994
1993
1995
1996
1997
1998
1999
1994
1993
1995
1996
1997
1998
1999
0
10
20
30
40
50
60
40
50
60
70
80
90
100
20
30
40
50
60
70
80
Deal with problems that concern people
Work with residents to solve problems
Per
cent
age
of r
esid
ents
Per
cent
age
of r
esid
ents
Per
cent
age
of r
esid
ents
Per
cent
age
of r
esid
ents
Polite dealing with neighbors
1998
1997
1999
Good or very good job Good or very good job
Polite or very polite Some or big problem
2001
2001
2001
2001
1998
1997
1999
2001
Blacks LatinosWhites Blacks LatinosWhites
Blacks LatinosWhites Blacks LatinosWhites
Stop too many people
Excessive verbal or physical force
Note: No survey data were collected in 2000.
Community Policing and ”The New Immigrants“
20
positive by an average of approximately 7 percentage points. Languagewas related to perceptions of police helpfulness, concern, and fairnessand the extent to which they seemed responsive to neighborhoodproblems. Of note, the perceptions of Chicago’s Spanish-speakingpopulation closely resembled those of blacks on dimensions of thequality of police service.
ConclusionThe data used by the CAPS evaluation to monitor trends in neigh-borhood conditions and police-public relations in Chicago point to a number of favorable trends. Many patterns revealed by the Latinocommunity may be linked to demographic changes taking place inthe city. This change is fueled to a significant extent by immigration,which is signaled by an increasing preference for the Spanish languageamong Latinos. As the rate of immigration and the proportion ofSpanish speakers have increased, the evaluation also found that levelsof education and real income have decreased among the city’s Latinosover time. Poverty and education are closely tied to neighborhoodproblems and involvement in CAPS, so demographic trends amongChicago’s Latinos may be working against rather than for them.
Overall throughout the city, crime is down, neighborhood conditionshave improved, awareness of and involvement in the city’s communitypolicing program are stable at a high level, and perceptions of thequality of police service have become more favorable. Yet, not all ofthe city’s communities have enjoyed the benefits of these trends.
In particular, Chicago’s large and growing Latino community has fall-en behind. By century’s end, Latinos reported worsening conditionson many measures of crime and disorder problems. Furthermore,homicide and assault rates in heavily populated Latino beats did notmirror declines noted in other city neighborhoods.
Latinos were the least likely to be familiar with Chicago’s communitypolicing initiative, and they did not attend beat meetings at a levelcommensurate with their perceived problems. Interestingly, despitewidespread discussion of the distrust that Latino immigrants have of
Latinos in Chicago
police in their home country—including expectations about indiffer-ence, corruption, and abuse of power—Latinos’ views of police inChicago do not differ much from and are, in general, slightly morefavorable than those of native-born blacks. These findings suggest thatnegative views of police can be “home grown” as well as imported.
By 2001, CAPS achieved mixed results in improving the perceptionof police by residents. Generally, CAPS accomplished an overalldegree of success in terms of citizen satisfaction. More pointedly, thecommunity’s perceptions of police cooperation moved into a positiverange even among the most dissatisfied groups. Although responsesto questions about police helpfulness, fairness, and concerns showedparallel improvements, a large gulf still existed in the perceptions ofpolice by the city’s white and minority residents. This was particularlytrue of responses to questions aimed at police misconduct, which reg-istered little improvement in the views of Latinos and blacks over thelatter half of the reporting period.
Latinos’ views of police service improved somewhat by many meas-ures, but about half the Latino population was still dissatisfied. Theseviews did, however, grow more positive during the course of thestudy, as they did for all major groups. Chicago’s Latinos shared withblacks—but not with the white population—a deep skepticism aboutthe quality of police service in their neighborhoods, creating a gulfbetween Latinos and the city’s white population that did not closeappreciably by 2001.
Language was found to affect perceptions of crime and police involve-ment in the CAPS program. English-speaking Latinos reported steadilyimproving crime conditions. On the other hand, Spanish-speakingLatinos reported worsening crime conditions. Because the latter makeup an increasingly large percentage of Chicago’s Latino population,survey results for Latinos as a whole diverged from official policecrime figures. This contrast results from whites and blacks; each groupshowed declines in crime and concern about crime in both surveyresults and official crime figures. Because the crime data in thisreport are categorized only by ethnicity, a finer breakdown of crimein Chicago than is possible with existing census data may make surveyfindings from Latinos match official crime figures.
21
Community Policing and ”The New Immigrants“
22
Additionally, Spanish-speaking Latinos were less positive in their viewsof police and less involved in CAPS than their English-speakingcounterparts. These findings may be symptomatic of a speculativeunwillingness among Latinos to contact police and to report crimes.
Were the favorable citywide crime trends described here caused bycommunity policing? The downward shift in crime rates since 1991began well before CAPS was inaugurated, so any effects of CAPSneed to be separated from the forces that pushed crime trends in afavorable direction. Survey measures of neighborhood conditions andperceptions of the quality of police service have moved in a generallyfavorable direction as well. However, like crime, they are affected byforces beyond—and perhaps more powerful than—community polic-ing. Therefore, identifying the effects of CAPS on them also involvesmore detailed analysis. Before-and-after surveys point to a number ofpositive conclusions. The final report in this series will examine thelong-term trends described here for comparable evidence of programeffectiveness.
Suggested ReadingSkogan, Wesley G. “Community Policing in Chicago,” in CommunityPolicing, ed. Geoffrey Alpert and Alex Piquero, Prospect Heights, IL:Waveland Press, 1997:159–174.
Skogan, Wesley G., and Susan M. Hartnett. Community Policing,Chicago Style. New York and London: Oxford University Press, 1997.
Skogan, Wesley G., Susan M. Hartnett, Jill DuBois, Jennifer T.Comey, Karla Twedt-Ball, and J. Erik Gudell. Public Involvement:Community Policing in Chicago. NIJ Research Report. Washington,DC: U.S. Department of Justice, 2000, NCJ 179557.
Skogan, Wesley G., Lynn Steiner, Jill DuBois, J. Erik Gudell, AimeeFagan, Jinha Kim, and Richard Block. Community Policing in Chicago,Year Seven: An Interim Report. Chicago: Illinois Criminal JusticeInformation Authority, 2000. This report, one of a series, is availablefree of charge from 120 South Riverside Plaza, Suite 1016, Chicago,IL 60606.
Latinos in Chicago
23
Skogan, Wesley G., Susan M. Hartnett, Jill DuBois, Jennifer T. Comey,Marianne Kaiser, and Justine H. Lovig. On the Beat: Police andCommunity Problem Solving. Boulder, CO: Westview Publishing Co.,1999.
———. Problem Solving in Practice: Implementing Community Policing inChicago. NIJ Research Report. Washington, DC: U.S. Department ofJustice, 2000, NCJ 179556.
Notes1. In this report, “Latino” refers to historically Spanish-speaking people from Mexico, Puerto Rico, Central and South America, andthe Caribbean.
2. Data presented in exhibit 5 result from the division of the city’s 270residential beats into 63 predominantly white areas; 121 heavily popu-lated black areas; 56 areas where Latinos account for an average of 60percent of the population; and 30 diverse beats that average 40 per-cent white, 25 percent black, and 20 percent Latino. Rates were calcu-lated from the total number of crimes and residents in each of theseaggregated areas using yearly population estimates. Nine nonresidentialbeats remained unclassified.
3. The most accurate measure of program awareness stems from surveysbeginning in 1996. The measure combines responses to a questionabout hearing of “the city’s new community policing program” with a followup specifically asking whether they had heard of the CAPSprogram.
4. Skogan and Hartnett, 1997, 31.

About the National Institute of JusticeNIJ is the research, development, and evaluation agency of the U.S. Department of Justice and is solelydedicated to researching crime control and justice issues. NIJ provides objective, independent, non-partisan, evidence-based knowledge and tools to meet the challenges of crime and justice, particularlyat the State and local levels. NIJ’s principal authorities are derived from the Omnibus Crime Controland Safe Streets Act of 1968, as amended (42 U.S.C. §§ 3721–3722).
NIJ’s MissionIn partnership with others, NIJ’s mission is to prevent and reduce crime, improve law enforcementand the administration of justice, and promote public safety. By applying the disciplines of the socialand physical sciences, NIJ—
• Researches the nature and impact of crime and delinquency.
• Develops applied technologies, standards, and tools for criminal justice practitioners.
• Evaluates existing programs and responses to crime.
• Tests innovative concepts and program models in the field.
• Assists policymakers, program partners, and justice agencies.
• Disseminates knowledge to many audiences.
NIJ’s Strategic Direction and Program AreasNIJ is committed to five challenges as part of its strategic plan: 1) rethinking justice and the process-es that create just communities; 2) understanding the nexus between social conditions and crime; 3)breaking the cycle of crime by testing research-based interventions; 4) creating the tools and tech-nologies that meet the needs of practitioners; and 5) expanding horizons through interdisciplinaryand international perspectives. In addressing these strategic challenges, the Institute is involved in thefollowing program areas: crime control and prevention, drugs and crime, justice systems and offenderbehavior, violence and victimization, communications and information technologies, critical incidentresponse, investigative and forensic sciences (including DNA), less-than-lethal technologies, officerprotection, education and training technologies, testing and standards, technology assistance to lawenforcement and corrections agencies, field testing of promising programs, and international crimecontrol. NIJ communicates its findings through conferences and print and electronic media.
NIJ’s StructureThe NIJ Director is appointed by the President and confirmed by the Senate. The NIJ Director estab-lishes the Institute’s objectives, guided by the priorities of the Office of Justice Programs, the U.S.Department of Justice, and the needs of the field. NIJ actively solicits the views of criminal justiceand other professionals and researchers to inform its search for the knowledge and tools to guide policy and practice.
NIJ has three operating units. The Office of Research and Evaluation manages social science researchand evaluation and crime mapping research. The Office of Science and Technology manages technol-ogy research and development, standards development, and technology assistance to State and locallaw enforcement and corrections agencies. The Office of Development and Communications managesfield tests of model programs, international research, and knowledge dissemination programs. NIJ is acomponent of the Office of Justice Programs, which also includes the Bureau of Justice Assistance,the Bureau of Justice Statistics, the Office of Juvenile Justice and Delinquency Prevention, and theOffice for Victims of Crime.
To find out more about the National Institute of Justice, please contact:
National Criminal Justice Reference ServiceP.O. Box 6000
Rockville, MD 20849–6000800–851–3420
e-mail: [email protected]
To obtain an electronic version of this document, access the NIJ Web site(http://www.ojp.usdoj.gov/nij).
If you have questions, call or e-mail NCJRS.