Embed Size (px)
Citation preview
Community Inclusion in Colorado
A Mapping Project for Emergency Preparedness and Response
Aimee Voth Siebert, MA
Julia Beems, MA
Rachel Coles, MA
Devon Williford, MPH
Adam Anderson, MURP, MPH
March 2015

Community Inclusion in Colorado
“understanding that HUMAN ENERGY is the currency of social change…does not simply open the process of change to all; it also removes the prerequisites for action, meaning that productive change can begin anywhere, at any time.”
- Taylor, Taylor & Taylor. Empowerment on an unstable planet: From seeds of human energy to a scale of global changeHuman Energy
“Improving the quality of life for a community starts by strengthening successes already operating.”
Community Inclusion in Colorado
The Perfect Storm
Community Inclusion in Colorado
• Past Projects• Understanding Barriers• Culture Change• New Data• Recent Colorado Disasters
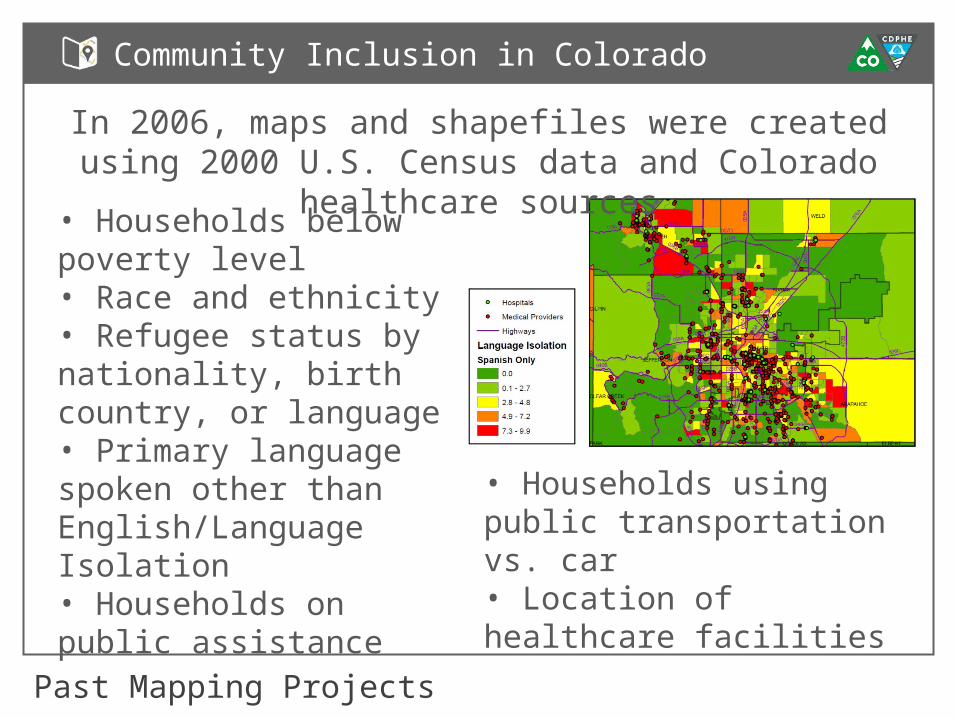
Past Mapping Projects
Community Inclusion in Colorado
In 2006, maps and shapefiles were created using 2000 U.S. Census data and Colorado healthcare
sources• Households below poverty level• Race and ethnicity• Refugee status by nationality, birth country, or language• Primary language spoken other than English/Language Isolation• Households on public assistance
• Households using public transportation vs. car• Location of healthcare facilities
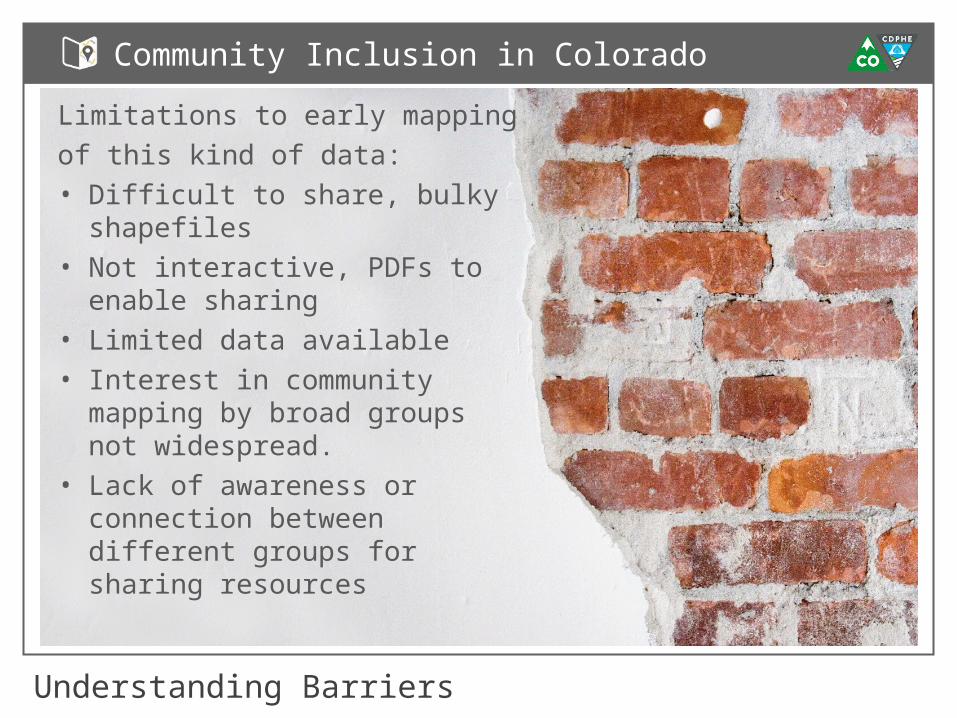
Understanding Barriers
Community Inclusion in Colorado
Limitations to early mapping of this kind of data:• Difficult to share, bulky
shapefiles • Not interactive, PDFs to
enable sharing• Limited data available• Interest in community
mapping by broad groups not widespread.
• Lack of awareness or connection between different groups for sharing resources
Cultural Change in Emergency Planning
Community Inclusion in Colorado
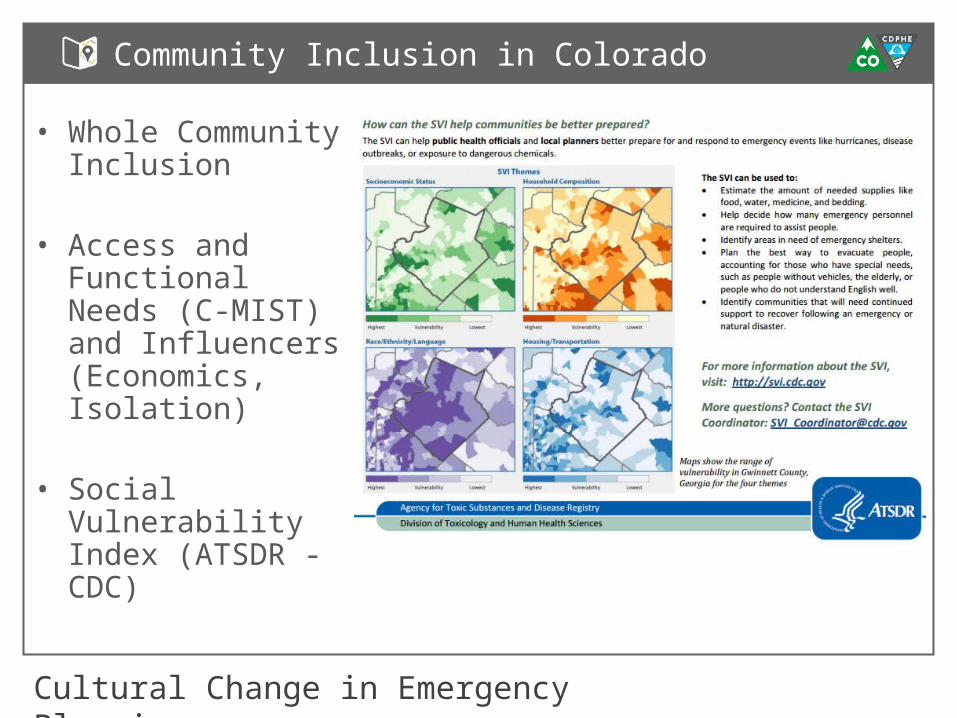
• Whole Community Inclusion
• Access and Functional Needs (C-MIST) and Influencers (Economics, Isolation)
• Social Vulnerability Index (ATSDR - CDC)
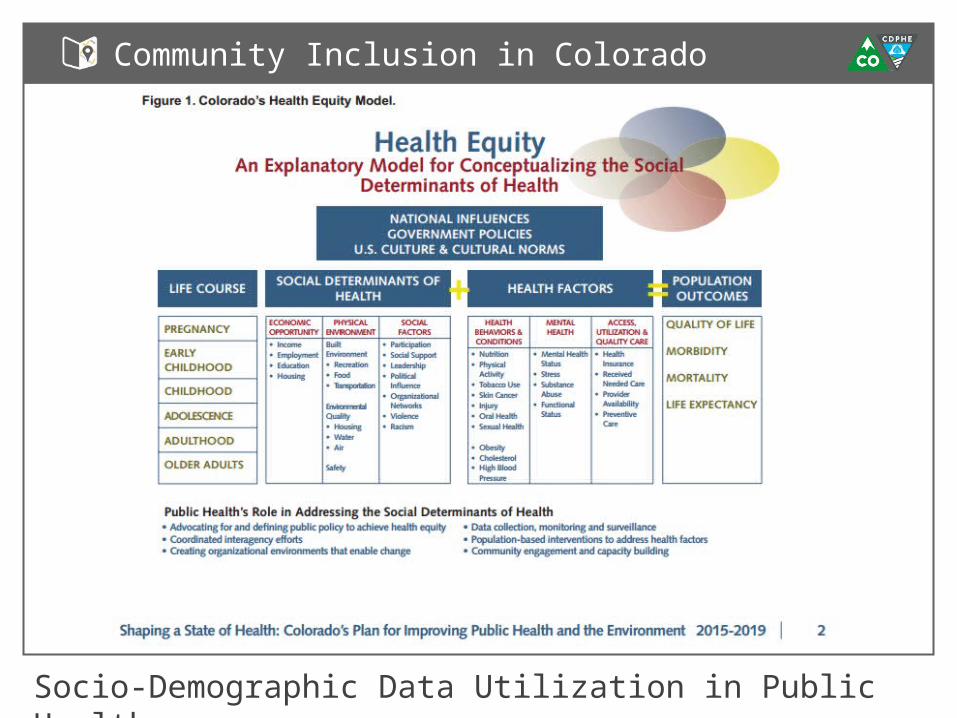
Socio-Demographic Data Utilization in Public Health
Community Inclusion in Colorado

GIS Connect People to Data and People to People
Community Inclusion in Colorado
• Map where things are• Map quantities• Map densities• Find out what is inside• Find out what is nearby• Model change over time
• Disease Surveillance• Risk Analysis• Health Access and
Planning• Community Health
Profiling• Built Environment• Crisis Management
Collaborative Efforts
Community Inclusion in Colorado
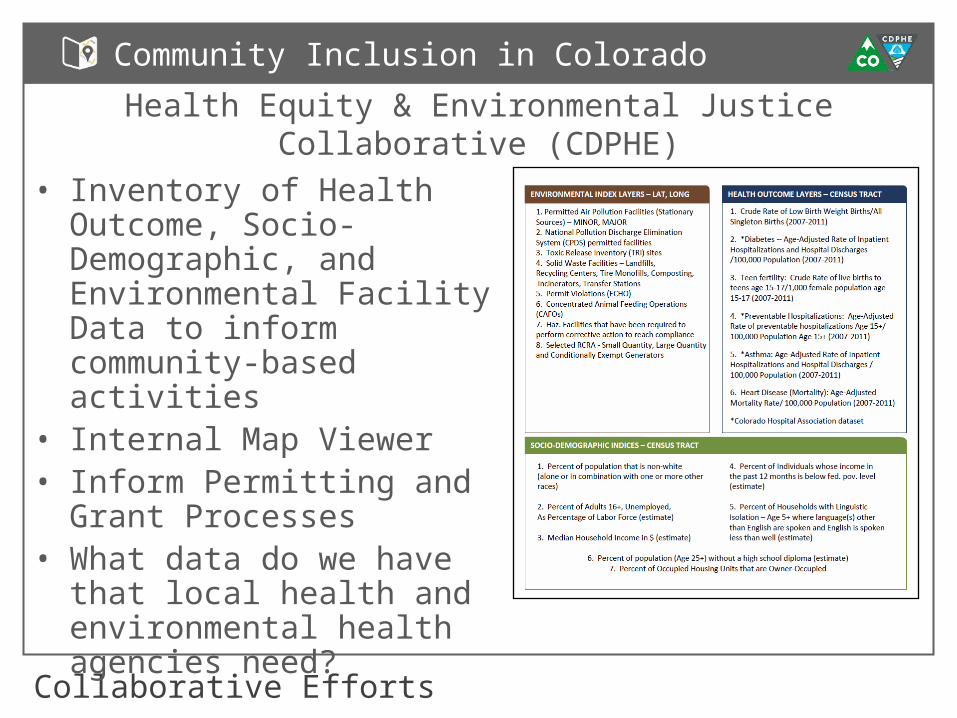
• Inventory of Health Outcome, Socio-Demographic, and Environmental Facility Data to inform community-based activities
• Internal Map Viewer • Inform Permitting and
Grant Processes• What data do we have
that local health and environmental health agencies need?
Health Equity & Environmental Justice Collaborative (CDPHE)
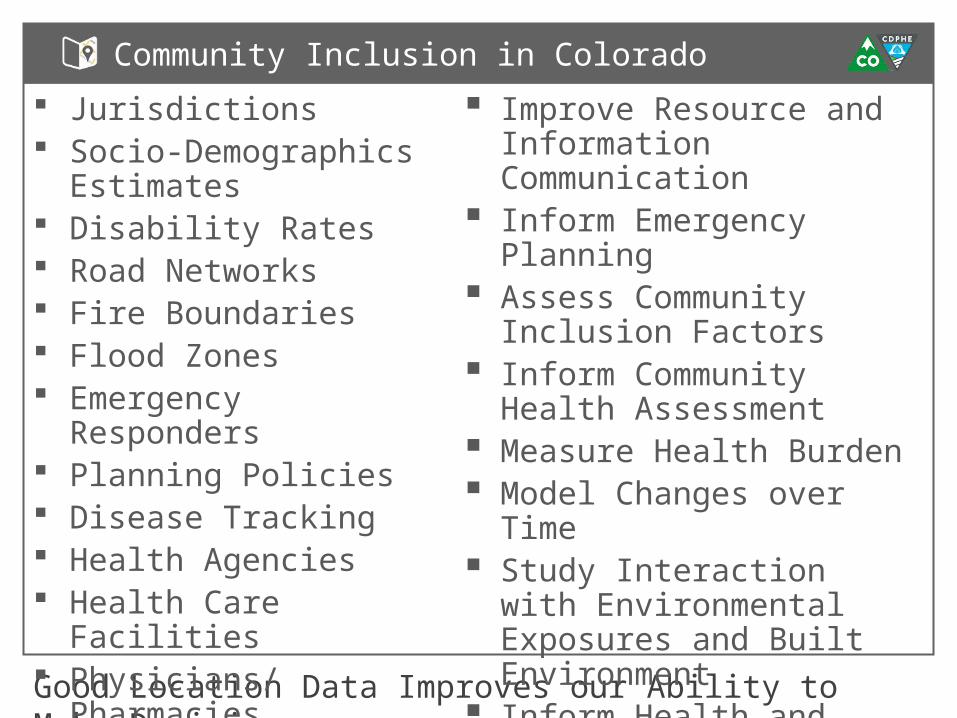
Good Location Data Improves our Ability to Make Decisions
Community Inclusion in Colorado
Jurisdictions Socio-Demographics
Estimates Disability Rates Road Networks Fire Boundaries Flood Zones Emergency
Responders Planning Policies Disease Tracking Health Agencies Health Care Facilities Physicians/
Pharmacies
Improve Resource and Information Communication
Inform Emergency Planning
Assess Community Inclusion Factors
Inform Community Health Assessment
Measure Health Burden Model Changes over Time Study Interaction with
Environmental Exposures and Built Environment
Inform Health and Planning Policies
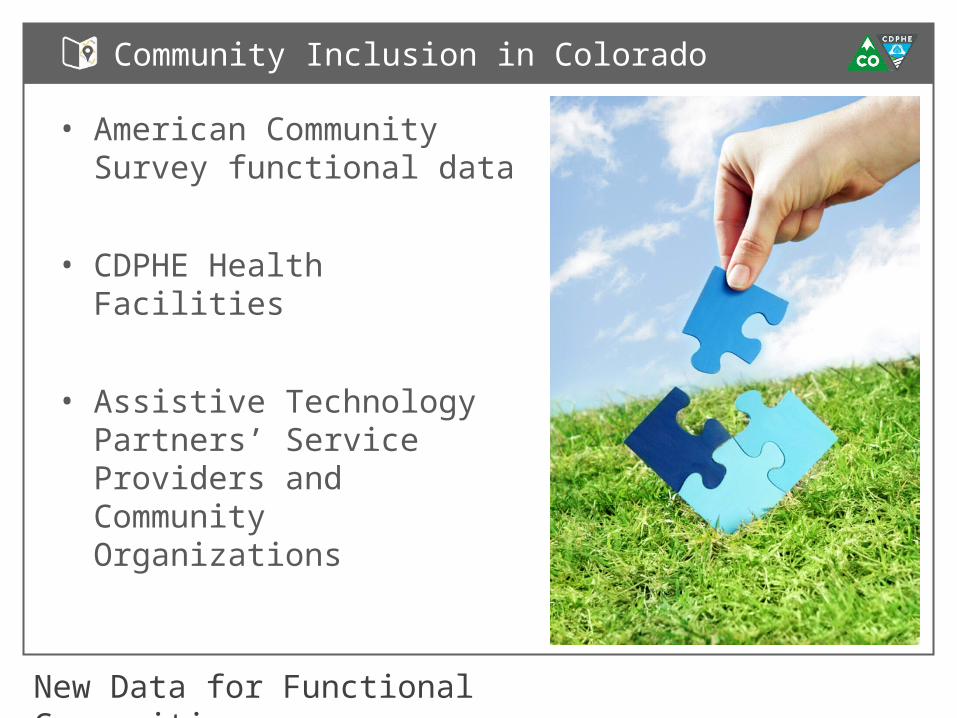
New Data for Functional Communities
Community Inclusion in Colorado
• American Community Survey functional data
• CDPHE Health Facilities
• Assistive Technology Partners’ Service Providers and Community Organizations
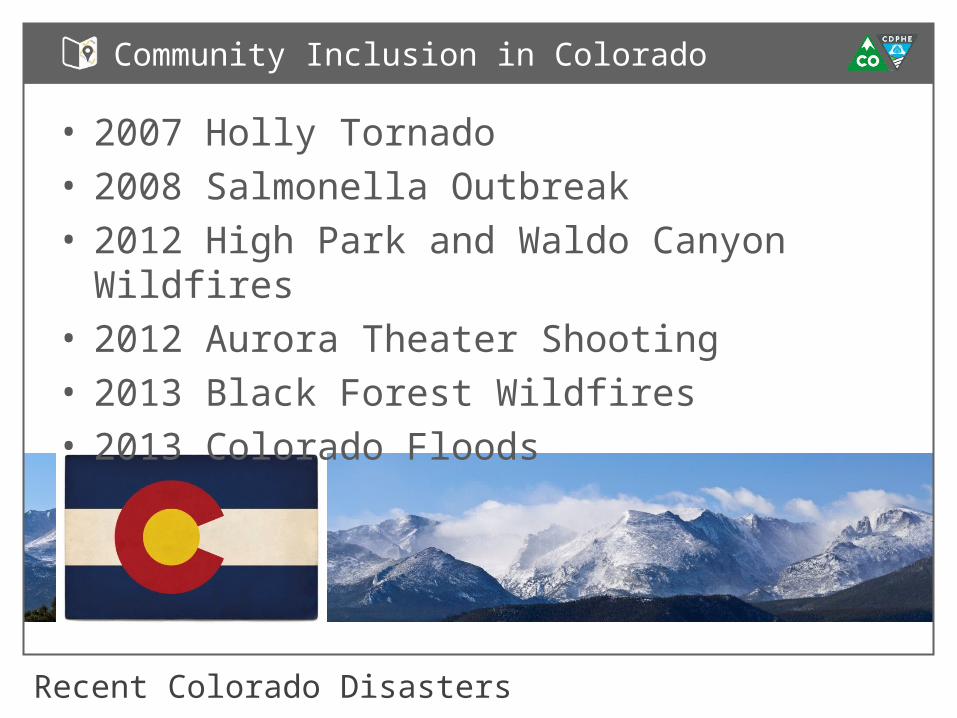
Recent Colorado Disasters
Community Inclusion in Colorado
• 2007 Holly Tornado• 2008 Salmonella Outbreak• 2012 High Park and Waldo Canyon
Wildfires• 2012 Aurora Theater Shooting• 2013 Black Forest Wildfires• 2013 Colorado Floods
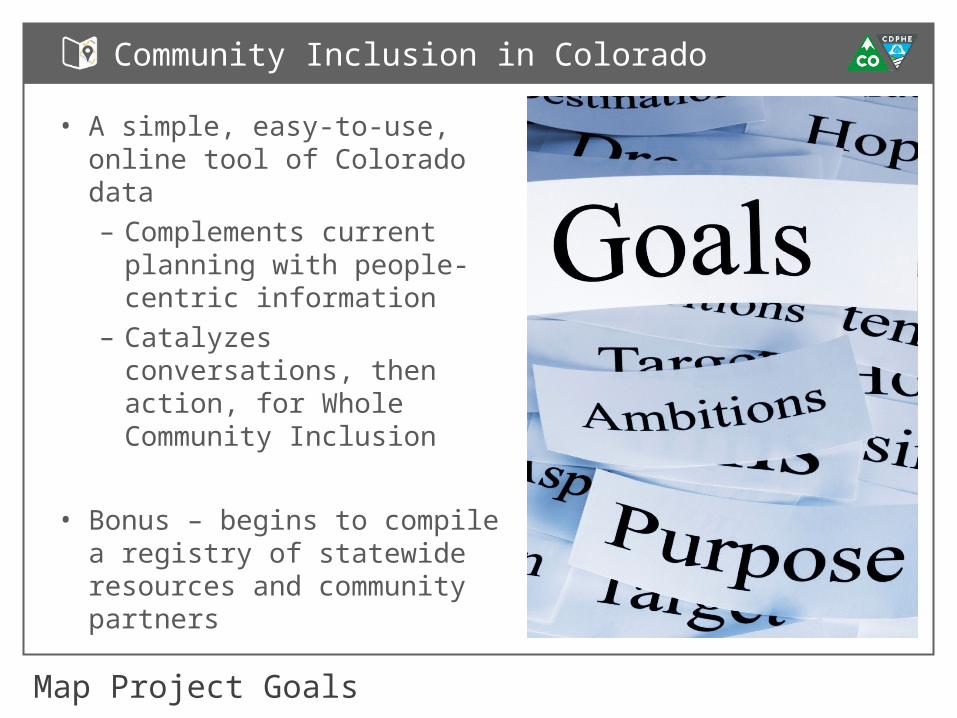
Map Project Goals
Community Inclusion in Colorado
• A simple, easy-to-use, online tool of Colorado data – Complements current
planning with people-centric information
– Catalyzes conversations, then action, for Whole Community Inclusion
• Bonus – begins to compile a registry of statewide resources and community partners
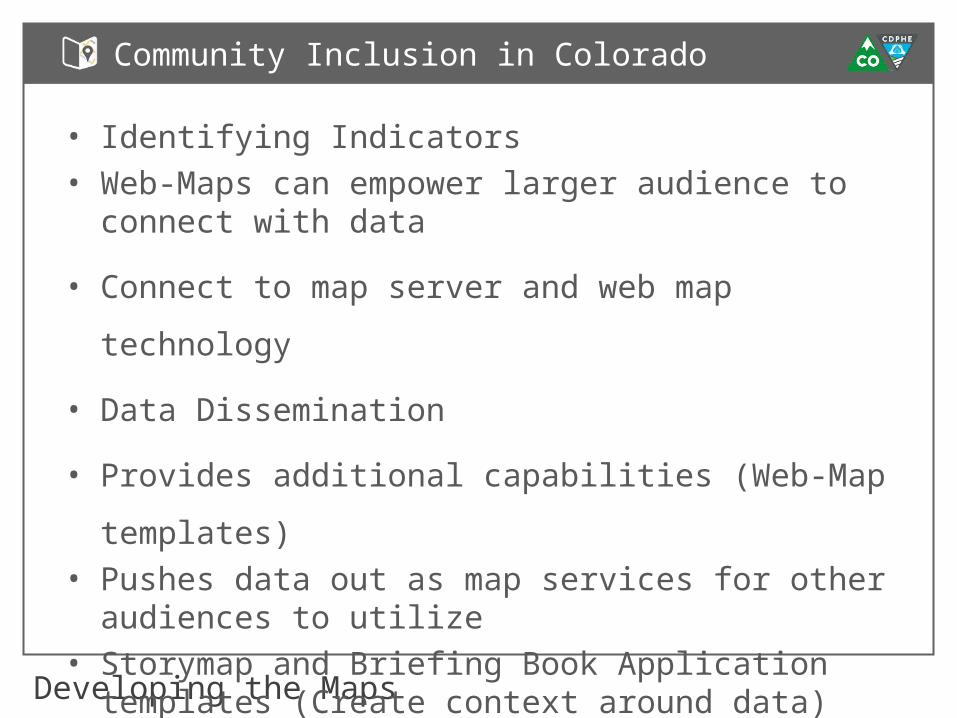
Developing the Maps
Community Inclusion in Colorado
• Identifying Indicators• Web-Maps can empower larger audience to
connect with data
• Connect to map server and web map technology
• Data Dissemination
• Provides additional capabilities (Web-Map
templates)• Pushes data out as map services for other
audiences to utilize • Storymap and Briefing Book Application templates
(Create context around data)
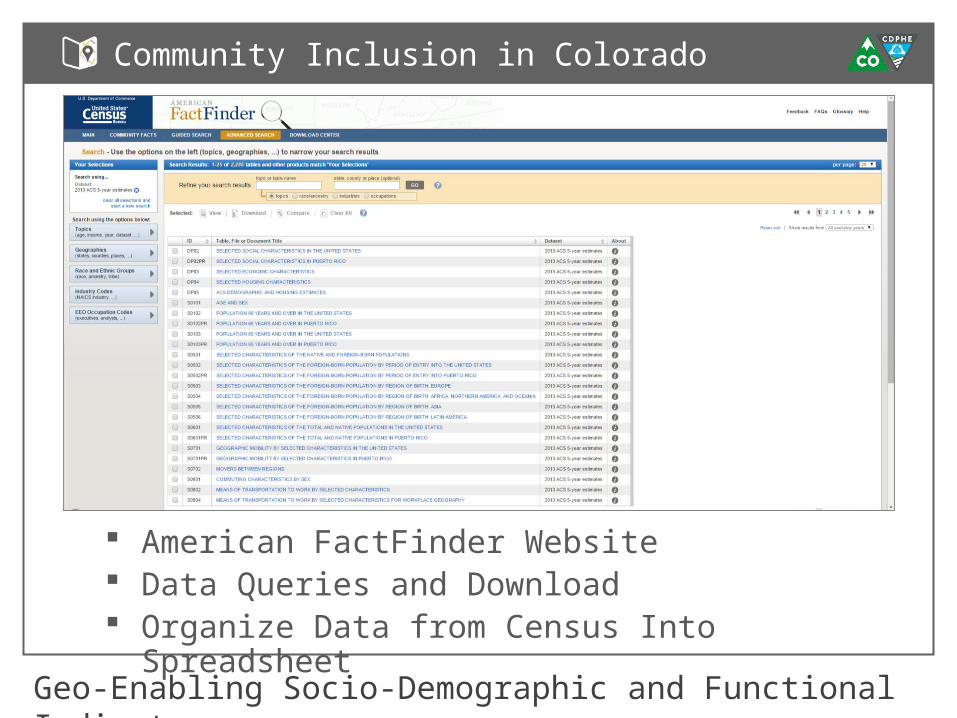
Geo-Enabling Socio-Demographic and Functional Indicators
Community Inclusion in Colorado
American FactFinder Website Data Queries and Download Organize Data from Census Into Spreadsheet
Geo-Enabling Socio-Demographic and Functional Indicators
Community Inclusion in Colorado
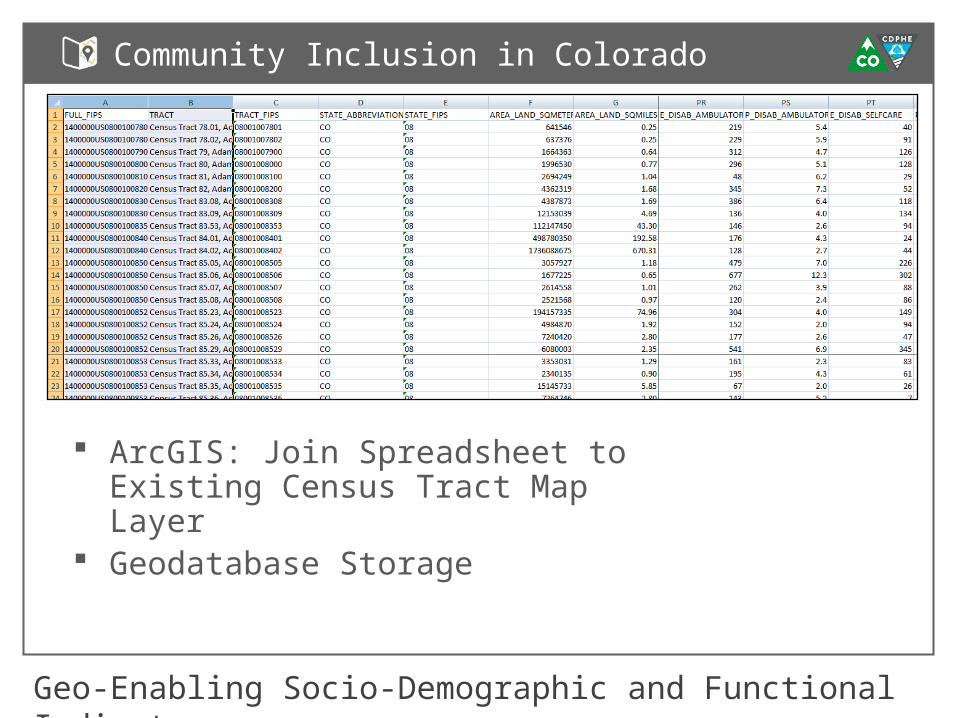
ArcGIS: Join Spreadsheet to Existing Census Tract Map Layer
Geodatabase Storage
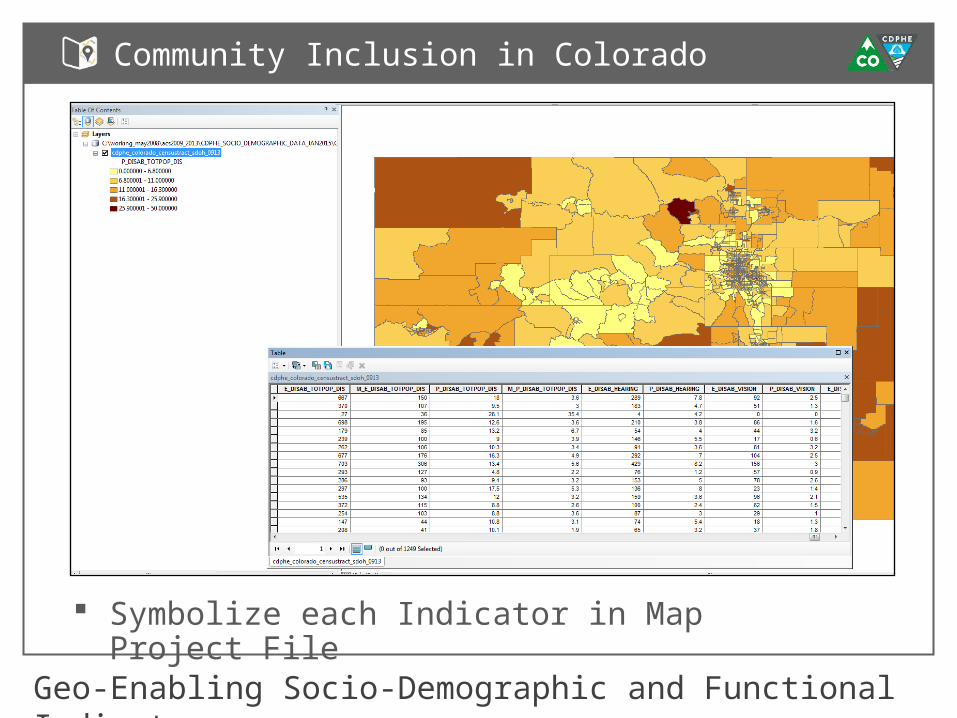
Geo-Enabling Socio-Demographic and Functional Indicators
Community Inclusion in Colorado
Symbolize each Indicator in Map Project File
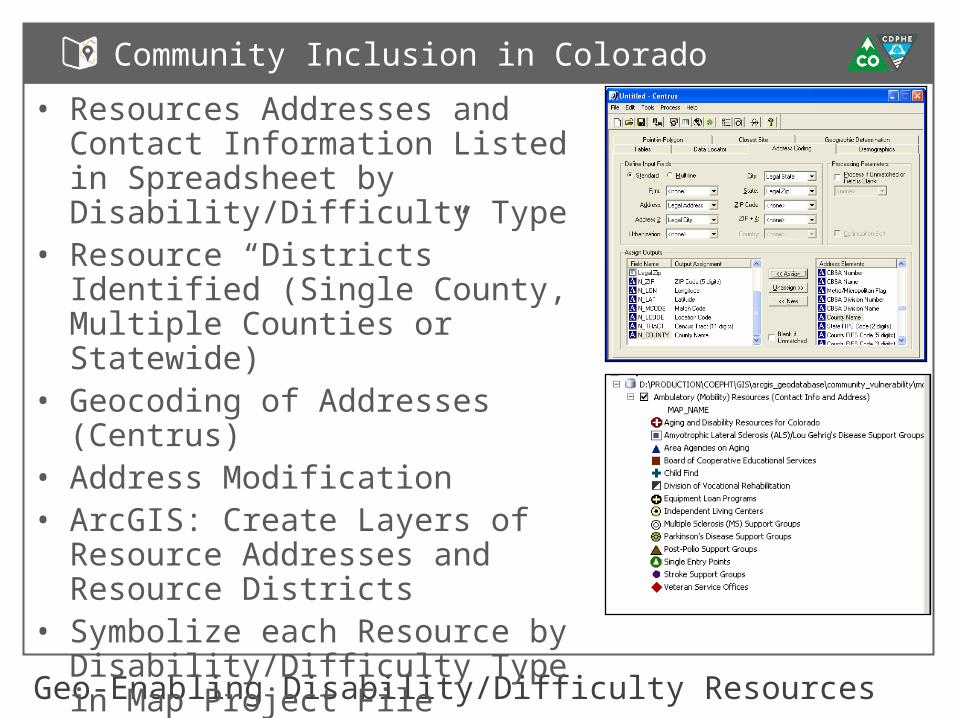
Geo-Enabling Disability/Difficulty Resources
Community Inclusion in Colorado
• Resources Addresses and Contact Information Listed in Spreadsheet by Disability/Difficulty Type
• Resource “Districts” Identified (Single County, Multiple Counties or Statewide)
• Geocoding of Addresses (Centrus)
• Address Modification• ArcGIS: Create Layers of
Resource Addresses and Resource Districts
• Symbolize each Resource by Disability/Difficulty Type in Map Project File
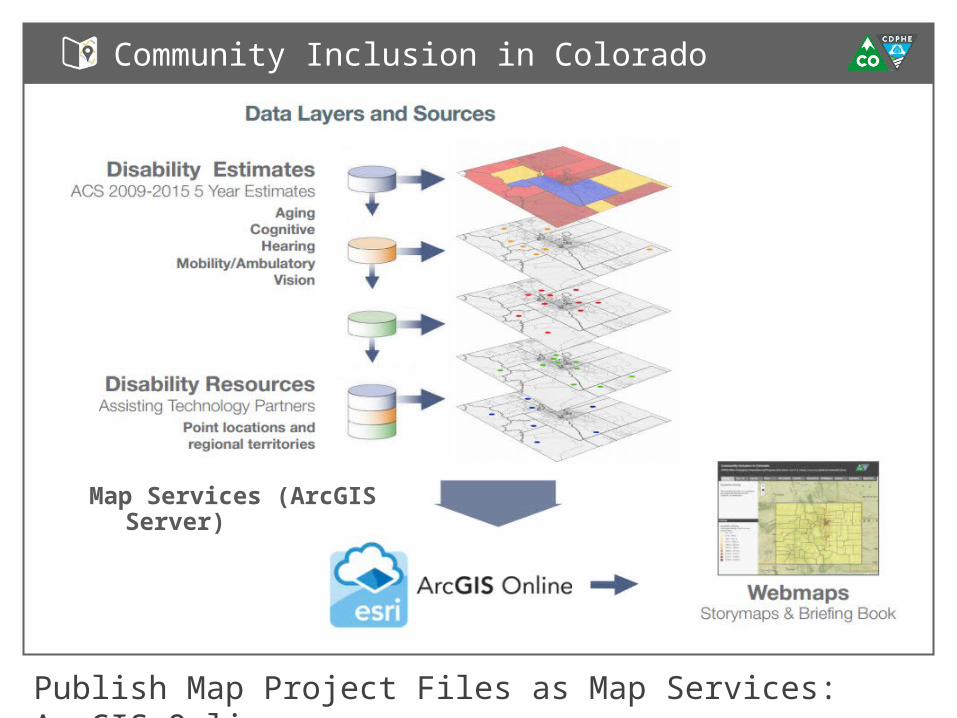
Publish Map Project Files as Map Services: ArcGIS Online
Community Inclusion in Colorado
Map Services (ArcGIS Server)
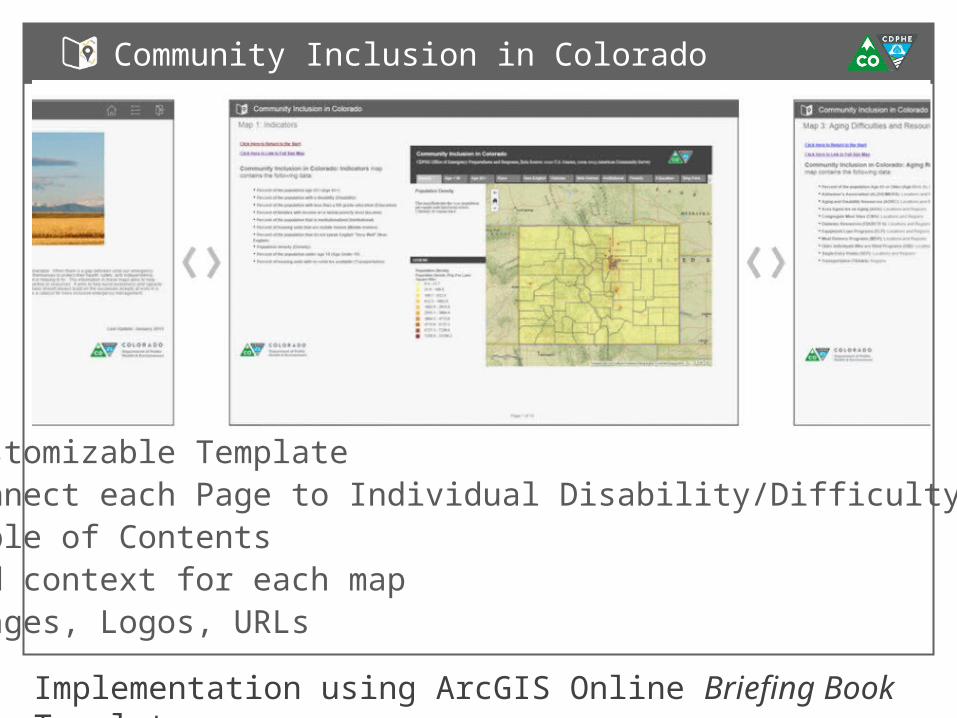
Implementation using ArcGIS Online Briefing Book Template
Community Inclusion in Colorado
• Customizable Template • Connect each Page to Individual Disability/Difficulty StoryMap• Table of Contents • Add context for each map• Images, Logos, URLs
Community Inclusion in Colorado
• Partner Feedback• SURPRISE!
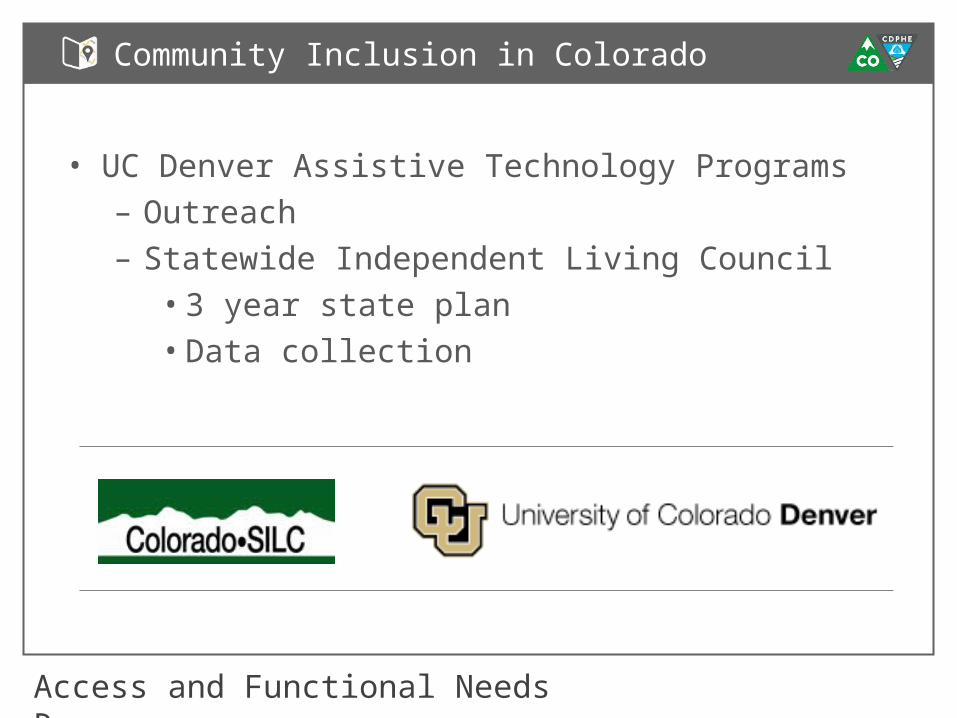
Access and Functional Needs Resources
Community Inclusion in Colorado
• UC Denver Assistive Technology Programs– Outreach– Statewide Independent Living Council• 3 year state plan• Data collection

State Independent Living Council Goals
Community Inclusion in Colorado
• Identify disability population hubs in both rural and urban areas to allow for more targeted outreach and efficient use of resources.
• Identify and map information to create an understanding of service areas. – Existing services & support groups– Disability by type and by age– Homeless populations (Point in time survey)
• Work together to increase the capacity to provide services throughout catchment areas
Outcomes
Community Inclusion in Colorado
• Compilation of information delineating existing populations of and services already in existence for Colorado’s citizens with significant disabilities
• Compile information to guide outreach to underserved communities in Colorado
• Use maps to identify potential collaborations with local support groups and service providers
• Provide educational and other events through collaborations with local agencies
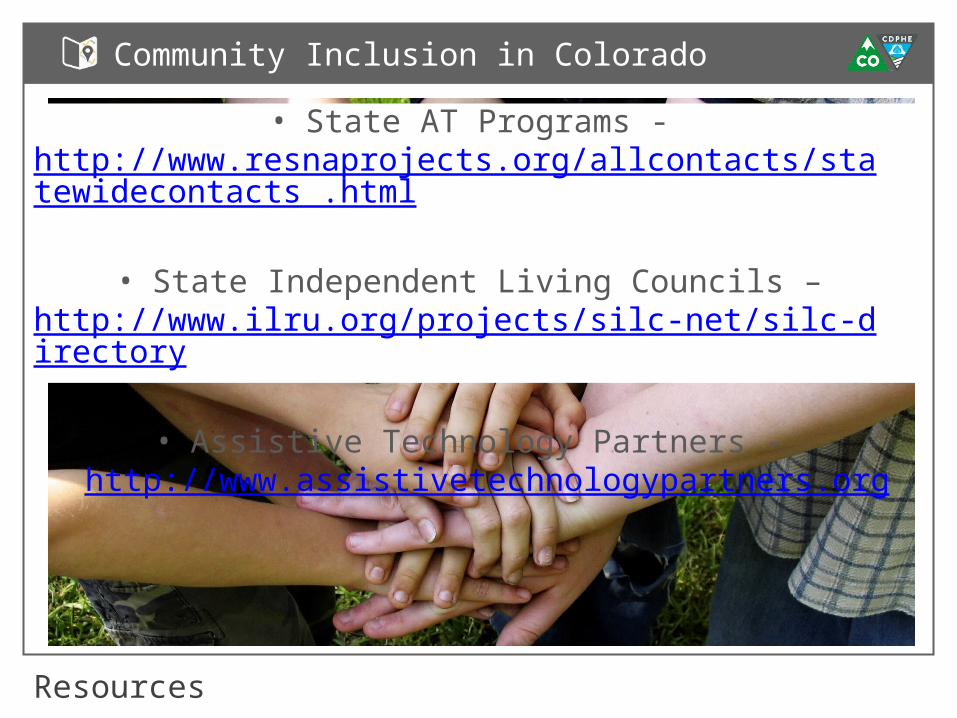
Resources
Community Inclusion in Colorado
• State AT Programs - http://www.resnaprojects.org/allcontacts/statewidecontacts .html
• State Independent Living Councils –
http://www.ilru.org/projects/silc-net/silc-directory • Assistive Technology Partners -
http://www.assistivetechnologypartners.org
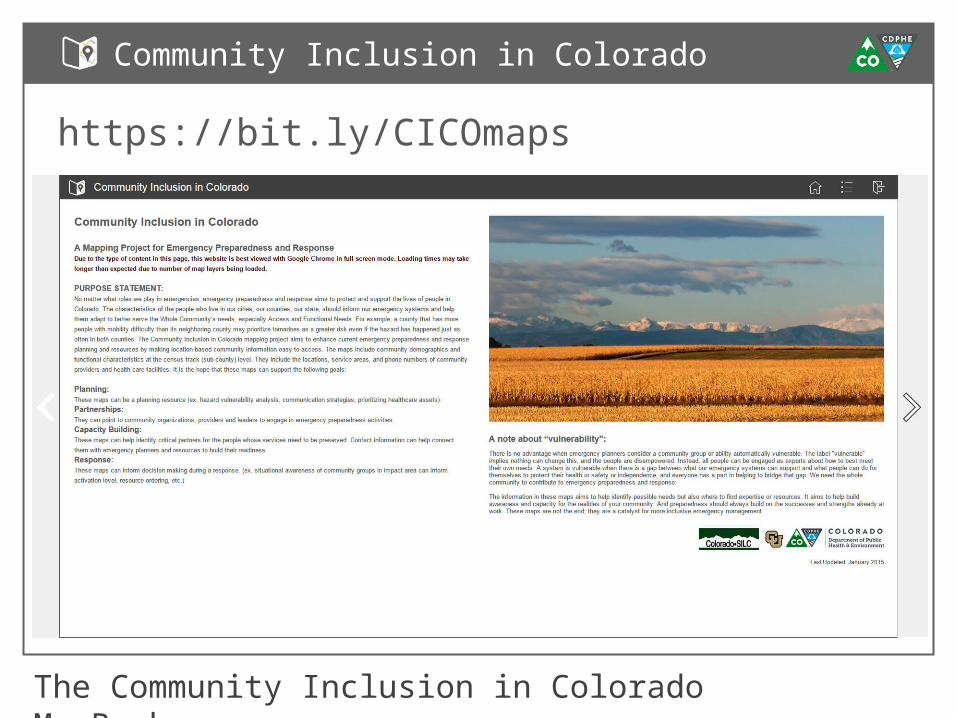
The Community Inclusion in Colorado MapBook
Community Inclusion in Colorado
https://bit.ly/CICOmaps
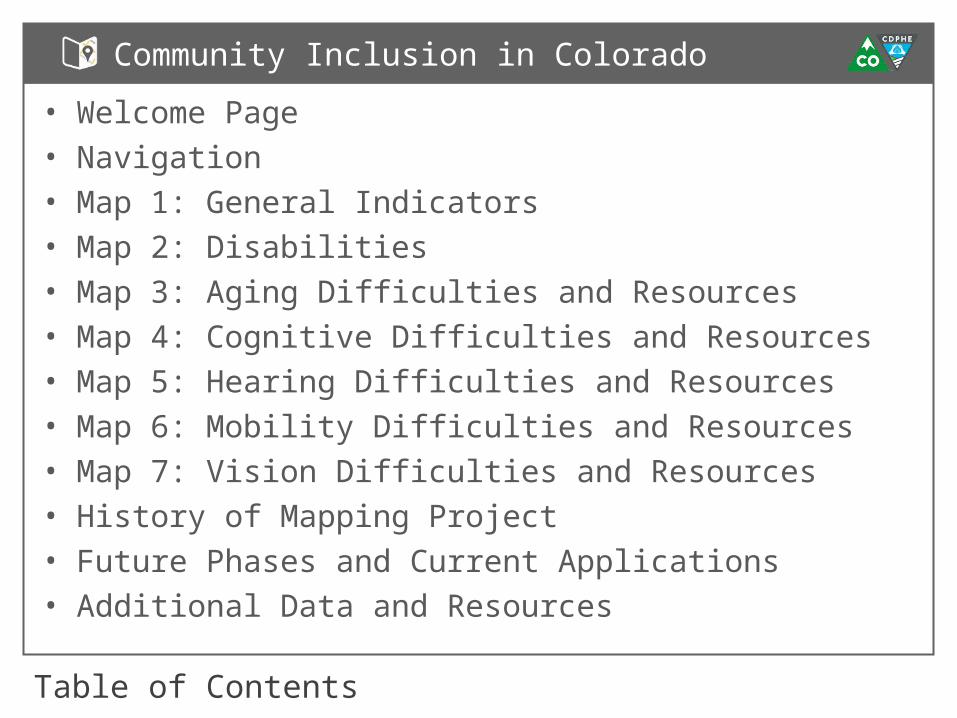
Table of Contents
Community Inclusion in Colorado
• Welcome Page• Navigation • Map 1: General Indicators• Map 2: Disabilities• Map 3: Aging Difficulties and Resources• Map 4: Cognitive Difficulties and Resources• Map 5: Hearing Difficulties and Resources• Map 6: Mobility Difficulties and Resources• Map 7: Vision Difficulties and Resources• History of Mapping Project• Future Phases and Current Applications• Additional Data and Resources
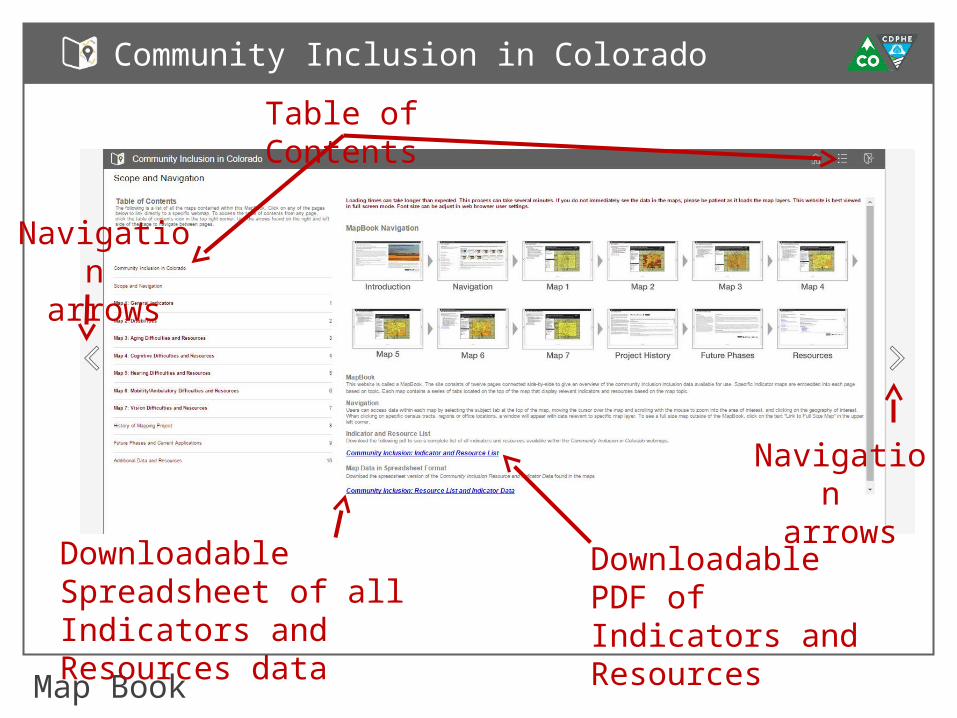
Map Book
Community Inclusion in Colorado
Table of Contents
Downloadable PDF of Indicators and Resources
Navigation arrows
Navigation arrows
Downloadable Spreadsheet of all Indicators and Resources data
Map Book
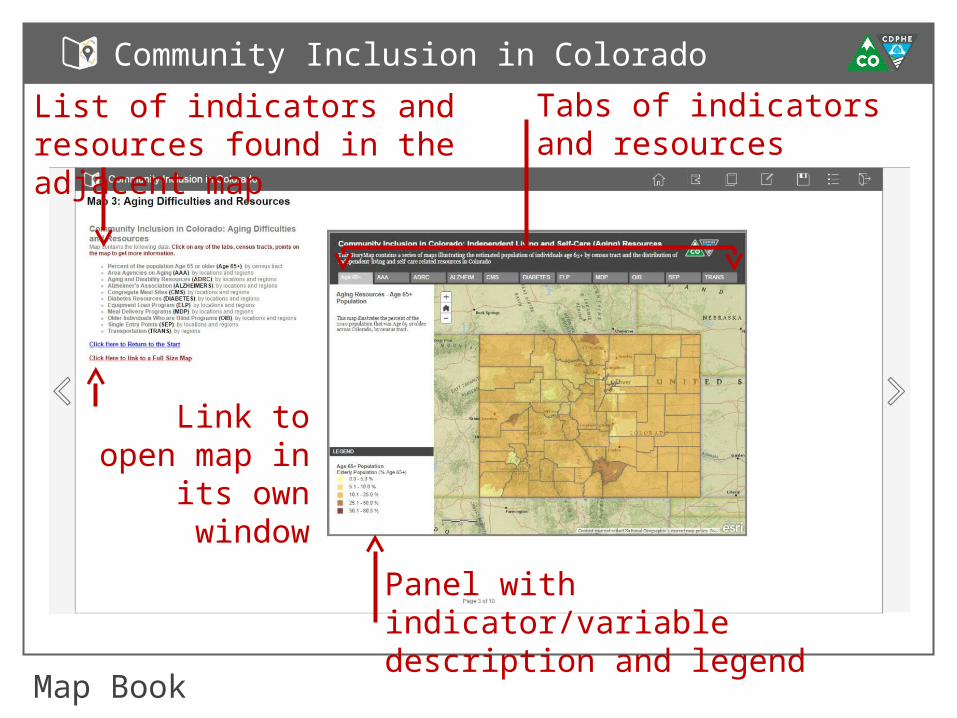
Community Inclusion in Colorado
Tabs of indicators and resources
List of indicators and resources found in the adjacent map
Link to open map in its
own window
Panel with indicator/variable description and legend
Map Book
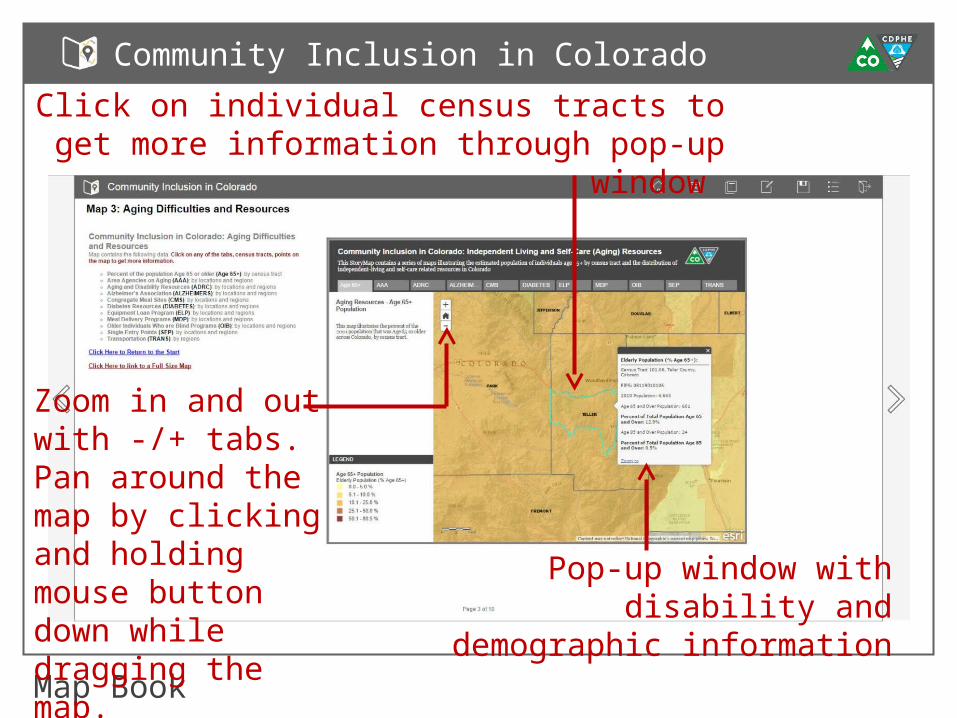
Community Inclusion in Colorado
Zoom in and out with -/+ tabs. Pan around the map by clicking and holding mouse button down while dragging the map.
Click on individual census tracts to get more information through pop-up window
Pop-up window with disability and demographic
information
Map Book
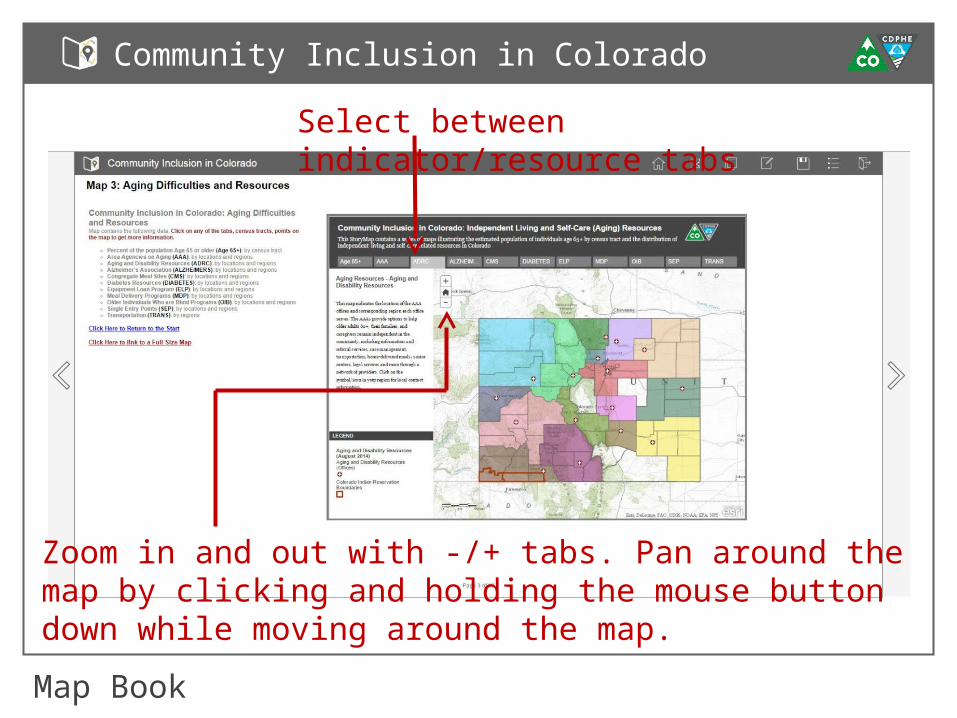
Community Inclusion in Colorado
Select between indicator/resource tabs
Zoom in and out with -/+ tabs. Pan around the map by clicking and holding the mouse button down while moving around the map.
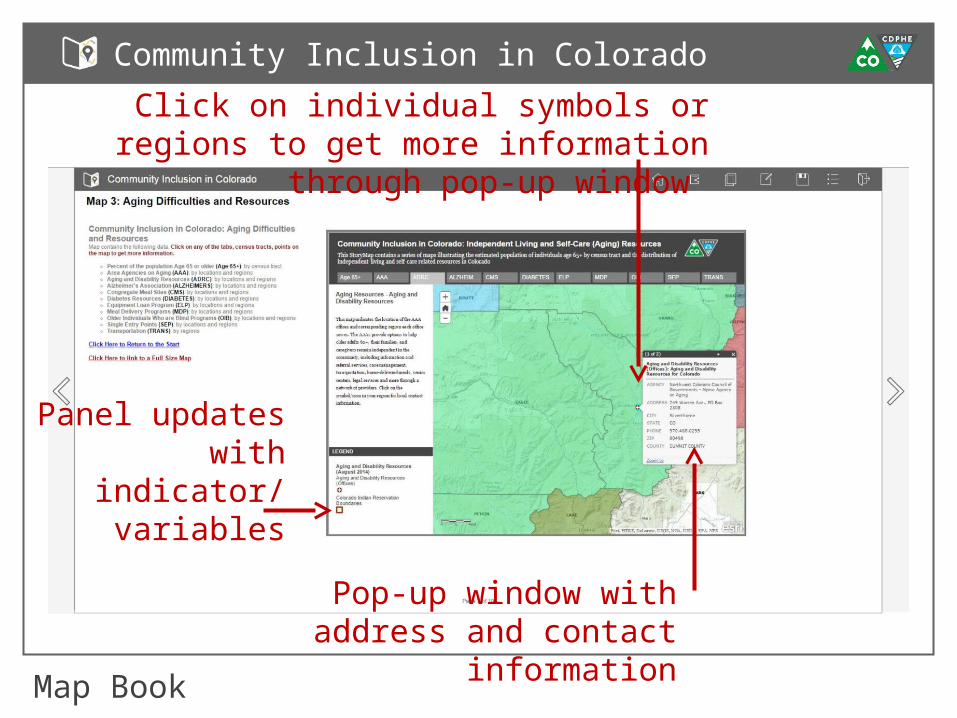
Map Book
Community Inclusion in Colorado
Click on individual symbols or regions to get more information through pop-up
window
Pop-up window with address and contact
information
Panel updates with indicator/
variables
Current Applications
Community Inclusion in Colorado
• Joint Risk Assessment Guidance • PHEP/HPP application• State Resilience Workgroup• Other partners
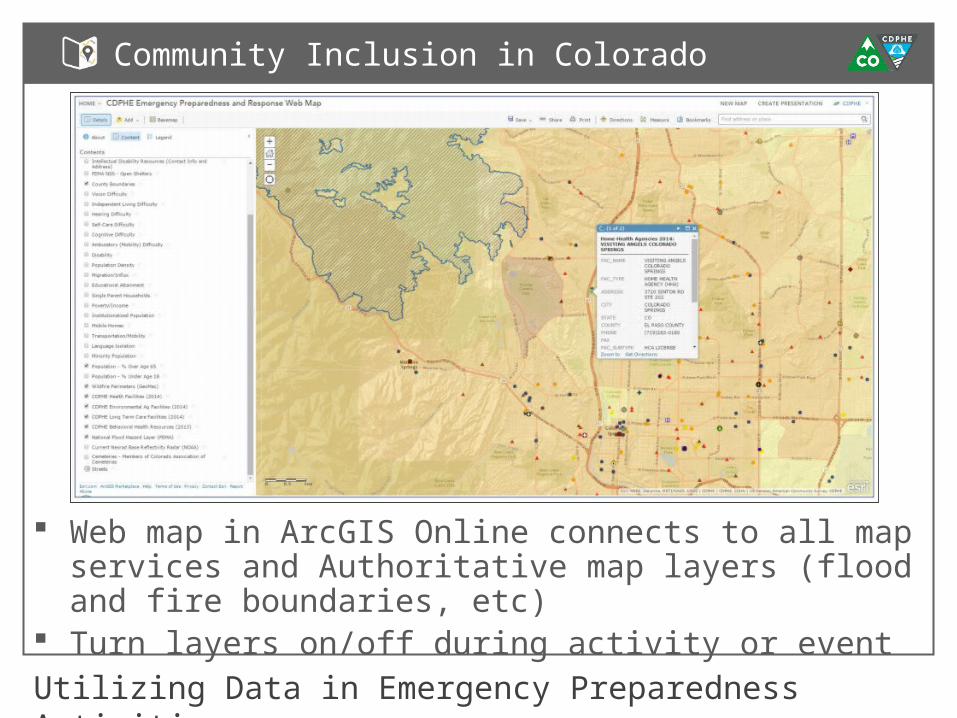
Utilizing Data in Emergency Preparedness Activities
Community Inclusion in Colorado
Web map in ArcGIS Online connects to all map services and Authoritative map layers (flood and fire boundaries, etc)
Turn layers on/off during activity or event
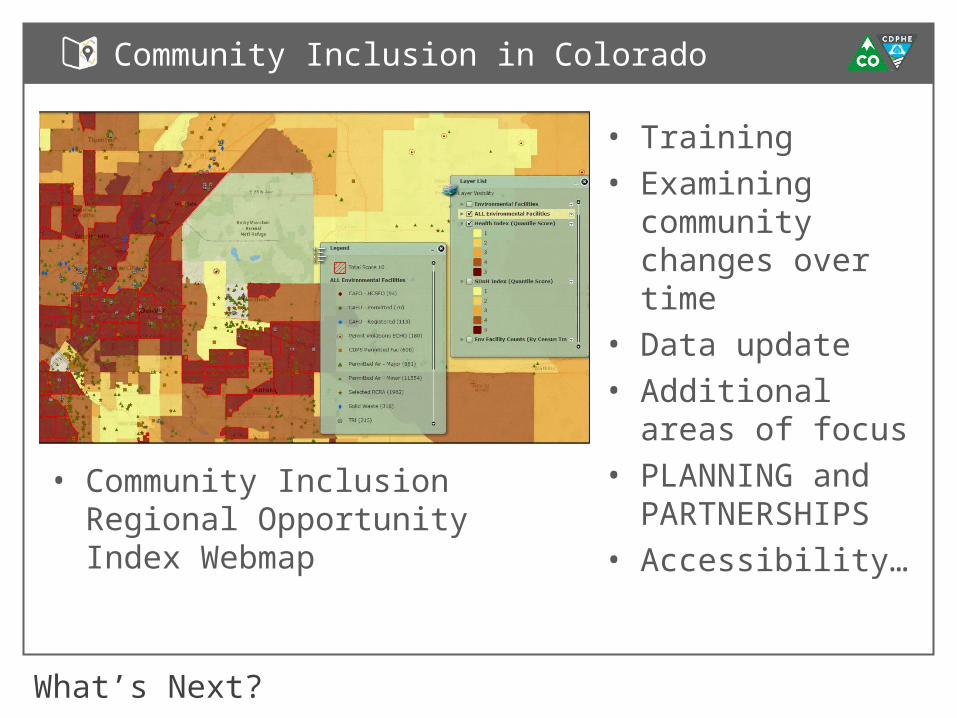
What’s Next?
Community Inclusion in Colorado
• Training• Examining
community changes over time
• Data update• Additional areas
of focus• PLANNING and
PARTNERSHIPS • Accessibility…
• Community Inclusion Regional Opportunity Index Webmap
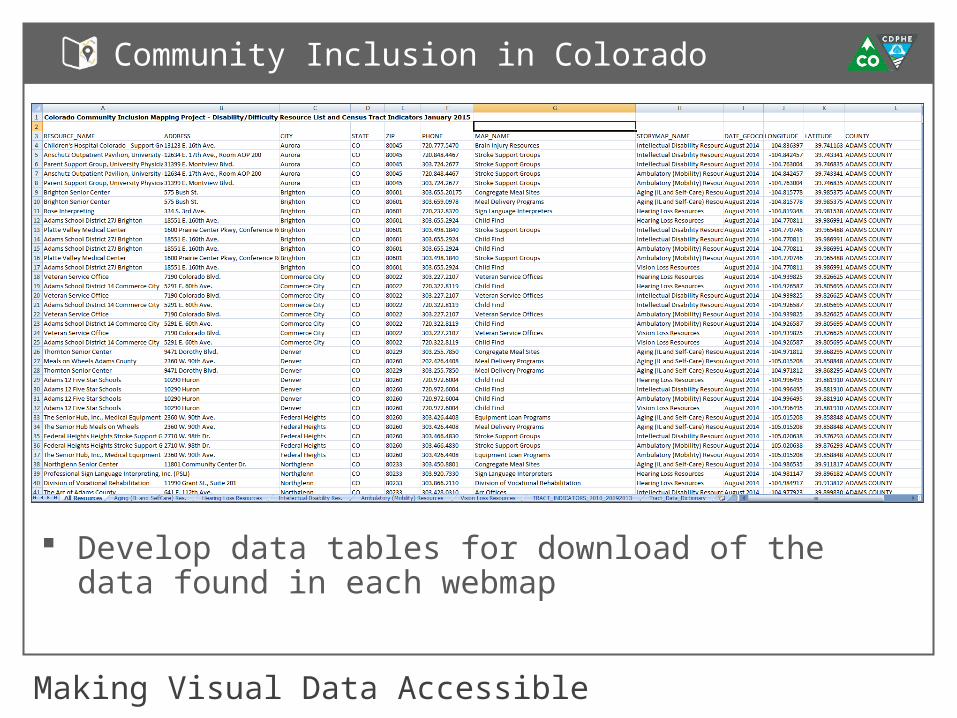
Making Visual Data Accessible
Community Inclusion in Colorado
Develop data tables for download of the data found in each webmap
Community Inclusion in Colorado
Questions or suggestions?
Aimee Voth Siebert, MA - [email protected]
Julia Beems, MA – [email protected]
Rachel Coles, MA - [email protected]
Devon Williford, MPH – [email protected]
Adam Anderson, MURP, MPH – [email protected]
March 2015