Embed Size (px)
Citation preview
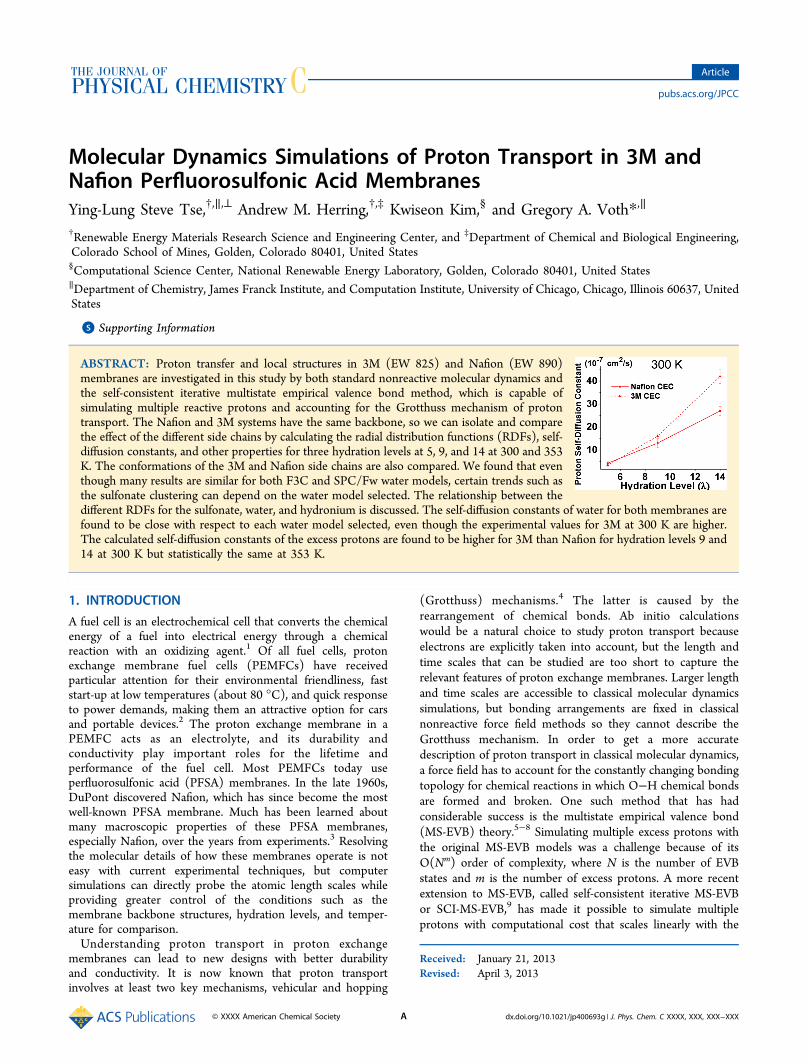
Molecular Dynamics Simulations of Proton Transport in 3M andNafion Perfluorosulfonic Acid MembranesYing-Lung Steve Tse,†,∥,⊥ Andrew M. Herring,†,‡ Kwiseon Kim,§ and Gregory A. Voth*,∥
†Renewable Energy Materials Research Science and Engineering Center, and ‡Department of Chemical and Biological Engineering,Colorado School of Mines, Golden, Colorado 80401, United States§Computational Science Center, National Renewable Energy Laboratory, Golden, Colorado 80401, United States∥Department of Chemistry, James Franck Institute, and Computation Institute, University of Chicago, Chicago, Illinois 60637, UnitedStates
*S Supporting Information
ABSTRACT: Proton transfer and local structures in 3M (EW 825) and Nafion (EW 890)membranes are investigated in this study by both standard nonreactive molecular dynamics andthe self-consistent iterative multistate empirical valence bond method, which is capable ofsimulating multiple reactive protons and accounting for the Grotthuss mechanism of protontransport. The Nafion and 3M systems have the same backbone, so we can isolate and comparethe effect of the different side chains by calculating the radial distribution functions (RDFs), self-diffusion constants, and other properties for three hydration levels at 5, 9, and 14 at 300 and 353K. The conformations of the 3M and Nafion side chains are also compared. We found that eventhough many results are similar for both F3C and SPC/Fw water models, certain trends such asthe sulfonate clustering can depend on the water model selected. The relationship between thedifferent RDFs for the sulfonate, water, and hydronium is discussed. The self-diffusion constants of water for both membranes arefound to be close with respect to each water model selected, even though the experimental values for 3M at 300 K are higher.The calculated self-diffusion constants of the excess protons are found to be higher for 3M than Nafion for hydration levels 9 and14 at 300 K but statistically the same at 353 K.
1. INTRODUCTION
A fuel cell is an electrochemical cell that converts the chemicalenergy of a fuel into electrical energy through a chemicalreaction with an oxidizing agent.1 Of all fuel cells, protonexchange membrane fuel cells (PEMFCs) have receivedparticular attention for their environmental friendliness, faststart-up at low temperatures (about 80 °C), and quick responseto power demands, making them an attractive option for carsand portable devices.2 The proton exchange membrane in aPEMFC acts as an electrolyte, and its durability andconductivity play important roles for the lifetime andperformance of the fuel cell. Most PEMFCs today useperfluorosulfonic acid (PFSA) membranes. In the late 1960s,DuPont discovered Nafion, which has since become the mostwell-known PFSA membrane. Much has been learned aboutmany macroscopic properties of these PFSA membranes,especially Nafion, over the years from experiments.3 Resolvingthe molecular details of how these membranes operate is noteasy with current experimental techniques, but computersimulations can directly probe the atomic length scales whileproviding greater control of the conditions such as themembrane backbone structures, hydration levels, and temper-ature for comparison.Understanding proton transport in proton exchange
membranes can lead to new designs with better durabilityand conductivity. It is now known that proton transportinvolves at least two key mechanisms, vehicular and hopping
(Grotthuss) mechanisms.4 The latter is caused by therearrangement of chemical bonds. Ab initio calculationswould be a natural choice to study proton transport becauseelectrons are explicitly taken into account, but the length andtime scales that can be studied are too short to capture therelevant features of proton exchange membranes. Larger lengthand time scales are accessible to classical molecular dynamicssimulations, but bonding arrangements are fixed in classicalnonreactive force field methods so they cannot describe theGrotthuss mechanism. In order to get a more accuratedescription of proton transport in classical molecular dynamics,a force field has to account for the constantly changing bondingtopology for chemical reactions in which O−H chemical bondsare formed and broken. One such method that has hadconsiderable success is the multistate empirical valence bond(MS-EVB) theory.5−8 Simulating multiple excess protons withthe original MS-EVB models was a challenge because of itsO(Nm) order of complexity, where N is the number of EVBstates and m is the number of excess protons. A more recentextension to MS-EVB, called self-consistent iterative MS-EVBor SCI-MS-EVB,9 has made it possible to simulate multipleprotons with computational cost that scales linearly with the
Received: January 21, 2013Revised: April 3, 2013
Article
pubs.acs.org/JPCC
© XXXX American Chemical Society A dx.doi.org/10.1021/jp400693g | J. Phys. Chem. C XXXX, XXX, XXX−XXX
number of excess protons. This method is crucial in the studyof acidic systems such as PFSA membranes.Modifications to the pendant side chains can lead to
improved mechanical strength and conductivity performance.Two such examples are Hyflon (some different names for it areDow, Aquivion, or SSC membrane) and 3M PFSA membranes,both of which have a shorter side chain than Nafion.10,11
Experiments have shown that Hyflon and the 3M membranewith equivalent weight of about 900 or lower have betterconductivity than Nafion. Additionally, the 3M membrane wasshown to have a greater than 15-fold increase in durabilityunder accelerated fuel cell test conditions when compared withsimilar commercial PEMs.12 There have been simulationefforts13−15 to compare the structural and dynamical propertiesbetween Nafion and Hyflon. Even though interesting results forthe 3M membrane have been obtained from DFT and DPDcalculations,16−18 no comparison has yet been made betweenNafion and 3M using atomistic molecular dynamics simu-lations. Comparing the structural properties and protontransport of 3M with those of Nafion is the main focus ofthis paper. The simulation details are given in section 2, resultsand discussion in section 3, and finally the conclusions insection 4.
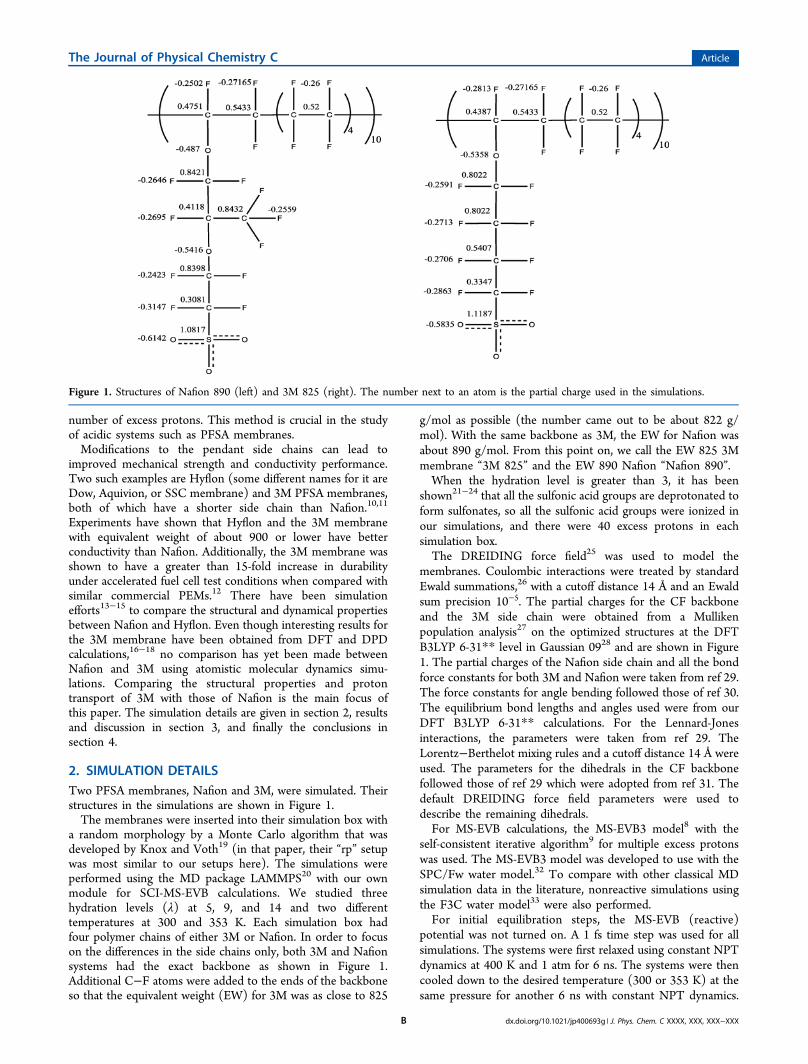
2. SIMULATION DETAILSTwo PFSA membranes, Nafion and 3M, were simulated. Theirstructures in the simulations are shown in Figure 1.The membranes were inserted into their simulation box with
a random morphology by a Monte Carlo algorithm that wasdeveloped by Knox and Voth19 (in that paper, their “rp” setupwas most similar to our setups here). The simulations wereperformed using the MD package LAMMPS20 with our ownmodule for SCI-MS-EVB calculations. We studied threehydration levels (λ) at 5, 9, and 14 and two differenttemperatures at 300 and 353 K. Each simulation box hadfour polymer chains of either 3M or Nafion. In order to focuson the differences in the side chains only, both 3M and Nafionsystems had the exact backbone as shown in Figure 1.Additional C−F atoms were added to the ends of the backboneso that the equivalent weight (EW) for 3M was as close to 825
g/mol as possible (the number came out to be about 822 g/mol). With the same backbone as 3M, the EW for Nafion wasabout 890 g/mol. From this point on, we call the EW 825 3Mmembrane “3M 825” and the EW 890 Nafion “Nafion 890”.When the hydration level is greater than 3, it has been
shown21−24 that all the sulfonic acid groups are deprotonated toform sulfonates, so all the sulfonic acid groups were ionized inour simulations, and there were 40 excess protons in eachsimulation box.The DREIDING force field25 was used to model the
membranes. Coulombic interactions were treated by standardEwald summations,26 with a cutoff distance 14 Å and an Ewaldsum precision 10−5. The partial charges for the CF backboneand the 3M side chain were obtained from a Mullikenpopulation analysis27 on the optimized structures at the DFTB3LYP 6-31** level in Gaussian 0928 and are shown in Figure1. The partial charges of the Nafion side chain and all the bondforce constants for both 3M and Nafion were taken from ref 29.The force constants for angle bending followed those of ref 30.The equilibrium bond lengths and angles used were from ourDFT B3LYP 6-31** calculations. For the Lennard-Jonesinteractions, the parameters were taken from ref 29. TheLorentz−Berthelot mixing rules and a cutoff distance 14 Å wereused. The parameters for the dihedrals in the CF backbonefollowed those of ref 29 which were adopted from ref 31. Thedefault DREIDING force field parameters were used todescribe the remaining dihedrals.For MS-EVB calculations, the MS-EVB3 model8 with the
self-consistent iterative algorithm9 for multiple excess protonswas used. The MS-EVB3 model was developed to use with theSPC/Fw water model.32 To compare with other classical MDsimulation data in the literature, nonreactive simulations usingthe F3C water model33 were also performed.For initial equilibration steps, the MS-EVB (reactive)
potential was not turned on. A 1 fs time step was used for allsimulations. The systems were first relaxed using constant NPTdynamics at 400 K and 1 atm for 6 ns. The systems were thencooled down to the desired temperature (300 or 353 K) at thesame pressure for another 6 ns with constant NPT dynamics.
Figure 1. Structures of Nafion 890 (left) and 3M 825 (right). The number next to an atom is the partial charge used in the simulations.
The Journal of Physical Chemistry C Article
dx.doi.org/10.1021/jp400693g | J. Phys. Chem. C XXXX, XXX, XXX−XXXB
The systems were further equilibrated with constant NVTdynamics at the desired temperature for an additional 11 ns.After equilibration, six configurations from the last 2.5 ns of
the NVT trajectory were chosen to become the initial states inconstant NVE simulations that followed. For classicalcalculations, data was then collected from six 5-ns trajectoriesin constant NVE dynamics. For MS-EVB calculations, thestructures were further equilibrated at constant NVT with thereactive potential turned on for 200 ps, before data for eachsystem was collected from six 1-ns constant NVE trajectories.
3. RESULTS AND DISCUSSION
In this section, we look at different equilibrium and dynamicalproperties for 3M and Nafion and compare their differences.The local interactions, described by the RDFs, between twosulfonate sulfurs (S−S), between sulfonate sulfur and wateroxygen (S−OW), and between sulfonate sulfur and hydroniumoxygen (S−OH) as well as the size of water clusters provideinformation about the local environment felt by the protons.The RDF between sulfonate and proton center of effect charge(S−CEC) is last introduced because it can be seen as anextension of the RDF S−OH. Since the main focus in thispaper is to study the differences coming from the side chains,their distributions of conformations are also studied andcompared. Finally, dynamical quantities such as the mean-squared displacements (MSDs) of water and proton CEC areanalyzed. From the MSDs, the water and excess proton self-
diffusion constants are then calculated and can be directlycompared with experimental data.
Density. The density values after equilibration range from1.54 to 1.79 g/cm3. As hydration level (λ) increases, themembrane “swells” more and its density decreases. As expected,the density decreases as temperatures increases. Using eitherwater model gives very similar densities. All the density valuesare shown in the Supporting Information (Table S1).
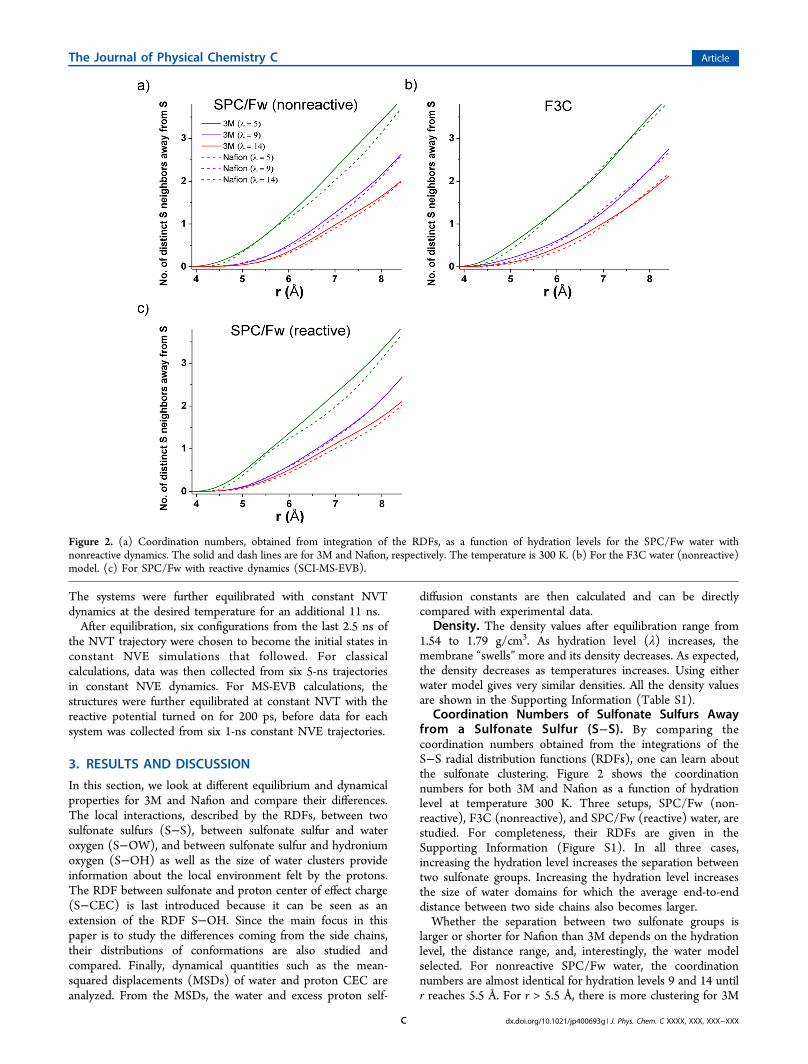
Coordination Numbers of Sulfonate Sulfurs Awayfrom a Sulfonate Sulfur (S−S). By comparing thecoordination numbers obtained from the integrations of theS−S radial distribution functions (RDFs), one can learn aboutthe sulfonate clustering. Figure 2 shows the coordinationnumbers for both 3M and Nafion as a function of hydrationlevel at temperature 300 K. Three setups, SPC/Fw (non-reactive), F3C (nonreactive), and SPC/Fw (reactive) water, arestudied. For completeness, their RDFs are given in theSupporting Information (Figure S1). In all three cases,increasing the hydration level increases the separation betweentwo sulfonate groups. Increasing the hydration level increasesthe size of water domains for which the average end-to-enddistance between two side chains also becomes larger.Whether the separation between two sulfonate groups is
larger or shorter for Nafion than 3M depends on the hydrationlevel, the distance range, and, interestingly, the water modelselected. For nonreactive SPC/Fw water, the coordinationnumbers are almost identical for hydration levels 9 and 14 untilr reaches 5.5 Å. For r > 5.5 Å, there is more clustering for 3M
Figure 2. (a) Coordination numbers, obtained from integration of the RDFs, as a function of hydration levels for the SPC/Fw water withnonreactive dynamics. The solid and dash lines are for 3M and Nafion, respectively. The temperature is 300 K. (b) For the F3C water (nonreactive)model. (c) For SPC/Fw with reactive dynamics (SCI-MS-EVB).
The Journal of Physical Chemistry C Article
dx.doi.org/10.1021/jp400693g | J. Phys. Chem. C XXXX, XXX, XXX−XXXC
than Nafion. For hydration level 5, there tends to be moreclustering for 3M except at around 5.5 Å where clustering isabout equal for both membranes. However, when the selectedwater model is F3C, there is clearly more clustering in 3M thanNafion for r < 6 Å for all three hydration levels, but no cleartrends for levels 5 and 9 for r > 6 Å. Even though it is hard toconfirm how the S−S distances differ in the two membraneswithout experimental data, what is shown here is that theinteractions between the sulfonates and water play animportant role in sulfonate clustering. Such comparison forsulfonate clustering was made for Hyflon and Nafion previouslyby Karo et al.,34 Devanathan and Dupuis,15 and Lui et al.14 Thefirst two references in which the F3C water model was usedfound there is more clustering in Hyflon, whereas Lui et al. whoused a flexible TIP3P water model found more clustering inNafion. The different water models selected might haveattributed to the discrepancy, similar to the differences thatwere observed here between SPC/Fw and F3C for Nafion and3M.Figure 2c shows the MS-EVB data for reactive SPC/Fw
water. We found that reactive hydrated proton dynamicsgenerally have only a small impact on the RDFs and the
corresponding coordination numbers. For this reason, exceptfor quantities that are related to the hydrated proton center ofexcess charge (defined later), RDFs from only nonreactive dataare shown.
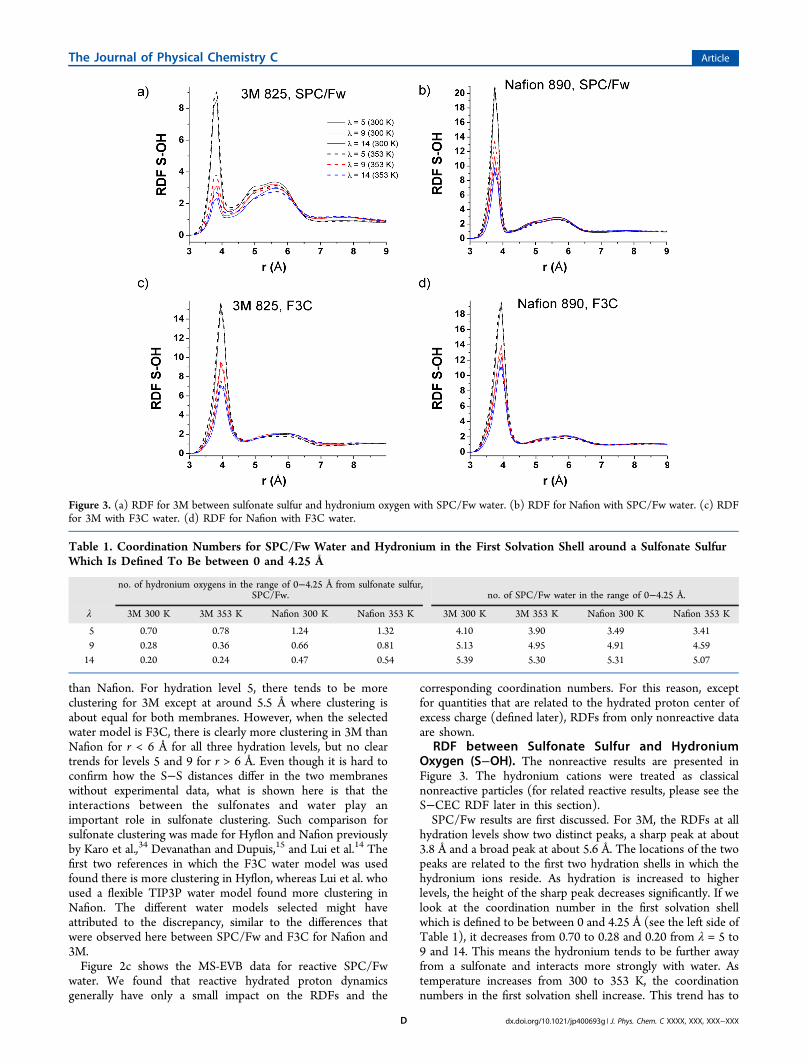
RDF between Sulfonate Sulfur and HydroniumOxygen (S−OH). The nonreactive results are presented inFigure 3. The hydronium cations were treated as classicalnonreactive particles (for related reactive results, please see theS−CEC RDF later in this section).SPC/Fw results are first discussed. For 3M, the RDFs at all
hydration levels show two distinct peaks, a sharp peak at about3.8 Å and a broad peak at about 5.6 Å. The locations of the twopeaks are related to the first two hydration shells in which thehydronium ions reside. As hydration is increased to higherlevels, the height of the sharp peak decreases significantly. If welook at the coordination number in the first solvation shellwhich is defined to be between 0 and 4.25 Å (see the left side ofTable 1), it decreases from 0.70 to 0.28 and 0.20 from λ = 5 to9 and 14. This means the hydronium tends to be further awayfrom a sulfonate and interacts more strongly with water. Astemperature increases from 300 to 353 K, the coordinationnumbers in the first solvation shell increase. This trend has to
Figure 3. (a) RDF for 3M between sulfonate sulfur and hydronium oxygen with SPC/Fw water. (b) RDF for Nafion with SPC/Fw water. (c) RDFfor 3M with F3C water. (d) RDF for Nafion with F3C water.
Table 1. Coordination Numbers for SPC/Fw Water and Hydronium in the First Solvation Shell around a Sulfonate SulfurWhich Is Defined To Be between 0 and 4.25 Å
no. of hydronium oxygens in the range of 0−4.25 Å from sulfonate sulfur,SPC/Fw. no. of SPC/Fw water in the range of 0−4.25 Å.
λ 3M 300 K 3M 353 K Nafion 300 K Nafion 353 K 3M 300 K 3M 353 K Nafion 300 K Nafion 353 K
5 0.70 0.78 1.24 1.32 4.10 3.90 3.49 3.419 0.28 0.36 0.66 0.81 5.13 4.95 4.91 4.5914 0.20 0.24 0.47 0.54 5.39 5.30 5.31 5.07
The Journal of Physical Chemistry C Article
dx.doi.org/10.1021/jp400693g | J. Phys. Chem. C XXXX, XXX, XXX−XXXD
do with the number of water neighbors clustering around asulfonate as we will see next. When there is more watercompeting for the attention of the sulfonate groups andhydronium ions, there seems to be less attraction between thesulfonate and the hydronium.For Nafion, the same tall and broad peaks like those of 3M
are present, but the tall peak has a much higher height than thatof the 3M peak under the same conditions. This partially has todo with the more negative partial charges used for the sulfonateoxygens in Nafion, and this causes a higher hydronium densityin the first solvation shell for Nafion than 3M at all hydrationlevels and temperatures.For the F3C water model, many of the trends remain the
same, but the most notable difference is the width of the firstpeak that is considerably larger than that of SPC/Fw. Thecoordination number for the first peak is twice as large for F3C(see the Supporting Information, Table S2) when compared toSPC/Fw, implying there is a stronger attraction between thesulfonate and the hydronium in the F3C than in the SPC/Fwwater model. The same RDFs for Nafion have been reported inref 34 and are consistent with our results.RDF between Sulfonate Sulfur and Water Oxygen (S−
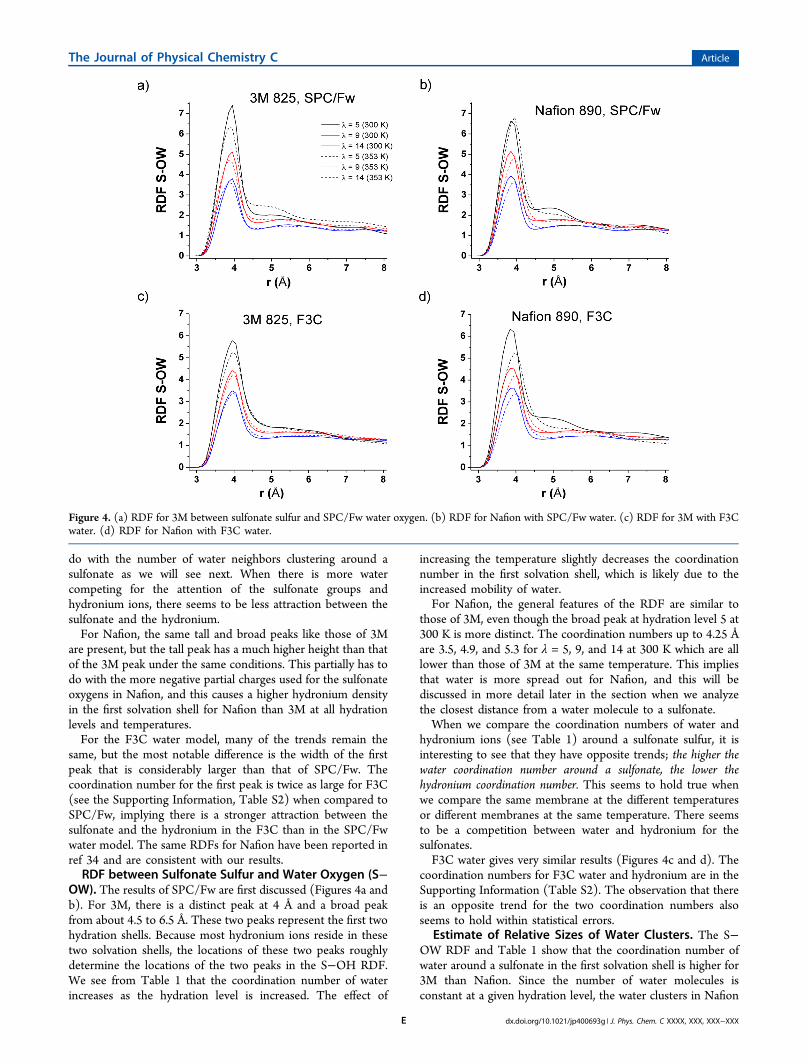
OW). The results of SPC/Fw are first discussed (Figures 4a andb). For 3M, there is a distinct peak at 4 Å and a broad peakfrom about 4.5 to 6.5 Å. These two peaks represent the first twohydration shells. Because most hydronium ions reside in thesetwo solvation shells, the locations of these two peaks roughlydetermine the locations of the two peaks in the S−OH RDF.We see from Table 1 that the coordination number of waterincreases as the hydration level is increased. The effect of
increasing the temperature slightly decreases the coordinationnumber in the first solvation shell, which is likely due to theincreased mobility of water.For Nafion, the general features of the RDF are similar to
those of 3M, even though the broad peak at hydration level 5 at300 K is more distinct. The coordination numbers up to 4.25 Åare 3.5, 4.9, and 5.3 for λ = 5, 9, and 14 at 300 K which are alllower than those of 3M at the same temperature. This impliesthat water is more spread out for Nafion, and this will bediscussed in more detail later in the section when we analyzethe closest distance from a water molecule to a sulfonate.When we compare the coordination numbers of water and
hydronium ions (see Table 1) around a sulfonate sulfur, it isinteresting to see that they have opposite trends; the higher thewater coordination number around a sulfonate, the lower thehydronium coordination number. This seems to hold true whenwe compare the same membrane at the different temperaturesor different membranes at the same temperature. There seemsto be a competition between water and hydronium for thesulfonates.F3C water gives very similar results (Figures 4c and d). The
coordination numbers for F3C water and hydronium are in theSupporting Information (Table S2). The observation that thereis an opposite trend for the two coordination numbers alsoseems to hold within statistical errors.
Estimate of Relative Sizes of Water Clusters. The S−OW RDF and Table 1 show that the coordination number ofwater around a sulfonate in the first solvation shell is higher for3M than Nafion. Since the number of water molecules isconstant at a given hydration level, the water clusters in Nafion
Figure 4. (a) RDF for 3M between sulfonate sulfur and SPC/Fw water oxygen. (b) RDF for Nafion with SPC/Fw water. (c) RDF for 3M with F3Cwater. (d) RDF for Nafion with F3C water.
The Journal of Physical Chemistry C Article
dx.doi.org/10.1021/jp400693g | J. Phys. Chem. C XXXX, XXX, XXX−XXXE
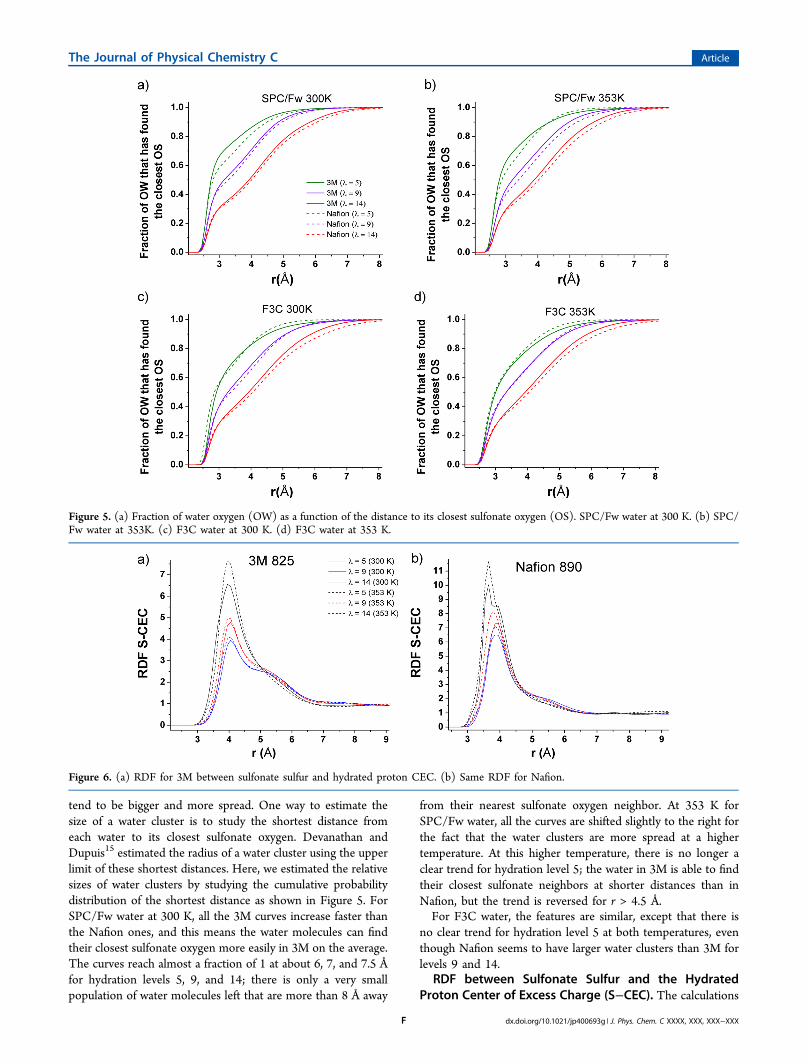
tend to be bigger and more spread. One way to estimate thesize of a water cluster is to study the shortest distance fromeach water to its closest sulfonate oxygen. Devanathan andDupuis15 estimated the radius of a water cluster using the upperlimit of these shortest distances. Here, we estimated the relativesizes of water clusters by studying the cumulative probabilitydistribution of the shortest distance as shown in Figure 5. ForSPC/Fw water at 300 K, all the 3M curves increase faster thanthe Nafion ones, and this means the water molecules can findtheir closest sulfonate oxygen more easily in 3M on the average.The curves reach almost a fraction of 1 at about 6, 7, and 7.5 Åfor hydration levels 5, 9, and 14; there is only a very smallpopulation of water molecules left that are more than 8 Å away
from their nearest sulfonate oxygen neighbor. At 353 K forSPC/Fw water, all the curves are shifted slightly to the right forthe fact that the water clusters are more spread at a highertemperature. At this higher temperature, there is no longer aclear trend for hydration level 5; the water in 3M is able to findtheir closest sulfonate neighbors at shorter distances than inNafion, but the trend is reversed for r > 4.5 Å.For F3C water, the features are similar, except that there is
no clear trend for hydration level 5 at both temperatures, eventhough Nafion seems to have larger water clusters than 3M forlevels 9 and 14.
RDF between Sulfonate Sulfur and the HydratedProton Center of Excess Charge (S−CEC). The calculations
Figure 5. (a) Fraction of water oxygen (OW) as a function of the distance to its closest sulfonate oxygen (OS). SPC/Fw water at 300 K. (b) SPC/Fw water at 353K. (c) F3C water at 300 K. (d) F3C water at 353 K.
Figure 6. (a) RDF for 3M between sulfonate sulfur and hydrated proton CEC. (b) Same RDF for Nafion.
The Journal of Physical Chemistry C Article
dx.doi.org/10.1021/jp400693g | J. Phys. Chem. C XXXX, XXX, XXX−XXXF
of the RDF between S and the hydrated proton center of excesscharge (CEC) discussed here require the use of the SCI-MS-EVB calculations. Because MS-EVB3 is parametrized using theSPC/Fw water, all the data found in this subsection weregenerated only with the SPC/Fw water model. Theintroduction of the CEC is required because in an EVBformulation, unlike a classical nonreactive force field, an excessproton is not located at a single location but at multiplelocations with different probability values assigned. Thelocation of the excess charge can be more accurately describedas a weighted average of all possible MS-EVB states. Thedefinition of the position vector of a CEC is therefore given by8
∑==
cr ri
N
ii
CEC1
2COC
(1)
where riCOC is the position vector of the center of charge of thehydronium cation of the ith EVB state, ci
2 is the probabilityweight for the ith EVB state, and N is the number of EVBstates.The results of the RDF between S and CEC are shown in
Figure 6. This RDF looks similar to the RDF between S andhydronium oxygen (S−OH) (Figure 3), because they are verymuch related to each other. The relationship is that a classicalhydronium can be approximated as the pivot hydronium thathas the largest EVB probability amplitude. Instead of putting allthe weight in a single hydronium at a definite location when wecount in the calculation of the RDF between S and OH, theRDF between S and CEC is similar to counting multiplepossible locations of the hydronium ion weighted by theircorresponding probability. Therefore, the peaks in the RDFbetween S and CEC are always broader than those in the RDFbetween S and OH. The S−CEC RDFs for 3M have one peakat about 4 Å and a shoulder from 4.8 to 6.5 Å, and theyoriginate from the same peaks in S−OH RDF. But now,because of the delocalized nature of excess charge by MS-EVB,the RDF is less structured and the two peaks are broader. Astemperature increases, the height of the first peak increases forthe same reasons why the first peak of RDF S−OH increases.As we shall see from the diffusion data that is presented later, ahigher temperature yields a faster diffusion constant for theCEC. One might think a faster-moving CEC would have a
more delocalized RDF, but this is not the case as we can see inthe figure. It seems that there is not a clear relationship betweenthe height of the peak and the magnitude of the diffusionconstant.For Nafion, there are also a peak near 4 Å and a shoulder
from 4.8 to 6.5 Å, but because of the scale of the vertical axis,the shoulder is not very noticeable. If we compare the peakheights in the Nafion RDFs with those of 3M, we can predictthat the peak in the Nafion S−OH RDF would be higher thanthat of 3M, and this is indeed the case. Moreover, both S−CECand S−OH RDFs show smaller second peak/shoulder forNafion.
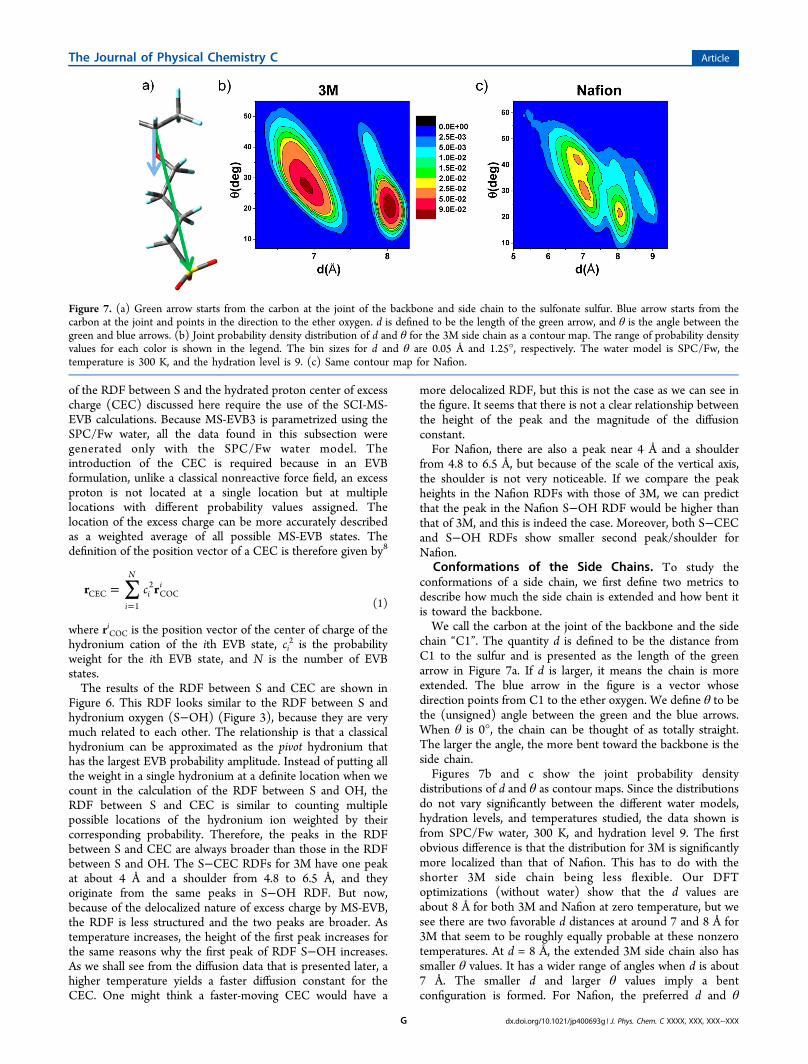
Conformations of the Side Chains. To study theconformations of a side chain, we first define two metrics todescribe how much the side chain is extended and how bent itis toward the backbone.We call the carbon at the joint of the backbone and the side
chain “C1”. The quantity d is defined to be the distance fromC1 to the sulfur and is presented as the length of the greenarrow in Figure 7a. If d is larger, it means the chain is moreextended. The blue arrow in the figure is a vector whosedirection points from C1 to the ether oxygen. We define θ to bethe (unsigned) angle between the green and the blue arrows.When θ is 0°, the chain can be thought of as totally straight.The larger the angle, the more bent toward the backbone is theside chain.Figures 7b and c show the joint probability density
distributions of d and θ as contour maps. Since the distributionsdo not vary significantly between the different water models,hydration levels, and temperatures studied, the data shown isfrom SPC/Fw water, 300 K, and hydration level 9. The firstobvious difference is that the distribution for 3M is significantlymore localized than that of Nafion. This has to do with theshorter 3M side chain being less flexible. Our DFToptimizations (without water) show that the d values areabout 8 Å for both 3M and Nafion at zero temperature, but wesee there are two favorable d distances at around 7 and 8 Å for3M that seem to be roughly equally probable at these nonzerotemperatures. At d = 8 Å, the extended 3M side chain also hassmaller θ values. It has a wider range of angles when d is about7 Å. The smaller d and larger θ values imply a bentconfiguration is formed. For Nafion, the preferred d and θ
Figure 7. (a) Green arrow starts from the carbon at the joint of the backbone and side chain to the sulfonate sulfur. Blue arrow starts from thecarbon at the joint and points in the direction to the ether oxygen. d is defined to be the length of the green arrow, and θ is the angle between thegreen and blue arrows. (b) Joint probability density distribution of d and θ for the 3M side chain as a contour map. The range of probability densityvalues for each color is shown in the legend. The bin sizes for d and θ are 0.05 Å and 1.25°, respectively. The water model is SPC/Fw, thetemperature is 300 K, and the hydration level is 9. (c) Same contour map for Nafion.
The Journal of Physical Chemistry C Article
dx.doi.org/10.1021/jp400693g | J. Phys. Chem. C XXXX, XXX, XXX−XXXG
are not as definite, but note the fact that the most probable dand θ for Nafion match those of 3M. However, for Nafion, theprobability weights in the other regions are not small andcannot be neglected. The mean of d for 3M is 7.3 Å withstandard deviation (σ) 0.57 Å and that of Nafion is 7.1 Å with σ= 0.73 Å. The mean of θ for 3M is 27.1° with σ = 7.9°, and thatof Nafion is 35.8° with σ = 12.2°. Within one standarddeviation, there is no statistical difference between the averagelength of the 3M side length and that of Nafion; even thoughthe mean θ for Nafion is larger than that of 3M, one should alsokeep in mind that the standard deviation is also considerablylarger. If we use the relationship between the free energy andthe probability, i.e., ΔF = −kBT ln(P1/P2), we see that theenergy barrier for the 3M side chain to move from the localminimum at d = 7 Å to the minimum at d = 8 Å is considerablyhigher than that of the Nafion side chain (approximately 4 kBTvs 2 kBT).Mean-Squared Displacements and Diffusion Con-
stants. The self-diffusion constant of water is an importantquantity because it is one of the few observables that can bedirectly compared between simulation and experiment.Through pulsed-field gradient spin−echo NMR (PFGSE-NMR) experiments, the self-diffusion constant of water inPFSA membranes can be estimated. On the other hand, in MDsimulations, the self-diffusion constant of a particle, like a watermolecule, can be estimated by studying its MSD which isdefined to be
∑= ⟨ | − | ⟩=
tN
tr rMSD( )1
( ) (0)i
N
i i1
2
(2)
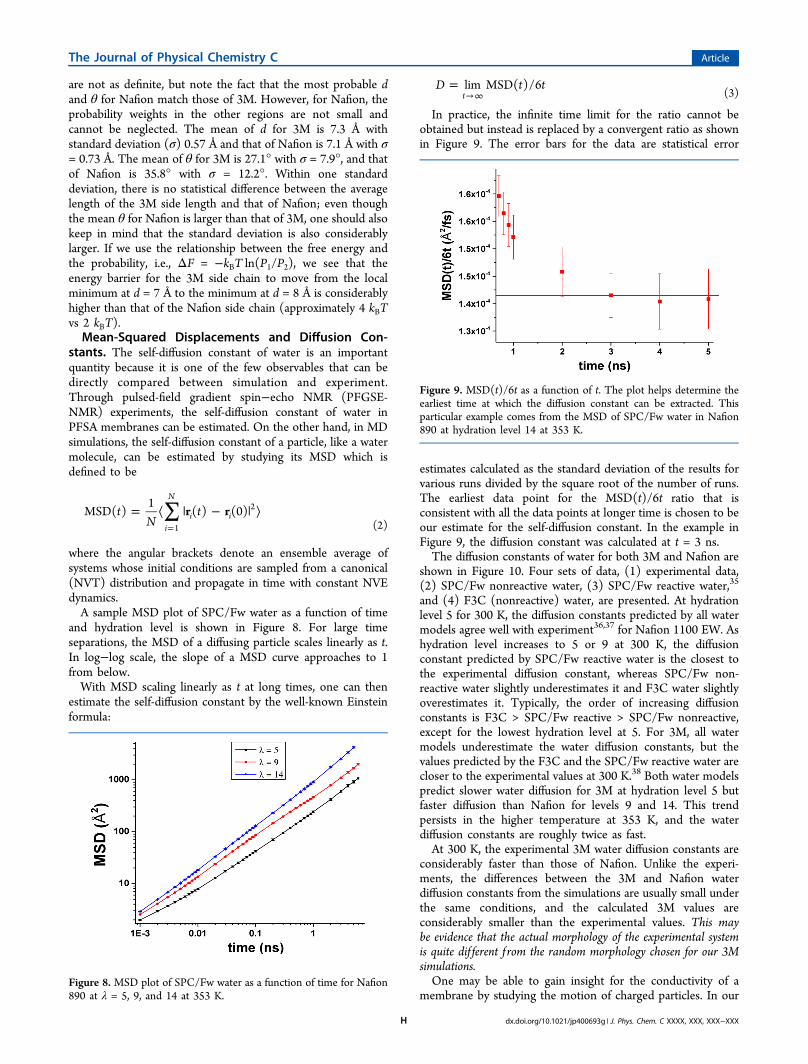
where the angular brackets denote an ensemble average ofsystems whose initial conditions are sampled from a canonical(NVT) distribution and propagate in time with constant NVEdynamics.A sample MSD plot of SPC/Fw water as a function of time
and hydration level is shown in Figure 8. For large timeseparations, the MSD of a diffusing particle scales linearly as t.In log−log scale, the slope of a MSD curve approaches to 1from below.With MSD scaling linearly as t at long times, one can then
estimate the self-diffusion constant by the well-known Einsteinformula:
=→∞
D t tlim MSD( )/6t (3)
In practice, the infinite time limit for the ratio cannot beobtained but instead is replaced by a convergent ratio as shownin Figure 9. The error bars for the data are statistical error
estimates calculated as the standard deviation of the results forvarious runs divided by the square root of the number of runs.The earliest data point for the MSD(t)/6t ratio that isconsistent with all the data points at longer time is chosen to beour estimate for the self-diffusion constant. In the example inFigure 9, the diffusion constant was calculated at t = 3 ns.The diffusion constants of water for both 3M and Nafion are
shown in Figure 10. Four sets of data, (1) experimental data,(2) SPC/Fw nonreactive water, (3) SPC/Fw reactive water,35
and (4) F3C (nonreactive) water, are presented. At hydrationlevel 5 for 300 K, the diffusion constants predicted by all watermodels agree well with experiment36,37 for Nafion 1100 EW. Ashydration level increases to 5 or 9 at 300 K, the diffusionconstant predicted by SPC/Fw reactive water is the closest tothe experimental diffusion constant, whereas SPC/Fw non-reactive water slightly underestimates it and F3C water slightlyoverestimates it. Typically, the order of increasing diffusionconstants is F3C > SPC/Fw reactive > SPC/Fw nonreactive,except for the lowest hydration level at 5. For 3M, all watermodels underestimate the water diffusion constants, but thevalues predicted by the F3C and the SPC/Fw reactive water arecloser to the experimental values at 300 K.38 Both water modelspredict slower water diffusion for 3M at hydration level 5 butfaster diffusion than Nafion for levels 9 and 14. This trendpersists in the higher temperature at 353 K, and the waterdiffusion constants are roughly twice as fast.At 300 K, the experimental 3M water diffusion constants are
considerably faster than those of Nafion. Unlike the experi-ments, the differences between the 3M and Nafion waterdiffusion constants from the simulations are usually small underthe same conditions, and the calculated 3M values areconsiderably smaller than the experimental values. This maybe evidence that the actual morphology of the experimental systemis quite dif ferent f rom the random morphology chosen for our 3Msimulations.One may be able to gain insight for the conductivity of a
membrane by studying the motion of charged particles. In ourFigure 8. MSD plot of SPC/Fw water as a function of time for Nafion890 at λ = 5, 9, and 14 at 353 K.
Figure 9. MSD(t)/6t as a function of t. The plot helps determine theearliest time at which the diffusion constant can be extracted. Thisparticular example comes from the MSD of SPC/Fw water in Nafion890 at hydration level 14 at 353 K.
The Journal of Physical Chemistry C Article
dx.doi.org/10.1021/jp400693g | J. Phys. Chem. C XXXX, XXX, XXX−XXXH
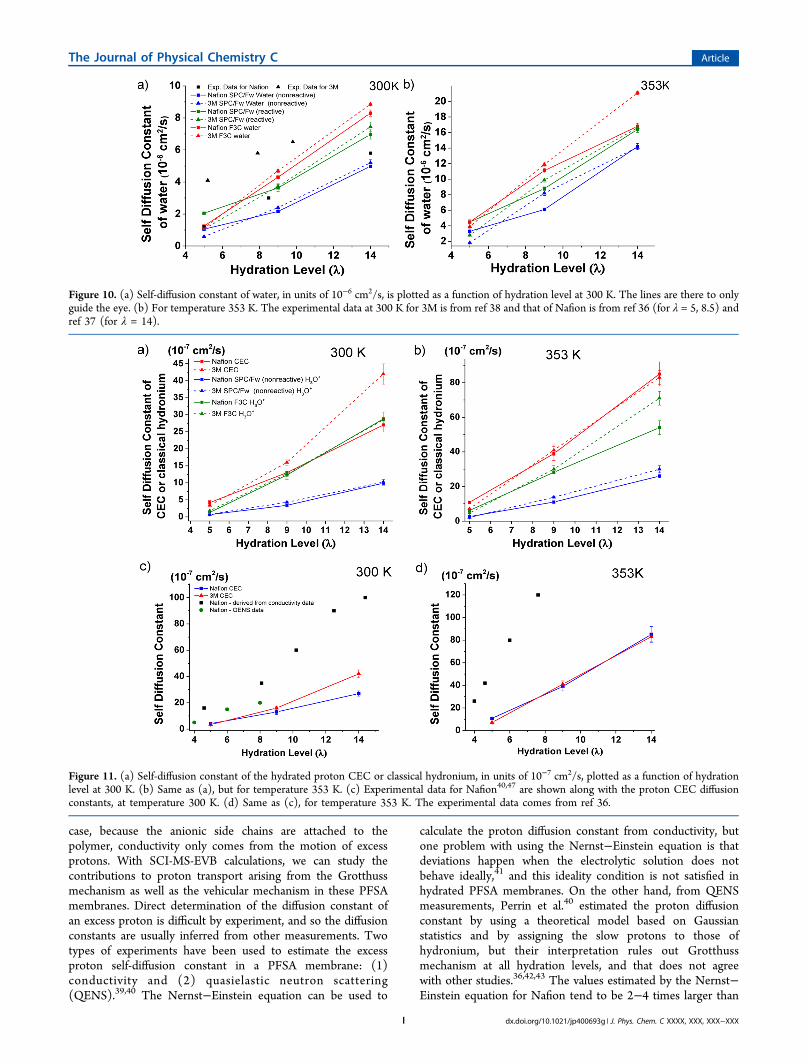
case, because the anionic side chains are attached to thepolymer, conductivity only comes from the motion of excessprotons. With SCI-MS-EVB calculations, we can study thecontributions to proton transport arising from the Grotthussmechanism as well as the vehicular mechanism in these PFSAmembranes. Direct determination of the diffusion constant ofan excess proton is difficult by experiment, and so the diffusionconstants are usually inferred from other measurements. Twotypes of experiments have been used to estimate the excessproton self-diffusion constant in a PFSA membrane: (1)conductivity and (2) quasielastic neutron scattering(QENS).39,40 The Nernst−Einstein equation can be used to
calculate the proton diffusion constant from conductivity, butone problem with using the Nernst−Einstein equation is thatdeviations happen when the electrolytic solution does notbehave ideally,41 and this ideality condition is not satisfied inhydrated PFSA membranes. On the other hand, from QENSmeasurements, Perrin et al.40 estimated the proton diffusionconstant by using a theoretical model based on Gaussianstatistics and by assigning the slow protons to those ofhydronium, but their interpretation rules out Grotthussmechanism at all hydration levels, and that does not agreewith other studies.36,42,43 The values estimated by the Nernst−Einstein equation for Nafion tend to be 2−4 times larger than
Figure 10. (a) Self-diffusion constant of water, in units of 10−6 cm2/s, is plotted as a function of hydration level at 300 K. The lines are there to onlyguide the eye. (b) For temperature 353 K. The experimental data at 300 K for 3M is from ref 38 and that of Nafion is from ref 36 (for λ = 5, 8.5) andref 37 (for λ = 14).
Figure 11. (a) Self-diffusion constant of the hydrated proton CEC or classical hydronium, in units of 10−7 cm2/s, plotted as a function of hydrationlevel at 300 K. (b) Same as (a), but for temperature 353 K. (c) Experimental data for Nafion40,47 are shown along with the proton CEC diffusionconstants, at temperature 300 K. (d) Same as (c), for temperature 353 K. The experimental data comes from ref 36.
The Journal of Physical Chemistry C Article
dx.doi.org/10.1021/jp400693g | J. Phys. Chem. C XXXX, XXX, XXX−XXXI
those of QENS. The discrepancy probably originates from thedifferent assumptions made in the calculations as well as theprocessing, thermal history, and thickness of the mem-branes.44,45
Figures 11 a and b show the diffusion data for the hydratedproton CEC and classical hydronium for both water models,and Figures 11 c and d compare the diffusion constantestimates from QENS and conductivity experiments with theCEC data. For SPC/Fw water, we studied proton diffusion asclassical hydronium (nonreactive, no MS-EVB) and as CEC(reactive, with MS-EVB). For 300 K, the increasing order ofdiffusion constant is CEC ≥ F3C classical hydronium > SPC/Fw classical hydronium for both membranes. The classicalhydronium models derived from both water models havesimilar diffusion constants for both 3M and Nafion membranesat 300 K at all hydration levels. The 3M hydrated proton CEChas a faster diffusion constant at level 9 and 14 than Nafion butis slightly slower at level 5. Nonetheless, all models predictlower diffusion constants than both types of experiments. Inparticular, the hydrated proton CEC is smaller than the QENSby about a factor of 2 and is smaller than the Nernst−Einsteinnumbers by about a factor of 4−5; the underestimation of thediffusion constant is consistent with what was observed for anexcess proton in a box of 216 SPC/Fw water molecules in theoriginal MS-EVB3 paper8 where the calculated classicaldiffusion constant of the CEC (with no quantum nucleareffects) was smaller than the experimental value for proton byabout a factor of about 3. (We also note that in ref 46, thereported diffusion constants for the hydrated proton CEC inNafion were too high because the MSD values were notcorrectly divided by a factor of 6, although the activation energycalculations reported in that paper were not affected by thiserror. After the correction for the factor of 6, the diffusionconstants for the hydrated proton CEC reported in ref 46 areconsistent with those reported here.) For 353 K, the increasingorder of the diffusion constants predicted by different modelsremains the same, but both classical hydronium models predicta larger diffusion constant for 3M than Nafion at hydrationlevels 9 and 14. On the other hand, no statistical differences inthe diffusion constants were found for the hydrated protonCEC at hydration levels 9 and 14 at 353 K, even though theCEC also diffuses faster than the classical hydronium ions.The main difference between the hydrated proton CEC
results and those of classical SPC/Fw hydronium is theinvolvement of the hopping (Grotthuss) mechanism. Thediffusion constant of CEC is 3−7 times faster than that of SPC/Fw classical hydronium. It is therefore interesting to look moreinto the hopping mechanism. One way to study this is todecompose the total displacement of the CEC into a “discrete”and a “continuous” component48
− = Δ = Δ + Δt t t tr r r r r( ) (0) ( ) ( ) ( )CEC CEC CEC c d (4)
⟨|Δ | ⟩ = ⟨|Δ | ⟩ + ⟨|Δ | ⟩
+ ⟨Δ ·Δ ⟩
t t t
t t
r r r
r r
( ) ( ) ( )
2 ( ) ( )CEC
2c
2d
2
c d (5)
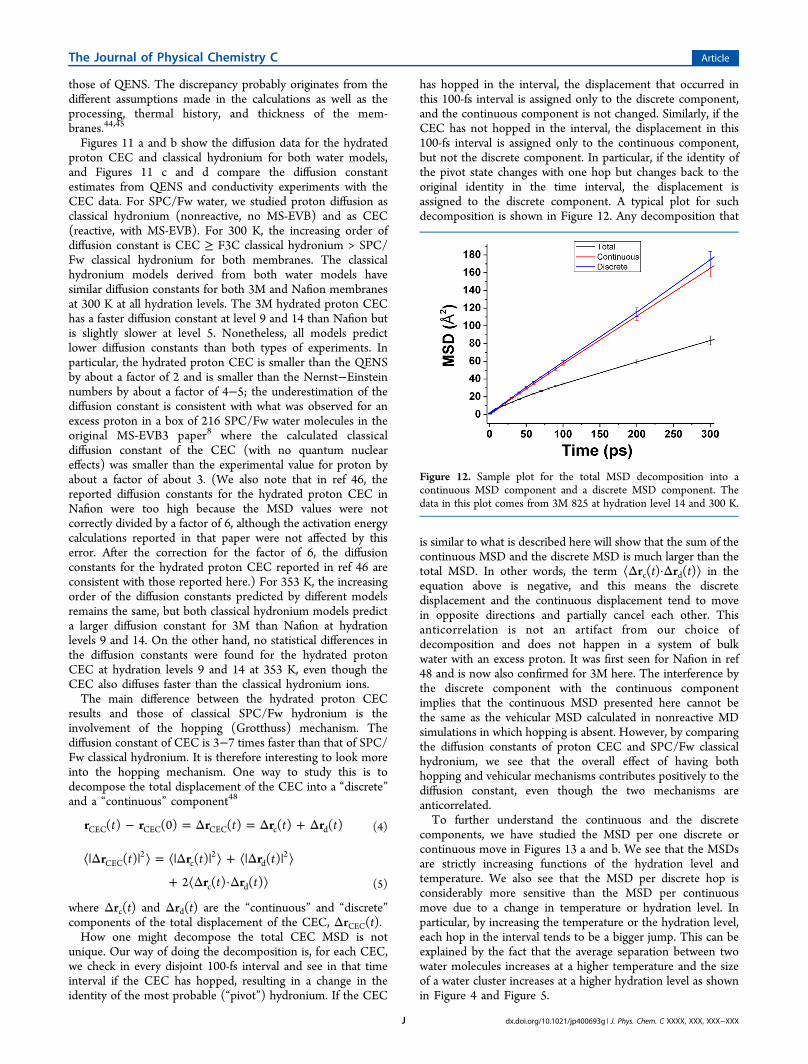
where Δrc(t) and Δrd(t) are the “continuous” and “discrete”components of the total displacement of the CEC, ΔrCEC(t).How one might decompose the total CEC MSD is not
unique. Our way of doing the decomposition is, for each CEC,we check in every disjoint 100-fs interval and see in that timeinterval if the CEC has hopped, resulting in a change in theidentity of the most probable (“pivot”) hydronium. If the CEC
has hopped in the interval, the displacement that occurred inthis 100-fs interval is assigned only to the discrete component,and the continuous component is not changed. Similarly, if theCEC has not hopped in the interval, the displacement in this100-fs interval is assigned only to the continuous component,but not the discrete component. In particular, if the identity ofthe pivot state changes with one hop but changes back to theoriginal identity in the time interval, the displacement isassigned to the discrete component. A typical plot for suchdecomposition is shown in Figure 12. Any decomposition that
is similar to what is described here will show that the sum of thecontinuous MSD and the discrete MSD is much larger than thetotal MSD. In other words, the term ⟨Δrc(t)·Δrd(t)⟩ in theequation above is negative, and this means the discretedisplacement and the continuous displacement tend to movein opposite directions and partially cancel each other. Thisanticorrelation is not an artifact from our choice ofdecomposition and does not happen in a system of bulkwater with an excess proton. It was first seen for Nafion in ref48 and is now also confirmed for 3M here. The interference bythe discrete component with the continuous componentimplies that the continuous MSD presented here cannot bethe same as the vehicular MSD calculated in nonreactive MDsimulations in which hopping is absent. However, by comparingthe diffusion constants of proton CEC and SPC/Fw classicalhydronium, we see that the overall effect of having bothhopping and vehicular mechanisms contributes positively to thediffusion constant, even though the two mechanisms areanticorrelated.To further understand the continuous and the discrete
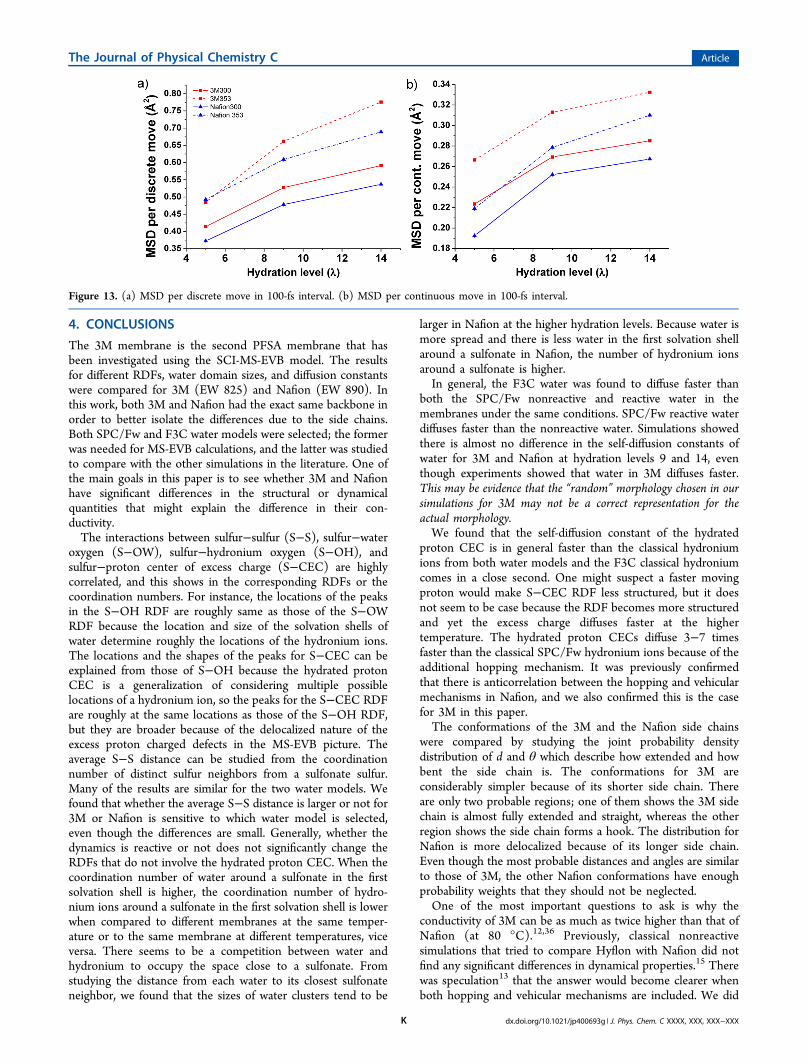
components, we have studied the MSD per one discrete orcontinuous move in Figures 13 a and b. We see that the MSDsare strictly increasing functions of the hydration level andtemperature. We also see that the MSD per discrete hop isconsiderably more sensitive than the MSD per continuousmove due to a change in temperature or hydration level. Inparticular, by increasing the temperature or the hydration level,each hop in the interval tends to be a bigger jump. This can beexplained by the fact that the average separation between twowater molecules increases at a higher temperature and the sizeof a water cluster increases at a higher hydration level as shownin Figure 4 and Figure 5.
Figure 12. Sample plot for the total MSD decomposition into acontinuous MSD component and a discrete MSD component. Thedata in this plot comes from 3M 825 at hydration level 14 and 300 K.
The Journal of Physical Chemistry C Article
dx.doi.org/10.1021/jp400693g | J. Phys. Chem. C XXXX, XXX, XXX−XXXJ
4. CONCLUSIONS
The 3M membrane is the second PFSA membrane that hasbeen investigated using the SCI-MS-EVB model. The resultsfor different RDFs, water domain sizes, and diffusion constantswere compared for 3M (EW 825) and Nafion (EW 890). Inthis work, both 3M and Nafion had the exact same backbone inorder to better isolate the differences due to the side chains.Both SPC/Fw and F3C water models were selected; the formerwas needed for MS-EVB calculations, and the latter was studiedto compare with the other simulations in the literature. One ofthe main goals in this paper is to see whether 3M and Nafionhave significant differences in the structural or dynamicalquantities that might explain the difference in their con-ductivity.The interactions between sulfur−sulfur (S−S), sulfur−water
oxygen (S−OW), sulfur−hydronium oxygen (S−OH), andsulfur−proton center of excess charge (S−CEC) are highlycorrelated, and this shows in the corresponding RDFs or thecoordination numbers. For instance, the locations of the peaksin the S−OH RDF are roughly same as those of the S−OWRDF because the location and size of the solvation shells ofwater determine roughly the locations of the hydronium ions.The locations and the shapes of the peaks for S−CEC can beexplained from those of S−OH because the hydrated protonCEC is a generalization of considering multiple possiblelocations of a hydronium ion, so the peaks for the S−CEC RDFare roughly at the same locations as those of the S−OH RDF,but they are broader because of the delocalized nature of theexcess proton charged defects in the MS-EVB picture. Theaverage S−S distance can be studied from the coordinationnumber of distinct sulfur neighbors from a sulfonate sulfur.Many of the results are similar for the two water models. Wefound that whether the average S−S distance is larger or not for3M or Nafion is sensitive to which water model is selected,even though the differences are small. Generally, whether thedynamics is reactive or not does not significantly change theRDFs that do not involve the hydrated proton CEC. When thecoordination number of water around a sulfonate in the firstsolvation shell is higher, the coordination number of hydro-nium ions around a sulfonate in the first solvation shell is lowerwhen compared to different membranes at the same temper-ature or to the same membrane at different temperatures, viceversa. There seems to be a competition between water andhydronium to occupy the space close to a sulfonate. Fromstudying the distance from each water to its closest sulfonateneighbor, we found that the sizes of water clusters tend to be
larger in Nafion at the higher hydration levels. Because water ismore spread and there is less water in the first solvation shellaround a sulfonate in Nafion, the number of hydronium ionsaround a sulfonate is higher.In general, the F3C water was found to diffuse faster than
both the SPC/Fw nonreactive and reactive water in themembranes under the same conditions. SPC/Fw reactive waterdiffuses faster than the nonreactive water. Simulations showedthere is almost no difference in the self-diffusion constants ofwater for 3M and Nafion at hydration levels 9 and 14, eventhough experiments showed that water in 3M diffuses faster.This may be evidence that the “random” morphology chosen in oursimulations for 3M may not be a correct representation for theactual morphology.We found that the self-diffusion constant of the hydrated
proton CEC is in general faster than the classical hydroniumions from both water models and the F3C classical hydroniumcomes in a close second. One might suspect a faster movingproton would make S−CEC RDF less structured, but it doesnot seem to be case because the RDF becomes more structuredand yet the excess charge diffuses faster at the highertemperature. The hydrated proton CECs diffuse 3−7 timesfaster than the classical SPC/Fw hydronium ions because of theadditional hopping mechanism. It was previously confirmedthat there is anticorrelation between the hopping and vehicularmechanisms in Nafion, and we also confirmed this is the casefor 3M in this paper.The conformations of the 3M and the Nafion side chains
were compared by studying the joint probability densitydistribution of d and θ which describe how extended and howbent the side chain is. The conformations for 3M areconsiderably simpler because of its shorter side chain. Thereare only two probable regions; one of them shows the 3M sidechain is almost fully extended and straight, whereas the otherregion shows the side chain forms a hook. The distribution forNafion is more delocalized because of its longer side chain.Even though the most probable distances and angles are similarto those of 3M, the other Nafion conformations have enoughprobability weights that they should not be neglected.One of the most important questions to ask is why the
conductivity of 3M can be as much as twice higher than that ofNafion (at 80 °C).12,36 Previously, classical nonreactivesimulations that tried to compare Hyflon with Nafion did notfind any significant differences in dynamical properties.15 Therewas speculation13 that the answer would become clearer whenboth hopping and vehicular mechanisms are included. We did
Figure 13. (a) MSD per discrete move in 100-fs interval. (b) MSD per continuous move in 100-fs interval.
The Journal of Physical Chemistry C Article
dx.doi.org/10.1021/jp400693g | J. Phys. Chem. C XXXX, XXX, XXX−XXXK
not study Hyflon, but the side chain of 3M is very similar tothat of Hyflon. Fixing all other conditions except for the sidechains, we found in our SCI-MS-EVB simulations that thebiggest difference in the self-diffusion constants of the hydratedproton CEC for 3M is only 56% percent larger than that ofNafion at hydration level 14 at 300 K; for other hydration levelsand temperature, the differences are much smaller. Therefore,we did not find evidence that the difference in the excessproton self-diffusion constants (or lack of), after taking bothvehicular and hopping mechanisms into account, can explainthe difference in conductivity, at least for 3M 825 and Nafion890. We did not impose any specific morphology for the initialconfigurations of the membranes, and our simulation boxeswere too small to account for any crystallinity. It has beensuggested in a recent study by Di Noto et al.49 that themorphology of the crystalline hydrophobic domains is crucialfor the long-range proton migration in the 3M membrane.Moreover, another recent study by Feng, Savage, and Voth50
has shown evidence that different Nafion morphology such aslamella, cylinder, or cluster can result in very different self-diffusion constants of the hydrated proton CEC. These allreinforce the idea that a more complete picture of the actualmorphology of these PFSA membranes, especially as a functionof equivalent weight and hydration level, is likely required tounderstand the differences in their proton conductivity as wellas to obtain better overall agreement between the calculatedvalues of the excess proton diffusion and the experimentalmeasurements.
■ ASSOCIATED CONTENT*S Supporting InformationDensity values of Nafion 890 and 3M 825, RDF between twosulfonate sulfurs, and the water and hydronium coordinationnumbers around a sulfonate sulfur in the first solvation shell.This material is available free of charge via the Internet athttp://pubs.acs.org.
■ AUTHOR INFORMATIONCorresponding Author*Phone: 773-702-7250. Fax: 773-702-0805. E-mail: [email protected].
Present Address⊥Department of Chemistry, University of Chicago, 5735 S. EllisAve., Chicago, IL 60637.
NotesThe authors declare no competing financial interest.
■ ACKNOWLEDGMENTSThis research was supported by the Department of Energy,Office of Basic Energy Sciences, Division of Chemical Sciences,Geosciences, and Biosciences (DOE grant DE-FG02-10ER16171 to G.A.V.), Renewable Energy Materials ResearchScience and Engineering Center (National Science Foundationgrant DMR-0820518 to A.M.H.) at Colorado School of Mines,and the National Renewable Energy Laboratory (NREL). S.T.thanks Dr. Bryan Pivovar of NREL for very many helpfuldiscussions.
■ REFERENCES(1) Khurmi, R. S.; Sedha, R. S.Material Science; S. Chand & Co., Ltd.:New Delhi, India, 2010.
(2) Hamrock, S. J.; Yandrasits, M. A. Proton Exchange Membranes forFuel Cell Applications; Technical Report 1532-1797; Taylor & Francis:New York, 2006/09/01; pp 219−244.(3) Mauritz, K. A.; Moore, R. B. State of Understanding of Nafion.Chem. Rev. 2004, 104, 4535−4586.(4) Kreuer, K. D. On the Development of Proton ConductingMaterials for Technological Applications. Solid State Ionics 1997, 97,1−15.(5) Schmitt, U. W.; Voth, G. A. Multistate Empirical Valence BondModel for Proton Transport in Water. J. Phys. Chem. B 1998, 102,5547−5551.(6) Schmitt, U. W.; Voth, G. A. The Computer Simulation of ProtonTransport in Water. J. Chem. Phys. 1999, 111, 9361−9381.(7) Day, T. J. F.; Soudackov, A. V.; Cuma, M.; Schmitt, U. W.; Voth,G. A. A Second Generation Multistate Empirical Valence Bond Modelfor Proton Transport in Aqueous Systems. J. Chem. Phys. 2002, 117,5839−5849.(8) Wu, Y.; Chen, H.; Wang, F.; Paesani, F.; Voth, G. A. AnImproved Multistate Empirical Valence Bond Model for AqueousProton Solvation and Transport. J. Phys. Chem. B 2008, 112, 7146−7146.(9) Wang, F.; Voth, G. A.; Linear-Scaling Self-Consistent, A.Generalization of the Multistate Empirical Valence Bond Method forMultiple Excess Protons in Aqueous Systems. J. Chem. Phys. 2005, 122,144105.(10) Maalouf, M.; Pyle, B.; Sun, C.-N.; Wu, D.; Paddison, S. J.;Schaberg, M.; Emery, M.; Lochhaas, K. H.; Hamrock, S. J.; Ghassemi,H.; et al. Proton Exchange Membranes for High Temperature FuelCells: Equivalent Weight and End Group Effects on Conductivity. ECSTrans. 2009, 25, 1473−1481.(11) Kreuer, K. D.; Schuster, M.; Obliers, B.; Diat, O.; Traub, U.;Fuchs, A.; Klock, U.; Paddison, S. J.; Maier, J. Short-Side-Chain ProtonConducting Perfluorosulfonic Acid Ionomers: Why They PerformBetter in PEM Fuel Cells. J. Power Sources 2008, 178, 499−509.(12) Emery, M.; Frey, M.; Guerra, M.; Haugen, G.; Hintzer, K.;Lochhaas, K. H.; Pham, P.; Pierpont, D.; Schaberg, M.; Thaler, A.;et al. The Development of New Membranes for Proton ExchangeMembrane Fuel Cells. ECS Trans. 2007, 11, 3−14.(13) Cui, S.; Liu, J.; Selvan, M. E.; Paddison, S. J.; Keffer, D. J.;Edwards, B. J. Comparison of the Hydration and Diffusion of Protonsin Perfluorosulfonic Acid Membranes with Molecular DynamicsSimulations. J. Phys. Chem. B 2008, 112, 13273−13284.(14) Liu, J.; Suraweera, N.; Keffer, D. J.; Cui, S.; Paddison, S. J. Onthe Relationship between Polymer Electrolyte Structure and HydratedMorphology of Perfluorosulfonic Acid Membranes. J. Phys. Chem. C2010, 114, 11279−11292.(15) Devanathan, R.; Dupuis, M. Insight from Molecular Modelling:Does the Polymer Side Chain Length Matter for Transport Propertiesof Perfluorosulfonic Acid Membranes? Phys. Chem. Chem. Phys. 2012,14, 11281−11295.(16) Clark, Ii, J. K.; Paddison, S. J.; Hamrock, S. J. The Effect ofHydrogen Bond Reorganization and Equivalent Weight on ProtonTransfer in 3M Perfluorosulfonic Acid Ionomers. Phys. Chem. Chem.Phys. 2012, 14, 16349−16359.(17) Clark, J. K.; Paddison, S. J. The Effect of Side ChainConnectivity and Local Hydration on Proton Transfer in 3MPerfluorosulfonic Acid Membranes. Solid State Ionics 2012, 213, 83−91.(18) Wu, D. S.; Paddison, S. J.; Elliott, J. A.; Hamrock, S. J. MesoscaleModeling of Hydrated Morphologies of 3M Perfluorosulfonic Acid-Based Fuel Cell Electrolytes. Langmuir 2010, 26, 14308−14315.(19) Knox, C. K.; Voth, G. A. Probing Selected MorphologicalModels of Hydrated Nafion Using Large-Scale Molecular DynamicsSimulations. J. Phys. Chem. B 2010, 114, 3205−3218.(20) Plimpton, S. Fast Parallel Algorithms for Short-Range MolecularDynamics. J. Comput. Phys. 1995, 117, 1−19.(21) Paddison, S. J.; Elliott, J. A. Molecular Modeling of the Short-Side-Chain Perfluorosulfonic Acid Membrane. J. Phys. Chem. A 2005,109, 7583−7593.
The Journal of Physical Chemistry C Article
dx.doi.org/10.1021/jp400693g | J. Phys. Chem. C XXXX, XXX, XXX−XXXL
(22) Paddison, S. J.; Elliott, J. A. On the Consequences of Side ChainFlexibility and Backbone Conformation on Hydration and ProtonDissociation in Perfluorosulfonic Acid Membranes. Phys. Chem. Chem.Phys. 2006, 8, 2193−2203.(23) Paddison, S. J.; Elliott, J. A. The Effects of BackboneConformation on Hydration and Proton Transfer in the “Short-Side-Chain” Perfluorosulfonic Acid Membrane. Solid State Ionics 2006,177, 2385−2390.(24) Wang, C.; Clark, J. K.; Kumar, M.; Paddison, S. J. An Ab InitioStudy of the Primary Hydration and Proton Transfer of CF(3)SO(3)H and CF(3)O (CF(2))(2)SO(3)H: Effects of the Hybrid Functionaland Inclusion of Diffuse Functions. Solid State Ionics 2011, 199, 6−13.(25) Mayo, S. L.; Olafson, B. D.; Goddard, W. A. Dreiding: AGeneric Force Field for Molecular Simulations. J. Phys. Chem. 1990,94, 8897−8909.(26) Daan Frenkel, B. S. Understanding Molecular Simulation: FromAlgorithms to Applications, 2nd ed.; Academic Press: San Deigo, CA,2001.(27) Mulliken, R. S. Electronic Population Analysis on Lcao[SingleBond]Mo Molecular Wave Functions. I. J. Chem. Phys. 1955, 23,1833−1840.(28) Frisch, M. J.; Trucks, G. W.; Schlegel, H. B.; Scuseria, G. E.;Robb, M. A.; Cheeseman, J. R.; Scalmani, G.; Barone, V.; Mennucci,B.; Petersson, G. A.; et al. Gaussian 09, revision B.01; Gauussian, Inc.:Wallingford, CT, 2009.(29) Jang, S. S.; Molinero, V.; Cagin, T.; Goddard, W. A. Nanophase-Segregation and Transport in Nafion 117 from Molecular DynamicsSimulations: Effect of Monomeric Sequence. J. Phys. Chem. B 2004,108, 3149−3157.(30) Hristov, I. H.; Paddison, S. J.; Paul, R. Molecular Modeling ofProton Transport in the Short-Side-Chain Perfluorosulfonic AcidIonomer. J. Phys. Chem. B 2008, 112, 2937−2949.(31) Jang, S. S.; Blanco, M.; Goddard, W. A.; Caldwell, G.; Ross, R. B.The Source of Helicity in Perfluorinated N-Alkanes. Macromolecules2003, 36, 5331−5341.(32) Wu, Y. J.; Tepper, H. L.; Voth, G. A. Flexible Simple Point-Charge Water Model with Improved Liquid-State Properties. J. Chem.Phys. 2006, 124, 024503.(33) Levitt, M.; Hirshberg, M.; Sharon, R.; Laidig, K. E.; Daggett, V.Calibration and Testing of a Water Model for Simulation of theMolecular Dynamics of Proteins and Nucleic Acids in Solution. J. Phys.Chem. B 1997, 101, 5051−5061.(34) Karo, J.; Aabloo, A.; Thomas, J. O.; Brandell, D. MolecularDynamics Modeling of Proton Transport in Nafion and HyflonNanostructures. J. Phys. Chem. B 2010, 114, 6056−6064.(35) For the MSD calculations of reactive SPC/Fw water, if a watermolecule accepts a proton to become a “pivot (most probable)”hydronium, the proton donor, which has been the original pivothydronium, takes over the water’s idenitity and the trajectory iscontinued at the donor’s location.(36) Ochi, S.; Kamishima, O.; Mizusaki, J.; Kawamura, J.Investigation of Proton Diffusion in Nafion (R) 117 Membrane byElectrical Conductivity and NMR. Solid State Ionics 2009, 180, 580−584.(37) Zawodzinski, T. A.; Springer, T. E.; Davey, J.; Jestel, R.; Lopez,C.; Valerio, J.; Gottesfeld, S. A Comparative Study of Water-Uptake byand Transport through Ionomeric Fuel-Cell Membranes. J. Electro-chem. Soc. 1993, 140, 1981−1985.(38) Hamrock, S. J. Final ReportMembranes and Mea’s for Dry, HotOperating Conditions; Technical Report DOE/GO/17006-1; U.S.Dept. of Energy: Washington D.C., 2011.(39) Pivovar, A. A.; Pivovar, B. S. Dynamic Behavior of Water withina Polymer Electrolyte Fuel Cell Membrane at Low Hydration Levels. J.Phys. Chem. B 2005, 109, 785−793.(40) Perrin, J. C.; Lyonnard, S.; Volino, F. Quasielastic NeutronScattering Study of Water Dynamics in Hydrated Nafion Membranes.J. Phys. Chem. C 2007, 111, 3393−3404.(41) John, O’M. Bockris, A. K. N. R. Modern Electrochemistry 1:Ionics, 2nd ed.; Plenum Press: New York, 1998.
(42) Pivovar, B. S.; Smyrl, W. H.; Cussler, E. L. Electro-Osmosis inNafion 117, Polystyrene Sulfonic Acid, and Polybenzimidazole. J.Electrochem. Soc. 2005, 152, A53−A60.(43) Zawodzinski, T. A.; Neeman, M.; Sillerud, L. O.; Gottesfeld, S.Determination of Water Diffusion Coefficients in PerfluorosulfonateIonomeric Membranes. J. Phys. Chem. 1991, 95, 6040−6044.(44) Kim, M.-H.; Glinka, C. J.; Grot, S. A.; Grot, W. G. Sans Study ofthe Effects of Water Vapor Sorption on the Nanoscale Structure ofPerfluorinated Sulfonic Acid (Nafion) Membranes. Macromolecules2006, 39, 4775−4787.(45) Devanathan, R. Recent Developments in Proton ExchangeMembranes for Fuel Cells. Energy Environ. Sci. 2008, 1, 101−119.(46) Feng, S.; Voth, G. A. Proton Solvation and Transport inHydrated Nafion. J. Phys. Chem. B 2011, 115, 5903−5912.(47) Kreuer, K. D. On the Development of Proton ConductingPolymer Membranes for Hydrogen and Methanol Fuel Cells. J.Membr. Sci. 2001, 185, 29−39.(48) Petersen, M. K.; Voth, G. A. Characterization of the Solvationand Transport of the Hydrated Proton in the Perfluorosulfonic AcidMembrane Nafion. J. Phys. Chem. B 2006, 110, 18594−18600.(49) Giffin, G. A.; Haugen, G. M.; Hamrock, S. J.; Di Noto, V.Interplay between Structure and Relaxations in Perfluorosulfonic AcidProton Conducting Membranes. J. Am. Chem. Soc. 2012, 135, 822−834.(50) Feng, S.; Savage, J.; Voth, G. A. Effects of Polymer Morphologyon Proton Solvation and Transport in Proton-Exchange Membranes. J.Phys. Chem. C 2012, 116, 19104−19116.
The Journal of Physical Chemistry C Article
dx.doi.org/10.1021/jp400693g | J. Phys. Chem. C XXXX, XXX, XXX−XXXM