Embed Size (px)
Citation preview

Sanford Health Network
2012-2013Community Health Needs Assessment
dba Sanford Rock Rapids Medical Center EIN# 46-0388596

Sanford Rock Rapids Medical Center
Community Health Needs Assessment
2012-‐2013
rev. 6/11/13

2
Table of Contents
Page
Purpose 5 Acknowledgements 6 Executive Summary 8-‐10 Description of Sanford Rock Rapids Medical Center 13 Description of the Community Served 13 Study Design and Methodology
• Community Health Needs Assessment of Community Leaders and Focus Studies of Key Stakeholders
• 2011 County Health Profiles • Aging Profiles • Diversity Profiles • Quality Data • Top Diagnosis • Limitations
13
Primary Research 14
Summary of the Survey Results • Community Assets/Best Things about the Community
o Figure 1. Level of agreement with statements about the community regarding PEOPLE
o Figure 2. Level of agreement with statements about the community regarding SERVICES AND RESOURCES
o Figure 3. Level of agreement with statements about the community regarding QUALITY OF LIFE
15
• General Concerns about the Community
o Figure 4. Level of concern with statements about the community regarding ECONOMIC ISSUES
o Figure 5. Level of concern with statements about the community regarding TRANSPORTATION
o Figure 6. Level of concern with statements about the community regarding ENVIRONMENTAL POLLUTION
o Figure 7. Level of concern with statements about the community regarding SAFETY CONCERNS
o Figure 8. Level of concern with statements about the community regarding YOUTH CONCERNS
17
• Community Health and Wellness Concerns
o Figure 9. Level of concern with statements about the community regarding ACCESS TO HEALTH CARE
o Figure 10. Level of concern with statements about the community regarding PHYSICAL HEALTH
20
3
o Figure 11. Level of concern with statements about the community regarding MENTAL HEALTH
o Figure 12. Level of concern with statements about the community regarding SUBSTANCE USE AND ABUSE
• Personal Health Care Information
o Cancer Screening o Health Care Coverage o Primary Care Provider o Respondents’ Primary Care Provider o Respondents Representing Chronic Disease
23
• Demographic Information 26
Secondary Research
• Health Outcomes o Mortality o Morbidity
• Health Factors o Health Behaviors o Clinical Care o Social and Economic Factors o Physical Environment o Demographics o Population by Age o Housing o Economic Security o Diversity Profile
27
Health Needs Identified
• Community Assets/Prioritization Process 33
Implementation Strategy 34 Appendix
• 2011 County Health Profile – Lyon County • Definition of Health Variables • Aging Profile – Lyon County • Diversity Profile – Lyons County • Maps
o Mortality – Map 1 – Premature Death o Morbidity – Maps 2-‐5 o Health Factors – Maps 6-‐12 o Clinical Care – Maps 13-‐20 o Social and Economic – Maps 21-‐27 o Physical Environment – Maps 28-‐31 o Demographic – Maps 32-‐36
• Table 4 – Asset Map • Table 5 – Prioritization Worksheet
37

4
Sanford Rock Rapids Medical Center Community Health Needs Assessment
2012-‐2013
Purpose Sanford Rock Rapids Medical Center is part of Sanford Health, an integrated health system headquartered in the Dakotas and the largest rural not-‐for-‐profit health care system in the nation with locations in 126 communities in eight states. Sanford Rock Rapids Medical Center has undertaken a community health needs assessment as required by the Patient Protection and Affordable Care Act and as part of the IRS 990 requirement for a not-‐for-‐profit health system to address issues that have been assessed as unmet needs in the community. PPACA requires that each hospital must have: (1) conducted a community health needs assessment in the applicable taxable year; (2) adopted an implementation strategy for meeting the community health needs identified in the assessment; and (3) created transparency by making the information widely available. For tax exempt hospital organizations that own and operate more than one hospital facility, as within Sanford Health, the new tax exemption requirements will apply to each individual hospital. The first required needs assessment falls within the fiscal year July 1, 2012 through June 30, 2013. The purpose of a community health needs assessment is to develop a global view of the population’s health and the prevalence of disease and health issues within our community. Findings from the assessment serve as a catalyst to align expertise and develop a Community Investment/Community Benefit plan of action. There is great intrinsic value in a community health needs assessment when it serves to validate, justify and defend not-‐for-‐profit status and create opportunity to identify and address public health issues from a broad perspective. A community health needs assessment is critical to a vital Community Investment/Community Benefit Program that builds on community assets, promotes collaboration, improves community health, and promotes innovation and research. A community health needs assessment also serves to validate progress made toward organizational strategies and provides further evidence for retaining not-‐for-‐profit status.
5
Acknowledgements Sanford Health would like to acknowledge and thank the Steering Committees and the Greater Fargo Moorhead Community Health Needs Assessment Collaborative for their expertise while performing the assessment and analysis of the community health data. The assessment provides support for the future directions of our work as the region’s leading health care system. Sanford Enterprise Steering Group:
• Enterprise Lead: Carrie McLeod, MBA, MM, LRD,CDE; Office of Health Care Reform, Community Benefit/Community Health Improvement
• Sioux Falls Region Co-‐Lead: Bruce Viessman, CFO, Sanford Health Network Sioux Falls • Mike Begeman, Chief of Staff/Vice President of Public Affairs • Maxine Brinkman, CPA; Director of Financial Decisions and Operations Support • Michelle Bruhn, CPA; CFO, Health Services Division • Randy Bury, COO, Sanford Medical Center USD • Jane Heilman, BA; Senior Corporate Communication Strategist • Kristie Invie, BS, MBA; Vice President for Clinical Performance • Joy Johnson, Bemidji Region Co-‐Lead, VP, Business Development and Marketing, Bemidji • Ashley King, Bemidji Co-‐Lead, Intern in Bemidji • JoAnn Kunkel, CFO, Sanford Health • Tiffany Lawrence, CPA; Fargo Region Co-‐Lead, CFO, Sanford Medical Center Fargo • Martha Leclerc, MS; Vice President, Office of Health Reform and Strategic Payment • Doug Nowak, MBA; Executive Director, Decision Support • Heather Vanmeveren, CPA; Director of Accounting
Sanford Sioux Falls Network Steering Group:
• Enterprise Lead: Carrie McLeod, MBA, MM, LRD,CDE; Office of Health Care Reform, Community Benefit/Community Health Improvement
• Sioux Falls Region Co-‐Lead: Bruce Viessman, CFO, Sanford Health Network Sioux Falls • Michelle Bruhn, CPA; CFO, Health Services Division • Mike Daly, Director, Public Affairs • Doug Nowak, Executive Director, Decision Support • Jeff Rotert, COO/CFO, Sanford Worthington Medical Center • Cindy Schuck, Manager, Accreditation Standards Program • Dan Staebell, Communications Department • Justin Tiffany, Project Specialist, Health Network, Sanford Medical Center
Sanford Rock Rapids Steering Group: • Tammy Loosbrock, CEO • Stan Knobloch, CFO • Jack Johnson, CNO • Laurie Jensen, Director of Clinic Operations • Jill Funke, Marketing coordinator • Sanford Rock Rapids Department managers

6
We express our gratitude to the following individuals and groups for their participation in this study. We extend special thanks to the city mayors, city council/commission members, physicians, nurses, school superintendents and school board members, faith and community leaders, as well as legal services, social services, non-‐profit organizations, and financial services for their participation in this work. Together we are reaching our vision “to improve the human condition through exceptional care, innovation and discovery.” Our Guiding Principles:
• All health care is a community asset • Care should be delivered as close to home as possible • Access to health care must be provided regionally • Integrated care delivers the best quality and efficiency • Community involvement and support is essential to success • Sanford Health is invited into the communities we serve
The following key community stakeholders participated in this assessment work:
• Kristi Baker, City Clerk, Doon, IA • Marlene Bowers, Retired, Rock Rapids, IA • Wendee Chase, Pharmacist, Lewis Family Drug, Rock Rapids, IA • Sandi DeSmet, City Clerk, Larchwood, IA • Stacy Dieren, Accountant, Rock Rapids, IA • Darcy Gerber, Lester, IA • Josh Feucht, City Council, Larchwood, IA • Cody Hoefert, Chiropractor, Lyon County Chiropractic, Rock Rapids, IA • Beverly Hoing, Retired Educator, George, IA • Angie Jager, Consumer Council Member, Rock Rapids, IA • April Jennings, Administrator, Lyon Manor, Rock Rapids, IA • Amber Kellenberger, Rock Rapids, IA • Derek Knobloch, Owner, Farm, Lester, IA • Desiree Kopp, Director, Rock Rapids Kids Club, Rock Rapids, IA • Jordan Kordahl, City Administator, Rock Rapids, IA • Dale Lint, Pastor, Zoar Presbyterian Church, George, IA • Tim Mantel, Mayor, Doon, IA • Harold Meester, Retired, Lester, IA • Merlin Meyer, Finance, Rock Rapids, IA • Jesse L. Moser, General Manager, Lester Feed & Grain Co., Lester, IA • Marlin Overman, VP, DeWild Grant Reckert & Associates, Rock Rapids, IA • Yvonne Rozeboom, Clinic Supervisor, Avera Medical Group, Larchwood, IA • Marge Smith, Nurse, Sanford Hospice, Rock Rapids, IA • Melissa Stillson, Public Health Nurse, Rock Rapids, IA • Carol Vander Kolk, City Clerk, Inwood, IA • James Vander Woude, Retired, Rock Rapids, IA • Merlin Ver Steeg, Business Owner, Corner Service, Inc., Little Rock, IA • Kelly Volk, Pastor, United Church of Christ, Larchwood, IA • Bernette Weier, George, IA • Jackie Wells, Business Manager, Central Lyon CSD, Rock Rapids, IA • Susan Wiertzema, Geriatrics Director of Nursing, Little Rock, IA • Kristi Wright, Rock Rapids, IA

7
Sanford Rock Rapids Medical Center Community Health Needs Assessment
2012-‐2013 Executive Summary Purpose The purpose of a community health needs assessment is to develop a global view of the population’s health and the prevalence of disease and health issues within the community. Findings from the assessment serve as a catalyst to align expertise and develop a Community Investment/Community Benefit plan of action. There is great intrinsic value in a community health needs assessment when it serves to validate, justify and defend not-‐for-‐profit status and create opportunity to identify and address public health issues from a broad perspective. A community health needs assessment is critical to a vital Community Investment/Community Benefit Program that builds on community assets, promotes collaboration, improves community health, and promotes innovation and research. A community health needs assessment also serves to validate progress made toward organizational strategies and provides further evidence for retaining our not-‐for-‐profit status. Study Design and Methodology The following qualitative data sets were studied:
• Community Health Needs Assessment of Community Leaders The following quantitative data sets were studied:
• 2011 County Health Profiles for Lyon County • Aging Profiles for Lyon County • Diversity Profiles for Lyon County
Asset mapping was conducted by reviewing the data and identifying the unmet needs from the various surveys and data sets. The process implemented in this work was based on the McKnight Foundation model -‐ Mapping Community Capacity by John L. McKnight and John P. Kretzmann, Institute for Policy Research at Northwestern University. Each unmet need was researched to determine what resources were available in the community to address the needs. The Sanford Rock Rapids steering group performed the asset mapping and reviewed the findings. The group conducted an informal gap analysis to determine what needs remained after resources were thoroughly researched. Once gaps were determined, the group proceeded to the prioritization process. The multi-‐voting methodology was implemented to determine what top priorities would be further developed into implementation strategies.

8
Key Findings – Primary Research
Sanford Rock Rapids distributed the Community Health Needs Assessment survey tool that was developed by the Greater Fargo-‐Moorhead Community Health Needs Assessment Collaborative to key stakeholder groups as a method of gathering input from a broad cross section of the Lyon county community. The Internal Revenue Code 501 (r) statute requires that a broad base of key community stakeholders have input into the needs of the community. Those community members specified in the statute include: persons who represent the broad interests of the community served by the hospital facility including those with special expertise in public health; Federal, tribal, regional, state and or local health or other departments or agencies with information relevant to the health needs of the community served; leaders, representatives, or members of medically underserved, low-‐income, and minority populations. Sanford extended a good faith effort to engage all of the aforementioned community representatives in the survey process. The list of individuals who agreed to take the survey and also submit their names are included in the acknowledgement section of this report. In some cases there were surveys that were submitted without names or without a specified area of expertise or affiliation. We worked closely with public health experts throughout the assessment process. Public comments and response to the community health needs assessment and the implementations strategies are welcome on the Sanford website under “About Sanford” in the Community Health Needs Assessment section. The findings discussed in this section are a result of the analysis of the survey qualitative data. Respondents had very high levels of agreement that their community has quality educational opportunities and programs, there is access to quality food, and there is quality health care. Respondents felt strongly that the community was a safe place to live, family friendly, with a healthy environment that has a laidback lifestyle and is peaceful and quiet. The respondents agreed that people within the community are helpful and supportive, there is a sense of engagement within the community, and that people felt connected to the people that live within the community. Respondents also had a high level of agreement that the community is clean, convenient access to work and activities, and that there are many recreational/sports activities available. Respondents were most concerned about cost and availability of child care and bullying among the youth. Respondents were also concerned with issues regarding substance abuse within the community. Environmental issues regarding garbage and litter, water quality, air quality, and noise levels were not a large concern. Among health and wellness concerns, respondents were most concerned about the costs associated with health insurance, health care, and prescription drugs. Respondents were also concerned about physical health issues, particularly obesity, poor nutrition and eating habits, and inactivity or lack of exercise. The adequacy of health and dental insurance (i.e., amount of co-‐pays and deductibles) ,access to health insurance coverage (e.g. pre-‐existing conditions), and availability of doctors and specialists as well as chronic disease (e.g. diabetes, heart disease, multiple sclerosis), prevalence of cancer, and mental health treatment and programs were also among the top health and wellness concerns among respondents. Respondents had very high levels of agreement that access to emergency services, such as ambulance and 911 services, is very well addressed. Respondents were least concerned with the availability of translators, providers not taking new patients, confidentiality, and distance to health care services. Respondents mentioned the community is a great place to live and raise a family with a sense of support for each other. Respondents had fairly high levels of agreement that people in their community are friendly, helpful,

9
and supportive and that there is a sense of community or feeling connected to people who live here. Among issues regarding people in the community, respondents agreed the least that there is tolerance, inclusion, and open-‐mindedness in their community. Respondents also said that having the “Rides” bus available is a big asset. Respondents had moderate levels of concern with respect to the availability of affordable housing, employment opportunities, low wages, poverty, cost of living, and economic disparities between higher and lower classes. Respondents were least concerned with homelessness and hunger. Respondents were most concerned with availability of good walking or biking options. Respondents were least concerned with traffic congestion. The levels of concern among respondents regarding substance use were fairly high. Respondents were most concerned about drug use and abuse and moderately concerned about smoking and alcohol use and abuse. The top three reasons respondents gave for their choice of primary health care provider were location, quality of services, and availability of services. Seventy percent (70%) of the respondents said they had not had a cancer screening or cancer care in the past year. The most common reasons for not having done so was because the doctor hadn’t suggested it or because it was not necessary. Fear, cost, and unfamiliarity with recommendations were also reasons respondents gave. A majority of respondents said they had paid for health care costs over the last 12 months by health insurance through an employer. Medicare, Medicaid, personal income, and private health insurance were also used. Respondents were asked which provider they used for their primary health care. Two out of three respondents said they use Sanford Health as their primary health care provider. One in three said they use Avera health system. Key Findings – Secondary Research Health Outcomes The Mortality health outcomes indicate that Iowa as a state has more premature deaths than the national benchmark; however, Lyon County is less than the national benchmark. The Morbidity health outcomes indicate that Iowa citizens report more days of poor mental and physical health than the national benchmark; however, Lyon County residents report better than national benchmark physical and mental health. Lyon County has a similar percentage of low birth weight as the national benchmark and Iowa has higher percentages of low birth weight. Health Factors The Health Behavior outcomes indicate that Iowa and Lyon County have higher percentages of adult smokers than the national benchmark. Adult obesity is also higher in Iowa and Lyon County. Iowa and Lyon County have a higher percentage of physical inactivity than the national benchmark.

10
Iowa and Lyon County have higher percentages of binge drinking reports than the national benchmark. Motor vehicle crash death rates are higher than the national benchmark in Iowa. Sexually transmitted infections rank substantially higher than the national benchmark for Iowa; however, significantly lower than the national benchmark for Lyon County. The teen birth rate is higher in Iowa than the national benchmark, but is significantly lower in Lyon County. The Clinical Care outcomes indicate that Lyon County has a higher percentage of uninsured adults and youth than the national benchmark, while Iowa as a state has similar percentages as the national benchmark. The ratio of population to primary care physicians is significantly higher in Lyon County than the national or state benchmark. The ratio of population to mental health providers is much higher in Iowa and Lyon County than the national benchmark. The number of professionally active dentists is lower than the national benchmark in Iowa and Lyon County. Preventable hospital stays are higher than the national benchmark in Iowa and Lyon County. Diabetes screening in Iowa and in Lyon County is slightly lower than the national benchmark. Lyon County ranks higher than the national benchmark for mammography screenings, while Iowa is slightly under the national benchmark.
Implementation Strategy
The following unmet needs were identified through a formal community health needs assessment, resource mapping and prioritization process:
• Facility upgrades to enhance quality and health care access • Increase knowledge and awareness of services available within the community
Facility Upgrades to Enhance Quality and Health Care Access Work related to this need will be done jointly by the Sanford Rock Rapids leadership team, Sanford Health Network, and MPCH Association Board as the MPCH Association Board maintains ownership of the building and grounds.
• Develop bridge plan for existing facility to maintain patient safety through reinvestment of lease proceeds during renovation/construction
• Review existing renovation plan and evaluate other options for facility changes with the MPCH Association
• Review existing construction finance plan and update financing plan to account for market changes (comparing budgeted performance with actual performance) /building program changes
• MPCH Association and Sanford Health Network communicate and agree on plan to upgrade facility infrastructure
Increase Knowledge and Awareness of Services Available within the Community • Internal team to analyze available resources and determine how to access resources • External group/Lyon County Collaborative to review existing list of community resources and determine
modifications that need to be made • Design/print resource materials with Sanford marketing • Share resource tool with key community stakeholders/access points to care

11
Sanford Rock Rapids Medical Center
Community Health Needs Assessment 2012-‐2013
Sanford Health, long been dedicated to excellence in patient care, is on a journey of growth and momentum with vast geography, cutting edge medicine, sophisticated research, advanced education and a health plan. Through relationships built on trust, successful performance, and a vision to improve the human condition, Sanford seeks to make a significant impact on health and healing. We are proud to be from the Midwest and to impact the world. The name Sanford Health honors the legacy of Denny Sanford’s transformational gifts and vision. Our Mission: Dedicated to the Work of Health and Healing We provide the best care possible for patients at every stage of life, and support healing and wholeness in body, mind and spirit. Our Vision: To improve the Human Condition through Exceptional Care, Innovation and Discovery We strive to provide exceptional care that exceeds our patients’ expectations. We encourage diversity in thought and ideas that lead to better care, service and advanced expertise. Our Values:
• Courage: Strength to persevere, to use our voice and take action • Passion: Enthusiasm for patients and work, commitment to the organization • Resolve: Adherence to systems that align actions to achieve excellence, efficiency and purpose • Advancement: Pursuit of individual and organizational growth and development • Family: Connection and commitment to each other
Our Promise: Deliver a flawless experience that inspires We promise that every individual’s experience at Sanford—whether patient, visitor or referring physician—will result in a positive impact, and for every person to benefit from a flawless experience that inspires. Guiding Principles:
• All health care is a community asset • Care should be delivered as close to home as possible • Access to health care must be provided regionally • Integrated care delivers the best quality and efficiency • Community involvement and support is essential to success • Sanford Health is invited into the communities we serve

12
Description of Sanford Rock Rapids Medical Center Sanford Rock Rapids is located in Rock Rapids, IA, and includes Sanford Rock Rapids Medical Center, Sanford Rock Rapids Clinic, Sanford George Clinic, and Sanford Rock Rapids Fitness Center. A member of Sanford Health, Sanford Rock Rapids serves most of Lyon County, IA, with its primary service area including Rock Rapids, George, Little Rock, Lester, Alvord and Doon, and its secondary service area including Larchwood, Steen (MN) and Ellsworth (MN). Sanford Rock Rapids Medical Center is a 16-‐bed Critical Access Hospital, providing medical, diagnostic, therapy and outreach services. Sanford Rock Rapids has over 100 employees. Sanford Rock Rapids Clinic and Sanford George Clinic provide family medicine services. Sanford Rock Rapids Fitness Center offers members 24-‐hour access to meet their various wellness needs. Description of the Community Served Rock Rapids is the county seat of Lyon County Iowa. As of the 2010 census, Rock Rapids’ population was 2,549 with a county population of 11,581. Rock Rapids is located in extreme northwest Iowa, at the junction of Iowa Highway 9 and US Highway, 75 32 miles southeast of Sioux Falls, South Dakota, and only 15 miles south of Interstate 90. There are many recreational opportunities in the area. Fishing, swimming, soccer, baseball, skate park, softball, museums, snowmobiling, ice skating and more are all available in Rock Rapids. Rock Rapids is promoted as the City of Murals. Rock Rapids is predominately an agricultural community. Larger employers with the community are Sanford Rock Rapids, GlyLyon, and Central Lyon School.
Study Design and Methodology
Community Health Needs Assessment of Community Leaders and Focus Studies of Key Stakeholders In May 2011 Sanford Health convened key health care leaders and other not-‐for-‐profit leaders in the Fargo Moorhead community to establish a Fargo Moorhead Community Health Needs Assessment Collaborative. A primary goal of this collaborative was to craft standardized tools, indicators and methodology that can be used by all group members when conducting assessments and also be used by all of the Sanford medical centers across the enterprise. After much discussion it was determined that the Robert Wood Johnson Framework for county profiles would be our secondary data model. The Internal Revenue Code 501 (r) statute requires that a broad base of key community stakeholders have input into the needs of the community. Those community members specified in the statute include: persons who represent the broad interests of the community served by the hospital facility including those with special expertise in public health; Federal, tribal, regional, state and or local health or other departments or agencies with information relevant to the health needs of the community served; leaders, representatives, or members of medically underserved, low-‐income, and minority populations. Sanford extended a good faith effort to engage all of the aforementioned community representatives in the survey process. The list of individuals who agreed to take the survey and also submit their names are included in the acknowledgement section of this report. In some cases there were surveys that were submitted without names or without a specified area of expertise or affiliation. We worked closely with public health experts throughout the assessment process.

13
Public comments and response to the community health needs assessment and the implementations strategies are welcome on the Sanford website under “About Sanford” in the Community Health Needs Assessment section. A sub group of this collaborative met with researchers from the North Dakota State University Center for Social Research to develop a survey tool for our key stakeholder groups. The survey tool incorporated the University of North Dakota’s Center for Rural Health community health needs assessment tool and the Fletcher Allen community health needs assessment tool. North Dakota State University and the University of North Dakota Center for Rural Health worked together to develop additional questions and to ensure that scientific methodology was incorporated in the design. Finally, it was the desire of the collaborative that the data would be shared broadly with others and that if possible it would be hosted on a web site where there could be access for a broad base of community, state and regional individuals and groups. This community health needs assessment was conducted during FY 2012 and FY 2013. The main model for our work is the Association for Community Health Improvement’s (ACHI) Community Health Needs Assessment Toolkit. The following qualitative data sets were studied:
• Survey of Key Stakeholders
The following quantitative data sets were studied: • 2011 County Health Profiles for Lyon County • Aging Profiles for Lyon County • Diversity Profiles for Lyon County
Asset mapping was conducted by reviewing the data and identifying the unmet needs from the various surveys and data sets. The process implemented in this work was based on the McKnight Foundation model -‐ Mapping Community Capacity by John L. McKnight and John P. Kretzmann, Institute for Policy Research at Northwestern University. Each unmet need was researched to determine what resources were available in the community to address the needs. The Sanford Rock Rapids Executive leadership and management team performed the asset mapping and reviewed the findings. Findings were also reviewed with key community stakeholders. The group conducted an informal gap analysis to determine what needs remained after resources were thoroughly researched. Once gaps were determined the executive leadership team proceeded to the prioritization process. The multi-‐voting methodology was implemented to determine what top priorities would be further developed into implementation strategies. 2011 County Health Profiles The County Health Profiles are based largely on the County Health Rankings from the Mobilizing Action Toward Community Health (MATCH), a collaboration between the Robert Wood Johnson Foundation and the University of Wisconsin Population Health Institute. State and national benchmarking required additional data sources, including the U.S. Census Bureau, Small Area Health Insurance Estimates, and the Centers for Disease Control and Prevention’s National Center for Health Statistics – the Health Indicators Warehouse.

14
Aging Profiles The Aging Profiles are based on data from the U.S. Census Bureau, 2010 Census Summary File 1, and 2006-‐2010 American Community Survey Five-‐Year Estimates (sample data). The estimates presented are meant to give perspective on characteristics across age categories; however, because they are based on sample data, one should use caution when interpreting small numbers. Blank values reflect data that is missing or not available. Diversity Profiles The Diversity Profiles are based on data from the U.S. Census Bureau, 2010 Census Summary File 1, and 2006-‐2010 American Community Survey Five-‐Year Estimates (sample data). The estimates presented are meant to give perspective on characteristics across race and ethnic categories; however, because they are based on sample data, one should use caution when interpreting small numbers. Blank values reflect data that is missing or not available. Limitations The Sanford Rock Rapids planning committee Collaborative attempted to survey 100 key community and county stakeholders for the purpose of determining the needs of the community. There were 43 members of this key stakeholder group who completed the survey. The survey asked for individual perceptions of community health issues and is subjective to individual experiences which may or may not be the current status of the community.
Primary Research Summary of the Survey Results Respondents had very high levels of agreement that their community has quality educational opportunities and programs, there is access to quality food, and there is quality health care. Respondents felt strongly that the community was a safe place to live, family friendly, with a healthy environment that has a laidback lifestyle and is peaceful and quiet. The respondents agreed that people within the community are helpful and supportive, there is a sense of engagement within the community, and that people felt connected to the people that live within the community. Respondents also had a high level of agreement that the community is clean, convenient access to work and activities, and that there are many recreational/sports activities available. Respondents were most concerned about cost and availability of child care and bullying among the youth. Respondents were also concerned with issues regarding substance abuse within the community. Environmental issues regarding garbage and litter, water quality, air quality, and noise levels were not a large concern. Among health and wellness concerns, respondents were most concerned about the costs associated with health insurance, health care, and prescription drugs. Respondents were also concerned about physical health issues, particularly obesity, poor nutrition and eating habits, and inactivity or lack of exercise. The adequacy of health and dental insurance (e.g. amount of co-‐pays and deductibles), access to health insurance coverage (e.g. pre-‐existing conditions), and availability of doctors and specialists as well as chronic disease (e.g. diabetes, health disease, multiple sclerosis), prevalence of cancer, and mental health treatment and programs were also among the top health and wellness concerns among respondents. Respondents had very high levels of agreement that access to emergency services, such as ambulance and 911 services, is very well addressed. Respondents were least concerned with the availability of translators, providers not taking new patients, confidentiality, and distance to health care services.

15
Community Assets/Best Things about the Community Using a 1 to 5 scale, with 1 being “not at all” and 5 being “a great deal,” respondents were asked to rate their level of agreement with various statements about their community regarding people, services and resources, and quality of life. Respondents indicated the top five community assets or best things about the community were: the community is a good place to raise kids, there are quality school systems and programs for youth, there is quality health care, and people are friendly, helpful, and supportive. People Overall, respondents had moderately high levels of agreement regarding positive statements that reflect the people in their community (Figure 1).
• On average, respondents also had a fairly high level of agreement that there is a sense of community or feeling connected to people who live here.
• Respondents also agreed that most that people in their community are friendly, helpful, and supportive. • Although still a moderate level of agreement, respondents agreed the least that there is cultural
diversity and tolerance, inclusion, and open-‐mindedness in their community.
Figure 1. Level of agreement with statements about the community regarding PEOPLE
*Means exclude “do not know” responses.
2.98
3.16
3.74
3.84
3.91
4.28
4.35
1 2 3 4 5
The community is socially and culturally diverse (N=42)
There is tolerance, inclusion, open-‐mindedness (N=43)
People who live here are aware of/engaged in social, civic, or polipcal issues (N=43)
There is a sense that you can make a difference (N=43)
There is an engaged government (N=43)
People are friendly, helpful, supporpve (N=43)
There is a sense of community/feeling connected to people who live here (N=43)
Mean (1=not at all, 5=a great deal)*
16
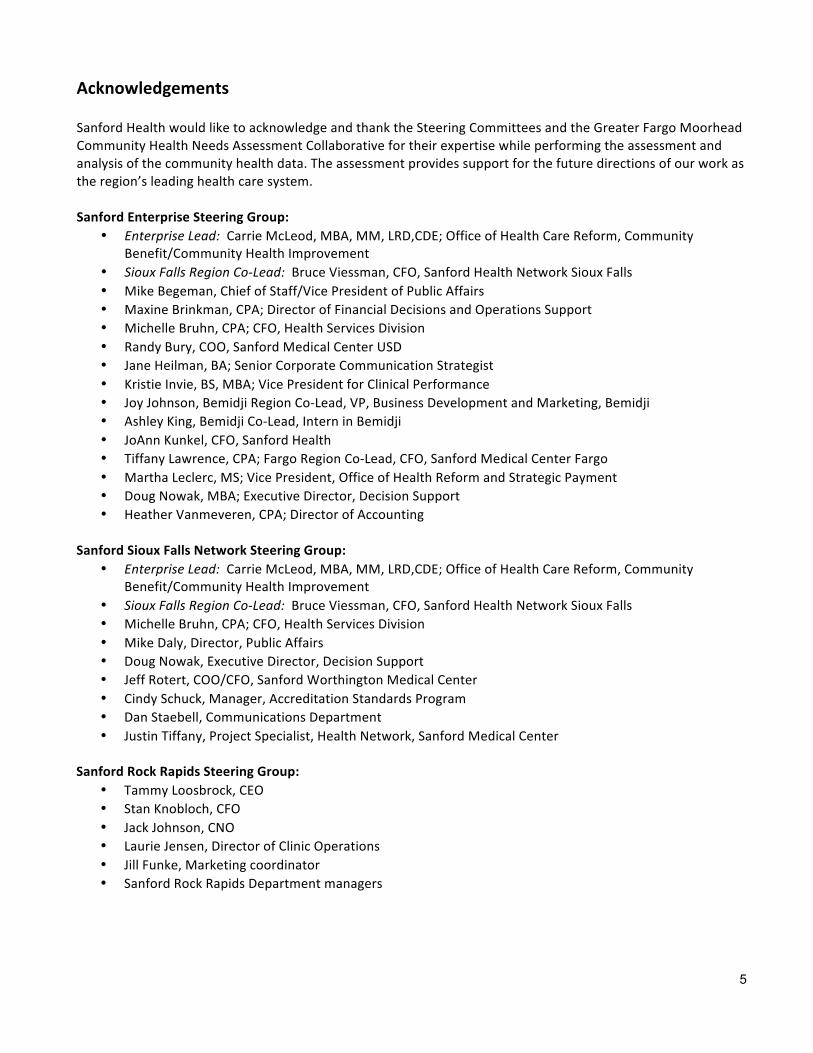
Services and Resources Respondents had high levels of agreement that there are quality school systems and programs for youth in their community as well as quality health care. (Figure 2) Although still a moderate level of agreement, respondents agreed the least that there are quality higher education opportunities and institutions within the community. . Figure 2. Level of agreement with statements about the community regarding SERVICES AND RESOURCES
*Means exclude “do not know” responses.
Quality of Life Respondents had a very high level of agreement that their community is a good place to raise kids. Respondents had high levels of agreement with the remaining components of quality of life issues in their community (Figure 3). Means ranged from 4.77 to 4.26 with respect to the community being a healthy place to live; the community being a safe place to live with little or no crime; the community having a peaceful, calm, and quiet environment; and the community having many recreational, exercise, and sports activities/opportunities. The respondents gave the lowest score (3.37) to the cultural richness of the community Figure 3. Level of agreement with statements about the community regarding QUALITY OF LIFE
*Means exclude “do not know” responses.
3.05
3.50
4.26
4.33
4.42
1 2 3 4 5
There are quality higher educapon opportunipes and insptupons (N=42)
There is effecpve transportapon (N=42)
There is access to quality food (N=43)
There is quality health care (N=42)
There are quality school systems and programs for youth (N=43)
Mean (1=not at all, 5=a great deal)*
3.37
4.26
4.40
4.51
4.77
4.77
1 2 3 4 5
The community has a sense of cultural richness (N=43)
The community has an informal, simple, "laidback lifestyle" (N=43)
The community has a peaceful, calm, quiet environment (N=42)
The community is a "healthy" place to live (N=43)
The community is a safe place to live, has lisle/no crime (N=43)
The community has a family-‐friendly environment, is a good place to raise kids (N=43)
Mean (1=not at all, 5=a great deal)*

17
General Concerns about the Community Respondents had high levels of agreement that people in their community are friendly, helpful, and supportive and that there is a sense of community or feeling connected to people who live here. Among issues regarding people in the community, respondents agreed the least that there is tolerance, inclusion, and open-‐mindedness in their community and that the community is culturally diverse. Using a 1 to 5 scale, with 1 being “not at all” and 5 being “a great deal,” respondents were asked to rate their level of concern with various statements regarding ECONOMIC ISSUES, TRANSPORTATION, ENVIRONMENT, CHILDREN AND YOUTH, THE AGING POPULATION, and SAFETY in their community. Economic Issues Respondents had moderate levels of concern with cost of health care and/or insurance, low wages, with respect to the availability of affordable housing and employment opportunities. Respondents were least concerned with homelessness. (Figure 4) Overall, respondents had a moderate level of concern with economic issues in their community.
• On average, respondents were most concerned with the cost of health care and/or insurance, low wages, and the availability of affordable housing and employment opportunities.
• Respondents were least concerned with homelessness within the community.
Figure 4. Level of concern with statements about the community regarding ECONOMIC ISSUES
*Means exclude “do not know” responses
1.83
2.10
2.81
2.88
3.19
3.40
3.44
3.50
3.62
1 2 3 4 5
Homelessness (N=42)
Hunger (N=42)
Economic disparipes between higher and lower classes (N=42)
Poverty (N=43)
Cost of living (N=43)
Availability of employment opportunipes (N=43)
Availability of affordable housing (N=43)
Low wages (N=42)
Cost of health care and/or insurance (N=42)
Mean (1=not at all, 5=a great deal)*

18
Transportation Respondents were most concerned with road conditions. Respondents were least concerned with traffic congestion. Overall, respondents had a moderate level of concern with transportation issues in their community (Figure 5).
• On average, respondents had moderate concern with road conditions, driving habits, and availability of public transportation.
• On average, respondents had low levels of concern with traffic congestion. Figure 5. Respondents’ level of concern with statements about their community regarding TRANSPORTATION
*Means exclude “do not know” responses.
Environment Respondents on average had moderate to low concern with environmental issues in their community. Overall, respondents were not that concerned with environmental issues in their community (Figure 6).
• On average, respondents had a higher level of concern with water pollution.
Figure 6. Respondents’ level of concern with statements about their community regarding ENVIRONMENTAL POLLUTION
*Means exclude “do not know” responses.
1.23
2.14
2.48
2.95
1 2 3 4 5
Traffic congespon (N=43)
Availability of public transportapon (N=42)
Driving habits (e.g., speeding, "road rage") (N=42)
Road condipons (N=43)
Mean (1=not at all, 5=a great deal)*
2.14
2.26
2.49
1 2 3 4 5
Noise pollupon (N=43)
Air pollupon (N=43)
Water pollupon (N=43)
Mean (1=not at all, 5=a great deal)*

19
Safety Regarding safety issues in their community, respondents were most concerned with substance abuse, child abuse and neglect and domestic violence. Respondents were least concerned with prostitution. Overall, respondents had a moderate level of concern with safety issues in their community (Figure 7).
• On average, respondents were most concerned with substance abuse, child abuse and neglect and domestic violence.
• On average, respondents had low levels of concern about violent crimes and prostitution. Figure 7. Respondents’ level of concern with statements about their community regarding SAFETY
*Means exclude “do not know” responses.
Children and Youth Regarding children and youth, respondents were most concerned with bullying and the changes in family composition (e.g. divorce, single parent, etc). Respondents were least concerned with school dropout rates/truancy. Overall, respondents had a moderate level of concern with issues relating to children and youth in their community. (Figure 8)
• On average, respondents were most concerned about bullying and the changes in family composition (e.g. divorce, single parent, etc).
• Respondents had a moderate level of concern regarding youth crime and teen pregnancy • Respondents had a moderately low level of concern with school dropout rates/truancy
1.60
2.05
2.53
2.85
2.90
3.17
1 2 3 4 5
Prosptupon (N=42)
Violent crimes (N=43)
Property crimes (N=43)
Domespc violence (N=41)
Child abuse and neglect (N=42)
Substance abuse (N=42)
Mean (1=not at all, 5=a great deal)*

20
Figure 8. Respondents’ level of concern with statements about their community regarding YOUTH CONCERNS
*Means exclude “do not know” responses.
Community Health and Wellness Concerns Using a 1 to 5 scale, with 1 being “not at all” and 5 being “a great deal,” respondents were asked to rate their level of concern with various health and wellness issues with respect to access to health care, physical and mental health, and substance use and abuse. The top six health and wellness concerns among community leaders were:
• cost of health insurance • cost of health care • cost of prescription drugs • stress related issues • adequacy of health insurance coverage • adequacy of dental/vision coverage
Access to Health Care Respondents had high levels of concern with respect to costs associated with health and wellness in their community. Cost of health insurance, cost of health care, and cost of prescription drugs were the top three concerns. (Figure 9) Respondents also had concerns with respect to access and the availability of health and wellness service providers in their community. Access to health insurance coverage, availability of prevention programs, availability and cost of dental and vision care, availability of and cost of dental and vision insurance coverage, coordination of care, and availability of mental health services and providers were all well above average in level of concern. Respondents had below average levels of concern with distance to health care services and patient confidentiality.
2.43
2.84
2.88
3.44
3.67
1 2 3 4 5
School dropout rates/truancy (N=42)
Teen pregnancy (N=43)
Youth crime (N=43)
Changes in family composipon (e.g., divorce, single parenpng) (N=43)
Bullying (N=42)
Mean (1=not at all, 5=a great deal)*

21
Figure 9. Respondents’ level of concern with statements about their community regarding ACCESS TO HEALTH CARE
*Means exclude “do not know” responses.
2.37
2.37
2.50
2.54
2.56
2.68
2.71
2.78
3.21
3.48
3.50
3.52
3.59
3.90
4.05
4.10
4.21
1 2 3 4 5
Provider is not taking new papents (N=38)
Availability of bilingual providers and/or translators (N=41)
Confidenpality (N=42)
Time it takes to get an appointment (N=41)
Availability of/access to transportapon (N=41)
Availability of non-‐tradiponal hours (e.g., evenings, weekends) (N=41)
Distance to health care services (N=42)
Use of emergency room services for primary health care (N=40)
Availability of prevenpon programs or services (N=42)
Availability of doctors, nurses, and/or specialists (N=42)
Availability and/or cost of dental and/or vision care (N=42)
Access to health insurance coverage (e.g., preexispng condipons) (N=42)
Availability and/or cost of dental and/or vision insurance coverage (N=41)
Adequacy of health insurance (e.g., amount of co-‐pays & deducpbles, consistency of coverage) (N=42)
Cost of prescripton drugs (N=42)
Cost of health care (N=42)
Cost of health insurance (N=42)
Mean (1=not at all, 5=a great deal)*

22
Physical and Mental Health Regarding physical and mental health issues, respondents had the highest levels of concern with stress related mental health issues, availability of providers and services to address mental health issues, obesity, poor nutrition and eating habits, and inactivity and lack of exercise facilities. Respondents were least concerned with availability of good walking or biking options (Figures 10 and 11). Figure 10. Level of concern with statements about the community regarding PHYSICAL HEALTH
*Means exclude “do not know” responses.
Figure 11. Level of concern with statements about the community regarding MENTAL HEALTH
*Means exclude “do not know” responses.
2.71
2.78
2.79
3.24
3.24
3.40
1 2 3 4 5
Availability of good walking or biking oppons (as alternapves to driving) (N=42)
Cost of exercise facilipes (N=40)
Availability of exercise facilipes (N=42)
Lack of exercise and/or inacpvity (N=42)
Poor nutripon/eapng habits (N=42)
Obesity (N=42)
Mean (1=not at all, 5=a great deal)*
3.20
3.20
3.27
3.29
3.56
1 2 3 4 5
Depression (N=41)
Quality of mental health programs (N=40)
Availability of qualified mental health providers (N=41)
Availability of services for addressing mental health problems (N=41)
Stress (N=41)
Mean (1=not at all, 5=a great deal)*

23
Substance Use and Abuse The levels of concern among respondents regarding substance use, smoking, and drug use and abuse issues in their community were fairly high. Respondents were most concerned about alcohol use and abuse. Although still moderately high, respondents were least concerned about presence and influence of drug dealers in the community. (Figure 12) Figure 12. Respondents’ level of concern with statements about their community regarding SUBSTANCE USE AND ABUSE
*Means exclude “do not know” responses.
Personal Heath Care Information The top three reasons respondents gave for their choice of primary health care provider were quality of services, being influenced by their health insurance, and location. Less than one in five respondents said they had not had a cancer screening or cancer care in the past year. (Figure 13. The most common reason for not having done so was because it was not necessary. Fear, unfamiliarity with recommendations, and not knowing who to see were also reasons respondents gave. Respondents were asked whether they had a cancer screening or cancer care in the past year, and if they had not, reasons for not having done so. One in three respondents said they had not had a cancer screening or cancer care in the past year. Figure 13. Whether respondents had a cancer screening or cancer care in the past year
*Means exclude “do not know” responses.
Cancer Screening
3.15
3.40
3.41
3.41
1 2 3 4 5
Presence and influence of drug dealers in the community (N=39)
Drug use and abuse (N=40)
Smoking (N=41)
Alcohol use and abuse (N=41)
Mean (1=not at all, 5=a great deal)*
0 10 20 30 40 50 60 70 80 90 100
Yes (N=12)
No (N=28)

24
Among respondents who had not had a cancer screening or cancer care in the past year, one in two said they had not done so because their doctor had not suggested it. Not necessary or unfamiliar with the recommendations were also reasons for some respondents. (Figure 14) Figure 14. Respondents cited reason for not having cancer screening or cancer care in the past year
*Means exclude “do not know” responses.
Health Care Coverage Respondents were asked how they had paid for health care costs, for themselves or family members, over the last 12 months. A majority of respondents said they had paid for health care costs over the last 12 months by health insurance through an employer. Private insurance, personal income and Medicare were also used. (Figure 15) Figure 15. Methods respondents have used to pay for health care costs over the last 12 months
*Means exclude “do not know” responses Primary Care Provider
50.00
46.40
14.30
7.10
3.60
3.60
0.00
0 5 10 15 20 25 30 35 40 45 50 55 60
Doctor hasn't suggested it (N=14)
Not necessary (N=13)
Unfamiliar with the recommendapons (N=4)
Cost (N=2)
Fear (N=1)
Other (N=1)
Unable to access care (N=0)
Percentage of responses
68.30
34.10
31.70
0.00
17.10
0.00
2.40
4.90
0.00
0 10 20 30 40 50 60 70
Health Insurance through an employer (N=28)
Private health insurance (N=14)
Personal income (eg cash, check, credit card) (N=13)
Medicaid (N=0)
Medicare (N=7)
Indian Health Service (N=0)
Military (N=1)
Veteran's health care benefits (N=2)
Did not access healthcare in past 12 mo (N=0)
Percent response

25
The top three reasons respondents gave for their choice of primary health care provider were location, quality of services, and availability of services. (Figure 16) Influenced by health insurance was not an issue in choosing a provider for most respondents. Figure 16. Respondents’ reasons for choosing primary health care provider
*Means exclude “do not know” responses.
Respondents’ Primary Health Care Provider Respondents were asked which provider they used for their primary health care. Seventy two percent (72%) of respondents said they use Sanford Health as their primary health care provider. One in five said they use Avera Health. (Figure 17) Figure 17. Respondents’ primary health care provider
*Means exclude “do not know” responses.
87.50
62.50
55.00
50.00
10.00
15.00
0 10 20 30 40 50 60 70 80 90 100
Locapon (N=35)
Quality of services (N=25)
Availability of services (N=22)
Sense of being valued as a papent (N=20)
Influenced by health insurance (N=4)
Other reasons (N=6)
Percent of responses
20.00
72.00
4.00
4.00
0 10 20 30 40 50 60 70 80 90 100
Avera (N=5)
Sanford (N=18)
Other (N=1)
Mulpple systems (N=1)
Percent response

26
Respondents Representing Chronic Disease Respondents were asked to select their personal general health conditions/diseases. High cholesterol received the most responses with 34.2 % of participants selecting this condition. The chronic diseases found in the highest percentage among respondents include, arthritis, depression, anxiety, stress, muscles or bone problems, and hypercholesterolemia. (Figure 18) Figure18. Respondent’s health/chronic diseases
Demographic Information Sixty percent (60%) of the respondents were female, 40% were male, and 100% were white. The age of the respondents ranged from 25 years to over 65 years old; with 22.5% of respondents between 25-‐34 years, 25% between 35-‐44 years, 10% between 45-‐54 years, 2.5 % between 55-‐59 years, 12.5% between 60-‐64 years, and 17.5% were 65 years and older. Respondents’ education: 20% had high school education or GED equivalent, 12.5% have had some college with no degree, 12.5% have an Associate level degree, 37.5% have a Bachelor’s degree, and 17.5% have a graduate or professional level degree.
23.7% 2.6% 2.6%
18.4% 0.0%
5.3% 18.4%
2.6% 34.2%
7.9% 2.6%
28.9% 23.7%
7.9%
0 0.05 0.1 0.15 0.2 0.25 0.3 0.35 0.4
Arthri`s Asthma Cancer
Depression, Anxiety, stress Demen`a/Alzheimer's
Diabetes Muscles or bone problems
Heart condi`ons High cholesterol
Hypertension Ob/Gyn
Weight control None Other
Respondents Represen`ng Chronic Disease
27
Secondary Research
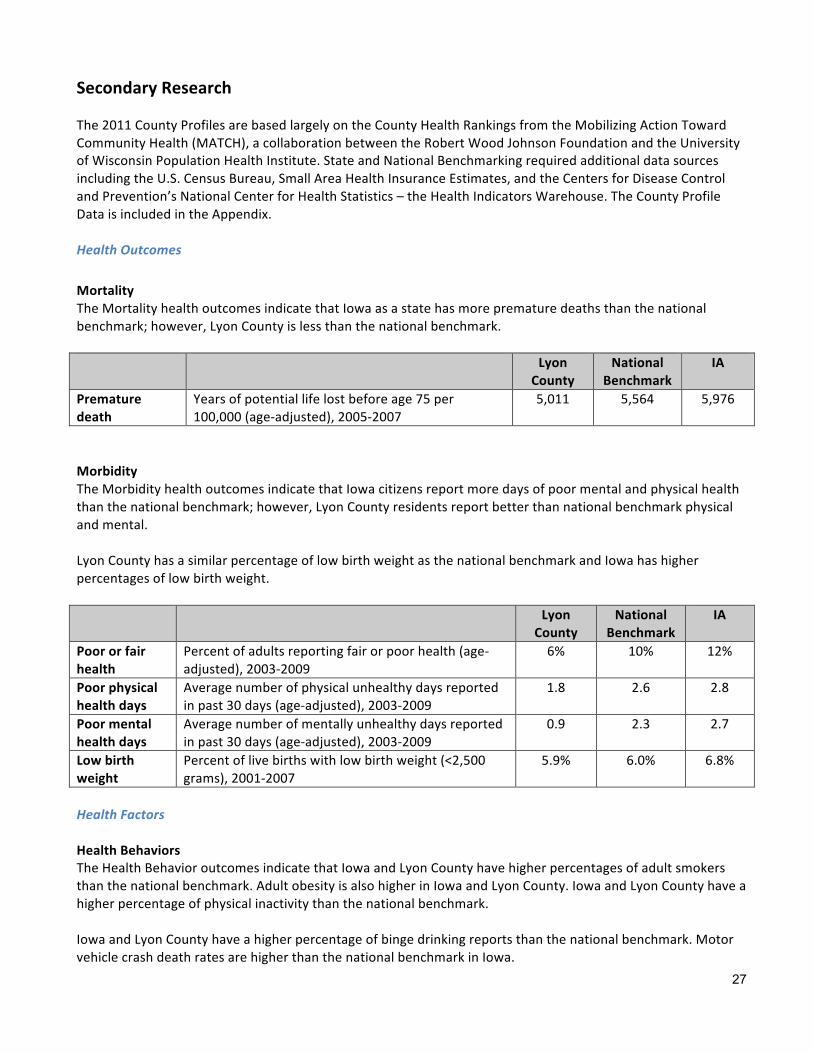
The 2011 County Profiles are based largely on the County Health Rankings from the Mobilizing Action Toward Community Health (MATCH), a collaboration between the Robert Wood Johnson Foundation and the University of Wisconsin Population Health Institute. State and National Benchmarking required additional data sources including the U.S. Census Bureau, Small Area Health Insurance Estimates, and the Centers for Disease Control and Prevention’s National Center for Health Statistics – the Health Indicators Warehouse. The County Profile Data is included in the Appendix. Health Outcomes Mortality The Mortality health outcomes indicate that Iowa as a state has more premature deaths than the national benchmark; however, Lyon County is less than the national benchmark. Lyon
County National
Benchmark IA
Premature death
Years of potential life lost before age 75 per 100,000 (age-‐adjusted), 2005-‐2007
5,011 5,564 5,976
Morbidity The Morbidity health outcomes indicate that Iowa citizens report more days of poor mental and physical health than the national benchmark; however, Lyon County residents report better than national benchmark physical and mental. Lyon County has a similar percentage of low birth weight as the national benchmark and Iowa has higher percentages of low birth weight. Lyon
County National
Benchmark IA
Poor or fair health
Percent of adults reporting fair or poor health (age-‐adjusted), 2003-‐2009
6% 10% 12%
Poor physical health days
Average number of physical unhealthy days reported in past 30 days (age-‐adjusted), 2003-‐2009
1.8 2.6 2.8
Poor mental health days
Average number of mentally unhealthy days reported in past 30 days (age-‐adjusted), 2003-‐2009
0.9 2.3 2.7
Low birth weight
Percent of live births with low birth weight (<2,500 grams), 2001-‐2007
5.9% 6.0% 6.8%
Health Factors Health Behaviors The Health Behavior outcomes indicate that Iowa and Lyon County have higher percentages of adult smokers than the national benchmark. Adult obesity is also higher in Iowa and Lyon County. Iowa and Lyon County have a higher percentage of physical inactivity than the national benchmark. Iowa and Lyon County have a higher percentage of binge drinking reports than the national benchmark. Motor vehicle crash death rates are higher than the national benchmark in Iowa.

28
Sexually transmitted infections rank substantially higher than the national benchmark for Iowa; however, significantly lower than the national benchmark for Lyon County. The teen birth rate is higher in Iowa than the national benchmark, but is significantly lower in Lyon County. Sexually transmitted infections rank substantially lower than the national benchmark for Iowa and the national benchmark. The teen birth rate is higher in Iowa than the national benchmark but is lower in Lyon County. Maps 6-‐12 in the Appendix provide county views of the Health Behavior indicators within NW Iowa. Lyon
County National
Benchmark IA
Adult smoking Percent of adults who currently smoke and have smoked at least 100 cigarettes in their lifetime, 2003-‐2009
21% 15% 20%
Adult obesity Percent of adults that report a body mass index (BMI) of at least 30 kg/m2, 2008
27% 25% 28%
Physical inactivity
Percent of adults reporting no leisure physical activity, 2008
25% 20% 25%
Excessive drinking
Percent of adults reporting binge drinking and heavy drinking, ( consuming >4 for women and >5 for men on a single occasion ) 2003-‐2009
17% 8% 20%
Motor vehicle crash death rate
Motor vehicle crash deaths per 100,000 population, 2001-‐2007
Unreliable or missing
data
12.0 15.2
Sexually transmitted infections
Number of Chlamydia cases (new cases reported) per 100,000 population 2008
26.7 83.0 313.6
Teen birth rate Number of teen births per 100,000 females ages 15-‐19, 2001-‐2007
16.4 22.0 32.0
Clinical Care The Clinical Care outcomes indicate that Lyon County has a higher percentage of uninsured adults and youth than the national benchmark, while Iowa as a state has similar percentages as the national benchmark. The ratio of population to primary care physicians is significantly higher in Lyon County than the national or state benchmark. The ratio of population to mental health providers is much higher in Iowa and Lyon County than the national benchmark. The number of professionally active dentists is lower than the national benchmark in Iowa and Lyon County. Preventable hospital stays are higher than the national benchmark in Iowa and Lyon County. Diabetes screening in Iowa and in Lyon County is slightly lower than the national benchmark. Lyon County ranks higher than the national benchmark for mammography screenings, while Iowa is slightly under the national benchmark.

29
Lyon County
National Benchmark
IA
Uninsured adults
Percent of adult population ages 18-‐64 without health insurance, 2007
20% 13% 13%
Uninsured youth Percent of youth ages 0-‐18 without health insurance.
13% 7% 6%
Primary Care Physicians
Ratio of population to primary care physicians, 2008 2,797:1 631:1 984:1
Mental Health Providers
Ratio of total population to mental health providers, 2008
11,189:1 2,242:1 14,190:1
Dentist rate Number of professionally active dentists per 100,000 population, 2007
53.4 69.0 54.0
Preventable hospital stays
Hospitalization discharges for ambulatory care-‐sensitive conditions per 1,000 Medicare enrollees, 2006-‐2007
69.4 52.0 67.5
Diabetes screening
Percent of Medicare enrollees with diabetes that receive HbA1c screening, 2006-‐2007
85% 89% 86%
Mammography screening
Percent of female Medicare enrollees that receive mammography screening, 2006-‐2007
77% 74% 67%
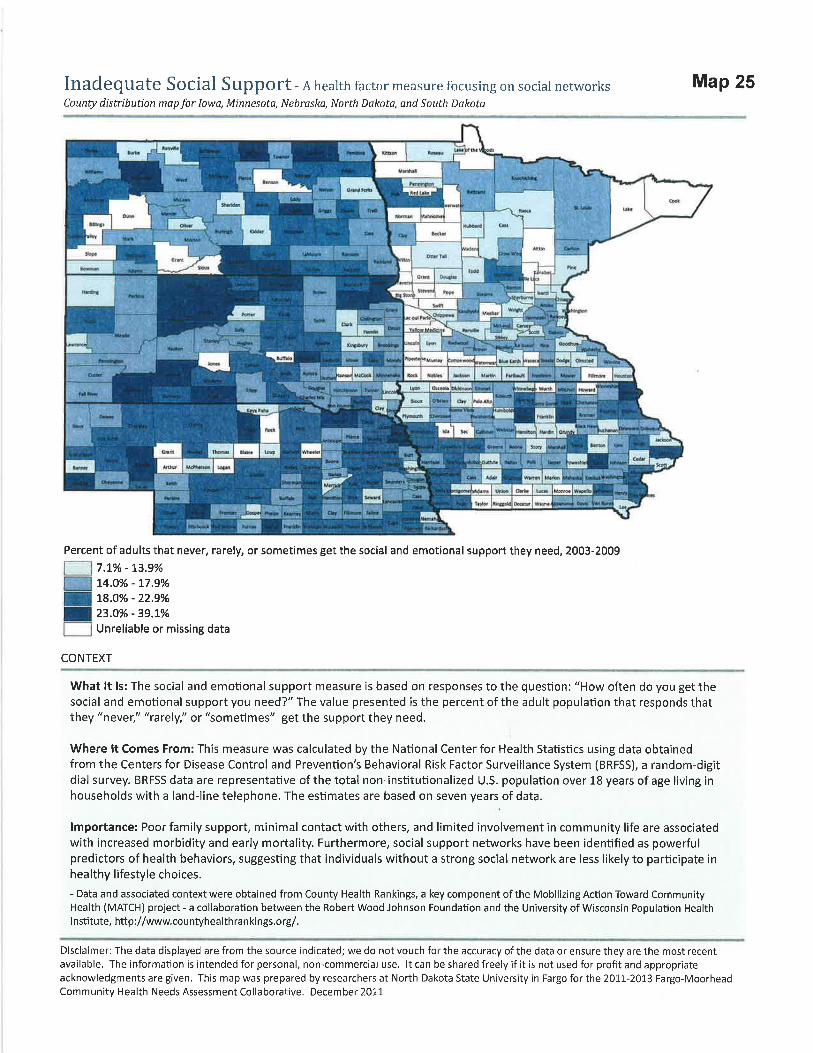
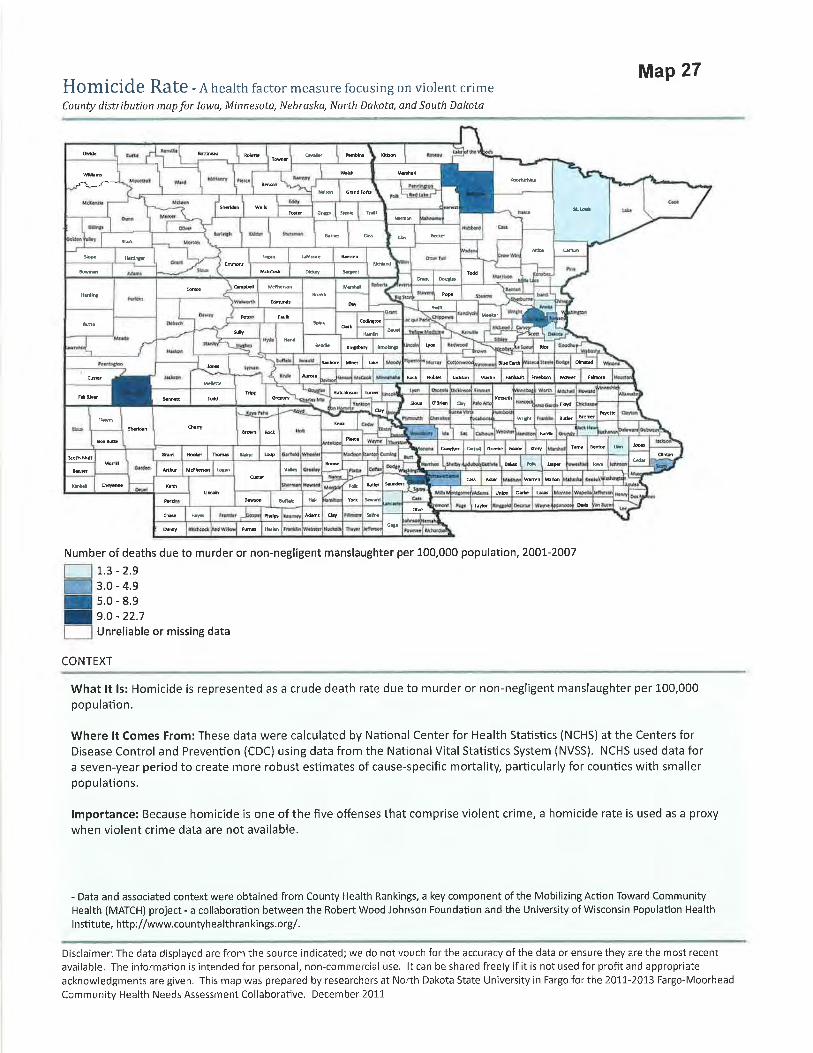
Social and Economic Factors The Social and Economic Factors outcomes indicate that Iowa and Lyon County have a higher high school graduation rate than the national benchmark; however, they have a lower percentage of post-‐secondary education than the national benchmark. The unemployment rate was slightly higher in Iowa than the national benchmark during 2009; however, it was below the national benchmark for Lyon County. The percentage of child poverty is less in Lyon County and Iowa than the national benchmark. Inadequate social support is lower in Iowa and Lyon County than the national benchmark. The percentage of children in single parent households is significantly lower in Lyon County than the national benchmark or Iowa. The number of homicide deaths in Lyon County is not available as data is unreliable or missing. The number for Iowa is almost twice the national benchmark for 2001-‐2007. Maps 21-‐27 in the Appendix provide county views of the Social and Economic indicators within the five-‐state region.

30
Lyon County
National Benchmark
IA
High school graduation
Percent of ninth-‐grade cohort in public schools that graduates from high school in four years 2006-‐2007
95% 92% 87%
Some college Percent of adults ages 25-‐44 with some post-‐secondary education, 2005-‐2009
61% 68% 66%
Unemployment Percent of population ages 16 and older that is unemployed but seeking work 2009
4.0% 5.3% 6.0%
Child poverty Percent of children ages 0-‐17 living below the Federal Poverty Line, 2008
10% 11% 14%
Inadequate social support
Percent of adults that never, rarely, or sometimes get the social and emotional support they need, 2003-‐2009
12% 14% 16%
Children in single parent households
Percent of children in families that live in a household headed by a parent with no spouse present, 2005-‐2009
10% 20% 26%
Homicide rates Number of deaths due to murder or non-‐negligent manslaughter per 100,000 population, 2001-‐2007
Unreliable or missing
data
1.0 1.9
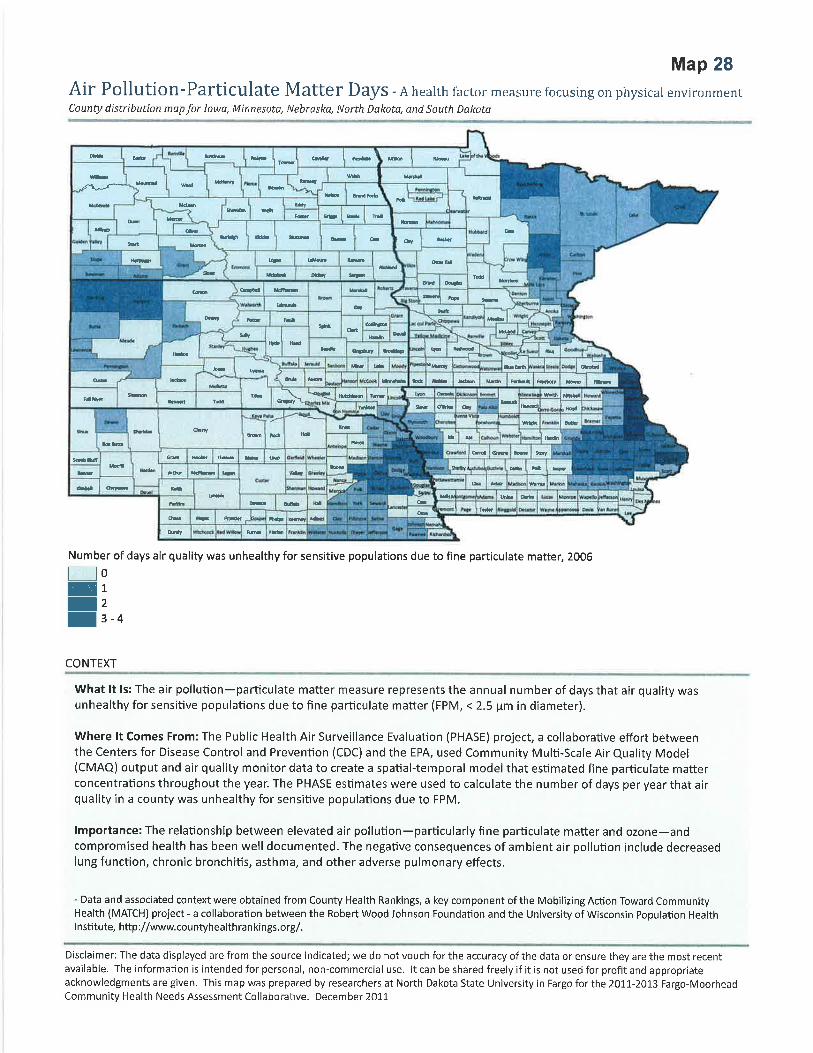
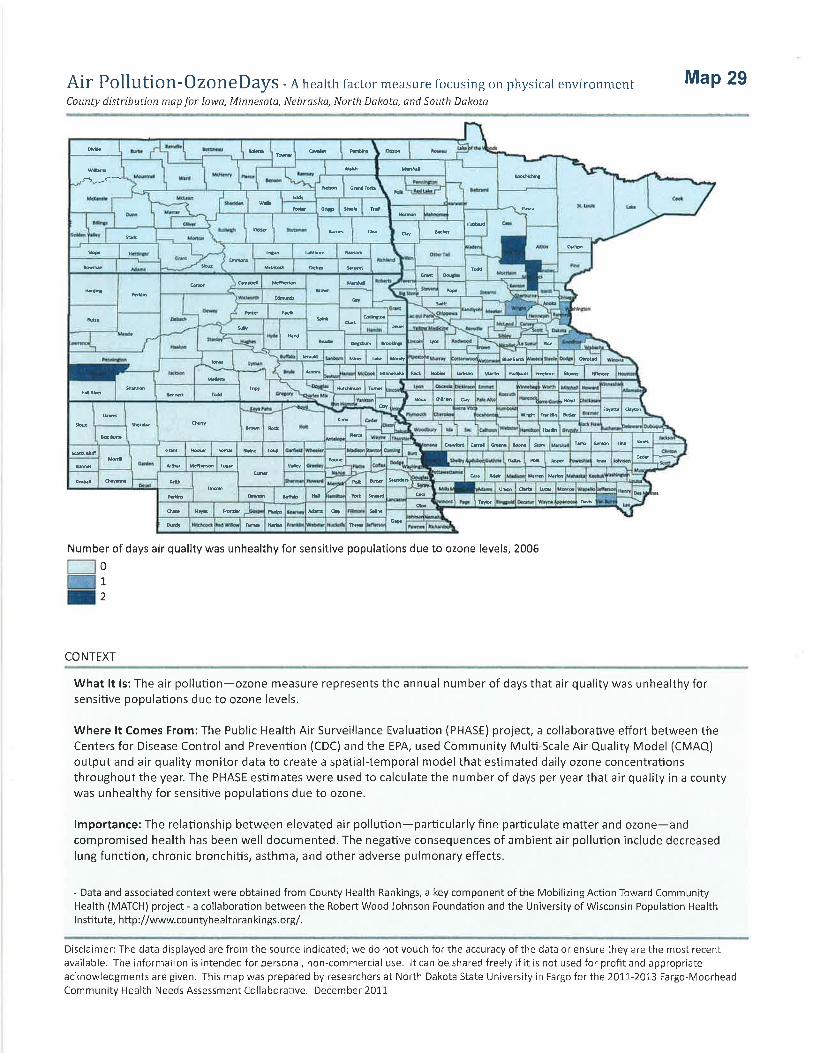
Physical Environment The Physical Environment outcomes indicate that there is no air pollution or ozone pollution in this area. Access to healthy food is ranked slightly below the national benchmark, but significantly better than Iowa as a whole. Access to recreational facilities ranks similar to the national benchmark for Lyon County but lower than the benchmark for Iowa data in 2008. Maps 28-‐31 in the Appendix provide county views of the Physical Environment indicators within the five-‐state region. Lyon
County National
Benchmark IA
Air pollution-‐particulate matter
Number of days air quality was unhealthy for sensitive populations due to fine particulate matter, 2006
0 0 10
Air pollution-‐ ozone
Number of days air quality was unhealthy for sensitive populations due to ozone levels, 2006
0 0 0
Access to healthy foods
Percent of zip codes with a healthy food outlet (i.e. grocery store or produce stand/farmers market), 2008
86% 92% 39%
Access to recreational facilities
Number of recreational facilities per 100,000 population 2008
18.0 17.0 12.0

31
Demographics Youth account for 27% of the population in Lyon County. Elderly account for 17% of the population in Lyon County. One hundred percent (100%) of Lyon County is rural compared to 39% of Iowa and 21% as the national benchmark. Only 1% of Lyon county residents and 3% of Iowans are not proficient in English compared to the national benchmark, which is 9%. Lyon County and Iowa have a low illiteracy rate (8%) compared to the national benchmark of 15%. Maps 32-‐36 in the Appendix provide county views of the demographics within the five-‐state region. Lyon
County National
Benchmark IA
Youth Percent of total population ages 0-‐17, 2009 27% 24% 24% Elderly Percent of total population ages 65 and older, 2009 17% 13% 15% Rural Percent of total population living in rural area, 2000 100% 21% 39% Not English Proficient
Percent of total population that speaks English less than “very well”. 2005-‐2009
1% 9% 3%
Illiteracy Percent of population ages 16 and older that lacks basic prose literacy skills, 2003
8% 15% 8%
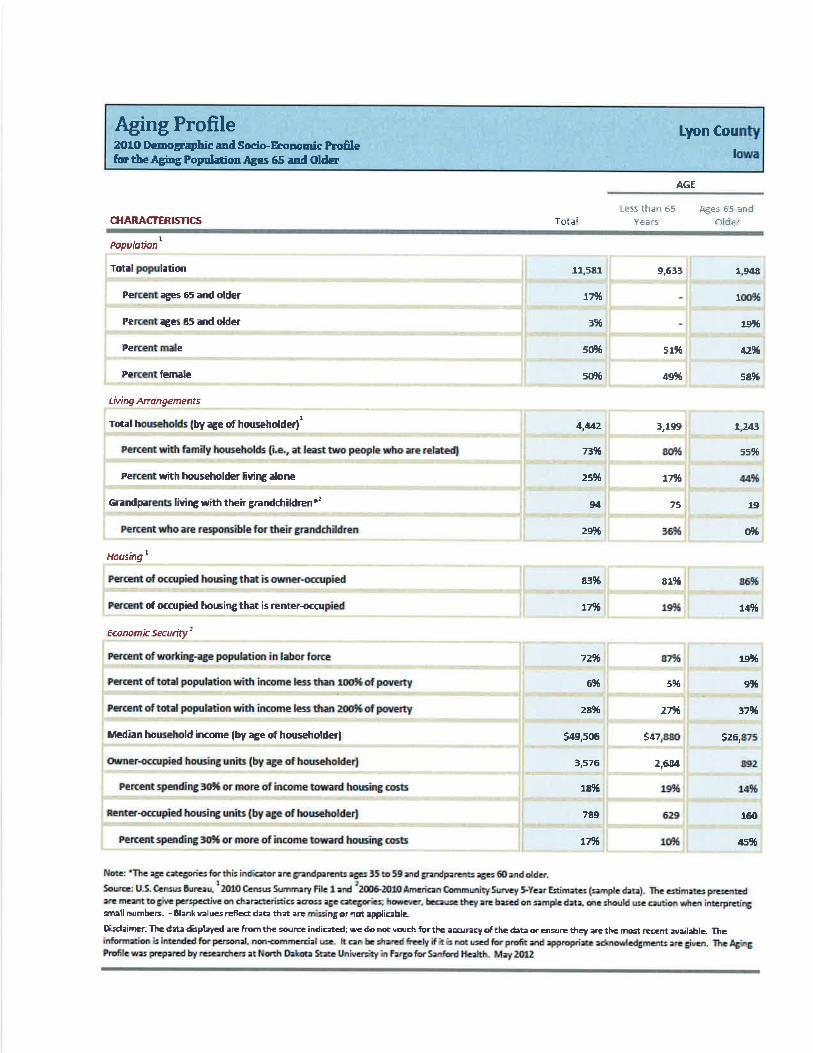
Population by Age County Aging Profile data is included in the Appendix. The population for this area has 3% older than 85 years of age and 17% older than 65 years of age. The state of Iowa has 15% over 65 and 3% over the age of 85 years of age. The gender distribution is 50-‐50 in Lyon County and in the state of Iowa. Lyon County Iowa Total population 11,581 3,046,355 Percent ages 65 and older 17% 15% Percent 85 and older 3% 3% Percent male 50% 50% Percent female 50% 50%
Based on 2010 Census data Housing A significant number of individuals (83%) in this region own their homes. Lyon County Iowa Percent of occupied housing that is owner-‐occupied 83% 72% Percent of occupied housing that is renter-‐occupied 17% 28% Based on 2010 Census data

32
Economic Security According to the 2010 Census Data, the population of working age in the labor force is 69% in Iowa and 72% in Lyon County. The percentage of those who are living at less than 100% of the Federal poverty level is 12% in Iowa and significantly less in Lyon County (6%). Twenty-‐eight percent (28%) of Lyon County residents and 29% of Iowans are at less than 200% of the Federal poverty level. The median household income in Iowa is $47,872 with Lyon County at $49,506 median annual income. Lyon County Iowa Percent of working age population in the labor force 72% 69% Percent of total population with income less than 100% of poverty 6% 12% Percent of total population with income less than 200% of poverty 28% 29% Median household income $49,506 $48,872 Owner occupied housing units 3,576 889,912 Percent spending 30% or more income toward housing costs 18% 20% Renter occupied housing units 789 326,042 Percent renters spending 30% or more of income toward housing costs 17% 40% Diversity Profile The population distribution by race demonstrates that Lyon County is significantly white (98%), followed by Hispanic. Iowa is slightly more diverse with 91% white followed by Hispanic. (See Appendix) Lyon County Iowa Total population 11,581 3,046,355 White alone 11,340 2,781,561 Asian alone 25 53,094 Black alone 10 89,148 Hispanic origin – of any race 212 151,544 American Indian 9 11,084

33
Health Needs Identified
The following needs were identified from the surveys and analysis of secondary data: • Facility upgrades to enhance quality and health care access • Increase knowledge and awareness of services available within the community • Obesity specific to poor nutrition, inactivity and chronic disease and care coordination for these services • Mental health and care coordination for mental health services
Community Assets/Prioritization Process A review of the primary and secondary research concerns was conducted followed by an asset mapping exercise to determine what resources were available to address the needs. An informal gap analysis was conducted at the conclusion of the asset mapping work. Identified needs that were related to other groups within the community will be shared with that group. Table 4 in the Appendix displays the concerns and assessed needs that were determined by the assessment and includes the assets in the community that address the needs. The priorities that remain include:
• Facility upgrades to enhance quality and health care access • Increase knowledge and awareness of services available within the community
The Sanford Rock Rapids leadership team is establishing key initiative strategies to address the first two identified needs. Sanford Rock Rapids leadership will be partnering with system leadership from Sanford Health to work on the system level priorities of obesity and mental health. Table 5 in the Appendix displays the unmet needs that were determined after the asset mapping exercise and the prioritized list of remaining needs.

34
IMPLEMENTATION STRATEGY

35
2013 Community Health Needs Assessment
Sanford Rock Rapids Implementation Strategy The following unmet needs were identified through a formal community health needs assessment, resource mapping and prioritization process:
• Facility upgrades to enhance quality and health care access • Increase knowledge and awareness of services available within the community
Facility Upgrades to Enhance Quality and Health Care Access Work related to this need will be done jointly by the Sanford Rock Rapids leadership team, Sanford Health Network, and MPCH Association Board as the MPCH Association Board maintains ownership of the building and grounds.
• Develop bridge plan for existing facility to maintain patient safety through reinvestment of lease proceeds during renovation/construction
• Review existing renovation plan and evaluate other options for facility changes with the MPCH Association
• Review existing construction finance plan and update financing plan to account for market changes (comparing budgeted performance with actual performance) /building program changes
• MPCH Association and Sanford Health Network communicate and agree on plan to upgrade facility infrastructure
Increase Knowledge and Awareness of Services Available within the Community • Internal team to analyze available resources and determine how to access resources • External group/Lyon County Collaborative to review existing list of community resources and determine
modifications that need to be made • Design/print resource materials with Sanford marketing • Share resource tool with key community stakeholders/access points to care

36
2013 Community Health Needs Assessment
Enterprise Implementation Strategy The following unmet needs were identified through a formal community health needs assessment, resource mapping and prioritization process:
• Mental Health Services • Obesity
Implementation Strategy: Mental Health Services -‐ Sanford One Mind
• Completion (to the extent resources allow) of full integration of Behavioral Health services in all primary care clinics in Fargo and Sioux Falls
• Completion (to the extent resources allow) of full integration of Behavioral Health services or access to Behavioral Health outreach in all regional clinic sites in the North, South and Bemidji regions
• Complete presentation of outcomes of first three years of integrated Behavioral Health services • Implementation of integrated Behavioral Health into clinics in new regions • Design Team for Inpatient Psychiatric Unit, Partial Hospitalization and Clinic Space for Fargo presents
recommendations for design of new spaces • Design Team for Sioux Falls Inpatient Psychiatric Units and Partial Hospitalization
Implementation Strategy: Obesity
• Medical Management for Obesity o Develop CME curriculum for providers and interdisciplinary teams across the enterprise
inclusive of medical, nutrition, nursing, and Behavioral Health professionals • Develop community education programming
o Include the following program options in the curriculum to create awareness of existing resources: Ø Family Wellness Center Ø Honor Your Health Program Ø WebMD Fit Program Ø Bariatric Services Ø Eating Disorder Institute Ø Mental Health/Behavioral Health Ø Profile
• Actively participate in community initiatives to address wellness, fitness and healthy living

37
APPENDIX


100-
1031
9-00
03 R
ev. 2
/13