Embed Size (px)
Citation preview

SHARING KNOWLEDGE. GROWING IMPACT.
cfinsights.org
© CF Insights 2015
Community Foundation
Business Models
Prepared for:
FAOG Conference 2015
October 12, 2015

the IDEA BEHIND
IS SIMPLE
What if EACH community
foundation could know what
ALL community foundations
collectively know?
“Strengthen the social sector by
advancing knowledge about
philanthropy in the U.S. and around
the world.”

Reflecting On Over 10 Years
2006-2010 2004-2006
Center for
Financial
Insights
IMAGINE
&
FUND
at
2015-
MOVE
&
EXPAND
2010-2014
LAUNCH
&
BUILD
EVOLVE
&
ENHANCE
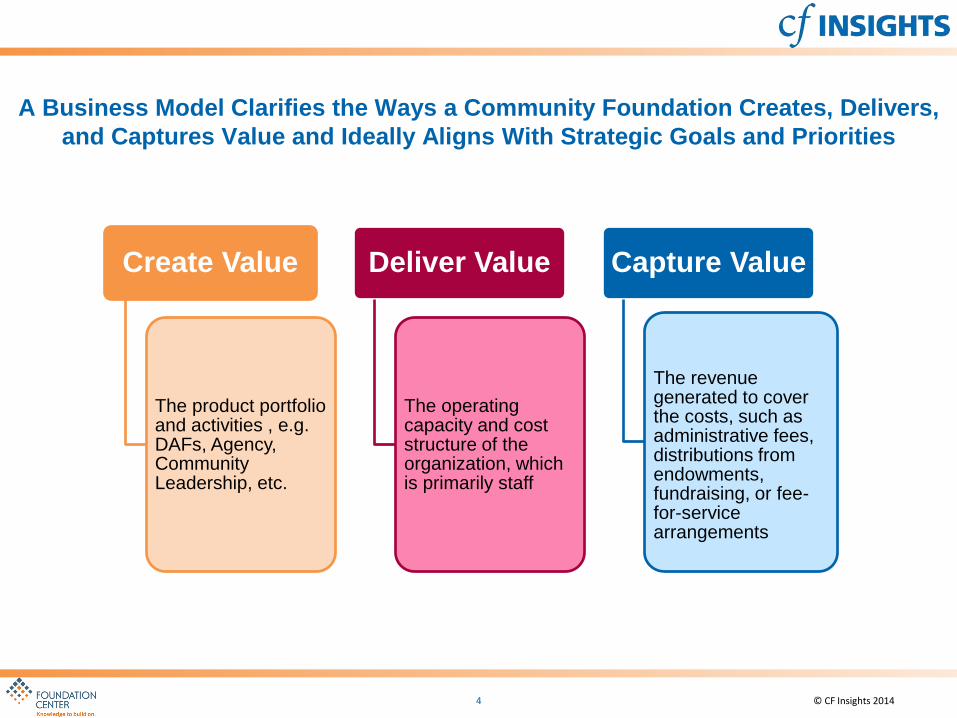
A Business Model Clarifies the Ways a Community Foundation Creates, Delivers,
and Captures Value and Ideally Aligns With Strategic Goals and Priorities
© CF Insights 2014 4
Create Value
The product portfolio and activities , e.g. DAFs, Agency, Community Leadership, etc.
Deliver Value
The operating capacity and cost structure of the organization, which is primarily staff
Capture Value
The revenue generated to cover the costs, such as administrative fees, distributions from endowments, fundraising, or fee-for-service arrangements

We are the community’s
philanthropic
institution, our value is
inherently clear.
We can rely on our
endowment/discretionary
funds to cover operations
and leadership funding
needs.
We’ve been in this
business for a
long time. We
know what works.
We don’t have the
time or capacity to
evaluate our
business model. As part of the Social
Sector we should
be mission-driven
not profit and
revenue driven.
Yet Reluctance to Define, Analyze, and Evolve Community Foundation
Business Models Persists Among Both Staff and Boards
Given our unique circumstances,
what works at other foundations
won’t apply to us.

For example:
• How to be thoughtful about future areas of growth and investment, particularly in areas with
challenging business model implications or less alignment with mission
- Product growth and focus should be intentional and aligned with mission and strategy
- Similarly, investments in products and activities should be the result of intentional decisions
rather than a lack of information
• How to consider opportunities to enhance programmatic and leadership possibilities in order
to grow impact and relationships in the community
- Clarify the foundation’s leadership role in the community
- Determine new terms for accepting new relationships or projects
A Review of the Business Model Will Generate Insights about
Key Strategic Questions and Potential Changes to Consider

© CF Insights 2013 7
A Series of Shifts in Community Foundation Operating Models Will Occur
Over the Next Several Years
The
Institution
The
Community • Every service and product community foundations offer is
now available from other sources, or soon will be • Community foundations must move beyond the important
emphasis on operational efficiency of the last decade to a second order of change
Managing
Financial Assets Long-term
Leadership • Community foundations must begin to see their endowments as a means to service, not the end in itself
• Foundations can only differentiate themselves from other service providers through taking a visible leadership role in the community
• Success on the ground in communities and successful competition for donors will require a fundamental shift from a mindset of independent value to one of coordinated impact
• Just as foundations increasingly expect nonprofits to collaborate to solve social problems, foundations, too, must be willing to partner with others in the field
Competitive
Independence Coordinated
Impact
Source: “On the Brink of New Promise: The Future of U.S. Community Foundations” from Blueprint Research & Design and the Monitor Institute, Giving USA,
United Way of America, Fidelity Charitable Gift Fund

Established
Institution
• Older community
foundation, typically
located in large Northeast
or Midwest city
• High percent of assets in
endowed & discretionary/
field of interest funds
• Known and respected by
donors as area’s core
philanthropic institution
• Relatively high percent of
deceased and aging
donors
• Offers a wide array of
products, with emphasis
on building endowment
• Several supporting/
affiliate organizations
• Deeply rooted in
community, invests
discretionary resources in
leadership activities
• Serves as convener, key
stakeholder, and initiator
in leadership efforts
Change Catalyst
• Emphasizes a few key
products, but focuses
largest share of capacity
on initiatives and
leadership
• Seeks to create buy-in
and support by proactively
asking donors to learn
about and fund initiatives
• Manages products to
cover costs and develops
revenue streams
specifically to fund
leadership efforts (e.g.,
Civic Leadership Fund)
• Clearly articulated agenda
for community leadership
and initiatives
• Leads the way &
encourage donors, non-
profits, and other partners
to become engaged
Product/
Service
Emphasis
Defining
Factors
Leadership
Approach
Statewide/
Rural Regional
• Develops charitable
resources and addresses
multiple communities’
needs across the entire
state/region
• Serves a diverse donor
base – different
interests/needs, financial
capacities, community
affiliations
• Offers a wide array of
products, subsidizing
some because they are
the only entity offering
that product in the
region/state
• Involved in a range of
initiatives (often small
scale/grassroots) in
multiple communities
Donor-Focused
• Lean business model –
little room to subsidize
products or fund
leadership
• Assets & revenues almost
entirely in donor-driven
products, little to no
discretionary funds
• Emphasis on developing
and serving ultra high net
worth, savvy donors
• Strong relationships with
donor advisors
• Tiered service levels
• Heavily concentrated in
donor-advised, corporate
funds, & fee-for-service
• Deemphasize products
that do not cover costs
• Servant leadership -
support and inform donors
in their self-identified
leadership efforts
Donor
Relationships
We’ll Use Four Example Business Model Types to Illustrate the Variation
Across the Field and Discuss Some Key Trends

4.3% 1.9% 9.7%
12.9%
21.1%
2.3%
4.6%
30.5%
85.3%
34.1% 18.1%
33.4%
22.7%
19.9%
0.7% 1.1%
2.1%
9.8%
5.4% 1.4%
1.5% 6.5%
4.4% 5.7%
12.7%
26.8%
2.0%
17.1%
1.1%
0%
20%
40%
60%
80%
100%
EstablishedInstitution
Donor-Focused Change Catalyst Statewide/RuralRegional
Other
CommunityLeadership/Initiatives
Fee-for-Service
Supporting Organizations
Scholarships
Geographic Affiliates
Deferred Gifts
Discretionary/FOI
Donor Advised
Designated
Agency / NonprofitEndowment
The Asset Mix For Each Foundation Type Is Distinctly Different
% of Total Assets by Product

5.3% 1.3% 1.3% 6.6%
10.1%
4.4%
3.4%
25.7%
62.3%
15.0%
19.5%
24.6%
0.9%
15.8%
16.3%
6.9% 0.5%
2.4%
3.1%
8.2%
3.0% 6.6%
4.6%
9.0%
8.3% 2.7%
4.4%
7.0%
14.7%
3.0%
16.2%
6.6%
50.0%
18.1%
3.6% 8.8%
0%
20%
40%
60%
80%
100%
EstablishedInstitution
Donor-Focused Change Catalyst Statewide/RuralRegional
Other
CommunityLeadership/Initiatives
Fee-for-Service
Supporting Organizations
Scholarships
Geographic Affiliates
Deferred Gifts
Discretionary/FOI
Donor Advised
Designated
Agency / NonprofitEndowment
Capacity Dedicated to Products and Activities Reflects Differing Priorities
% of Total Costs by Product
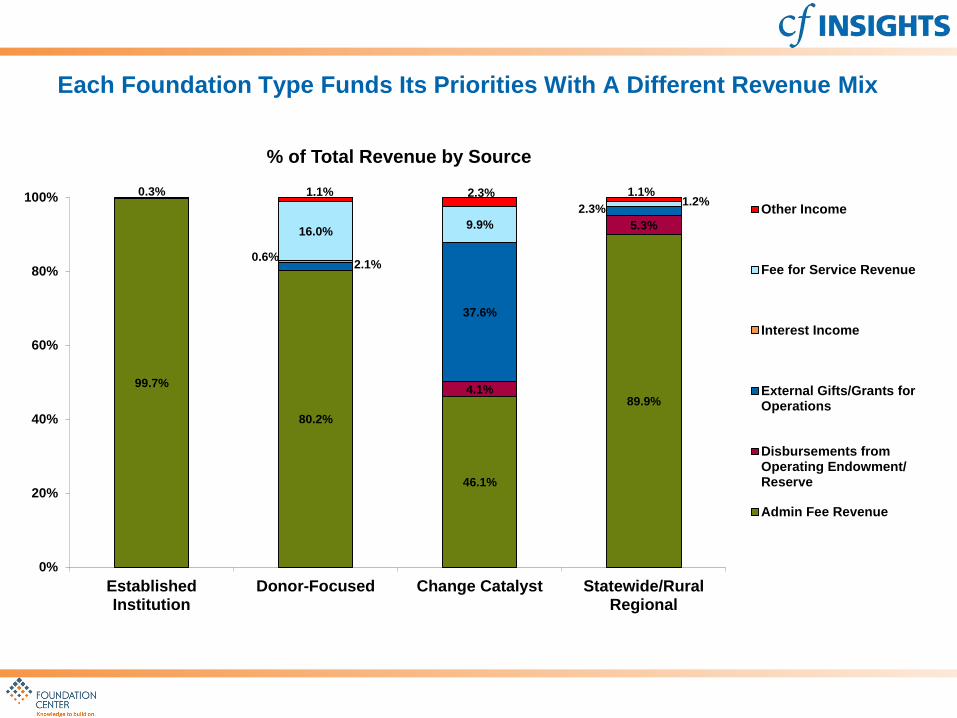
99.7%
80.2%
46.1%
89.9% 4.1%
5.3%
2.1%
37.6%
2.3%
0.6%
16.0% 9.9%
1.2% 0.3% 1.1% 2.3% 1.1%
0%
20%
40%
60%
80%
100%
EstablishedInstitution
Donor-Focused Change Catalyst Statewide/RuralRegional
Other Income
Fee for Service Revenue
Interest Income
External Gifts/Grants forOperations
Disbursements fromOperating Endowment/Reserve
Admin Fee Revenue
Each Foundation Type Funds Its Priorities With A Different Revenue Mix
% of Total Revenue by Source

Established Institution
Changing donor bases and expectations require new approaches to development and donor relations
Increased competition and challenges to endowed philanthropy threaten the traditional role of community
foundations
Shift from role as funder and convener to collaborator
Donor-Focused
Need to differentiate from commercial DAF providers
Lack of endowment or discretionary funds requires creativity and efficiency in managing funds
Make strategic decisions about where to invest
Change Catalyst
Grow sustainable funding source(s) for leadership and initiatives
Easy to become over-extended
Avoid straying too far from community foundation roots
Statewide/Rural Regional
Being “everything to everyone” is unsustainable
Working with lots of small donors and small communities with limited resources is time intensive
Can be challenging to align leadership priorities across multiple communities
With Each Foundation Type Comes A Unique Set of
Business Model Challenges and Considerations

There Are Many Tools Available to Help Community Foundations
Understand Their Business Model and Adapt to Meet Changing Needs
Let’s look at two that work well together . . .
Business Model Canvas Activity-Based Costing

The Canvas Helps a Foundation Visualize and Articulate
Each Component of Its Business Model

Through An Iterative Process, the Canvas Helps Create an Adaptive, Concise
Model That Reflects Current Conditions and Future Aspirations
https://canvanizer.com/new/business-model-canvas

16
Activity-Based Costing Enables a Foundation To Better Understand
the True Cost of Products and Services
• Activity-Based Costing (ABC) allows organizations to determine the fully-loaded cost associated with
each product or service
• Rather than considering volume alone (i.e., number of donor advised funds) ABC takes into account
non-volume related characteristics such allocations of administrative overhead
• First activities are identified and defined, then cost data is gathered and traced to activities, finally
costs are allocated to products or services based on their utilization of activities
Expense 1 Expense 3 Expense 4 Expense 2
Activity 1 Activity 2 Activity 3
Product 1 Product 2
Costs are
assigned
to activities…
…then allocated
based on utilization
of activities
© CF Insights 2014

17
100% of the Foundation’s Staff Time, Cost and Other Expenses Are
Assigned to a Matrix of Activities and Products
Cost Matrix Agency Designated Donor Advised FOI Scholarships Planned
Giving
Fee for
Service Initiatives Leadership …
Acquiring or
Establishing a
New Fund or
Gift
$Y $Y $Y $Y $Y $Y $Y $Y $Y $Y
Maintaining
Funds $Y $Y $Y $Y $Y $Y $Y $Y $Y $Y
Making
Grants $Y $Y $Y $Y $Y $Y $Y $Y $Y $Y
Providing
Non-Grant
Services to
the
Community
$Y $Y $Y $Y $Y $Y $Y $Y $Y $Y
Other Staff
Activities $Y $Y $Y $Y $Y $Y $Y $Y $Y $Y
Products Defined by Community Foundation
>1
00
A
cti
vit
ies
Staff costs are assigned to activities and products based on reported time, weighted by
individual salaries and including taxes and benefits
© CF Insights 2014

18
Once Staff Costs Have Been Assigned, Direct and Indirect Foundation
Costs Are Allocated Across the Matrix of Activities and Products
The complete matrix of products and activities includes
staff, direct and indirect costs for each activity and product
Staff
Activity
Survey
Product
1
Product
2
Product
3
Product
4
Product
5
Product
6
Product
7
Product
8
Activity A $Y $Y $Y $Y $Y $Y $Y $Y
Activity B $Y $Y $Y $Y $Y $Y $Y $Y
Activity C $Y $Y $Y $Y $Y $Y $Y $Y
Activity D $Y $Y $Y $Y $Y $Y $Y $Y
Activity E $Y $Y $Y $Y $Y $Y $Y $Y
Activity F $Y $Y $Y $Y $Y $Y $Y $Y
Activity G $Y $Y $Y $Y $Y $Y $Y $Y
Activity H $Y $Y $Y $Y $Y $Y $Y $Y
Activity I $Y $Y $Y $Y $Y $Y $Y $Y
Total $Y $Y $Y $Y $Y $Y $Y $Y
Allocate Indirect
Costs such as
occupancy and
office expenses to
activities and
products based on
the distribution of
staff time
Allocate Direct Costs
such as events,
publications, or
investment
management
consultants to
activities and
products based on
specific allocation
rules
© CF Insights 2014

19
The Analysis Includes an Assessment of the Overall Business Model
Example: Subsidy vs. Contribution by Product
$254K $209K
$91K $65K
$34K ($7)K ($22)K ($40)K ($43)K ($106)K ($588)K
Desig
na
ted
Unre
str
icte
d &
FO
I
DA
F -
End
ow
me
nt
Scho
lars
hip
s -
Bo
ard
Fee f
or
Se
rvic
e
Defe
rred
Veh
icle
s
Geo
gra
ph
ic A
ffili
ate
s
Org
an
ization
Fund
Ra
isin
g F
und
s
DA
F -
No
n E
nd
ow
ed
Com
mu
nity L
ead
ers
hip
Fee-Based Products Leadership Activities
Surplus Subsidy Investment
© CF Insights 2014

20
The Analysis Also Includes Product-Level Details the Community
Foundation Is Most Interested in Exploring
Example: A Closer Look at DAFs
© CF Insights 2014
$0K
$50K
$100K
$150K
$200K
$250K
$300K
$350K
$400K
1 2 3 4 5 6 7 8 9 10111213141516171819202122232425262728293031323334353637383940414243444546474849505152535455565758596061
Non-Permanent, Non-Invested Non-Permanent, Invested Permanent
DAFs managed by Foundation as of 12/31/2013
Ass
et
Size
($
k)
Dotted lines represent breakeven fund sizes
$140k
$79k
$64k
Average Fund Size: $42k $64k $142k

21
Comparisons to Appropriate Peers Provide Context
CF 1 CF 2 CF 3 CF 4 CF 5 CF 6
Total Revenue
Total Cost
Total CommunityLeadership Surplus orSubsidy
Tota
l Co
mm
un
ity
Lead
ersh
ip
Co
sts
and
Rev
enu
es
COMMUNITY LEADERSHIP COSTS AS % OF TOTAL ADMINISTRATIVE COSTS
42% 23% 30% 32% 15% 25%
Example: Community Leadership Revenues and Costs
© CF Insights 2014
SHARING KNOWLEDGE. GROWING IMPACT.
cfinsights.org
Aaron Schill, Director
(212) 807-2538
David Rosado, Member Services Manager
(212) 807-2430
The CF Insights Team